Airports The Government’s View Summary document
heathrow-airport-expansion-summary-document
heathrow-airport-expansion-summary-document

Create successful ePaper yourself
Turn your PDF publications into a flip-book with our unique Google optimized e-Paper software.
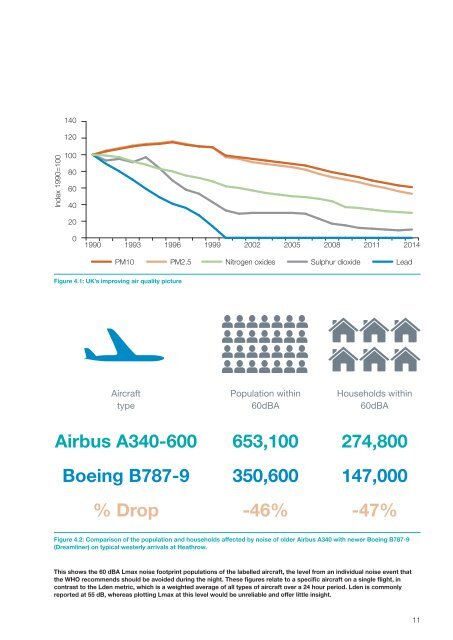
Index 1990=100<br />
140<br />
120<br />
100<br />
80<br />
60<br />
40<br />
20<br />
0<br />
1990 1993 1996 1999 2002 2005 2008 2011 2014<br />
PM10 PM2.5 Nitrogen oxides Sulphur dioxide Lead<br />
Figure 4.1: UK’s improving air quality picture<br />
Aircraft<br />
type<br />
Population within<br />
60dBA<br />
Households within<br />
60dBA<br />
Airbus A340-600<br />
Boeing B787-9<br />
% Drop<br />
653,100<br />
350,600<br />
-46%<br />
274,800<br />
147,000<br />
-47%<br />
Figure 4.2: Comparison of the population and households affected by noise of older Airbus A340 with newer Boeing B787-9<br />
(Dreamliner) on typical westerly arrivals at Heathrow.<br />
This shows the 60 dBA Lmax noise footprint populations of the labelled aircraft, the level from an individual noise event that<br />
the WHO recommends should be avoided during the night. <strong>The</strong>se figures relate to a specific aircraft on a single flight, in<br />
contrast to the Lden metric, which is a weighted average of all types of aircraft over a 24 hour period. Lden is commonly<br />
reported at 55 dB, whereas plotting Lmax at this level would be unreliable and offer little insight.<br />
11