

ON THE BUSES
TTF-On-The-Buses-Report-2016
TTF-On-The-Buses-Report-2016

Create successful ePaper yourself
Turn your PDF publications into a flip-book with our unique Google optimized e-Paper software.
The aim of the reforms was to reverse long-term<br />
trends of increasing costs and decreasing patronage.<br />
The franchising model adopted saw the ownership of<br />
buses and infrastructure remain with the state (along with<br />
route, fare and service controls), while private companies<br />
were responsible for the operation of services.<br />
This franchising program delivered substantial cost reductions<br />
while total service kilometres increased. One of the key<br />
gains was an improvement in staff productivity. The level of<br />
government subsidy per service kilometre reduced by 29<br />
per cent, from $3.58/km in 1992-93 to $2.55/km by 1998-99<br />
(Figure 4) demonstrating the significant saving franchising<br />
was able to achieve. This equated to savings of more than<br />
$30m per annum or more than 20% of the historical cost<br />
of bus services.<br />
Strong patronage growth and continued operational<br />
efficiencies over the last ten years have been driven in<br />
large part by a range of initiatives led by the private sector.<br />
These include:<br />
• Innovations in route planning and optimising<br />
frequency: This involved cutting some routes, introducing<br />
new routes and changing frequencies. This has resulted<br />
in improved asset utilisation and closer alignment of<br />
services to customer needs.<br />
• New depot management strategy: This involved the<br />
strategic placement of smaller depots closer to areas of<br />
operation. This has reduced dead running time and has<br />
also resulted in a more empowered and dynamic culture<br />
within each depot.<br />
Competition between operators has given the industry a<br />
renewed focus on high customer service levels. Customer<br />
satisfaction levels have been consistently higher under<br />
franchising than government operation.<br />
The Transperth model has remained largely unchanged in the<br />
last 15 years and is widely regarded as a success in franchising.<br />
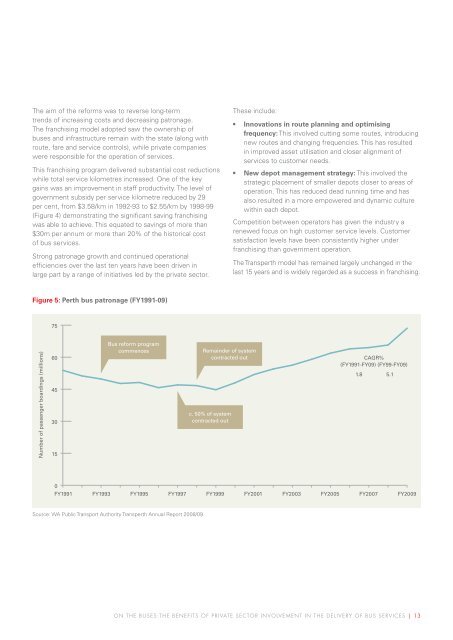
Figure 5: Perth bus patronage (FY1991-09)<br />
75<br />
Number of passenger boardings (millions)<br />
60<br />
45<br />
30<br />
15<br />
Bus reform program<br />
commences<br />
Remainder of system<br />
contracted out<br />
c. 50% of system<br />
contracted out<br />
CAGR%<br />
(FY1991-FY09) (FY99-FY09)<br />
1.8<br />
5.1<br />
0<br />
FY1991 FY1993 FY1995 FY1997 FY1999 FY2001 FY2003 FY2005 FY2007 FY2009<br />
Source: WA Public Transport Authority Transperth Annual Report 2008/09<br />
<strong>ON</strong> <strong>THE</strong> <strong>BUSES</strong>:<strong>THE</strong> BENEFITS OF PRIVATE SECTOR INVOLVEMENT IN <strong>THE</strong> DELIVERY OF BUS SERVICES | 13