

ON THE BUSES
TTF-On-The-Buses-Report-2016
TTF-On-The-Buses-Report-2016

You also want an ePaper? Increase the reach of your titles
YUMPU automatically turns print PDFs into web optimized ePapers that Google loves.
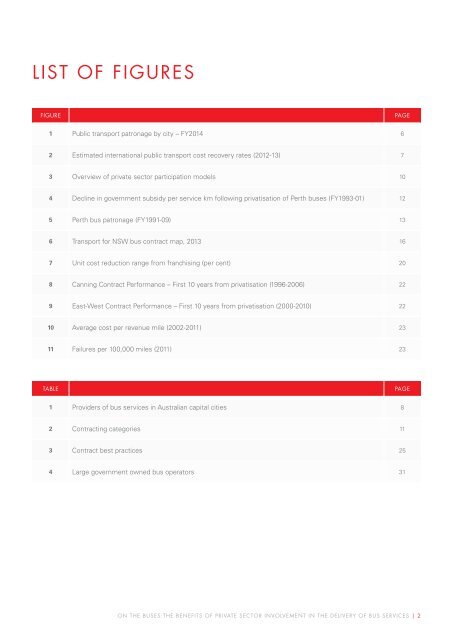
LIST OF FIGURES<br />
FIGURE<br />
PAGE<br />
1 Public transport patronage by city – FY2014 6<br />
2 Estimated international public transport cost recovery rates (2012-13) 7<br />
3 Overview of private sector participation models 10<br />
4 Decline in government subsidy per service km following privatisation of Perth buses (FY1993-01) 12<br />
5 Perth bus patronage (FY1991-09) 13<br />
6 Transport for NSW bus contract map, 2013 16<br />
7 Unit cost reduction range from franchising (per cent) 20<br />
8 Canning Contract Performance – First 10 years from privatisation (1996-2006) 22<br />
9 East-West Contract Performance – First 10 years from privatisation (2000-2010) 22<br />
10 Average cost per revenue mile (2002-2011) 23<br />
11 Failures per 100,000 miles (2011) 23<br />
TABLE<br />
PAGE<br />
1 Providers of bus services in Australian capital cities 8<br />
2 Contracting categories 11<br />
3 Contract best practices 25<br />
4 Large government owned bus operators 31<br />
<strong>ON</strong> <strong>THE</strong> <strong>BUSES</strong>:<strong>THE</strong> BENEFITS OF PRIVATE SECTOR INVOLVEMENT IN <strong>THE</strong> DELIVERY OF BUS SERVICES | 2