Nano Letters - Robinson Group
Nano Letters - Robinson Group
Nano Letters - Robinson Group

Create successful ePaper yourself
Turn your PDF publications into a flip-book with our unique Google optimized e-Paper software.
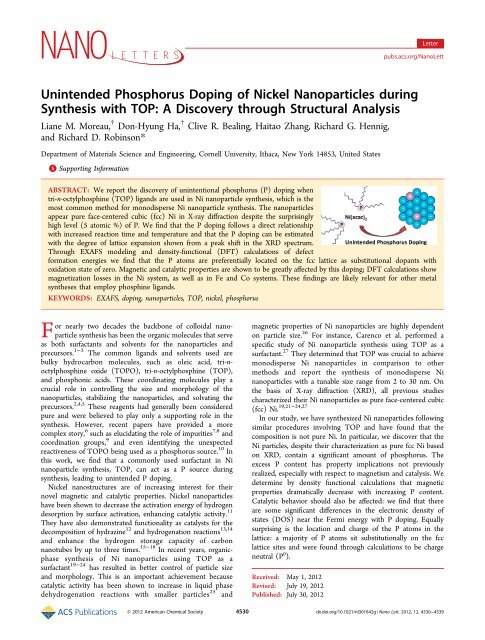
Unintended Phosphorus Doping of Nickel <strong>Nano</strong>particles during<br />
Synthesis with TOP: A Discovery through Structural Analysis<br />
Liane M. Moreau, † Don-Hyung Ha, † Clive R. Bealing, Haitao Zhang, Richard G. Hennig,<br />
and Richard D. <strong>Robinson</strong>*<br />
Department of Materials Science and Engineering, Cornell University, Ithaca, New York 14853, United States<br />
*S Supporting Information<br />
ABSTRACT: We report the discovery of unintentional phosphorus (P) doping when<br />
tri-n-octylphosphine (TOP) ligands are used in Ni nanoparticle synthesis, which is the<br />
most common method for monodisperse Ni nanoparticle synthesis. The nanoparticles<br />
appear pure face-centered cubic (fcc) Ni in X-ray diffraction despite the surprisingly<br />
high level (5 atomic %) of P. We find that the P doping follows a direct relationship<br />
with increased reaction time and temperature and that the P doping can be estimated<br />
with the degree of lattice expansion shown from a peak shift in the XRD spectrum.<br />
Through EXAFS modeling and density-functional (DFT) calculations of defect<br />
formation energies we find that the P atoms are preferentially located on the fcc lattice as substitutional dopants with<br />
oxidation state of zero. Magnetic and catalytic properties are shown to be greatly affected by this doping; DFT calculations show<br />
magnetization losses in the Ni system, as well as in Fe and Co systems. These findings are likely relevant for other metal<br />
syntheses that employ phosphine ligands.<br />
KEYWORDS: EXAFS, doping, nanoparticles, TOP, nickel, phosphorus<br />
For nearly two decades the backbone of colloidal nanoparticle<br />
synthesis has been the organic molecules that serve<br />
as both surfactants and solvents for the nanoparticles and<br />
precursors. 1−3 The common ligands and solvents used are<br />
bulky hydrocarbon molecules, such as oleic acid, tri-noctylphosphine<br />
oxide (TOPO), tri-n-octylphosphine (TOP),<br />
and phosphonic acids. These coordinating molecules play a<br />
crucial role in controlling the size and morphology of the<br />
nanoparticles, stabilizing the nanoparticles, and solvating the<br />
precursors. 2,4,5 These reagents had generally been considered<br />
pure and were believed to play only a supporting role in the<br />
synthesis. However, recent papers have provided a more<br />
complex story, 6 such as elucidating the role of impurities 7,8 and<br />
coordination groups, 9 and even identifying the unexpected<br />
reactiveness of TOPO being used as a phosphorus source. 10 In<br />
this work, we find that a commonly used surfactant in Ni<br />
nanoparticle synthesis, TOP, can act as a P source during<br />
synthesis, leading to unintended P doping.<br />
Nickel nanostructures are of increasing interest for their<br />
novel magnetic and catalytic properties. Nickel nanoparticles<br />
have been shown to decrease the activation energy of hydrogen<br />
desorption by surface activation, enhancing catalytic activity. 11<br />
They have also demonstrated functionality as catalysts for the<br />
decomposition of hydrazine 12 and hydrogenation reactions 13,14<br />
and enhance the hydrogen storage capacity of carbon<br />
nanotubes by up to three times. 15−18 In recent years, organicphase<br />
synthesis of Ni nanoparticles using TOP as a<br />
surfactant 19−24 has resulted in better control of particle size<br />
and morphology. This is an important achievement because<br />
catalytic activity has been shown to increase in liquid phase<br />
dehydrogenation reactions with smaller particles 25 and<br />
magnetic properties of Ni nanoparticles are highly dependent<br />
on particle size. 26 For instance, Carenco et al. performed a<br />
specific study of Ni nanoparticle synthesis using TOP as a<br />
surfactant. 27 They determined that TOP was crucial to achieve<br />
monodisperse Ni nanoparticles in comparison to other<br />
methods and report the synthesis of monodisperse Ni<br />
nanoparticles with a tunable size range from 2 to 30 nm. On<br />
the basis of X-ray diffraction (XRD), all previous studies<br />
characterized their Ni nanoparticles as pure face-centered cubic<br />
(fcc) Ni. 19,21−24,27<br />
In our study, we have synthesized Ni nanoparticles following<br />
similar procedures involving TOP and have found that the<br />
composition is not pure Ni. In particular, we discover that the<br />
Ni particles, despite their characterization as pure fcc Ni based<br />
on XRD, contain a significant amount of phosphorus. The<br />
excess P content has property implications not previously<br />
realized, especially with respect to magnetism and catalysis. We<br />
determine by density functional calculations that magnetic<br />
properties dramatically decrease with increasing P content.<br />
Catalytic behavior should also be affected: we find that there<br />
are some significant differences in the electronic density of<br />
states (DOS) near the Fermi energy with P doping. Equally<br />
surprising is the location and charge of the P atoms in the<br />
lattice: a majority of P atoms sit substitutionally on the fcc<br />
lattice sites and were found through calculations to be charge<br />
neutral (P 0 ).<br />
Received: May 1, 2012<br />
Revised: July 19, 2012<br />
Published: July 30, 2012<br />
Letter<br />
pubs.acs.org/<strong>Nano</strong>Lett<br />
© 2012 American Chemical Society 4530 dx.doi.org/10.1021/nl301642g | <strong>Nano</strong> Lett. 2012, 12, 4530−4539
<strong>Nano</strong> <strong>Letters</strong> Letter<br />
Although techniques that enable the structural characterization<br />
of bulk material have been well-developed, the<br />
dominance of surface facets, small size, and poor crystalline<br />
order makes characterization of nanoparticles difficult. X-ray<br />
absorption spectroscopy (XAS) is a powerful method to study<br />
local atomic arrangements and has been used to resolve the<br />
structure of colloidal nanocrystals. 28−35 With the use of high<br />
energy, white-light synchrotron radiation, sensitive XAS spectra<br />
can be obtained and used to gain insight into materials’<br />
structural properties. 36,37 Using both the lower-energy X-ray<br />
absorption near edge structure (XANES) portion of the<br />
spectrum to resolve electronic and geometric structure, and<br />
the higher-energy quasi-periodic EXAFS (extended X-ray<br />
absorption fine structure) modulations to resolve radial<br />
structure, the structure of both XRD-detectable and XRDamorphous<br />
materials can be determined in fine detail. 38<br />
XAS in combination with other characterization methods,<br />
such as XRD, density-functional theory (DFT), inductively<br />
coupled plasma (ICP), transmission electron microscopy<br />
(TEM), and superconducting quantum interference device<br />
(SQUID) measurements, allows for resolution of composition,<br />
structure, and property relationships in complex nanomaterials.<br />
EXAFS and XRD complement each other by providing insight<br />
into short-range and long-range order, respectively. DFT<br />
enables calculation of formation energies to determine<br />
lowest-energy compositional configurations and charge analysis<br />
for dopant atoms. 39,40 TEM provides morphological and sizedistribution<br />
insight, ICP provides the atomic composition, and<br />
SQUID enables the study of magnetic properties. Thus a<br />
complete picture of the nanoparticle structural properties can<br />
be obtained through cooperative use of these methods.<br />
In this investigation, we (1) report a surprisingly high<br />
amount of P present in the fcc Ni nanoparticles that results<br />
from routine synthesis and show that the P doping in the fcc Ni<br />
nanoparticles increases as a function of reaction time and<br />
temperature, (2) present the structural attributes (interatomic<br />
distances, distortion, coordination, and composition) of the Ni<br />
nanoparticles resulting from the P atom doping, (3)<br />
demonstrate the feasibility of significant phosphorus stability<br />
within an fcc Ni lattice without significant lattice distortion, (4)<br />
reveal the effects of excess P content on the magnetic and<br />
catalytic properties, and the stability of both amorphous and<br />
crystalline phases that comprise transition metal nanoparticles,<br />
(5) compare the long-range structural characterization by XRD<br />
with the radial structure information obtained from EXAFS<br />
analysis, and (6) propose a method to determine the P content<br />
of the nanoparticles based as a function of XRD peak position.<br />
Because of the intimate connection between nanoscale<br />
structural attributes and their resulting properties, control<br />
over nanoparticle structure and doping will enable the tailoring<br />
of their properties for magnetic and catalytic applications.<br />
We briefly describe the synthesis conditions for the<br />
nanoparticles. Complete descriptions of all characterization<br />
and analysis methods can be found in the Supporting<br />
Information. Synthesis of the Ni nanoparticle samples was<br />
based on thermal decomposition of a Ni-TOP complex as<br />
outlined by Muthuswamy et al. 21 Under air-free conditions,<br />
1.17 g (4 mmol) of nickel acetylacetonate (Ni(acac) 2) and 4.48<br />
mmol of TOP were mixed into a flask containing 10 mL of<br />
octyl ether (solvent) and 4 mL of oleylamine (surfactant). The<br />
solution was heated to 230 °C and the particles were allowed to<br />
grow for 1 h. After the reaction, the nanoparticle products were<br />
isolated by centrifugation with excess ethanol.<br />
4531<br />
Our Ni nanoparticle recipe falls within the range of<br />
conditions previously reported for pure-phase Ni. 19,21,23,27<br />
Methods from the literature for the synthesis of Ni nanoparticles<br />
using this same synthetic method use TOP/Ni(acac) 2<br />
ratios from 0.8 to 3, temperatures ranging from 200 to 240 °C,<br />
and oleylamine/Ni(acac) 2 ratios from 3 to 10. 19,21,23,27 Thus,<br />
our results in which we find surprisingly high P concentrations<br />
in the Ni nanoparticles should be applicable to these previous<br />
works.<br />
TEM images show that the Ni particles are monodisperse,<br />
which is in agreement with previous studies that use TOP as a<br />
surfactant (Figure 1a). 27 The Ni nanoparticles (22.2 nm, std.<br />
dev. 8.9%) have a quasi-spherical morphology. High-resolution<br />
TEM (HRTEM) results of these particles show them to be<br />
polycrystalline (Figure 1b) and XRD results show that each of<br />
the Ni nanoparticle peaks matches well with the fcc Ni<br />
structure (Figure 1c). The slight contrast on the surface of the<br />
nanoparticle sample in Figure 1b is likely due to surface<br />
oxidation during the oxygen plasma cleaning procedure (see<br />
Supporting Information for method). Prior to plasma cleaning,<br />
the nanoparticles have no contributions from nickel phosphide<br />
or nickel oxide detected by XRD. From the Scherrer equation,<br />
the grain size in these Ni particles is about 5.5 nm, indicating<br />
that the Ni particles are polycrystalline, each consisting of<br />
several grains, which is consistent with our HRTEM images.<br />
The Ni nanoparticle sample and Ni foil XAS spectra (Figure<br />
2a) share similar features especially within the lower energy<br />
XANES region, and therefore exhibit similar electronic<br />
structure. The K-edge in both samples is 8334 eV, a value<br />
associated with the 1s−3d atomic line. 41,42 Although the spectra<br />
for the Ni nanoparticles and the Ni foil show similar features<br />
throughout the near-edge and EXAFS regime, there is a<br />
noticeable reduction in the Ni nanoparticle sample’s EXAFS<br />
oscillation amplitude. Also, the Ni nanoparticle spectrum<br />
features a white line peak and EXAFS oscillations that are<br />
broadened compared to the sharp features in the Ni foil<br />
spectrum.<br />
The shape and phase of both the k-space and R-space XAS<br />
spectra are very similar for the Ni nanoparticles and Ni foil<br />
(Figure 2b,c). Both samples show significant contributions<br />
beyond the first coordination shell, observable in the R-space<br />
spectrum (Figure 2c). This display of long-range order is<br />
characteristic of a crystalline structure. 36 The spectral intensity<br />
amplitudes of the Ni nanoparticles, however, are considerably<br />
reduced compared to bulk. There is a known amplitude<br />
reduction associated with nanoscale effects. 43,44 Theory predicts<br />
an intensity reduction of about 8% due to nanoscale effects for<br />
our 5.5 nm grains. 45 Experimental reports in related material<br />
systems have seen intensity reductions as large as 25% in kspace<br />
and 20% in R-space for 6 nm NiO nanocrystals. 43 Our<br />
crystal domains at 5.5 nm should show comparable intensity<br />
reductions to these works but we find much larger reductions of<br />
∼41% in both k- and R-space.<br />
The amplitude reduction can be explained by P content. In<br />
bulk Ni a reduction in k- and R-space intensity was previously<br />
observed when P was introduced into the lattice. 41 With 8<br />
atomic % P, the reduction was about 20%, and at 10 atomic % P<br />
the reduction increased to 47%. 41 In both cases, the lattice<br />
retained the fcc structure despite this high level of P content. It<br />
is likely that the intensity reductions in our nanoparticle system<br />
result from a combination of nanoscale effects and P doping<br />
(discussed below).<br />
dx.doi.org/10.1021/nl301642g | <strong>Nano</strong> Lett. 2012, 12, 4530−4539
<strong>Nano</strong> <strong>Letters</strong> Letter<br />
Figure 1. TEM images and XRD spectrum of Ni nanoparticles. (a)<br />
TEM images show monodisperse Ni nanoparticles with quasi-spherical<br />
morphology. (b) HRTEM image reveals that the Ni nanoparticles are<br />
polycrystalline and that they are not core−shell structures. The white<br />
lines in the particle present nickel (201) lattice planes indicating<br />
multigrains within the nanoparticle. (c) XRD spectrum shows<br />
crystalline fcc Ni (red bars correspond to JCPDS 65-2865.).<br />
Through the EXAFS fitting process we found that it was<br />
impossible to resolve the Ni sample with a model that included<br />
only a pure, well-ordered fcc Ni crystal structure (see<br />
Supporting Information Figure S2a). Degeneracy values reveal<br />
that pure fcc Ni alone does not provide an accurate model,<br />
despite XRD results, which suggest a pure-phase fcc structure.<br />
Using only fcc pathways in the fitting model for the first shell<br />
the degeneracy of the model is only 74% that of bulk, meaning<br />
that 26% of the Ni−Ni pathway degeneracies are missing (see<br />
Supporting Information Table S1). This degeneracy reduction<br />
is unphysical for fcc Ni and cannot be ascribed to nanosize<br />
effects: using the method proposed by Calvin et al. to estimate<br />
4532<br />
Figure 2. Ni nanoparticles XAS data and EXAFS fitting model. (a)<br />
The spectra of the Ni foil (red) and Ni nanoparticles (blue) are shown.<br />
Observable broadening is noticeable in the Ni nanoparticle spectrum.<br />
(b) Plots of the Ni foil and nanoparticle sample spectra in k-space. The<br />
shapes of the curves are similar but there is a reduction in amplitude<br />
between the Ni foil and Ni nanoparticle sample. (c) Nonphase shifted<br />
R-space spectra. A high degree of crystallinity is noticeable in the Ni<br />
foil and Ni nanoparticle samples, despite significant reduction in the<br />
Ni nanoparticle sample peak heights. (d) The theoretical fitting model<br />
using fcc Ni and substitutional P is shown in R-space and k-space<br />
(inset). The fitting results (green) are well-matched to the<br />
experimental spectra (blue).<br />
reduction in coordination number due to nanoscale effects, the<br />
degeneracy value in our 5.5 nm crystal domains should be 92%<br />
of the accepted bulk degeneracy value. 45 Thus the 74%<br />
obtained using pure fcc Ni is far too low of a contribution to be<br />
accounted for by nanoscale effects, even when the typical 10%<br />
error in the coordination numbers determined by the fitting is<br />
considered. 29,46,47 Additional structural contributions must<br />
therefore exist.<br />
Surface oxidation also does not account for the missing<br />
structural contributions. In our previous studies of the Co−P<br />
nanoparticle system, additional contributions to the ε-Co<br />
structure were attributed to surface oxidation. 48 However, using<br />
a combination of Ni fcc and NiO pathways, the fit was also<br />
poor (Supporting Information Figure S2b). Much larger<br />
degeneracy values were obtained for the second shell than for<br />
the first shell for all permutations of the model fit (Supporting<br />
Information Table S2), which is unreasonable since the<br />
degeneracy values should remain constant or decrease for<br />
higher order shells. 43<br />
A reasonable model was found using a combination of fcc Ni<br />
and Ni 2P pathways (see Supporting Information Figure S3,<br />
Table S3). Using this combination the fcc pathways became<br />
well-ordered, but there was extreme distortion observed in the<br />
Ni 2P fitting and atomic positions, particularly for higher shells<br />
of Ni 2P. This suggests that the positions of the P atoms do not<br />
correspond closely to those in the Ni 2P structure. We examined<br />
the radial distances (see Supporting Information Table S4) and<br />
realized that a majority (63%) of the Ni−P pathways was within<br />
a distance of 3.6% from substitutional fcc positions, and a<br />
smaller percentage (17%) corresponded to octahedral interstitial<br />
site distances. Using this knowledge we proposed that the<br />
P atoms were located primarily on substitutional sites and<br />
created a new EXAFS model based on this assumption.<br />
dx.doi.org/10.1021/nl301642g | <strong>Nano</strong> Lett. 2012, 12, 4530−4539
<strong>Nano</strong> <strong>Letters</strong> Letter<br />
To achieve the best-fit model for the Ni nanoparticle sample<br />
we used single and multiple scattering pathways from a<br />
combination of fcc Ni and an artificially created fcc lattice built<br />
with three Ni atoms and one P atom substituted on the fourth<br />
Ni fcc site (e.g., fcc Ni 3P, see Figure 3 and Supporting<br />
Figure 3. Deviation of interatomic distance from reference Ni<br />
pathways. Red bars correspond to well-ordered Ni−Ni pathways<br />
from the fcc Ni phase, blue bars correspond to Ni−Ni pathways in the<br />
Ni 3P fcc model, and green bars correspond to Ni−P pathways in the<br />
Ni 3P fcc model. Deviations in interatomic distance between the fitting<br />
model and bulk are given for the first two shells, expressed as a<br />
percentage of shell distance. Note the large deviations associated with<br />
the Ni and P positions in the Ni 3P model. Atomic structures at right<br />
show the EXAFS models used for the fitting. At top is the fcc Ni<br />
lattice, and on the bottom is the artificial Ni 3P fcc model used to<br />
account for P doping and Ni positional distortions, based on fcc Ni<br />
with substitutional P atoms.<br />
Information Figure S4). The fcc Ni 3P contributions simulate<br />
the P substitution within the Ni fcc lattice and also enable<br />
distortion of the Ni atoms surrounding the substitutional P.<br />
Thus, the additional degeneracies for the Ni−Ni pathways are<br />
accounted for by pathways that are distorted from their Ni fcc<br />
positions. These two factors, additional Ni−P pathways and<br />
allowing neighboring Ni positions to distort, improved the<br />
goodness of the fit to acceptable levels compared to the poor fit<br />
from using only a pure-phase fcc Ni model. The substitutional<br />
P and particularly the neighboring Ni−Ni pathways deviated<br />
from ideal positions with large differences in interatomic<br />
distance (exceeding 5% of the average interatomic distance, as<br />
shown in Figure 3). The large deviations from ideal positions<br />
and the decreased degeneracy of these pathways (see Table 1)<br />
indicate that the substitutional P contribution present within<br />
Table 1. First and Second Shell Path Parameters a<br />
the crystalline fcc Ni lattice distorts the surrounding atoms in<br />
the lattice, creating somewhat disordered pathways within the<br />
well-ordered fcc structure.<br />
The fcc Ni + substitutional P model has a high quality fit<br />
(low R-factor) to the experimental data in both R-space (Figure<br />
2d) and k-space (Figure 2d, inset). Table 1 contains the<br />
parameters used to construct the fitting model for the Ni<br />
nanoparticles. The parameters included in the table are the<br />
reference degeneracy value found in bulk structure (N theory) 49<br />
(the number of atoms located at a specified distance from the<br />
central scattering atom), the degeneracy value determined by<br />
the fit to the experimental spectra (N exp), the reference<br />
interatomic distance from the scattering atom found in bulk<br />
(R), 49 the nanoparticle deviation from the bulk reference<br />
interatomic distance resulting from the fit (ΔR), the energy<br />
shift parameter (E 0), which was fixed for pathways consisting of<br />
the same absorbing and scattering atom, and the mean-squared<br />
disorder (σ 2 ). A reasonable estimate of the error associated with<br />
the degeneracy and mean-squared disorder values (N exp and σ 2 )<br />
is 10% 29,46,47 and an estimate of error for ΔR and E 0 is 5%. 47<br />
Additional higher-order shell pathway parameters are included<br />
in Supporting Information Table S5.<br />
We can use the fcc Ni + substitutional P model to estimate<br />
the amount of P in the nanoparticles by examining the<br />
degeneracy of the pathways. The P content is determined by<br />
summing the degeneracy values (i.e., N exp) for the Ni−P<br />
pathways and dividing by the sum of the degeneracies for all<br />
pathways (see Supporting Information for methods). This same<br />
method is used to determine the number of Ni atoms in<br />
ordered and disordered fcc positions. The first three columns of<br />
Table 2 show the estimated percentages of each type of<br />
Table 2. Summary of Ni and P Content from EXAFS<br />
Modeling and ICP a<br />
% atoms Ni fcc,<br />
ordered<br />
% atoms Ni fcc,<br />
distorted<br />
% atoms P<br />
(substitutional)<br />
pathway Ntheory Nexp ordered Ni−Ni pathways from fcc<br />
R (Å) ΔR (Å) E0 (eV) σ2 (Å2 ) × 10 ‑3<br />
Ni−Ni (shell 1) 12 9.49 2.49 −0.003 6.26 7.73<br />
Ni−Ni (shell 2) 6 4.72 3.52 −0.008 6.26 12.0<br />
pathway Ntheory Nexp Ni−Ni pathways (Ni3P fcc model)<br />
R (Å) ΔR (Å) E0 (eV) σ2 (Å2 ) × 10 ‑3<br />
Ni−Ni (shell 1) 8 1.68 2.49 0.277 6.26 13.8<br />
Ni−Ni (shell 2) 6 1.25 3.52<br />
Ni−P pathways (Ni3P fcc model)<br />
−0.280 6.26 14.0<br />
pathway Ntheory Nexp R (Å) ΔR (Å) E0 (eV) σ2 (Å2 ) × 10 ‑3<br />
Ni−P (shell 1) 4 0.83 2.49 −0.194 −8.70 8.95<br />
Ni−P(shell 2) 8 1.65 4.32 0.094 −8.70 9.13<br />
% atoms P from<br />
ICP results<br />
79.2% 15.5% 5.3% 6.4%<br />
a The first two columns show the % contribution of the Ni atoms in<br />
both ordered and distorted positions with respect to the fcc Ni lattice.<br />
In the third column is the phosphorus atomic percentage calculated<br />
from EXAFS modeling. The P is located on substitutional fcc sites.<br />
The final column lists the average phosphorus content determined<br />
from ICP results.<br />
a Parameters are listed for fcc Ni and for the artificial Ni3P fcc model used to construct the best-fit EXAFS model for the Ni nanoparticle sample.<br />
4533<br />
dx.doi.org/10.1021/nl301642g | <strong>Nano</strong> Lett. 2012, 12, 4530−4539
<strong>Nano</strong> <strong>Letters</strong> Letter<br />
contribution (Ni in ordered fcc positions, Ni in distorted fcc<br />
positions surrounding the substitutional P atoms, and P from<br />
substitution on fcc sites). The estimated P percentage in the<br />
structure from the model fit, based on the number of<br />
phosphorus atoms in the 5.57 Å radial shell, is 5.3%. This is<br />
a large amount of P and an unexpected result considering that<br />
XRD only shows the fcc phase and no detectable phosphide<br />
compounds. Furthermore, the result is important considering<br />
that many groups have used this synthetic method for their Ni<br />
nanoparticles, which they assume to be pure fcc Ni. In a similar<br />
finding in bulk materials, retention of the Ni fcc lattice has been<br />
observed in bulk Ni−P alloys with atomic percentage of P up to<br />
14%. 41 In these bulk Ni−P samples the Ni fcc lattice was<br />
maintained with good crystallinity despite the high phosphorus<br />
content. 41 This suggests that such phosphorus incorporation on<br />
substitutional sites may also be possible at the nanoscale.<br />
To confirm that the P contribution is not from TOP surface<br />
ligands, ICP-OES (inductively coupled plasma-optical emission<br />
spectrometry) was performed on Ni nanoparticles for Ni, P,<br />
and C contents. The atomic percentages in the sample were<br />
found to be 83.3, 5.0, and 11.7% for Ni, P, and C, respectively<br />
(Table 3). If we consider that all the detected carbon atoms are<br />
Table 3. The Elemental Composition of Ni <strong>Nano</strong>particles<br />
Synthesized through Standard Techniques Based on ICP<br />
Measurements a<br />
element Ni P C<br />
atomic % 83.3 5.0 11.7<br />
a<br />
From these results, the carbon content is an order of magnitude too<br />
small in comparison to the phosphorus atomic % for the phosphorus<br />
to be a result of TOP surface ligand contributions.<br />
from TOP, which has 24 C atoms and 1 P atom in its molecule,<br />
then the C/P ratio should be 24:1. But the C/P ratio from our<br />
ICP is nearly an order of magnitude smaller than what would<br />
be expected from the TOP ligand molecules. This confirms that<br />
most of the P atoms are contained within the Ni nanoparticles<br />
and not located on the surface in the form of TOP molecules.<br />
This high P content is repeatable across multiple syntheses.<br />
Results from ICP analysis on eight Ni samples from identical<br />
synthesis conditions results in an average of 6.4 atomic % P in<br />
the Ni nanoparticles (Table 2, column 4) with a standard<br />
deviation of 1.9 atomic % P.<br />
We also calculate the surface coverage by TOP ligands of our<br />
Ni nanoparticles. Using the carbon content as a guide we find<br />
that only 12% of the surface Ni atoms are connected with TOP<br />
molecules. A comparable surface ligand coverage has been<br />
previously observed, 50 and nanoparticle phosphine ligand<br />
coverage has been shown to decrease with increasing particle<br />
size, 51 which is relevant to our larger nanoparticles. The low<br />
TOP coverage explains the slow precipitation behavior of the<br />
Ni nanoparticles in a nonpolar solvent such as hexane.<br />
As another test to prove that the P contribution is not from<br />
surface TOP surfactant, a ligand exchange was performed on<br />
the Ni nanoparticles, exchanging the existing ligands for oleic<br />
acid (see Supporting Information for methods). ICP analysis<br />
was then performed on both the as-prepared (with TOP<br />
surfactant) nanoparticles and the nanoparticles after ligand<br />
exchange. Results of P content between the two samples<br />
showed negligible changes (5.0 atomic % P before ligand<br />
exchange versus 5.2 atomic % P after ligand exchange)<br />
confirming that the P content measured by ICP is not<br />
dominated by surface phosphine.<br />
To further investigate the synthetic conditions for P<br />
inclusion, the effects of reaction temperature and time on the<br />
P content of the Ni nanoparticles were studied. Plotting P<br />
content for reactions at 210, 220, and 230 °C, with samples<br />
taken at 20, 40, and 60 min, shows a consistent increase in P<br />
content within the nanoparticles as a function of reaction<br />
temperature and time (Figure 4a). This result further confirms<br />
that the P content is incorporated into the nanocrystal and not<br />
merely on the surface. Additionally, the wide variance of P<br />
content in the 230 °C samples (open red symbols in Figure 4a)<br />
demonstrates that P incorporation at higher reaction temperatures<br />
is sensitive to minor changes in synthetic conditions.<br />
TEM images of the nanoparticles synthesized with varied<br />
conditions are included in the Supporting Information (Figure<br />
S5).<br />
A trend of lattice expansion due to the P doping is clearly<br />
shown in Figure 4b. The (111) 2-θ peak from reference<br />
(JCPDS 65-2865) is 44.5°. The P doped nanoparticle samples<br />
show XRD peaks shifted toward lower angles. The black line in<br />
Figure 4b is linearly fitted with the results from P doped Ni<br />
nanoparticles and the Ni reference (Y = −0.0535X + 44.522, R 2<br />
= 0.7445). From this equation, it is possible to roughly predict<br />
the P content of Ni nanoparticles from an XRD pattern. The dspacing<br />
is also calculated based on the peak position (Figure<br />
Figure 4. Implications of synthetic parameters on Ni nanoparticle P atomic % and corresponding XRD peak shifts. (a) Correlations between reaction<br />
temperature and time. The black, blue, and red solid symbols represent the P atomic % of samples synthesized at 210, 220, and 230 °C, respectively,<br />
for different reaction times. All of the open symbols exhibit P atomic % from the samples synthesized at 230 °C for 60 min. (b) The correlation<br />
between the P atomic % and the (111) peak position of Ni nanoparticle samples and the Ni reference. The green open square represents the (111)<br />
2-θ peak position (44.5°) of Ni reference (JCPDS 65-2865). The red open circles represent the (111) 2-θ peak positions of the samples which show<br />
P contents. The d-spacing of (111) plane is also calculated based on the peak positions, showing the lattice expansion due to P doping.<br />
4534<br />
dx.doi.org/10.1021/nl301642g | <strong>Nano</strong> Lett. 2012, 12, 4530−4539
<strong>Nano</strong> <strong>Letters</strong> Letter<br />
4b). At a P content of ∼10 atomic %, there is a ∼1% expanded<br />
lattice constant.<br />
Figure 3 shows the deviations in atomic position as a<br />
percentage of the reference crystalline atomic positions (ΔR%)<br />
for the first and second shell atoms. The atoms are categorized<br />
by the following structural contributions: (1) Ni−Ni from fcc<br />
Ni, (2) Ni−P from substitutional P on fcc sites, and (3) Ni−Ni<br />
from Ni on fcc sites which are allowed to distort, representing<br />
the Ni atoms which surround the substitutional P. For our Ni<br />
nanoparticle samples the majority (79.2%) of the fcc Ni<br />
pathways deviate minimally from the bulk interatomic<br />
distances, with ΔR/R < 0.25%. These deviations are similar<br />
in magnitude to the Ni foil deviations (compare red bars in<br />
Figure 3, Ni foil versus Ni nanoparticles). This means that the<br />
majority of Ni atoms are located on the fcc lattice. As a result,<br />
the bulk-like fcc Ni contributions within the Ni nanoparticle<br />
sample are detectable by XRD. A smaller portion of the Ni−Ni<br />
pathways within the nanoparticles (blue bars in Figure 3), have<br />
large ΔR values, representing Ni atoms that deviate from their<br />
fcc positions, likely as a result of nearby substitutional P. These<br />
Ni−Ni contributions are described by the fcc Ni 3P component<br />
of the model. The Ni−P pathways resulting from P substitution<br />
on the fcc lattice (green bars in Figure 3) also show deviations<br />
from ideal fcc positions, yet they are smaller than the deviations<br />
of the distorted Ni−Ni pathways. The P atoms may not be<br />
sitting in ideal fcc sites because (1) a small number of the P<br />
atoms may be positioned in octahedral sites, as suggested by<br />
our Ni/Ni 2P EXAFS model (see Supporting Information), (2)<br />
the P atoms may be positioned slightly off the fcc lattice sites,<br />
or (3) the P atoms may take the form of dimers within the<br />
structure, as suggested by our density-functional calculations<br />
(vide infra). All aforementioned phenomena would cause the<br />
interatomic distances to deviate slightly from the value of the<br />
ideal fcc Ni phase. The possibility of the P atoms sitting in grain<br />
boundaries within the nanoparticles was considered. This is<br />
unlikely because the grain boundaries effectively act as a surface<br />
at which the degeneracy values of higher order shells is known<br />
to be significantly diminished due to the surface termination<br />
effect 43,45 and we do not observe this effect in our EXAFS<br />
model. Comparing the average mean-squared disorder values<br />
(Table 1, Supporting Information Figure S6), we see that the<br />
disorder is larger for the nanoparticles than for bulk (foil),<br />
meaning that the nanoparticle pathways have a higher degree of<br />
structural disorder. In addition, the distorted Ni−Ni pathways<br />
show larger values than the ordered Ni−Ni pathways, revealing<br />
that these pathways not only show greater distance deviation,<br />
but also are distributed in a less-uniform manner.<br />
The unusually high P content in the Ni nanoparticles (6.4<br />
atomic % by ICP (average), 5.3 atomic % by EXAFS) raises the<br />
question about the oxidation state of the P and the feasibility of<br />
P substitution at such high concentrations with relative<br />
retention of the structural integrity of the fcc lattice. DFT<br />
calculations including spin-polarization (see Supporting Information<br />
for computational details) of the charge density and<br />
Bader analysis 52 for an fcc Ni supercell containing a single<br />
substituted P atom (Ni 107P) show only a small amount of<br />
charge transfer of less than 0.25e between the P and the Ni<br />
atoms. A small Bader charge transfer of 0.25 electrons between<br />
P and Ni indicates that the bonding is mostly covalent in nature<br />
with some ionic character, which is consistent with the<br />
electronegativity values of P and Ni (see Supporting<br />
Information). This suggests that the P has an oxidation state<br />
of zero within the fcc Ni phase. This is confirmed by our XAS<br />
4535<br />
results, which reveal little deviation from fcc Ni in the near edge<br />
region (XANES), showing that the Ni atoms (and therefore P<br />
atoms, due to charge-neutrality) have an oxidation number of<br />
zero.<br />
The positions of the P atoms in the Ni lattice were also<br />
compared between the relaxed structures from the DFT<br />
calculations and our EXAFS models. Through EXAFS<br />
modeling, it was found that P atoms sit primarily on<br />
substitutional sites. DFT defect formation energies were<br />
calculated to determine the energetics of various possible<br />
positions of phosphorus atoms in fcc Ni. The formation energy<br />
for a P atom to sit substitutionally on an fcc lattice site is 0.8 eV<br />
(see Table 4). The formation energy for the interstitial sites is<br />
Table 4. Formation Energy Calculation Results a<br />
TM supercell E f (eV)<br />
Ni Ni 108P (o) 2.7<br />
Ni 108P (t) 3.9<br />
Ni 107P (s) 0.8<br />
Co Co 96P (o) 3.3<br />
Co 96P (t) 3.5<br />
Co 95P (s) 0.7<br />
Fe Fe 128P (o) 3.4<br />
Fe 128P (t) 3.4<br />
Fe 127P (s) 0.4<br />
a Calculated formation energies for octahedral (o), tetrahedral (t), and<br />
substitutional (s) P for Ni, Co, and Fe.<br />
higher. It is 2.7 eV for the octahedral site and 3.9 eV for the<br />
tetrahedral site. On the basis of the formation energies, it is not<br />
surprising that the majority of the P atoms are found by the<br />
EXAFS analysis in both the fcc Ni + Ni 2P and the fcc Ni +<br />
substitutional P models, to be located on substitutional sites.<br />
However, the results of the fcc Ni + Ni 2P EXAFS modeling<br />
suggesting that ∼17% of the Ni−P pathways correspond to<br />
octahedral position radial distances is somewhat unexpected.<br />
Together, the EXAFS analysis and the DFT defect formation<br />
energies show that the majority of the P atoms are positioned<br />
on fcc lattice sites.<br />
The analysis of the P location in Ni was extended to several<br />
other important transition metal (TM) systems. Table 4 shows<br />
the formation energies for the P-doped ferromagnetic transition<br />
metals (TMs, TM = Ni, Co, Fe), where P is present at<br />
tetrahedral or octahedral interstitial lattice positions or<br />
substituted for a TM atom. Total energies were calculated<br />
using (spin-polarized) DFT. Formation energies, E f, were<br />
calculated as E f =[E[TM nP m] − (nμ TM + mμ P)/m], where<br />
E[TM nP m] denotes the total energy of the cell containing n TM<br />
atoms and m P atoms, and μ TM and μ P denote the chemical<br />
potentials of TM and P, respectively. μ TM was taken as the total<br />
energy per atom of TM in the appropriate crystal structure (i.e.,<br />
fcc, hcp, bcc, for TM = Ni, Co and Fe, respectively), and μ P was<br />
calculated as μ P =(E[TM 3P] − (24 μ TM))/8, where E[TM 3P]<br />
is the total energy of the TM 3P phase, calculated for a unit cell<br />
containing 24 TM ions and 8 P ions. Even when considering<br />
that the diffusion of a P atom as a substitutional impurity into a<br />
transition metal nanoparticle will require the formation of a<br />
vacancy and comparing the combined formation energy of a<br />
TM vacancy and a P atom substituted for a TM atom,<br />
substitutional rather than interstitial doping is significantly<br />
favored in all three TMs. Similarly, ε-phase Co has been found<br />
dx.doi.org/10.1021/nl301642g | <strong>Nano</strong> Lett. 2012, 12, 4530−4539
<strong>Nano</strong> <strong>Letters</strong> Letter<br />
Figure 5. DFT calculations for phosphorus doping in transition metals (TMs): magnetization, formation energies, and diffraction patterns. (a)<br />
Magnetization M per TM atom for the TMs Ni (filled black circles), Co (red squares), and Fe (blue diamonds), substitutionally doped with P. The<br />
green triangles give the magnetization for P-doped fcc Fe. Magnetizations for the Co 3P and Fe 3P crystal structures are indicated by the red and blue<br />
stars, respectively. Empty black circles give the magnetization for Ni containing substitutional P dimers. (b) Formation energies E f for P-doped Ni<br />
(filled black circles), Co (red squares), and Fe (blue diamonds). Empty black circles give the formation energy for Ni containing substitutional P<br />
dimers. Formation of P dimers in Ni was found to be energetically slightly favorable with respect to evenly distributed P. (c) Calculated XRD<br />
patterns for pure and P-doped Ni.<br />
experimentally to favor substitutional rather than interstitial Pdoping.<br />
48<br />
Figure 5b shows the formation energies calculated for Pdoped<br />
TM at concentrations of 6.25, 12.5, and 25 atomic %. At<br />
6.25 atomic % P, the formation energies for the P-doped TMs<br />
are small (within 60 meV per atom), suggesting that P may be<br />
accommodated within the TM lattice at this concentration. As<br />
the concentration of P increases, the formation energy of the<br />
doped TM also increases, indicating that substitutional doping<br />
becomes less favorable. At 12.5 atomic % P, the formation<br />
energy is still less than ∼100 meV per atom, which is consistent<br />
with the observation of fcc Ni doped at 14 atomic % P. 41<br />
Formation of P dimers (empty black circles) in Ni was found to<br />
be energetically slightly favorable with respect to evenly<br />
distributed P (filled black circles), for concentrations of 6.25<br />
and 12.5 atomic % P, supporting the hypothesis of P-clustering.<br />
Experimentally, Ni has been found to accommodate up to 14<br />
atomic % P without departing significantly from the fcc crystal<br />
structure. 41 Calculated XRD patterns for the relaxed Ni−P cells<br />
(Figure 5c) are consistent with this result, indicating that the<br />
fcc structure is retained at P concentrations of 6.25 and 12.5<br />
atomic % for which the XRD patterns are almost indistinguishable<br />
from that of pure Ni. At 25 atomic % P, the relaxed cell is<br />
deformed significantly with respect to the fcc structure, as is<br />
reflected in the altered XRD pattern. The Ni−P compound<br />
with the lowest phosphorus concentration in bulk materials is<br />
Ni 3P, which has 25 atomic % P and exhibits a tetragonal<br />
structure. 53<br />
4536<br />
Surprisingly, in contrast to our experimental results, the<br />
calculated lattice constant and bulk modulus for P-doped Ni,<br />
for concentrations of 6.25 and 12.5 atomic % P indicate that the<br />
lattice undergoes a contraction as the concentration of P is<br />
increased, consistent with the smaller covalent radius of P<br />
compared to Ni. The bulk modulus is increased by ∼1% for Ni<br />
doped at 12.5 atomic % P compared to pure Ni (see<br />
Supporting Information Table S6). Because the experimental<br />
results show a lattice expansion rather than contraction, this<br />
implies that some of the P formation may occur on octahedral<br />
interstitial sites, instead of solely fcc substitutional sites. This<br />
finding is consistent with the EXAFS positions analyzed using<br />
the fcc Ni + Ni 2P model.<br />
Phosphorus doping is expected to reduce the magnetism of<br />
Ni nanoparticles. Figure 5a shows the calculated magnetization<br />
M against the concentration of substitutional P, for fcc Ni<br />
(filled black circles). P is substituted for Ni and the atomic<br />
positions and cell size and shape are relaxed until the forces on<br />
all ions are less than 0.03 eV/Å. The calculations were carried<br />
out with periodic boundary conditions using supercells<br />
containing a single P atom, for P concentrations of 6.25,<br />
12.5, and 25 atomic %. The magnetization decreases for the Pdoped<br />
Ni with increasing P doping. The decrease in<br />
magnetization with P concentration is considerable, falling to<br />
zero by 25 atomic % P, exhibiting paramagnetism in Ni 3P. 54<br />
Through our DFT calculations we can estimate the P effect<br />
on magnetization to be expected in our nanoparticles. For Ni<br />
doped with 6.25 atomic % P, which is close to the<br />
concentration measured to be present in the nanoparticles<br />
dx.doi.org/10.1021/nl301642g | <strong>Nano</strong> Lett. 2012, 12, 4530−4539
<strong>Nano</strong> <strong>Letters</strong> Letter<br />
described in this article, M is calculated as 0.49 μ B per Ni atom,<br />
which is equivalent to 45 emu/g, compared to the value<br />
obtained using a SQUID of ∼29.5 emu/g (see Figure 6). This<br />
Figure 6. Magnetization data for Ni nanoparticles. (a) Magnetization<br />
versus applied field hysteresis loops measured at 2 K. (b) FC and ZFC<br />
magnetization curves for Ni nanoparticles. The curves represent<br />
temperature dependence of the magnetization for samples under a<br />
magnetic field of 100 Oe after zero-field cooling (open square) and<br />
field cooling (filled square).<br />
discrepancy might be explained by P clustering. The empty<br />
black circles in Figure 5a give the magnetization for P dimers<br />
within the Ni lattice. The dimers lead to slightly lower<br />
magnetizations than the evenly distributed P for the same<br />
concentration. For the dimers, P was substituted for two<br />
adjacent Ni atoms in a supercell that is twice as large as that<br />
used for the calculations corresponding to the evenly<br />
distributed P (i.e., the filled black circles). The lower<br />
magnetization of the Ni doped with P dimers indicates that<br />
clusters of P within the Ni lattice would disrupt the<br />
ferromagnetism more than evenly distributed P; P clustering<br />
might therefore be expected to lead to a greater reduction in M,<br />
leading to closer agreement with the measured saturation<br />
moment.<br />
The loss of magnetization due to P content is also supported<br />
by our experimental data. Magnetization versus applied-field<br />
(M vs H) hysteresis loops for the Ni nanoparticle sample at 2 K<br />
are shown in Figure 6a. The Ni nanoparticles show lower<br />
remnant magnetization (M r) (6.4 emu/g) and saturation<br />
magnetization (M s) (29.5 emu/g) than those observed in<br />
bigger Ni nanoparticles reported previously. 55,56 This decrease,<br />
although likely due in part to the size of domains in our Ni<br />
nanoparticles, which are smaller than the critical size for<br />
superparamagnetism, 55,57,58 may also be a function of<br />
phosphorus content within the nanoparticle structure, as<br />
suggested by our theoretical calculations. Zero-field cooling<br />
(ZFC)−field cooling (FC) measurements also display significant<br />
changes in magnetic properties (Figure 6b). The<br />
blocking temperature (T b) of the Ni nanoparticles is around<br />
260 K, which is lower than that observed in the bulk structure.<br />
4537<br />
Two additional samples were synthesized to investigate the<br />
effects of phosphorus on the magnetic properties: (1) Ni<br />
nanoparticles synthesized without TOP and (2) Ni nanoparticles<br />
synthesized with half the amount of TOP (2.24 mmol)<br />
compared to the standard Ni nanoparticle synthesis TOP<br />
concentration (4.48 mmol). Compared to the “standard” Ni<br />
synthesis, nanoparticles synthesized with less TOP are larger<br />
and irregular in morphology (size, 32.8 nm; std. dev, 14.4%)<br />
(Supporting Information Figure S7, left). <strong>Nano</strong>particles<br />
synthesized without TOP (Supporting Information Figure S7,<br />
right) exhibit an even greater polydispersity and a larger average<br />
size compared to the “standard” Ni nanoparticles (size, 32.3<br />
nm; std. dev, 27.8%). The samples synthesized with less TOP<br />
and without TOP do not clearly show the T b point within our<br />
measurement temperature range (2−380 K) indicating that<br />
these samples exhibit more bulk-like (higher blocking temperature)<br />
magnetic behavior (Supporting Information Figure<br />
S8). 59 Additionally, field dependence of the magnetization<br />
results of the samples with lower TOP concentrations show a<br />
larger hysteresis loop with higher M r (Ni without TOP, 15.9<br />
emu/g; Ni with less TOP, 10.34 emu/g) and M s (Ni without<br />
TOP, 34.5 emu/g; Ni with less TOP, 36.2 emu/g) than that of<br />
standard Ni nanoparticles. However it is not clear whether or<br />
not this effect is solely a result of phosphorus content, since<br />
ferromagnetic behavior is highly sensitive to size effects. 60−62<br />
This change in magnetic behavior with increasing phosphorus<br />
content suggests that changes in the nanoparticle properties<br />
may result from the presence of excess phosphorus within the<br />
structure.<br />
DFT calculations were carried out to investigate whether the<br />
P doping effects on magnetization may be applicable to other<br />
transition metal systems. Figure 5a shows the calculated<br />
magnetization against substitutional P concentration for<br />
hexagonal close-packed (hcp) Co (red squares) and bodycentered<br />
cubic (bcc) Fe (blue diamonds). As with Ni, the<br />
magnetization decreases for Co and Fe with increasing P<br />
doping, although there is a weaker sensitivity of the<br />
ferromagnetism in these TMs to P doping compared to Ni.<br />
This effect is consistent with the fact that the TM 3P phase<br />
exhibits ferromagnetism rather than paramagnetism in Co 3P 63<br />
and Fe 3P. 64<br />
In addition, the catalytic properties of the Ni nanoparticles<br />
may be severely affected by the unintended P doping. The<br />
density of states (DOS) near the Fermi surface affects how a<br />
molecule can bind to the material, as the molecular orbitals<br />
form bonding and antibonding states with the surface states.<br />
According to our DOS calculations, the majority states at 100<br />
meV above the Fermi level are strongly affected by the P<br />
presence, which reduces the number of states. Comparing<br />
doped (6.25 atomic % P) Ni to pure Ni, there is a 40%<br />
reduction in the number of states observed at 100 meV (Figure<br />
7). This is particularly significant because these nanoparticles<br />
are notable for their use in catalytic applications, and properties<br />
of catalytic materials are very sensitive to surface states,<br />
therefore the excess P content may detrimentally degrade the<br />
catalytic properties of these Ni nanoparticles.<br />
Through a combination of characterization techniques,<br />
including EXAFS to probe short-range structural order and<br />
XRD to determine the long-range crystal structure, as well as<br />
DFT, TEM, SQUID, and XANES, we were able to elucidate<br />
the structure of Ni nanoparticles and derive conclusions<br />
concerning the relation of their synthetic conditions to the<br />
resulting structure−property relations. Using TOP to promote<br />
dx.doi.org/10.1021/nl301642g | <strong>Nano</strong> Lett. 2012, 12, 4530−4539
Figure 7. Bulk Ni DOS near the Fermi surface. The majority states<br />
around 100 meV above the Fermi level are strongly affected by the P<br />
content. Substitutional P (6.25 atomic %) is shown for evenly<br />
distributed P (black) and for P dimers (purple). The P presence<br />
reduces the number of states in both cases.<br />
stabilization and coordination in Ni nanoparticle synthesis can<br />
also lead to undesired phosphorus doping. This phosphorus<br />
doping increases as a function of synthetic temperature and<br />
reaction time. This is likely relevant to other synthetic systems<br />
which employ TOP and similarly strong-binding phosphorus<br />
ligands, such as triphenyl phosphine. Even with phosphorus<br />
content as high as several percent, the crystalline fcc Ni lattice is<br />
not significantly disrupted. There is, however, a lattice<br />
expansion notable in the XRD pattern as a function of P<br />
atomic %, which enables calculation of the P content of the<br />
nanoparticles based on XRD peak position alone, a useful<br />
technique in fine-tuning the synthesis. We find that the<br />
structure consists of a crystalline fcc lattice with P substitutional<br />
atoms and distortion only of the Ni atoms surrounding the P<br />
substitutional sites. This unintentional P doping significantly<br />
impacts the nanoparticle structural behavior, magnetic properties,<br />
and catalytic activities, which we have demonstrated<br />
through both the experimental and modeled phenomena.<br />
The results of this study suggest that it should be taken into<br />
consideration in optimizing nanoparticles for use in applications,<br />
that there may be a significant concentration of XRD<br />
amorphous species present in the nanoparticles, which may<br />
interfere with desired properties. Thus care should be taken<br />
when using strong binding surfactant ligands such as TOP in<br />
the synthesis of nanoparticles, particularly when they are used<br />
in ■high concentrations.<br />
ASSOCIATED CONTENT<br />
*S Supporting Information<br />
Detailed experimental section, Figures S1−S8, and Tables S1−<br />
S6. This material is available free of charge via the Internet at<br />
http://pubs.acs.org.<br />
■ AUTHOR INFORMATION<br />
Corresponding Author<br />
*E-mail: rdr82@cornell.edu.<br />
Author Contributions<br />
†<br />
Authors contributed equally to this work<br />
Notes<br />
The authors declare no competing financial interest.<br />
■ ACKNOWLEDGMENTS<br />
We thank Ken Finkelstein for his assistance with obtaining data,<br />
experimental setup at CHESS, and advice concerning data<br />
analysis. We acknowledge support from the National Science<br />
Foundation (NSF) through the Cornell Center for Materials<br />
Research (CCMR) with funding from the Materials Research<br />
Science and Engineering Center program (cooperative agreement<br />
DMR 1120296) and under Award Number CHE-<br />
1152922. The Cornell High Energy Synchrotron Source<br />
(CHESS) is supported by the NSF and NIH/NIGMS via<br />
NSF award DMR-0936384. D.H.H. was supported as part of<br />
the Energy Materials Center at Cornell (EMC 2 ), an Energy<br />
Frontier Research Center funded by the U.S. Department of<br />
Energy, Office of Science, Office of Basic Energy Science under<br />
Award Number DE-SC0001086. L.M.M. is supported from the<br />
Engineering Learning Initiatives Undergraduate Research<br />
Grants Program at Cornell University with sponsorship from<br />
the SRC Education Alliance URO by the Intel Foundation.<br />
■ REFERENCES<br />
(1) Murray, C. B.; Norris, D. J.; Bawendi, M. G. J. Am. Chem. Soc.<br />
1993, 115, 8706−8715.<br />
(2) Yin, Y.; Alivisatos, A. P. Nature 2005, 437, 664−670.<br />
(3) Murray, C. B.; Kagan, C. R.; Bawendi, M. G. Annu. Rev. Mater.<br />
Sci. 2000, 30, 545−610.<br />
(4) Peng, X.; Manna, U.; Yang, W.; Wickham, J.; Scher, E.;<br />
Kadavanich, A.; Allvisatos, A. P. Nature 2000, 404, 59−61.<br />
(5) Bealing, C. R.; Baumgardner, W. J.; Choi, J. J.; Hanrath, T.;<br />
Hennig, R. G. ACS <strong>Nano</strong> 2012, 6, 2118−2127.<br />
(6) Liu, H.; Owen, J. S.; Alivisatos, A. P. J. Am. Chem. Soc. 2007, 129,<br />
305−312.<br />
(7) Wang, F.; Tang, R.; Buhro, W. E. <strong>Nano</strong> Lett. 2008, 8, 3521−3524.<br />
(8) Evans, C. M.; Evans, M. E.; Krauss, T. D. J. Am. Chem. Soc. 2010,<br />
132, 10973−10975.<br />
(9) Owen, J. S.; Park, J.; Trudeau, P.-E.; Alivisatos, A. P. J. Am. Chem.<br />
Soc. 2008, 130, 12279−12281.<br />
(10) Zhang, H.; Ha, D.-H.; Hovden, R.; Kourkoutis, L. F.; <strong>Robinson</strong>,<br />
R. D. <strong>Nano</strong> Lett. 2011, 11, 188−197.<br />
(11) Hanada, N.; Ichikawa, T.; Fujii, H. J. Phys. Chem. B 2005, 109,<br />
7188−7194.<br />
(12) Wu, S.-H.; Chen, D.-H. J. Colloid Interface Sci. 2003, 259, 282−<br />
286.<br />
(13) Ozay, O.; Aktas, N.; Inger, E.; Sahiner, N. Int. J. Hydrogen Energy<br />
2011, 36, 1998−2006.<br />
(14) Mahata, N.; Cunha, A. F.; Orfao, J. J. M.; Figueiredo, J. L. Appl.<br />
Catal. 2008, 351, 204−209.<br />
(15) Lin, K. Y.; Tsai, W. T.; Chang, J. K. Int. J. Hydrogen Energy 2010,<br />
35, 7555−7562.<br />
(16) Lin, K. Y.; Tsai, W. T.; Yang, T. J. J. Power Sources 2011, 196,<br />
3389−3394.<br />
(17) Yang, C. C.; Li, Y. J.; Chen, W. H. Int. J. Hydrogen Energy 2010,<br />
35, 2336−2343.<br />
(18) Kim, C.; Noh, M.; Choi, M.; Cho, J.; Park, B. Chem. Mater.<br />
2005, 17, 3297−3301.<br />
(19) Park, J.; Kang, E.; Son, S. U.; Park, H. M.; Lee, M. K.; Kim, J.;<br />
Kim, K. W.; Noh, H.-J.; Park, J.-H.; Bae, C. J.; Park, J.-G.; Hyeon, T.<br />
Adv. Mater. 2005, 17, 429−434.<br />
(20) Park, J.; Joo, J.; Kwon, S. G.; Jang, Y.; Hyeon, T. Angew. Chem.,<br />
Int. Ed. 2007, 46, 4630−4660.<br />
(21) Muthuswamy, E.; Savithra, G. H. L.; Brock, S. L. ACS <strong>Nano</strong><br />
2011, 5, 2402−2411.<br />
(22) Henkes, A. E.; Vasquez, Y.; Schaak, R. E. J. Am. Chem. Soc. 2007,<br />
129, 1896−1897.<br />
(23) Wang, J.; Johnston-Peck, A. C.; Tracy, J. B. Chem. Mater. 2009,<br />
21, 4462−4467.<br />
(24) Chiang, R.-K.; Chiang, R.-T. Inorg. Chem. 2007, 46, 369−371.<br />
<strong>Nano</strong> <strong>Letters</strong> Letter<br />
4538<br />
dx.doi.org/10.1021/nl301642g | <strong>Nano</strong> Lett. 2012, 12, 4530−4539
<strong>Nano</strong> <strong>Letters</strong> Letter<br />
(25) Gao, J.; Guan, F.; Zhao, Y.; Yang, W.; Ma, Y.; Lu, X.; Hou, J.;<br />
Kang, J. Mater. Chem. Phys. 2001, 71, 215−219.<br />
(26) Peng, T. C.; Xiao, X. H.; Wu, W.; Fan, L. X.; Zhou, X. D.; Ren,<br />
F.; Jiang, C. Z. J. Mater. Sci. 2012, 47, 508−513.<br />
(27) Carenco, S.; Boissiere, C.; Nicole, L.; Sanchez, C.; Le, F. P.;<br />
Mezailles, N. Chem. Mater. 2010, 22, 1340−1349.<br />
(28) Aruguete, D. M.; Marcus, M. A.; Li, L. S.; Williamson, A.; Fakra,<br />
S.; Gygi, F.; Galli, G. A.; Alivisatos, A. P. J. Phys. Chem. C 2007, 111,<br />
75−79.<br />
(29) Marcus, M. A.; Flood, W.; Stiegerwald, M.; Brus, L.; Bawendi,<br />
M. J. Phys. Chem. 1991, 95, 1572−1576.<br />
(30) Cheng, G.; Carter, J. D.; Guo, T. Chem. Phys. Lett. 2004, 400,<br />
122−127.<br />
(31) Park, J.-I.; Kim, M. G.; Jun, Y.-W.; Lee, J. S.; Lee, W.-R.; Cheon,<br />
J. J. Am. Chem. Soc. 2004, 126, 9072−9078.<br />
(32) Sarma, L. S.; Chen, C.-H.; Kumar, S. M. S.; Wang, G.-R.; Yen,<br />
S.-C.; Liu, D.-G.; Sheu, H.-S.; Yu, K.-L.; Tang, M.-T.; Lee, J.-F.; Bock,<br />
C.; Chen, K.-H.; Hwang, B.-J. Langmuir 2007, 23, 5802−5809.<br />
(33) Rodriguez, J. A.; Hanson, J. C.; Kim, J.-Y.; Liu, G.; Iglesias-Juez,<br />
A.; Fernandez-Garcia, M. J. Phys. Chem. B 2003, 107, 3535−3543.<br />
(34) Rockenberger, J.; Troeger, L.; Kornowski, A.; Vossmeyer, T.;<br />
Eychmueller, A.; Feldhaus, J.; Weller, H. J. Phys. Chem. B 1997, 101,<br />
2691−2701.<br />
(35) Frenkel, A. I.; Hills, C. W.; Nuzzo, R. G. J. Phys. Chem. B 2001,<br />
105, 12689−12703.<br />
(36) Bunker, G. Introduction to XAFS: a practical guide to X-ray<br />
absorption fine structure spectroscopy; Cambridge University Press:<br />
Cambridge, 2010; p 260.<br />
(37) Stern, E. A. Phys. Rev. B 1974, 10, 3027−3037.<br />
(38) Stern, E. A. Contemp. Phys. 1978, 19, 289−310.<br />
(39) Mantina, M.; Wang, Y.; Chen, L. Q.; Liu, Z. K.; Wolverton, C.<br />
Acta Mater. 2009, 57, 4102−4108.<br />
(40) Chan, T. L.; Tiago, M. L.; Kaxiras, E.; Chelikowsky, J. R. <strong>Nano</strong><br />
Lett. 2007, 8, 596−600.<br />
(41) Song, J.; Wei, Z.; Pan, Z.; Xie, Z.; Wei, S. AIP Conf. Proc. 2007,<br />
882, 453−456.<br />
(42) Blanchard, P. E. R.; Grosvenor, A. P.; Cavell, R. G.; Mar, A. J.<br />
Mater. Chem. 2009, 19, 6015−6022.<br />
(43) Anspoks, A.; Kuzmin, A. J. Non-Cryst. Solids 2011, 357, 2604−<br />
2610.<br />
(44) Arcon, I.; Tuel, A.; Kodre, A.; Martin, G.; Barbier, A. J.<br />
Synchrotron Radiat. 2001, 8, 575−577.<br />
(45) Calvin, S.; Miller, M. M.; Goswami, R.; Cheng, S. F.; Mulvaney,<br />
S. P.; Whitman, L. J.; Harris, V. G. J. Appl. Phys. 2003, 94, 778−783.<br />
(46) Gurman, S. J. J. Synchrotron Radiat. 1995, 2, 56−63.<br />
(47) Nietubyc, R.; Czerwosz, E.; Diduszko, R.; Dluzewski, P.;<br />
Kozlowski, M.; Welter, E. J. Alloys Compd. 2009, 484, 896−901.<br />
(48) Ha, D.-H.; Moreau, L. M.; Bealing, C. R.; Zhang, H.; Hennig, R.<br />
G.; <strong>Robinson</strong>, R. D. J. Mater. Chem. 2011, 21, 11498−11510.<br />
(49) Häglund, J.; Fernańdez Guillermet, A.; Grimvall, G.; Körling, M.<br />
Phys. Rev. B 1993, 48, 11685.<br />
(50) Moreels, I.; Justo, Y.; De, G. B.; Haustraete, K.; Martins, J. C.;<br />
Hens, Z. ACS <strong>Nano</strong> 2011, 5, 2004−2012.<br />
(51) Katari, J. E. B.; Colvin, V. L.; Alivisatos, A. P. J. Phys. Chem.<br />
1994, 98, 4109−4117.<br />
(52) Bader, R. Atoms in Molecules: A Quantum Theory; Oxford<br />
University Press: New York, 1994.<br />
(53) Oryshchyn, S.; Babizhetskyy, V.; Chykhriy, S.; Aksel’rud, L.;<br />
Stoyko, S.; Bauer, J.; Guerin, R.; Kuz’ma, Y. Inorg. Mater. 2004, 40,<br />
380−385.<br />
(54) Konig, E. Ni(0), Ni(I). In SpringerMaterials- The Landolt-<br />
Bornstein Database, Hellwege, K.-H.; Hellwege, A. M. (accessed<br />
September 30, 2011).<br />
(55) Gong, W.; Li, H.; Zhao, Z.; Chen, J. J. Appl. Phys. 1991, 69,<br />
5119−5121.<br />
(56) Zhang, H. T.; Wu, G.; Chen, X. H.; Qiu, X. G. Mater. Res. Bull.<br />
2006, 41, 495−501.<br />
(57) Leslie-Pelecky, D. L.; Rieke, R. D. Chem. Mater. 1996, 8, 1770−<br />
1783.<br />
4539<br />
(58) Du, Y.; Xu, M.; Wu, J.; Shi, Y.; Lu, H.; Xue, R. J. Appl. Phys.<br />
1991, 70, 5903−5905.<br />
(59) Jun, Y.-w.; Seo, J.-w.; Cheon, J. Acc. Chem. Res. 2008, 41, 179−<br />
189.<br />
(60) Johnson, D.; Perera, P.; O’Shea, M. J. J. Appl. Phys. 1996, 79,<br />
5299−5301.<br />
(61) Roy, S.; Dubenko, I.; Edorh, D. D.; Ali, N. J. Appl. Phys. 2004,<br />
96, 1202−1208.<br />
(62) Blanco-Mantecon, M.; O’Grady, K. J. Magn. Magn. Mater. 2006,<br />
296, 124−133.<br />
(63) Konig, E.; Konig, G. Co(0), Co(I). In SpringerMaterials- The<br />
Landolt-Bornstein Database, Hellwege, K.-H.; Hellwege, A. M.<br />
(accessed September 30, 2011).<br />
(64) Konig, E.; Konig, G. Part 2. In SpringerMaterials- The Landolt-<br />
Bornstein Database, Hellwege, K.-H.; Hellwege, A. M. (accessed<br />
September 30, 2011).<br />
dx.doi.org/10.1021/nl301642g | <strong>Nano</strong> Lett. 2012, 12, 4530−4539