RCEM QUALITY IMPROVEMENT GUIDE
2fvpeHu
2fvpeHu
You also want an ePaper? Increase the reach of your titles
YUMPU automatically turns print PDFs into web optimized ePapers that Google loves.
Measurement and QI<br />
Measurement is of vital importance in QI. If you do not measure, you cannot know if<br />
you have made a difference (for better or for worse).<br />
However, choosing what to measure is important, as if you do not select the correct<br />
measures you will be unable to demonstrate improvement (if any). Choosing the<br />
wrong metrics, like choosing the wrong QI methodology, may alter efficacy of the<br />
QI project (or at least the demonstration of efficacy). Ideally, data collection should<br />
be continuous, with multiple metrics.<br />
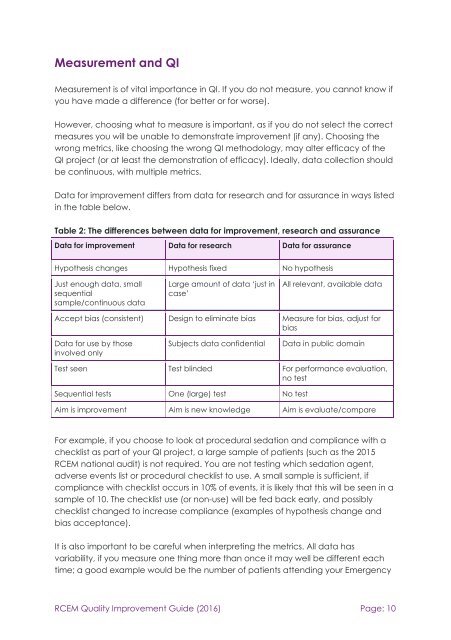
Data for improvement differs from data for research and for assurance in ways listed<br />
in the table below.<br />
Table 2: The differences between data for improvement, research and assurance<br />
Data for improvement Data for research Data for assurance<br />
Hypothesis changes Hypothesis fixed No hypothesis<br />
Just enough data, small<br />
sequential<br />
sample/continuous data<br />
Large amount of data ‘just in<br />
case’<br />
All relevant, available data<br />
Accept bias (consistent) Design to eliminate bias Measure for bias, adjust for<br />
bias<br />
Data for use by those<br />
involved only<br />
Subjects data confidential<br />
Data in public domain<br />
Test seen Test blinded For performance evaluation,<br />
no test<br />
Sequential tests One (large) test No test<br />
Aim is improvement Aim is new knowledge Aim is evaluate/compare<br />
For example, if you choose to look at procedural sedation and compliance with a<br />
checklist as part of your QI project, a large sample of patients (such as the 2015<br />
<strong>RCEM</strong> national audit) is not required. You are not testing which sedation agent,<br />
adverse events list or procedural checklist to use. A small sample is sufficient, if<br />
compliance with checklist occurs in 10% of events, it is likely that this will be seen in a<br />
sample of 10. The checklist use (or non-use) will be fed back early, and possibly<br />
checklist changed to increase compliance (examples of hypothesis change and<br />
bias acceptance).<br />
It is also important to be careful when interpreting the metrics. All data has<br />
variability, if you measure one thing more than once it may well be different each<br />
time; a good example would be the number of patients attending your Emergency<br />
<strong>RCEM</strong> Quality Improvement Guide (2016) Page: 10


