HAPIndex_NOV16

Create successful ePaper yourself
Turn your PDF publications into a flip-book with our unique Google optimized e-Paper software.
HOME.CO UK ASKING PRICE INDEX November 2016 Released: 15/11/2016 1 of 6<br />
Asking Price Index<br />
Released 15/11/16 November 2016<br />
EMBARGOED<br />
UNTIL 15/11/16<br />
Home Prices Feel a Winter Chill<br />
Headlines<br />
• Average home price remains unchanged<br />
since October as the market cools.<br />
• Prices fell in six of the nine English regions<br />
and Wales but not in Scotland.<br />
• Greater London is currently the UK’s worst<br />
performing region with prices rising just<br />
0.2% over the last twelve months.<br />
• In a contrarian move, Scottish prices<br />
jumped 0.8% over the last month taking<br />
the annualised increase to 5.9%.<br />
• East of England also shows an exceptional<br />
rise of 0.6% making the annualised<br />
gain 10.6% in the region.<br />
• Supply of property for sale continues to<br />
increase in the key regions of London<br />
(+14%), East of England (+14%) and the<br />
South East (+15%) (Oct 16 vs. Oct 15).<br />
• Typical Time on Market edges up just one day to<br />
92 days over the last month across England and<br />
Wales: six days less than in November 2015.<br />
• The overall rate of home price<br />
appreciation for England and Wales<br />
slips to 3.8% (Nov 16 vs. Nov 15).<br />
• The total stock of property on the market has again<br />
dropped back slightly since last month and is<br />
currently 1.7% more than in November last year.<br />
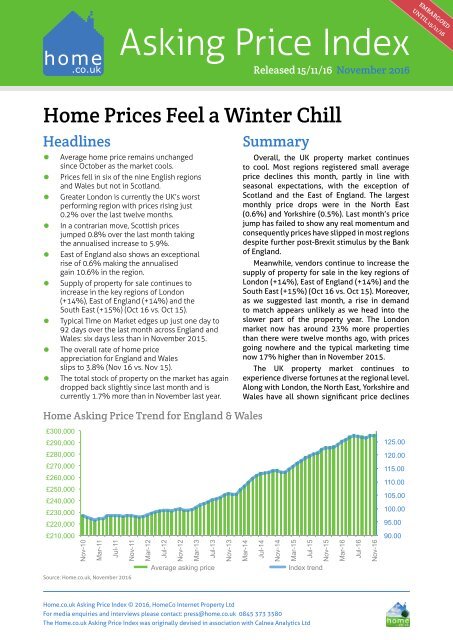
Home Asking Price Trend for England & Wales<br />
Summary<br />
Overall, the UK property market continues<br />
to cool. Most regions registered small average<br />
price declines this month, partly in line with<br />
seasonal expectations, with the exception of<br />
Scotland and the East of England. The largest<br />
monthly price drops were in the North East<br />
(0.6%) and Yorkshire (0.5%). Last month’s price<br />
jump has failed to show any real momentum and<br />
consequently prices have slipped in most regions<br />
despite further post-Brexit stimulus by the Bank<br />
of England.<br />
Meanwhile, vendors continue to increase the<br />
supply of property for sale in the key regions of<br />
London (+14%), East of England (+14%) and the<br />
South East (+15%) (Oct 16 vs. Oct 15). Moreover,<br />
as we suggested last month, a rise in demand<br />
to match appears unlikely as we head into the<br />
slower part of the property year. The London<br />
market now has around 23% more properties<br />
than there were twelve months ago, with prices<br />
going nowhere and the typical marketing time<br />
now 17% higher than in November 2015.<br />
The UK property market continues to<br />
experience diverse fortunes at the regional level.<br />
Along with London, the North East, Yorkshire and<br />
Wales have all shown significant price declines<br />
£300,000<br />
£290,000<br />
125.00<br />
£280,000<br />
£270,000<br />
£260,000<br />
£250,000<br />
£240,000<br />
£230,000<br />
£220,000<br />
120.00<br />
115.00<br />
110.00<br />
105.00<br />
100.00<br />
95.00<br />
£210,000<br />
90.00<br />
Nov-10<br />
Mar-11<br />
Jul-11<br />
Nov-11<br />
Mar-12<br />
Jul-12<br />
Nov-12<br />
Mar-13<br />
Jul-13<br />
Nov-13<br />
Mar-14<br />
Jul-14<br />
Nov-14<br />
Mar-15<br />
Jul-15<br />
Nov-15<br />
Mar-16<br />
Jul-16<br />
Nov-16<br />
Average asking price<br />
Index trend<br />
Source: Home.co.uk, November 2016<br />
Home.co.uk Asking Price Index © 2016, HomeCo Internet Property Ltd<br />
For media enquiries and interviews please contact: press@home.co.uk 0845 373 3580<br />
The Home.co.uk Asking Price Index was originally devised in association with Calnea Analytics Ltd
HOME.CO UK ASKING PRICE INDEX November 2016 Released: 15/11/2016 2 of 6<br />
this month. The North West has fared better with<br />
no change since last month and up 3.9% over the<br />
last twelve months.<br />
The East of England continues to be the<br />
UK’s best performing region. Prices continue<br />
to rise at a fast pace despite increasing supply.<br />
Home prices have increased by 10.6% over the<br />
last twelve months indicating that this region<br />
is outperforming all others by a considerable<br />
margin.<br />
The West and East Midlands are enjoying the<br />
next best price performance with respective<br />
home values increasing by 6.4% and 5.5% over<br />
the last twelve months. Supply in these regions<br />
is still contracting, hence we expect prices will<br />
remain robust.<br />
Overall, the current mix-adjusted average<br />
asking price for England and Wales is now 3.8%<br />
higher than it was in November 2015, and we<br />
anticipate that this figure will continue to trend<br />
downwards over the coming months.<br />
Regional Market Round-up<br />
The trend towards increased supply in the East<br />
of England, the South East and Greater London<br />
continues. In Central London we observe that the<br />
stock of properties for sale started to build up<br />
from January 2014 onwards. Today, 34 months<br />
later, we can see that the number of properties<br />
for sale has increased by a startling 136% and<br />
the typical price of a flat has fallen 8%. Moreover,<br />
top end properties are simply not selling and the<br />
average marketing time has risen to 200 days.<br />
Greater London has followed a similar postboom<br />
path, albeit persistent price declines have<br />
only been evident since January this year (median<br />
down 8%). Rising supply has overwhelmed<br />
demand in the Greater London region (now the<br />
worst performing region in terms of price rises in<br />
the UK) and this trend looks set to spread out to<br />
the South East next and later the East of England.<br />
The South East has shown progressively<br />
weaker price growth over recent months due to<br />
increased supply. Over the last six months prices<br />
in this affluent region have only nudged up 0.4%.<br />
However, this regional property market still has<br />
considerable momentum and has the lowest<br />
average Time on Market figure (65 days) except<br />
for the East of England (63 days). We expect<br />
supply to continue to increase in 2017 and this<br />
will create downward pressure on prices.<br />
For the time being the East of England<br />
property market is still booming, but, as with<br />
London before, prices have risen too high too fast<br />
and the region is due for a correction in 2017. By<br />
way of an example the average property asking<br />
price in Cambridgeshire has increased 22% since<br />
January this year. We expect the rising supply<br />
trend to stifle price growth next year as more and<br />
more investors look to cash in. The number of<br />
properties on the market in Cambridgeshire has<br />
already increased by 17% since January.<br />
By stark contrast, supply actually continues<br />
to contract in the West and East Midlands, and<br />
we anticipate price growth there to continue<br />
unchecked through 2017. Of course, these<br />
regions are earlier in the economic cycle;<br />
significant price growth in the Midlands began<br />
Price Change by Region (Oct 2016 vs. Oct 2015)<br />
12.0%<br />
10.0%<br />
8.0%<br />
6.0%<br />
4.0%<br />
2.0%<br />
0.0%<br />
East<br />
West<br />
Midlands<br />
Scotland<br />
East<br />
Midlands<br />
South<br />
West<br />
North<br />
West<br />
South<br />
East<br />
12-month %<br />
Yorks &<br />
Humber<br />
North<br />
East<br />
Wales<br />
Greater<br />
London<br />
UK<br />
Source: Home.co.uk, November 2016<br />
Home.co.uk Asking Price Index © 2016, HomeCo Internet Property Ltd<br />
For media enquiries and interviews please contact: press@home.co.uk 0845 373 3580<br />
The Home.co.uk Asking Price Index was originally devised in association with Calnea Analytics Ltd
HOME.CO UK ASKING PRICE INDEX November 2016 Released: 15/11/2016 3 of 6<br />
much later than in London and the South East,<br />
hence these booms have further to run.<br />
Looking further north, the North West is<br />
clearly the best performing region, with a 3.9%<br />
rise over the last twelve months, while the North<br />
East and Yorkshire have added 0.9% and 2.4%<br />
to their home values over the same period. In<br />
real terms, the North East is actually losing value<br />
when we take into account monetary inflation.<br />
Wales’ home price performance over the<br />
last twelve months is similarly lacklustre, rising<br />
a mere 0.8%, and it currently has the longest<br />
Typical Time On Market in mainland UK. The<br />
Scottish property market, however, is performing<br />
very well, posting a significant rise in asking<br />
prices of 5.9% over the last twelve months,<br />
despite having one of the highest Typical Time<br />
on Market figures.<br />
For more information on regional property<br />
market performance please see pages 4 and 5 of<br />
this report.<br />
Typical Time on Market<br />
160<br />
140<br />
120<br />
100<br />
80<br />
60<br />
40<br />
20<br />
0<br />
Wales<br />
North East<br />
Scotland<br />
North West<br />
Yorks & Humber<br />
South West<br />
West Midlands<br />
Source: Home.co.uk, November 2016<br />
East Midlands<br />
Greater London<br />
South East<br />
East<br />
Median Time on Market (days)<br />
England & Wales<br />
The post-crisis story<br />
of the UK property<br />
market continues to<br />
play out. Ultra-low<br />
interest rates pushed<br />
up prices in London to<br />
extreme levels and the<br />
downturn that began<br />
in Prime Central London has now spread<br />
across the entire Greater London area.<br />
Prices are stagnating and properties are spending<br />
longer and longer on the market. In fact, the<br />
most recent home price figures for the region<br />
show that they lag behind monetary inflation,<br />
hence in real terms they are already falling.<br />
Supply is increasing in the East of England and<br />
the South East as it did in London. Oversupply<br />
is clearly a danger as it will cause a stand-off<br />
between buyers and sellers which could lead<br />
to a rapid downward spiral in prices. As we<br />
pointed out previously, foreign investment<br />
was once the saviour of the London market<br />
following the onset of the financial crisis, but<br />
euroland or dollar-based investors are simply<br />
not interested at the moment. Prime properties<br />
in the capital are not selling and the rental<br />
yields are some of the worst in the country.<br />
Due to sterling weakness we can already expect<br />
a large wave of inflation to hit soon; indeed, it’s<br />
already on the rise. Should inflation increase<br />
much beyond 2% then expect mortgage rates<br />
to rise to well above that figure. More expensive<br />
borrowing will create a major headwind for<br />
the UK property market. In fact, interest rates<br />
are already predicted to quadruple over the<br />
next 5-10 years, according to the yield curves<br />
produced by the Bank of England (but they<br />
may well rise even further than forecast).<br />
Of course, all this should come as no<br />
surprise. ZIRP policies cannot last forever;<br />
they are meant to be a temporary fix<br />
while the ‘real economy’ takes off again.<br />
Unfortunately, there is little evidence of<br />
that and instead we have the headache of<br />
both widening fiscal and trade deficits.<br />
Like a Greek tragedy, the UK’s national obsession<br />
with owning property may well be its undoing.<br />
Doug Shephard<br />
Director at Home.co.uk<br />
Home.co.uk Asking Price Index © 2016, HomeCo Internet Property Ltd<br />
For media enquiries and interviews please contact: press@home.co.uk 0845 373 3580<br />
The Home.co.uk Asking Price Index was originally devised in association with Calnea Analytics Ltd
HOME.CO UK ASKING PRICE INDEX November 2016 Released: 15/11/2016 4 of 6<br />
Scotland Nov-16<br />
Average Asking Price £180,002<br />
Monthly % change 0.8%<br />
Annual % change 5.9%<br />
North East Nov-16<br />
Average Asking Price £154,607<br />
Monthly % change -0.6%<br />
Annual % change 0.9%<br />
Yorks & The Humber Nov-16<br />
Average Asking Price £180,594<br />
Monthly % change -0.5%<br />
Annual % change 2.6%<br />
North West Nov-16<br />
Average Asking Price £186,725<br />
Monthly % change 0.0%<br />
Annual % change 3.9%<br />
UK<br />
Asking<br />
Prices<br />
England & Wales<br />
Nov-16<br />
Average Asking Price £297,803<br />
Monthly % change 0.0%<br />
Annual % change 3.8%<br />
West Midlands Nov-16<br />
Average Asking Price £226,074<br />
Monthly % change 0.2%<br />
Annual % change 6.4%<br />
East Midlands Nov-16<br />
Average Asking Price £211,503<br />
Monthly % change 0.1%<br />
Annual % change 5.5%<br />
East Nov-16<br />
Average Asking Price £345,109<br />
Monthly % change 0.6%<br />
Annual % change 10.6%<br />
Wales Nov-16<br />
Average Asking Price £186,205<br />
Monthly % change -0.2%<br />
Annual % change 0.8%<br />
Greater London Nov-16<br />
Average Asking Price £537,490<br />
Monthly % change -0.2%<br />
Annual % change 0.2%<br />
South East Nov-16<br />
Average Asking Price £394,448<br />
Monthly % change -0.1%<br />
Annual % change 3.8%<br />
South West Nov-16<br />
Average Asking Price £309,064<br />
Monthly % change 0.0%<br />
Annual % change 4.8%<br />
Source: Home.co.uk, November 2016<br />
Home.co.uk Asking Price Index © 2016, HomeCo Internet Property Ltd<br />
For media enquiries and interviews please contact: press@home.co.uk 0845 373 3580<br />
The Home.co.uk Asking Price Index was originally devised in association with Calnea Analytics Ltd
HOME.CO UK ASKING PRICE INDEX November 2016 Released: 15/11/2016 5 of 6<br />
Scotland Nov-16<br />
Average Time on Market 224<br />
Typical Time on Market 114<br />
Annual % supply change -9%<br />
North East Nov-16<br />
Average Time on Market 234<br />
Typical Time on Market 126<br />
Annual % supply change -2%<br />
Yorks & The Humber Nov-16<br />
Average Time on Market 187<br />
Typical Time on Market 108<br />
Annual % supply change -8%<br />
North West Nov-16<br />
Average Time on Market 192<br />
Typical Time on Market 109<br />
Annual % supply change -8%<br />
UK<br />
Time on<br />
Market<br />
England & Wales<br />
Nov-16<br />
Average Time on Market 160<br />
Typical Time on Market 92<br />
Annual % supply change 1%<br />
West Midlands Nov-16<br />
Average Time on Market 153<br />
Typical Time on Market 87<br />
Annual % supply change -5%<br />
East Midlands Nov-16<br />
Average Time on Market 143<br />
Typical Time on Market 83<br />
Annual % supply change -8%<br />
East Nov-16<br />
Average Time on Market 108<br />
Typical Time on Market 63<br />
Annual % supply change 14%<br />
Wales Nov-16<br />
Average Time on Market 232<br />
Typical Time on Market 135<br />
Annual % supply change -12%<br />
Greater London Nov-16<br />
Average Time on Market 121<br />
Typical Time on Market 74<br />
Annual % supply change 14%<br />
South East Nov-16<br />
Average Time on Market 106<br />
Typical Time on Market 65<br />
Annual % supply change 15%<br />
South West Nov-16<br />
Average Time on Market 146<br />
Typical Time on Market 87<br />
Annual % supply change -4%<br />
Source: Home.co.uk, November 2016. Note: Average = Mean (days), Typical = Median (days)<br />
Home.co.uk Asking Price Index © 2016, HomeCo Internet Property Ltd<br />
For media enquiries and interviews please contact: press@home.co.uk 0845 373 3580<br />
The Home.co.uk Asking Price Index was originally devised in association with Calnea Analytics Ltd
HOME.CO UK ASKING PRICE INDEX November 2016 Released: 15/11/2016 6 of 6<br />
About the<br />
Home.co.uk<br />
Asking Price Index<br />
• The Home.co.uk Asking Price Index<br />
was originally devised in association<br />
with Calnea Analytics: the statistical<br />
consultancy responsible for the<br />
production of the official Land<br />
Registry House Price Index.<br />
• The Home.co.uk Asking Price Index<br />
(HAPI) is calculated using a weighting<br />
system based on the DCLG (formerly<br />
ODPM) Survey of English Housing<br />
Stock (published March 2006).<br />
This allows for enhanced regional<br />
delineation and conforms to the current<br />
geographical orthodoxy as set out<br />
by the Office of National Statistics.<br />
Contact details and<br />
further information<br />
• For media enquiries please contact:<br />
press@home.co.uk<br />
0845 373 3580<br />
• To learn more about Home.co.uk<br />
please visit:<br />
http://www.home.co.uk/<br />
company/about.htm<br />
• For further details on the methodology<br />
used in the calculation of the HAPI<br />
please visit:<br />
http://www.home.co.uk/asking_price_<br />
index/Mix-Adj_Methodology.pdf<br />
• To learn more about Home.co.uk data<br />
services please visit:<br />
http://www.home.co.uk/<br />
company/data/<br />
• The HAPI is the UK’s only independent<br />
forward market indicator. The<br />
published figures reflect current and<br />
historic confidence of buyers and<br />
sellers of UK property on the open<br />
market. The HAPI is calculated every<br />
month using around 500,000 UK<br />
property house prices found in the<br />
Home.co.uk Property Search Index.<br />
This figure represents the majority<br />
of the property for sale on the open<br />
market in the UK at any given time.<br />
• The HAPI is based on asking price<br />
data which means the index can<br />
provide insights into price movements<br />
around 5 months ahead of mortgage<br />
completion and actual sales data<br />
– thus making it the most forward<br />
looking of all house price indices.<br />
Properties above £1m and below £20k<br />
are excluded from the calculations.<br />
Future<br />
release dates:<br />
• Tuesday 13 th December<br />
• Thursday 12 th January<br />
• Tuesday 14 th February<br />
Home.co.uk Asking Price Index © 2016, HomeCo Internet Property Ltd<br />
For media enquiries and interviews please contact: press@home.co.uk 0845 373 3580<br />
The Home.co.uk Asking Price Index was originally devised in association with Calnea Analytics Ltd