Mining matters Natural resource extraction and local business constraints
2fCPiMQ
2fCPiMQ

Create successful ePaper yourself
Turn your PDF publications into a flip-book with our unique Google optimized e-Paper software.
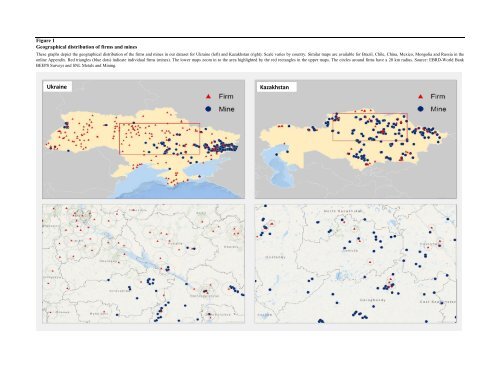
Figure 1<br />
Geographical distribution of firms <strong>and</strong> mines<br />
These graphs depict the geographical distribution of the firms <strong>and</strong> mines in our dataset for Ukraine (left) <strong>and</strong> Kazakhstan (right). Scale varies by country. Similar maps are available for Brazil, Chile, China, Mexico, Mongolia <strong>and</strong> Russia in the<br />
online Appendix. Red triangles (blue dots) indicate individual firms (mines). The lower maps zoom in to the area highlighted by the red rectangles in the upper maps. The circles around firms have a 20 km radius. Source: EBRD-World Bank<br />
BEEPS Surveys <strong>and</strong> SNL Metals <strong>and</strong> <strong>Mining</strong>.<br />
Ukraine<br />
Kazakhstan