Mining matters Natural resource extraction and local business constraints
2fCPiMQ
2fCPiMQ

Create successful ePaper yourself
Turn your PDF publications into a flip-book with our unique Google optimized e-Paper software.
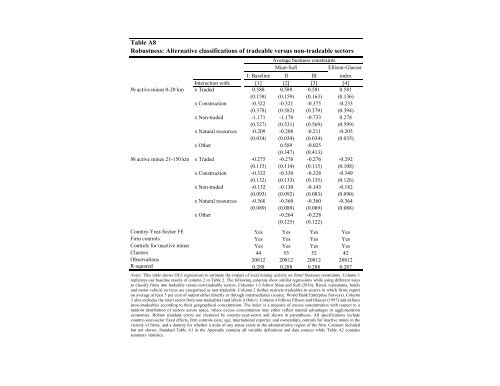
Table A8<br />
Robustness: Alternative classifications of tradeable versus non-tradeable sectors<br />
Average <strong>business</strong> <strong>constraints</strong><br />
Mian-Sufi<br />
Ellison-Glaeser<br />
I: Baseline II III index<br />
Interaction with: [1] [2] [3] [4]<br />
№ active mines 0-20 km x Traded 0.588 0.589 0.581 0.581<br />
(0.158) (0.159) (0.163) (0.136)<br />
x Construction -0.322 -0.321 -0.375 -0.233<br />
(0.378) (0.382) (0.379) (0.394)<br />
x Non-traded -1.171 -1.170 -0.733 0.278<br />
(0.527) (0.531) (0.569) (0.599)<br />
x <strong>Natural</strong> <strong>resource</strong>s -0.209 -0.208 -0.211 -0.205<br />
(0.034) (0.034) (0.034) (0.035)<br />
x Other 0.589 -0.025<br />
(0.347) (0.413)<br />
№ active mines 21-150 km x Traded -0.275 -0.276 -0.276 -0.292<br />
(0.115) (0.114) (0.115) (0.108)<br />
x Construction -0.332 -0.330 -0.328 -0.349<br />
(0.132) (0.133) (0.135) (0.126)<br />
x Non-traded -0.132 -0.130 -0.143 -0.182<br />
(0.093) (0.092) (0.083) (0.090)<br />
x <strong>Natural</strong> <strong>resource</strong>s -0.360 -0.360 -0.360 -0.364<br />
(0.089) (0.089) (0.089) (0.088)<br />
x Other -0.264 -0.228<br />
(0.125) (0.122)<br />
Country-Year-Sector FE Yes Yes Yes Yes<br />
Firm controls Yes Yes Yes Yes<br />
Controls for inactive mines Yes Yes Yes Yes<br />
Clusters 44 53 52 42<br />
Observations 20812 20812 20812 20812<br />
R-squared 0.288 0.288 0.288 0.287<br />
Notes: This table shows OLS regressions to estimate the impact of <strong>local</strong> mining activity on firms' <strong>business</strong> <strong>constraints</strong>. Column 1<br />
replicates our baseline results of column 2 in Table 2. The following columns show similar regressions while using different ways<br />
to classify firms into tradeable versus non-tradeable sectors. Columns 1-3 follow Mian <strong>and</strong> Sufi (2014). Retail, restaurants, hotels<br />
<strong>and</strong> motor vehicle services are categorized as non-tradeable. Column 2 further restricts tradeables to sectors in which firms export<br />
on average at least 5 per cent of output either directly or through intermediaries (source: World Bank Enterprise Surveys). Column<br />
3 also excludes the retail sector from non-tradeables (<strong>and</strong> labels it Other). Column 4 follows Ellison <strong>and</strong> Glaeser (1997) <strong>and</strong> defines<br />
(non-)tradeables according to their geographical concentration. The index is a measure of excess concentration with respect to a<br />
r<strong>and</strong>om distribution of sectors across space, where excess concentration may either reflect natural advantages or agglomeration<br />
economies. Robust st<strong>and</strong>ard errors are clustered by country-year-sector <strong>and</strong> shown in parentheses. All specifications include<br />
country-year-sector fixed effects, firm controls (size, age, international exporter, <strong>and</strong> ownership), controls for inactive mines in the<br />
vicinity of firms, <strong>and</strong> a dummy for whether a mine of any status exists in the administrative region of the firm. Constant included<br />
but not shown. St<strong>and</strong>ard Table A1 in the Appendix contains all variable definitions <strong>and</strong> data sources while Table A2 contains<br />
summary statistics.