ZaraAnnual-English2014

Create successful ePaper yourself
Turn your PDF publications into a flip-book with our unique Google optimized e-Paper software.
12 Financial impact of non-recurring transactions that occurred during the fiscal year and<br />
do not fall within the main activities of the Company<br />
There is no financial impact of non-recurring transactions that occurred during the fiscal year and do not fall within the<br />
main activities of the Company.<br />
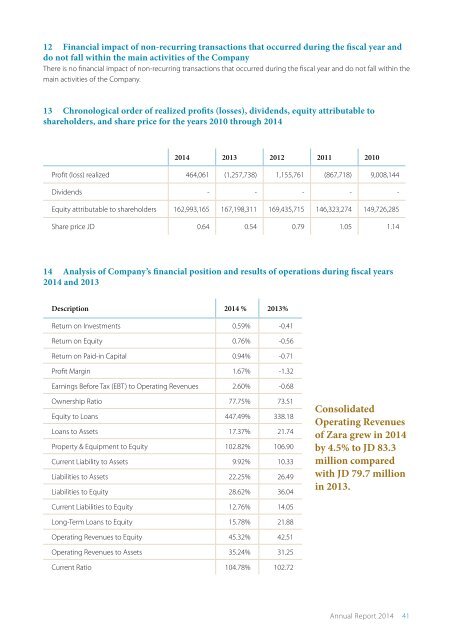
13 Chronological order of realized profits (losses), dividends, equity attributable to<br />
shareholders, and share price for the years 2010 through 2014<br />
2014<br />
2013<br />
2012<br />
2011<br />
2010<br />
Profit (loss) realized<br />
464,061<br />
(1,257,738)<br />
1,155,761<br />
(867,718)<br />
9,008,144<br />
Dividends<br />
-<br />
-<br />
-<br />
-<br />
-<br />
Equity attributable to shareholders<br />
162,993,165<br />
167,198,311<br />
169,435,715<br />
146,323,274<br />
149,726,285<br />
Share price JD<br />
0.64<br />
0.54<br />
0.79<br />
1.05<br />
1.14<br />
14 Analysis of Company’s financial position and results of operations during fiscal years<br />
2014 and 2013<br />
Description 2014 % 2013%<br />
Return on Investments 0.59% -0.41<br />
Return on Equity 0.76% -0.56<br />
Return on Paid-in Capital 0.94% -0.71<br />
Profit Margin 1.67% -1.32<br />
Earnings Before Tax (EBT) to Operating Revenues 2.60% -0.68<br />
Ownership Ratio 77.75% 73.51<br />
Equity to Loans 447.49% 338.18<br />
Loans to Assets 17.37% 21.74<br />
Property & Equipment to Equity 102.82% 106.90<br />
Current Liability to Assets 9.92% 10.33<br />
Liabilities to Assets 22.25% 26.49<br />
Liabilities to Equity 28.62% 36.04<br />
Consolidated<br />
Operating Revenues<br />
of Zara grew in 2014<br />
by 4.5% to JD 83.3<br />
million compared<br />
with JD 79.7 million<br />
in 2013.<br />
Current Liabilities to Equity 12.76% 14.05<br />
Long-Term Loans to Equity 15.78% 21.88<br />
Operating Revenues to Equity 45.32% 42.51<br />
Operating Revenues to Assets 35.24% 31.25<br />
Current Ratio 104.78% 102.72<br />
Annual Report 2014 41