
Create successful ePaper yourself
Turn your PDF publications into a flip-book with our unique Google optimized e-Paper software.
Turn Around, Don’t Drown!<br />
Transportation GIS<br />
CP 6542<br />
Anne Italiano, Amy Perez, Chelsea Leitz, Kim Alistia-Foote
Predicting flooding<br />
impacts of Atlanta and<br />
building alternate<br />
transportation networks<br />
Goal:<br />
Build a model to allow user input of projected<br />
rainfall, analyzing elevation of streets to determine<br />
whether to close streets<br />
Dean Trevelino, 45, stands in flood water from Peachtree Creek. Trevelino<br />
says waters rose to this level when Hurricane Ivan hit five years ago.<br />
http://www.ajc.com/news/news/local/overflowing-peachtree-creek-floodshomes-cars/nQTbB
Agenda<br />
Importance of the Project<br />
Original Goals<br />
Accomplishments<br />
Methodology<br />
Products<br />
Evaluation
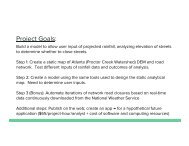
Project Goals:<br />
Build a model to allow user input of projected rainfall, analyzing elevation of streets<br />
to determine whether to close streets.<br />
Step 1: Create a static map of Atlanta (Proctor Creek Watershed) DEM and road<br />
network. Test different inputs of rainfall data and outcomes of analysis.<br />
Step 2: Create a model using the same tools used to design the static analytical<br />
map. Need to determine user inputs.<br />
Step 3 (Bonus): Automate iterations of network road closures based on real-time<br />
data continuously downloaded from the National Weather Service<br />
Additional steps: Publish on the web; create an app → for a hypothetical future<br />
application ($65/project-hour/analyst + cost of software and computing resources)
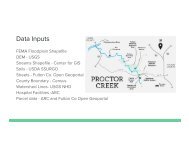
Data Collection<br />
FEMA Floodplain Shapefile<br />
DEM - USGS<br />
Streams Shapefile - Center for GIS<br />
Soils - USDA SSURGO<br />
Streets - Fulton Co. Open Geoportal<br />
County Boundary - Census<br />
Watershed Lines- USGS NHD<br />
Hospital Facilities -ARC<br />
Parcel data - ARC and Fulton Co Open Geoportal
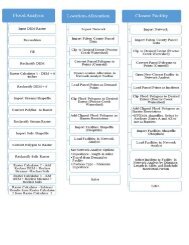
DEM Processing<br />
Flood Analysis<br />
Input DEM Raster<br />
Recondition<br />
Fill<br />
Reclassify DEM
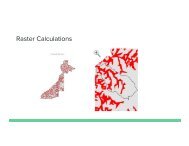
Raster Calculations
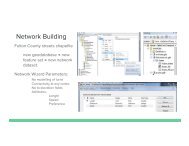
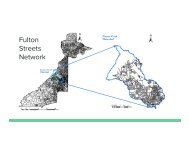
Network Building<br />
Fulton County streets shapefile<br />
new geodatabase → new<br />
feature set → new network<br />
dataset.<br />
Network Wizard Parameters:<br />
No modelling of turns<br />
Connectivity at any vertex<br />
No to elevation fields<br />
Attributes:<br />
Length<br />
Speed<br />
Preference
Fulton<br />
Streets<br />
Network
View of Proctor<br />
Creek by Parcel<br />
(left), and by<br />
Transit Zone<br />
(right), and the<br />
Atlanta city<br />
hospitals serving<br />
demand with<br />
Proctor Creek<br />
and its tributaries<br />
as barriers<br />
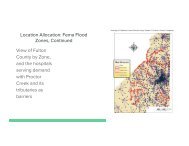
Location Allocation: Fema Flood<br />
Zones
Location Allocation: Fema Flood<br />
Zones, Continued<br />
View of Fulton<br />
County by Zone,<br />
and the hospitals<br />
serving demand<br />
with Proctor<br />
Creek and its<br />
tributaries as<br />
barriers
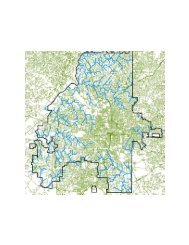
Location Allocation: Soil Flood<br />
Zones<br />
View of Proctor<br />
Creek by<br />
Parcel, and the<br />
hospitals<br />
serving demand<br />
in the event of<br />
widespread<br />
inundation
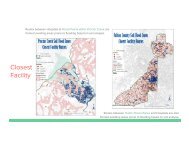
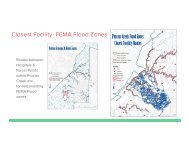
Closest Facility- FEMA Flood Zones<br />
Routes between<br />
Hospitals &<br />
Parcel Points<br />
within Proctor<br />
Creek are<br />
formed avoiding<br />
FEMA Flood<br />
zones
Routes between Hospitals & Parcel Points within Proctor Creek are<br />
formed avoiding areas prone to flooding based on soil analysis<br />
Closest<br />
Facility<br />
Routes between Fulton Parcel Zones and Hospitals are also<br />
formed avoiding areas prone to flooding based on soil analysis
Workflow<br />
of<br />
Model
Roadblocks<br />
HEC-GeoHMS<br />
HAZUS<br />
National Weather Service Dataset - Real time<br />
updates<br />
Tutor<br />
Automation<br />
Model Builder
Evaluation of Goals:<br />
Build a model to allow user input of projected rainfall, analyzing elevation of streets<br />
to determine whether to close streets.<br />
Step 1: Create a static map of Atlanta (Proctor Creek Watershed) DEM and road<br />
network. Test different inputs of rainfall data and outcomes of analysis.<br />
Step 2: Create a model using the same tools used to design the static analytical<br />
map. Need to determine user inputs.<br />
Step 3 (Bonus): Automate iterations of network road closures based on real-time<br />
data continuously downloaded from the National Weather Service<br />
Additional steps: Publish on the web; create an app → for a hypothetical future<br />
application ($65/project-hour/analyst + cost of software and computing resources)
References<br />
ESRI. (2016, March 31). ArcGIS Spatial Analyst Advanced Raster Spatial Analysis. Retrieved from ESRI:<br />
http://www.esri.com/library/brochures/pdfs/spatialanalystbro.pdf<br />
Forster, N. (n.d.). Mitigating Flood Risk Using Geographic Information Systems (G.I.S.). Medicine Hat, Alberta, Canada. Retrieved<br />
March 2016, from icma.org/Documents/Document/Document/20927<br />
Department of Homeland Security. (2016, April 27). Flood Zones. Retrieved April 28, 2016, from http://www.fema.gov/flood-zones<br />
Mioc, D., Nickerson, B., MacGillivray, E., Morton, A., Anton, F., Fraser, D., . . . Liang, G. (2008). Early Warning and Mapping for Flood<br />
Disasters. The International Archives of Photogammetry, Remote Sensing and Spatial Information Sciences, 37, 1507-1512.<br />
Pincott-Miller, D., McGarry, D., Fairweather, H., & Srivastava, S. (2012). Review and framework development for addressing flash flood<br />
potential using GIS assisted spatial-hydrologic modelling. The Queensland Surveying and Spatial Conference . Brsibane, Australia:<br />
Surveying and Spatial Sciences Institute.<br />
The National Weather Service. (2016, March 247). The NWS Advanced Hydrologic Prediction Services (AHPS) and Partner Services.<br />
Retrieved from The National Weather Service: www.weather.gov/gsp/flood_preparedness<br />
Suarez, P., Anderson, W., Mahal, V., & Lashmanan, T. (2005, May 10). Impacts of flooding and climate change on urban<br />
transportation: A systemwide performance assessment of the Boston Metro Area. Retrieved March 20, 2016, from<br />
http://www.sciencedirect.com/science/article/pii/S1361920905000155
Questions?<br />
Thanks!