Create successful ePaper yourself
Turn your PDF publications into a flip-book with our unique Google optimized e-Paper software.
STRATEGY - <strong>QUANT</strong> REPORT<br />
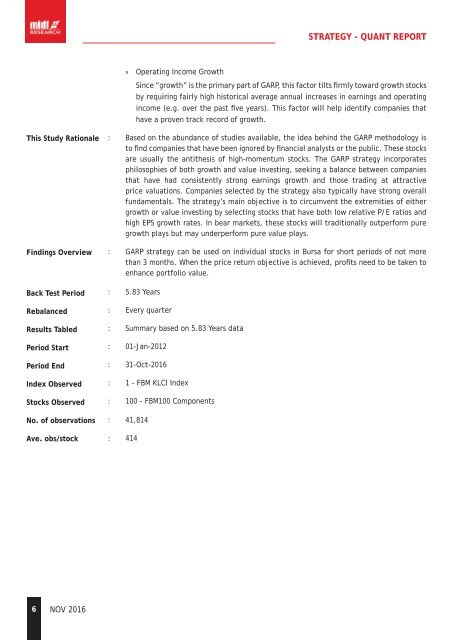
» Operating Income Growth<br />
Since “growth” is the primary part of GARP, this factor tilts firmly toward growth stocks<br />
by requiring fairly high historical average annual increases in earnings and operating<br />
income (e.g. over the past five years). This factor will help identify companies that<br />
have a proven track record of growth.<br />
This Study Rationale<br />
Findings Overview<br />
Back Test Period<br />
Rebalanced<br />
Results Tabled<br />
Period Start<br />
Period End<br />
Index Observed<br />
Stocks Observed<br />
No. of observations<br />
Ave. obs/stock<br />
: Based on the abundance of studies available, the idea behind the GARP methodology is<br />
to find companies that have been ignored by financial analysts or the public. These stocks<br />
are usually the antithesis of high-momentum stocks. The GARP strategy incorporates<br />
philosophies of both growth and value investing, seeking a balance between companies<br />
that have had consistently strong earnings growth and those trading at attractive<br />
price valuations. Companies selected by the strategy also typically have strong overall<br />
fundamentals. The strategy’s main objective is to circumvent the extremities of either<br />
growth or value investing by selecting stocks that have both low relative P/E ratios and<br />
high EPS growth rates. In bear markets, these stocks will traditionally outperform pure<br />
growth plays but may underperform pure value plays.<br />
: GARP strategy can be used on individual stocks in Bursa for short periods of not more<br />
than 3 months. When the price return objective is achieved, profits need to be taken to<br />
enhance portfolio value.<br />
: 5.83 Years<br />
: Every quarter<br />
: Summary based on 5.83 Years data<br />
: 01-Jan-2012<br />
: 31-Oct-2016<br />
: 1 – FBM KLCI Index<br />
: 100 – FBM100 Components<br />
: 41,814<br />
: 414<br />
6 NOV 2016


