

Royalties for RegionS Carbon Project - showcase
R4R%20Carbon%20Magazine%20Aug16
R4R%20Carbon%20Magazine%20Aug16

Create successful ePaper yourself
Turn your PDF publications into a flip-book with our unique Google optimized e-Paper software.
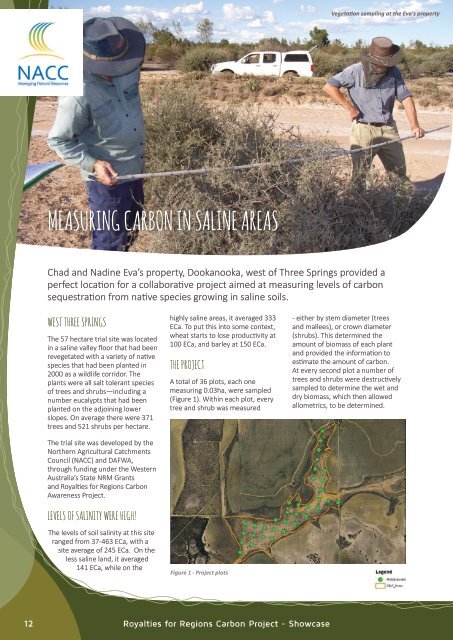
Vegetation sampling at the Eva's property<br />
Measuring carbon in saline areas<br />
Chad and Nadine Eva’s property, Dookanooka, west of Three Springs provided a<br />
perfect location <strong>for</strong> a collaborative project aimed at measuring levels of carbon<br />
sequestration from native species growing in saline soils.<br />
West Three Springs<br />
The 57 hectare trial site was located<br />
in a saline valley floor that had been<br />
revegetated with a variety of native<br />
species that had been planted in<br />
2000 as a wildlife corridor. The<br />
plants were all salt tolerant species<br />
of trees and shrubs—including a<br />
number eucalypts that had been<br />
planted on the adjoining lower<br />
slopes. On average there were 371<br />
trees and 521 shrubs per hectare.<br />
The trial site was developed by the<br />
Northern Agricultural Catchments<br />
Council (NACC) and DAFWA,<br />
through funding under the Western<br />
Australia’s State NRM Grants<br />
and <strong>Royalties</strong> <strong>for</strong> Regions <strong>Carbon</strong><br />
Awareness <strong>Project</strong>.<br />
Levels of salinity were high!<br />
The levels of soil salinity at this site<br />
ranged from 37-463 ECa, with a<br />
site average of 245 ECa. On the<br />
less saline land, it averaged<br />
141 ECa, while on the<br />
highly saline areas, it averaged 333<br />
ECa. To put this into some context,<br />
wheat starts to lose productivity at<br />
100 ECa, and barley at 150 ECa.<br />
The project<br />
A total of 36 plots, each one<br />
measuring 0.03ha, were sampled<br />
(Figure 1). Within each plot, every<br />
tree and shrub was measured<br />
Figure 1 - <strong>Project</strong> plots<br />
- either by stem diameter (trees<br />
and mallees), or crown diameter<br />
(shrubs). This determined the<br />
amount of biomass of each plant<br />
and provided the in<strong>for</strong>mation to<br />
estimate the amount of carbon.<br />
At every second plot a number of<br />
trees and shrubs were destructively<br />
sampled to determine the wet and<br />
dry biomass, which then allowed<br />
allometrics, to be determined.<br />
12<br />
<strong>Royalties</strong> <strong>for</strong> Regions <strong>Carbon</strong> <strong>Project</strong> - Showcase