

CEB Working Paper
240798&r=lma
240798&r=lma

Create successful ePaper yourself
Turn your PDF publications into a flip-book with our unique Google optimized e-Paper software.
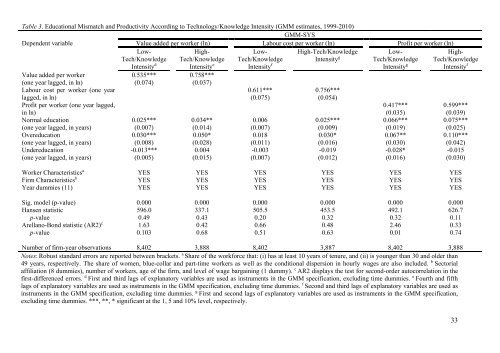
Table 3. Educational Mismatch and Productivity According to Technology/Knowledge Intensity (GMM estimates, 1999-2010)<br />
GMM-SYS<br />
Dependent variable Value added per worker (ln) Labour cost per worker (ln) Profit per worker (ln)<br />
Value added per worker<br />
(one year lagged, in ln)<br />
Labour cost per worker (one year<br />
lagged, in ln)<br />
Profit per worker (one year lagged,<br />
in ln)<br />
Normal education<br />
(one year lagged, in years)<br />
Overeducation<br />
(one year lagged, in years)<br />
Undereducation<br />
(one year lagged, in years)<br />
Low-<br />
Tech/Knowledge<br />
Intensity d<br />
0.535***<br />
(0.074)<br />
0.025***<br />
(0.007)<br />
0.030***<br />
(0.008)<br />
-0.013***<br />
(0.005)<br />
High-<br />
Tech/Knowledge<br />
Intensity e<br />
0.758***<br />
(0.037)<br />
0.034**<br />
(0.014)<br />
0.050*<br />
(0.028)<br />
0.004<br />
(0.015)<br />
Low-<br />
Tech/Knowledge<br />
Intensity f<br />
0.611***<br />
(0.075)<br />
0.006<br />
(0.007)<br />
0.018<br />
(0.011)<br />
-0.003<br />
(0.007)<br />
High-Tech/Knowledge<br />
Intensity g<br />
0.756***<br />
(0.054)<br />
0.025***<br />
(0.009)<br />
0.030*<br />
(0.016)<br />
-0.019<br />
(0.012)<br />
Low-<br />
Tech/Knowledge<br />
Intensity g<br />
0.417***<br />
(0.035)<br />
0.066***<br />
(0.019)<br />
0.067**<br />
(0.030)<br />
-0.028*<br />
(0.016)<br />
High-<br />
Tech/Knowledge<br />
Intensity f<br />
Worker Characteristics a YES YES YES YES YES YES<br />
Firm Characteristics b YES YES YES YES YES YES<br />
Year dummies (11) YES YES YES YES YES YES<br />
Sig. model (p-value) 0.000 0.000 0.000 0.000 0.000 0.000<br />
Hansen statistic 596.0 337.1 505.5 453.5 492.1 626.7<br />
p-value 0.49 0.43 0.20 0.32 0.32 0.11<br />
Arellano-Bond statistic (AR2) c 1.63 0.42 0.66 0.48 2.46 0.33<br />
p-value 0.103 0.68 0.51 0.63 0.01 0.74<br />
0.599***<br />
(0.039)<br />
0.075***<br />
(0.025)<br />
0.110***<br />
(0.042)<br />
-0.015<br />
(0.030)<br />
Number of firm-year observations 8,402 3,888 8,402 3,887 8,402 3,888<br />
Notes: Robust standard errors are reported between brackets. a Share of the workforce that: (i) has at least 10 years of tenure, and (ii) is younger than 30 and older than<br />
49 years, respectively. The share of women, blue-collar and part-time workers as well as the conditional dispersion in hourly wages are also included. b Sectorial<br />
affiliation (8 dummies), number of workers, age of the firm, and level of wage bargaining (1 dummy). c AR2 displays the test for second-order autocorrelation in the<br />
first-differenced errors. d First and third lags of explanatory variables are used as instruments in the GMM specification, excluding time dummies. e Fourth and fifth<br />
lags of explanatory variables are used as instruments in the GMM specification, excluding time dummies. f Second and third lags of explanatory variables are used as<br />
instruments in the GMM specification, excluding time dummies. g First and second lags of explanatory variables are used as instruments in the GMM specification,<br />
excluding time dummies. ***, **, * significant at the 1, 5 and 10% level, respectively.<br />
33