

CEB Working Paper
240798&r=lma
240798&r=lma
SHOW LESS

You also want an ePaper? Increase the reach of your titles
YUMPU automatically turns print PDFs into web optimized ePapers that Google loves.
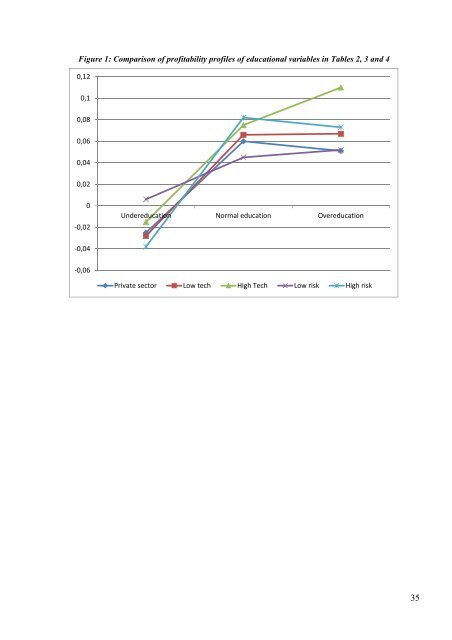
Figure 1: Comparison of profitability profiles of educational variables in Tables 2, 3 and 4<br />
0,12<br />
0,1<br />
0,08<br />
0,06<br />
0,04<br />
0,02<br />
0<br />
‐0,02<br />
Undereducation Normal education Overeducation<br />
‐0,04<br />
‐0,06<br />
Private sector Low tech High Tech Low risk High risk<br />
35