Cheat Perish? A Theory Scientific Customs
n?u=RePEc:tut:cccrwp:2016-03-ccr&r=hpe
n?u=RePEc:tut:cccrwp:2016-03-ccr&r=hpe

You also want an ePaper? Increase the reach of your titles
YUMPU automatically turns print PDFs into web optimized ePapers that Google loves.
Filename: scientificmisbehavior-proofreading-dbspaceAC2.pdf December 1, 2016<br />
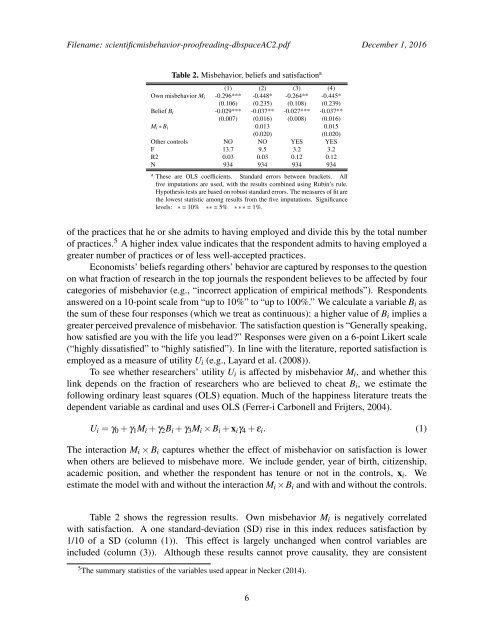
Table 2. Misbehavior, beliefs and satisfaction a<br />
(1) (2) (3) (4)<br />
Own misbehavior M i -0.296*** -0.448* -0.264** -0.445*<br />
(0.106) (0.235) (0.108) (0.239)<br />
Belief B i -0.029*** -0.037** -0.027*** -0.037**<br />
(0.007) (0.016) (0.008) (0.016)<br />
M i ∗ B i 0.013 0.015<br />
(0.020) (0.020)<br />
Other controls NO NO YES YES<br />
F 13.7 9.5 3.2 3.2<br />
R2 0.03 0.03 0.12 0.12<br />
N 934 934 934 934<br />
a These are OLS coefficients. Standard errors between brackets. All<br />
five imputations are used, with the results combined using Rubin’s rule.<br />
Hypothesis tests are based on robust standard errors. The measures of fit are<br />
the lowest statistic among results from the five imputations. Significance<br />
levels: ∗ = 10% ∗∗ = 5% ∗ ∗ ∗ = 1%.<br />
of the practices that he or she admits to having employed and divide this by the total number<br />
of practices. 5 A higher index value indicates that the respondent admits to having employed a<br />
greater number of practices or of less well-accepted practices.<br />
Economists’ beliefs regarding others’ behavior are captured by responses to the question<br />
on what fraction of research in the top journals the respondent believes to be affected by four<br />
categories of misbehavior (e.g., “incorrect application of empirical methods”). Respondents<br />
answered on a 10-point scale from “up to 10%” to “up to 100%.” We calculate a variable B i as<br />
the sum of these four responses (which we treat as continuous): a higher value of B i implies a<br />
greater perceived prevalence of misbehavior. The satisfaction question is “Generally speaking,<br />
how satisfied are you with the life you lead?” Responses were given on a 6-point Likert scale<br />
(“highly dissatisfied” to “highly satisfied”). In line with the literature, reported satisfaction is<br />
employed as a measure of utility U i (e.g., Layard et al. (2008)).<br />
To see whether researchers’ utility U i is affected by misbehavior M i , and whether this<br />
link depends on the fraction of researchers who are believed to cheat B i , we estimate the<br />
following ordinary least squares (OLS) equation. Much of the happiness literature treats the<br />
dependent variable as cardinal and uses OLS (Ferrer-i Carbonell and Frijters, 2004).<br />
U i = γ 0 + γ 1 M i + γ 2 B i + γ 3 M i × B i + x i γ 4 + ε i . (1)<br />
The interaction M i × B i captures whether the effect of misbehavior on satisfaction is lower<br />
when others are believed to misbehave more. We include gender, year of birth, citizenship,<br />
academic position, and whether the respondent has tenure or not in the controls, x i . We<br />
estimate the model with and without the interaction M i ×B i and with and without the controls.<br />
Table 2 shows the regression results. Own misbehavior M i is negatively correlated<br />
with satisfaction. A one standard-deviation (SD) rise in this index reduces satisfaction by<br />
1/10 of a SD (column (1)). This effect is largely unchanged when control variables are<br />
included (column (3)). Although these results cannot prove causality, they are consistent<br />
5 The summary statistics of the variables used appear in Necker (2014).<br />
6