

Immigration Status
pCFC307gQoX
pCFC307gQoX

You also want an ePaper? Increase the reach of your titles
YUMPU automatically turns print PDFs into web optimized ePapers that Google loves.
DC<br />
WASHINGTON, DC<br />
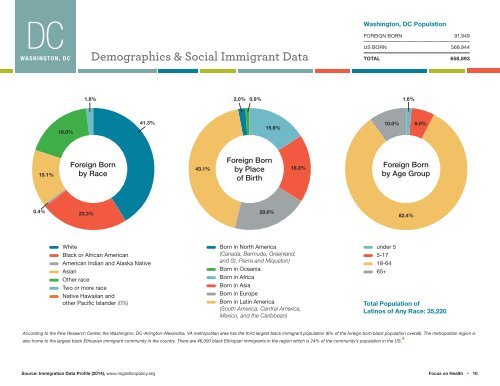
Demographics & Social Immigrant Data<br />
Washington, DC Population<br />
FOREIGN BORN 91,949<br />
US BORN 566,944<br />
TOTAL 658,893<br />
1.8%<br />
2.0% 0.9%<br />
1.6%<br />
18.0%<br />
41.3%<br />
15.9%<br />
10.0%<br />
6.0%<br />
15.1%<br />
Foreign Born<br />
by Race<br />
43.1%<br />
Foreign Born<br />
by Place<br />
of Birth<br />
18.3%<br />
Foreign Born<br />
by Age Group<br />
0.4%<br />
23.3%<br />
20.0%<br />
82.4%<br />
White<br />
Black or African American<br />
American Indian and Alaska Native<br />
Asian<br />
Other race<br />
Two or more race<br />
Native Hawaiian and<br />
other Pacific Islander (0%)<br />
Born in North America<br />
(Canada, Bermuda, Greenland,<br />
and St. Pierre and Miqueton)<br />
Born in Oceania<br />
Born in Africa<br />
Born in Asia<br />
Born in Europe<br />
Born in Latin America<br />
(South America, Central America,<br />
Mexico, and the Caribbean)<br />
under 5<br />
5-17<br />
18-64<br />
65+<br />
Total Population of<br />
Latinos of Any Race: 35,220<br />
According to the Pew Research Center, the Washington, DC-Arlington-Alexandria, VA metropolitan area has the third largest black immigrant population (6% of the foreign born black population overall). The metropolitan region is<br />
also home to the largest black Ethiopian immigrant community in the country. There are 46,000 black Ethiopian immigrants in the region which is 24% of the community’s population in the US. 4<br />
Source: <strong>Immigration</strong> Data Profile (2014), www.migrationpolicy.org Focus on Health • 10