Attention! Your ePaper is waiting for publication!
By publishing your document, the content will be optimally indexed by Google via AI and sorted into the right category for over 500 million ePaper readers on YUMPU.
This will ensure high visibility and many readers!

Your ePaper is now published and live on YUMPU!
You can find your publication here:
Share your interactive ePaper on all platforms and on your website with our embed function

~4 -
Newrahmemails
Newrahmemails

You also want an ePaper? Increase the reach of your titles
YUMPU automatically turns print PDFs into web optimized ePapers that Google loves.
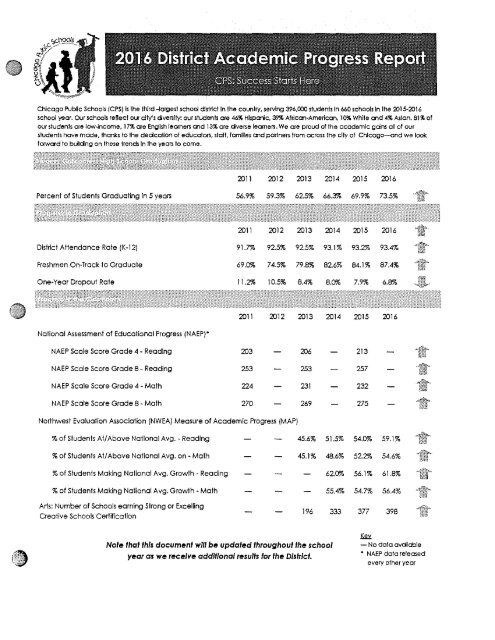
Chicago Public Schools (CPS) Is the third-largest school dlstrlct In tho country, serving 396,000 students In 660 schools In the 2015-2016<br />
school year. Our schools ref1ect ou- dtys dverslty: our students ore 46% Hlsparic, 39% Afrlca,-Amerlcon, 10% White aid 4% Asfon. 81% of<br />
ovr students are low-income, 17% are Engtlsh leaners oid 13% are dverse learners. We ore proud of the academic gcins all of our<br />
students hove made, thanks to the dedcatlon of educclors, staff, femmes and partners from across the city of Chicago-and we look<br />
forwcxd to btilcing on these trends In the yeoo to come.<br />
2011 2012 2013 2014<br />
Percent of Students Graduating In 5 years 56.9% 59.3% 62.5% 66.3%<br />
2011 2012 2013 2014<br />
District Attendance Rate (K-12) 91.7% 925% 925% 93.1%<br />
Freshmen On-Track to Graduate 69.0% 74.5% 79.8% 826%<br />
One-Year Dropout Rate 11.2% 10.5% 8.4% 8.0%<br />
2015 2016<br />
69.9% 73.5% ·11~<br />
2015 2016<br />
•<br />
93.2% 93.4% .... 1 ....<br />
84.1% 87.4% .. 1:ffilr"~<br />
tM<br />
7.9% 6.8% .,ff:?,<br />
National Assessment of Educational Progress (NAEP)"<br />
2011 2012 2013 2014<br />
NAEP Scale Score Grade 4 - Reading 203 206<br />
NAEP Scale Score Grade 8 - Reading 253 253<br />
NAEP Scale Score Grade 4 - Math 224 231<br />
NAEP Scale Score Grade 8 - Math 270 269<br />
Northwest Evaluation Association (NWEA) Measure of Academic Progress (MAP)<br />
% of Students At/ Above Notional Avg. - Reading 45.6% 51.5%<br />
% of Students At/Above National Avg. on - Math 45.1% 48.6%<br />
% of Students Making National Avg. Growth - Reading 620%<br />
% of Students Making National Avg. Growth - Math 55.4%<br />
Arts: Number of Schools earning Strong or Excelnng<br />
Creative Schools Certification<br />
196 333<br />
Nole that this document w/1/ be updated throughout the school<br />
year as we receive additional results for the District.<br />
2015 2016<br />
213<br />
"tt<br />
257 ·l1Jlr·<br />
232<br />
275<br />
¼~<br />
...:,.m:-,.<br />
WkJ<br />
-4@"<br />
g@<br />
54.0% 59.1% -1it·<br />
8."'l<br />
522% 54.6% ·'~tt·<br />
56.1% 61.8%<br />
,,1~,.<br />
54.7% 56.4% .,tf;:;t....<br />
id<br />
377 398 ·1t<br />
kl<br />
- No data avciloble<br />
• NAEP data re!eosed<br />
every other year
Chicago Public Schools (CPS) Is the third-largest school dlstrlct In tho country, serving 396,000 students In 660 schools In the 2015-2016 school year. Our schools ref1ect ou- dtys dverslty: our students ore 46% Hlsparic, 39% Afrlca,-Amerlcon, 10% White aid 4% Asfon. 81% of ovr students are low-income, 17% are Engtlsh leaners oid 13% are dverse learners. We ore proud of the academic gcins all of our students hove made, thanks to the dedcatlon of educclors, staff, femmes and partners from across the city of Chicago-and we look forwcxd to btilcing on these trends In the yeoo to come. 2011 2012 2013 2014 Percent of Students Graduating In 5 years 56.9% 59.3% 62.5% 66.3% 2011 2012 2013 2014 District Attendance Rate (K-12) 91.7% 925% 925% 93.1% Freshmen On-Track to Graduate 69.0% 74.5% 79.8% 826% One-Year Dropout Rate 11.2% 10.5% 8.4% 8.0% 2015 2016 69.9% 73.5% ·11~ 2015 2016 • 93.2% 93.4% .... 1 .... 84.1% 87.4% .. 1:ffilr"~ tM 7.9% 6.8% .,ff:?, National Assessment of Educational Progress (NAEP)" 2011 2012 2013 2014 NAEP Scale Score Grade 4 - Reading 203 206 NAEP Scale Score Grade 8 - Reading 253 253 NAEP Scale Score Grade 4 - Math 224 231 NAEP Scale Score Grade 8 - Math 270 269 Northwest Evaluation Association (NWEA) Measure of Academic Progress (MAP) % of Students At/ Above Notional Avg. - Reading 45.6% 51.5% % of Students At/Above National Avg. on - Math 45.1% 48.6% % of Students Making National Avg. Growth - Reading 620% % of Students Making National Avg. Growth - Math 55.4% Arts: Number of Schools earning Strong or Excelnng Creative Schools Certification 196 333 Nole that this document w/1/ be updated throughout the school year as we receive additional results for the District. 2015 2016 213 "tt 257 ·l1Jlr· 232 275 ¼~ ...:,.m:-,. WkJ -4@" g@ 54.0% 59.1% -1it· 8."'l 522% 54.6% ·'~tt· 56.1% 61.8% ,,1~,. 54.7% 56.4% .,tf;:;t.... id 377 398 ·1t kl - No data avciloble • NAEP data re!eosed every other year
Percent of Students Groduallng In 5 years This Is the 5-year cohort graduation rate. It measures the percent of students who graduate within 5 years of their freshman year. CPS, Ike the Stale of llnnols and other districts across the country, reports both a 4-year and a 5-year graduallon rate. CPS uses the 5-year rate as Its official graduation rate because It Is the best measure of the percent of students who go onto graduate. District Attendance Rate (K-12) Freshmen On-Track to Graduate This Is the percent of students who attend school on an average school day. This Is the percent of students who earn five or more credits and fail no more than 0.5 core courses during their 9th grade year. Being on-frock in the freshman year Is highly predictive of graduation, and this metric Is nationally recognized for guiding Individual schools lo Improve their graduation rates. One-Year Dropout Rate This Is the percent of students In grades 9-12 that drop out during the year. This Includes "unverffied transfers" which are students who may have transferred, buf for whom the school cannot verify the transfer occurred. NAEP The National Assessment of Educational Progress (NAEP) Is also sometimes called fhe "Nation's Report Card," 11 Is administered by fhe US Department of Education every other year lo a representative sample of sfudenls In grades 4 and 8 In reading and mathematics. The results for NAEP are only provided al the Dlslrtct, Stale and National levels, not at the school and student levels. NWEA MAP The Northwest Evaluation Association Measure of Academic Progress (NWEA MAP) Is CPS's primary assessment measure for students In grades 2 through 8. The NWEA MAP Is administered In the spring of each school year district-wide, and optionally In schools In the middle of the school year. The resulls are used at the classroom level to track students' progress toward learning goals and lo tailor Instruction to Individual students. NWEA MAP results are also used in several of the Indicators Included in the SQRP. For more Information on the NWEA MAP, visit www.owea,ora/assessmen1s/mao Arts: Number of Schools earning Strong or Excelfing Creative Schools Certmcatian The Creative Schools Certification measures !he level at which Individual schools meet the goals and priorities outlined in the CPS Art Education Pion. To learn more, vlsit Yf«'N,cosacts.ora/creotive:Schoo\s-cectJficaflon. Mare data Is avanable at www.cps.edu/schoojdqjg. You can also visit each school's progress report onllne at www .cps.edu and searching far a school. The data on these websites wlll be updated as more data becomes available throughout the school year. Learn more about CPS's vision for achieving tts mission of prov)dlng a high-quality public education for every child In every neighborhood, that prepares them far success In college, career, and cammunlfy at www.cps.edu/vislon.
- Page 1 and 2:
~~1y f CHt~4~ i 4 a n ~'~;. m ~I ~4
- Page 3 and 4:
From: Michael Ruemmler Sent: Monday
- Page 5 and 6:
From: Mather, Chris Sent: Monday, M
- Page 7 and 8:
From: Tarrah Cooper [tcooper@chicag
- Page 9 and 10:
ABC 7 News at 4PM: Blagojevich tria
- Page 11 and 12:
communication (including any attach
- Page 13 and 14:
From: Donovan, Stephanie B. [sbd@fr
- Page 15 and 16:
information contained in this e-mai
- Page 17 and 18:
From: Donovan, Stephanie B. [sbd@fr
- Page 19 and 20:
privileged, and is intended only fo
- Page 21 and 22:
From: mayor_re@rahmemail.com Sent:
- Page 23 and 24:
From: Pritzker, Penny [PPritzker@pr
- Page 25 and 26:
From: Mather, Chris Sent: Tuesday,
- Page 27 and 28:
From: Tom Alexander [t Sent: Wednes
- Page 29 and 30:
created and performed by New York-b
- Page 31 and 32:
All events are free but tickets for
- Page 33 and 34:
From: Mather, Chris Sent: Wednesday
- Page 35 and 36:
From: Boutell, Jody [JBoutell@pritz
- Page 37 and 38:
Sent via BlackBerry by AT&T From: "
- Page 39 and 40:
From: Sent: To: Subject: Rauner, Br
- Page 41 and 42:
From: Sent: To: Subject: Rauner, Br
- Page 43 and 44:
A modest proposal: administer the A
- Page 45 and 46:
From: Mather, Chris Sent: Thursday,
- Page 47 and 48:
Last Modified: Jun 2, 2011 02:30PM
- Page 49 and 50:
From: Mather, Chris Sent: Thursday,
- Page 51 and 52:
As an American and a Jew, however,
- Page 53 and 54:
TV is paying the budget cut announc
- Page 55 and 56:
From: Mather, Chris Sent: Thursday,
- Page 57 and 58:
From: Mather, Chris Sent: Thursday,
- Page 59 and 60:
From: mayor_re@rahmemail.com Sent:
- Page 61 and 62:
From: Mather, Chris Sent: Friday, J
- Page 63 and 64:
From: mayor_re@rahmemail.com Sent:
- Page 65 and 66:
From: Cooper, Tarrah Sent: Sunday,
- Page 67 and 68:
From: mayor_re@rahmemail.com [mayor
- Page 69 and 70:
"Email Firewall" made the following
- Page 71 and 72:
looming; and leaders are recognizin
- Page 73 and 74:
of popsicles) to veggie kiosks, or
- Page 75 and 76:
ACKNOWLEDGEMENTS: This report by Th
- Page 77 and 78:
Deborah Harrington, President, Wood
- Page 79 and 80:
INTRODUCTION The Illinois Food Mark
- Page 81 and 82:
1RECOMMENDATIONS State and local go
- Page 83 and 84:
3The State of Illinois should commi
- Page 85 and 86:
5 Local governments should give pri
- Page 87 and 88:
7State and local government and reg
- Page 89 and 90:
9The State of Illinois should conti
- Page 91 and 92:
SELECTED RESOURCES 16 City and Coun
- Page 93:
One Penn Center, Suite 900 • 1617
- Page 118 and 119:
From: Cooper, Tarrah Sent: Thursday
- Page 120 and 121:
From: Sent: To: emanuel.rahm Sunda
- Page 122 and 123:
abject fear of a strike. He worried
- Page 124 and 125:
From: Sent: To: emanuel.rahm Monda
- Page 126 and 127:
From: Cooper, Tarrah Sent: Sunday,
- Page 128 and 129:
From: Michael Sacks [mjs@gcmlp.com]
- Page 130 and 131:
From: Theresa Mintle Sent: Thursday
- Page 132 and 133:
Subject: Re: Suspicious Package Inc
- Page 134 and 135:
cameras in the area will be request
- Page 136 and 137:
From: James Reilly [JReilly@mpea.co
- Page 138 and 139:
The 2011 Chicago Dancing Festival f
- Page 140 and 141:
day. Additional details will be ann
- Page 142 and 143:
And to them, what the mayor's doing
- Page 144 and 145:
to the issue of the terminal. I wou
- Page 146 and 147:
eason to bring Terminal Five into t
- Page 148 and 149:
From: Gary Schankel Sent: Saturday,
- Page 150 and 151:
From: Tom Alexander Sent: Monday, J
- Page 152 and 153:
Sent via BlackBerry by AT&T
- Page 154 and 155:
From: Cooper, Tarrah Sent: Tuesday,
- Page 156 and 157:
From: Chris Mather Sent: Wednesday,
- Page 158 and 159:
From: Howard Tullman [Howard.Tullma
- Page 160 and 161:
From: Sent: To: emanuel.rahm Sunda
- Page 162 and 163:
From: Sent: To: emanuel.rahm Frida
- Page 164 and 165:
Initial notification: Victim: M/B/1
- Page 166 and 167:
Initial notification: Victim M/B/13
- Page 168 and 169:
From: Mc Carthy, Garry F. [garry.mc
- Page 170:
your team that Jim could work with.
- Page 173 and 174:
Accenture in Chicago • Accenture
- Page 175:
Accenture in Chicago Accenture Chic
- Page 180 and 181:
Employee Fundraising • More than
- Page 182 and 183:
From: Faulman, Mike Sent: Saturday,
- Page 184 and 185:
y the addressee(s) named herein and
- Page 186 and 187:
From: Cooper, Tarrah Sent: Sunday,
- Page 188 and 189:
Illinois uses $2 billion of the fed
- Page 190 and 191:
ambi of food pantry: number 41 Dean
- Page 192:
From: Terry McGann To: Franczek, Ja
- Page 196 and 197:
Les
- Page 198 and 199:
The Chicago round follows the seven
- Page 200 and 201:
From: mayor_re@rahmemail.com Sent:
- Page 202 and 203:
From: garry.mccarthy@chicagopolice.
- Page 204 and 205:
From: Howard Tullman [Howard.Tullma
- Page 206 and 207:
PHOEBE HEARST ELEMNTARY GETS COMPLE
- Page 208 and 209:
From: Rohrbaugh, Philmer H [prohrba
- Page 210 and 211:
From: mark.hoplamazian@hyatt.com Se
- Page 212 and 213:
P a g e | 2 volunteers talk about t
- Page 214 and 215:
From: Mc Carthy, Garry F. [garry.mc
- Page 216 and 217:
From: garry.mccarthy@chicagopolice.
- Page 218 and 219:
From: Sent: To: emanuel.rahm Frida
- Page 220 and 221:
From: garry.mccarthy@chicagopolice.
- Page 222 and 223:
From: Sent: To: emanuel.rahm Monda
- Page 224 and 225:
http://www.youtube.com/watch?v=LXdC
- Page 226:
From: Pak, Christine (CCI/HCC) [CPa
- Page 229 and 230:
From: Mintle, Theresa Sent: Friday,
- Page 231 and 232:
As a second footnote, I would add t
- Page 233 and 234:
Date: Thu, 8 Sep 2011 10:58:53 -050
- Page 235 and 236:
and permanently delete the original
- Page 237 and 238:
and permanently delete the original
- Page 239 and 240:
Mark and Matt, Happy to join in if
- Page 241 and 242:
Will do Sent via BlackBerry by AT&T
- Page 243 and 244:
From: Rauner, Bruce V. [brauner@GTC
- Page 245 and 246:
From: mayor_re@rahmemail.com Sent:
- Page 247 and 248:
From: Mc Carthy, Garry F. [garry.mc
- Page 249 and 250:
From: Mather, Chris Sent: Thursday,
- Page 251 and 252:
John - Olaf Scholz (Mayor of Hambur
- Page 253:
partnership. A fitting start to the
- Page 257 and 258:
2 ! ##$ !! , *0 ! $!
- Page 259 and 260:
!*# +!# #*!$%!*$!*! #!+*#+#!+* +$#*
- Page 261 and 262:
-55-&9=> & *$5-&9=9 - E*!6 -
- Page 263 and 264:
->5--559 &95--5&5 &=5--5&& &
- Page 265 and 266:
From: Mc Carthy, Garry F. [garry.mc
- Page 267 and 268:
From: Sent: To: emanuel.rahm Thurs
- Page 269 and 270:
From: mayor_re@rahmemail.com Sent:
- Page 271 and 272:
From: mayor_re@rahmemail.com Sent:
- Page 273 and 274:
From: Mc Carthy, Garry F. [garry.mc
- Page 275 and 276:
From: mayor_re@rahmemail.com Sent:
- Page 277 and 278:
From: mayor_re@rahmemail.com Sent:
- Page 279 and 280:
From: Mc Carthy, Garry F. [garry.mc
- Page 281 and 282:
From: Mc Carthy, Garry F. [garry.mc
- Page 283 and 284:
From: mayor_re@rahmemail.com Sent:
- Page 285 and 286:
From: Mc Carthy, Garry F. [garry.mc
- Page 287 and 288:
From: mayor_re@rahmemail.com Sent:
- Page 289 and 290:
Williams, Eugene E.; Tobias, Matthe
- Page 291 and 292:
From: mayor_re@rahmemail.com Sent:
- Page 293 and 294:
From: Sally Armbruster [sarmbruster
- Page 295 and 296:
From: Jim Reynolds [JimR@Loopcap.co
- Page 297 and 298:
From: David Mosena [David.Mosena@ms
- Page 299 and 300:
From: Mc Carthy, Garry F. [garry.mc
- Page 301 and 302:
From: Mc Carthy, Garry F. [garry.mc
- Page 303 and 304:
"On Thanksgiving morning I had the
- Page 305 and 306:
Police are looking for a 13-year-ol
- Page 307 and 308:
From: Martin Indyk [MINDYK@brooking
- Page 309 and 310:
Because we have a full program, we
- Page 311 and 312:
SATURDAY, DECEMBER 3 Willard Interc
- Page 313 and 314:
12:30 PM Concluding Luncheon Sessio
- Page 315 and 316:
DAVID IGNATIUS MARTIN INDYK BENJAMI
- Page 317 and 318:
AYALA HASSON ISAAC HERZOG DALIA ITZ
- Page 319 and 320:
Warm regards, Jenny Bienemann Jenni
- Page 321 and 322:
From: James Reilly [JReilly@mpea.co
- Page 323 and 324:
e-mail by mistake and delete this e
- Page 325 and 326:
the American electrical grid, with
- Page 327 and 328:
its New York City fleet of trucks.
- Page 329 and 330:
From: Tullman, Glen [Glen.Tullman@a
- Page 331 and 332:
From: Cooper, Tarrah Sent: Thursday
- Page 333 and 334:
Backhoe operator John Dombroski wor
- Page 335 and 336:
From: mayor_re@rahmemail.com Sent:
- Page 337 and 338:
From: marykay.doyle@exeloncorp.com
- Page 339 and 340:
From: James Reilly [JReilly@mpea.co
- Page 341 and 342:
312-506-1262 | P 847-226-7474 | C 9
- Page 343 and 344:
Congratulations! 600 Registered…
- Page 345 and 346:
MyWay Interface Team: A Connected C
- Page 347 and 348:
MyWay Interface Team: A Connected C
- Page 349 and 350:
MyWay Interface Team: A Connected C
- Page 351 and 352:
MyWay Interface Team: A Connected C
- Page 353 and 354:
MyWay Interface Team: A Connected C
- Page 355 and 356:
MyWay Interface Team: A Connected C
- Page 357 and 358:
Pro Interface Team: A Connected Com
- Page 359 and 360:
Pro Interface Team: A Connected Com
- Page 361 and 362:
Pro Interface Team: A Connected Com
- Page 363 and 364:
Pro Interface Team: A Connected Com
- Page 365 and 366:
Pro Interface Team: A Connected Com
- Page 367 and 368:
Pro Interface Team: A Connected Com
- Page 369 and 370:
Pro Interface Team: A Connected Com
- Page 371 and 372:
Pro Interface Team: A Connected Com
- Page 373 and 374:
Welcome Aboard! A Connected Communi
- Page 375 and 376:
2
- Page 377 and 378:
4
- Page 379 and 380:
6
- Page 381 and 382:
Training Program is a collaborative
- Page 383 and 384:
10
- Page 385 and 386:
From: Rod Sierra [ Sent: Wednesday,
- Page 417 and 418:
From: Sally Armbruster [sarmbruster
- Page 419 and 420:
That's especially so since the repo
- Page 421 and 422:
From: Loredo, Shannon Sent: Friday,
- Page 423 and 424:
Tattered finances, broken schools,
- Page 425 and 426:
term, there’s been some misunders
- Page 427 and 428:
to the house leader ship. it didn
- Page 429 and 430:
vigorous press is to problem-solvin
- Page 431 and 432:
Rahm borrows a student’s phone af
- Page 433 and 434:
“So if we bring in little Johnny,
- Page 435 and 436:
From: Mc Carthy, Garry F. [garry.mc
- Page 437 and 438:
From: mayor_re@rahmemail.com Sent:
- Page 439 and 440:
From: Marcia Hale [mlhale@bafuture.
- Page 441 and 442:
From: ELKANN John (FIAT S.P.A.) [jo
- Page 443 and 444:
Special Breakfast Meeting with The
- Page 446 and 447:
From: Sally Armbruster [sarmbruster
- Page 448 and 449:
INCIDENT: 3 PERSONS SHOT / HOMICIDE
- Page 450 and 451:
From: mayor_re@rahmemail.com Sent:
- Page 452 and 453:
From: John Rowe [john.rowe@Rowe950.
- Page 454 and 455:
From: Kauffman, Steve [skauffman@co
- Page 456 and 457:
From: Sarah Hamilton [ Sent: Saturd
- Page 458 and 459:
From: Mc Carthy, Garry F. [garry.mc
- Page 460 and 461:
From: Mooney, Andrew Sent: Wednesda
- Page 462 and 463:
To: Rahm Emanuel Subject: RE: Rahm:
- Page 464 and 465:
From: Mc Carthy, Garry F. [garry.mc
- Page 466 and 467:
From: Daniella Landau [daniella@DLa
- Page 468 and 469:
From: jcb1 Sent: Sunday, June 03, 2
- Page 474 and 475:
From: Marc Utay [mutay@clarion-capi
- Page 476 and 477:
Ametros Financial Corporation P.O.
- Page 478 and 479:
Mandatory Reporting by Professional
- Page 480 and 481:
paets reoeries are sought i large m
- Page 482 and 483:
C. SAVINGS AND SOLUTION As s
- Page 484 and 485:
From: Larry Levy [llevy@Levyrestaur
- Page 486 and 487:
From: Jonathan Schorr [jschorr@NewS
- Page 488:
From: Sarah Hamilton [ Sent: Wednes
- Page 491 and 492:
From: Strand, Kathleen Sent: Saturd
- Page 493 and 494:
847-226-7474 | C 919-800-6050 | F g
- Page 495 and 496:
From: Mooney, Andrew Sent: Thursday
- Page 497 and 498:
From: Mooney, Andrew Sent: Monday,
- Page 499 and 500:
Sent: Jul 10, 2012 1:28 PM > > Than
- Page 501 and 502:
IIT Priority Campus Projects Projec
- Page 503 and 504:
Housing Projects In addition to the
- Page 505 and 506:
Commercial Projects The city is foc
- Page 507 and 508:
From: Strand, Kathleen Sent: Wednes
- Page 509 and 510:
Schaumburg Mayor Al Larsen Illinois
- Page 511 and 512:
From: Green, Melissa Sent: Thursday
- Page 513 and 514:
From: James Reilly [JReilly@mpea.co
- Page 515 and 516:
From: Green, Melissa Sent: Thursday
- Page 517 and 518:
From: Larry Levy [llevy@Levyrestaur
- Page 519 and 520:
Adam and I connected at Chicago Tec
- Page 521 and 522:
exercises. Since many of Retrofit
- Page 523 and 524:
and velocity. Busy people, especial
- Page 525 and 526:
From: Rauner, Bruce V. [brauner@GTC
- Page 527 and 528:
From: Orellana, Andres Sent: Tuesda
- Page 529 and 530:
who rode the perimeter of Lake Mich
- Page 531 and 532:
different philosophies. Emanuel: Pa
- Page 533 and 534:
occupancy to just 82 percent, accor
- Page 535 and 536:
Jury selection wrapped up Tuesday i
- Page 537 and 538:
long-term plans for the 110-story t
- Page 539 and 540:
CBS2 News at 6:00PM: MRE and state
- Page 541 and 542:
JEN GIBBONS: i met so many amazing
- Page 543 and 544:
and especially young people, to red
- Page 545 and 546:
PONCE: from an outsider's perspecti
- Page 547 and 548:
I sincerely hope it won't be last :
- Page 549 and 550:
Charge Station Inc. Phone: 1-800-96
- Page 553 and 554:
From: Tracey Weinberg [tracey.weinb
- Page 555:
that this has had on me. All I coul
- Page 560 and 561:
From: Shannon Carpenter Loredo [ Se
- Page 562 and 563:
Teaching is so important that it sh
- Page 564 and 565:
thoughts were focusing the piece on
- Page 566 and 567:
Yes. When you are ready love to pic
- Page 568 and 569:
From: Howard Tullman [Howard.Tullma
- Page 570 and 571:
From: Pritzker, Penny [PPritzker@ps
- Page 572 and 573:
From: Steve Koch Sent: Tuesday, Oct
- Page 574 and 575:
From: Sent: T 012 2:14 PM To: mayor
- Page 576 and 577:
From: Steve Koch Sent: Monday, Octo
- Page 578 and 579:
From: Siobhan Solomon Sent: Wednesd
- Page 580 and 581:
make that work. Let me know if you
- Page 582 and 583:
--- Abby Hall Department of Advance
- Page 584 and 585:
From: Howard Tullman [Howard.Tullma
- Page 586 and 587:
October 22, 2012 The Honorable Rahm
- Page 588 and 589:
From: Cheryl L. Hyman [chancellorcl
- Page 590 and 591:
From: NewsClips Sent: Friday, Octob
- Page 592 and 593:
ANCHOR: Chicago Police superintende
- Page 594 and 595:
extended two miles — to a rental
- Page 596 and 597:
director of North America. “It's
- Page 598 and 599:
udget the agency unveiled today. Ot
- Page 600 and 601:
Most guests followed the rule, but
- Page 602 and 603:
As the cost of expanding Medicaid t
- Page 604 and 605:
efore 911 calls are received from t
- Page 606 and 607:
approved. It's a three-year deal, a
- Page 609 and 610:
From: mayor_re@rahmemail.com Sent:
- Page 612:
From: Quade, Peggy [Peggy.Quade@all
- Page 616 and 617:
From: Lois Scott [ Sent: Wednesday
- Page 618 and 619:
Memo from Hank Paulson Reflections
- Page 620 and 621:
Zhang Gaoli, frontrunner for Execut
- Page 622 and 623:
From: Trisha Rooney Alden [trooney@
- Page 625 and 626:
From: Loredo, Shannon Sent: Monday,
- Page 627 and 628:
Sent via BlackBerry by AT&T
- Page 629 and 630:
From: NewsClips Sent: Sunday, Janua
- Page 631 and 632:
FOX News at 8:30AM: Governor Quinn
- Page 633 and 634:
CRAIN’S // Joe Cahill Wall Street
- Page 635 and 636:
over and the country became a satel
- Page 637 and 638:
the benefit of a rising real estate
- Page 639 and 640:
severely,” he says. Developers st
- Page 641 and 642:
Big-box chains with business models
- Page 643 and 644:
he purchased and how many remain.
- Page 645 and 646:
ANCHOR: Starting today, you’ll se
- Page 647 and 648:
GOV. QUINN: Sounds like I’ve been
- Page 649 and 650:
From: Rodriguez, Eve Sent: Sunday,
- Page 651 and 652:
From: Camille Hart [chart@fb.com] S
- Page 655 and 656:
From: Pastor Pfleger [pastorpfleger
- Page 661:
Jim Signorelli Founder/CEO 600 W. F
- Page 664 and 665:
From: Dan Gibbons Sent: Wednesday,
- Page 666 and 667:
Year Anniversary eLevating entrePre
- Page 668 and 669:
Celebrating Years in Chicago Join u
- Page 670 and 671:
PRESENTING SPONSOR $ 50,000 • Pri
- Page 672 and 673:
Ann Lurie 440 W. Ontario Street Chi
- Page 674 and 675:
Michael J. Sacks Chief Executive Of
- Page 676 and 677:
From: Mc Carthy, Garry F. [garry.mc
- Page 678 and 679:
From: Christine Kim [ckim@gcmlp.com
- Page 680 and 681:
From: Mike Faulman Sent: Wednesday,
- Page 682 and 683:
quality of life and economic prospe
- Page 684 and 685:
From: Joe Gutman [jgutman@gcmlp.com
- Page 686 and 687:
From: Vitale David Sent: Thursday,
- Page 688 and 689:
> On Tue, Apr 2, 2013 at 11:50 AM,
- Page 690 and 691:
From: Paula Wolff [Paula.Wolff@cm20
- Page 692 and 693:
Wendy Abrams Chief of Communication
- Page 694 and 695:
From: francie schnipke [ Sent: Wedn
- Page 696 and 697:
Such peer-to-peer rental schemes pr
- Page 698 and 699:
many cases they also find themselve
- Page 700 and 701:
From: Diaz, Evelyn Sent: Wednesday,
- Page 702 and 703:
exclusive support for Chicago and w
- Page 704 and 705:
From: mayor_re@rahmemail.com Sent:
- Page 706 and 707:
From: Ellen Alberding [ealberding@j
- Page 708 and 709:
From: Balz, Dan [dan.balz@washpost.
- Page 711 and 712:
FOR IMMEDIATE RELEASE August 22, 20
- Page 713:
From: Gibson, Matthew [Matthew.Gibs
- Page 717 and 718:
From: Jeff Malehorn [Jeff.malehorn@
- Page 719 and 720:
From: Jasmine Magana Sent: Friday,
- Page 721 and 722:
From: Rahm Emanuel [mayor_re@rahmem
- Page 723 and 724:
From: Rahm Emanuel [mayor_re@rahmem
- Page 725 and 726:
From: Rahm Emanuel [mayor_re@rahmem
- Page 727 and 728:
From: Rahm Emanuel [mayor_re@rahmem
- Page 729 and 730:
From: Rahm Emanuel [mayor_re@rahmem
- Page 731 and 732:
From: Jeff Malehorn [Jeff.malehorn@
- Page 733 and 734:
From: Sent: Friday, January 24, 201
- Page 735 and 736:
To: Barbara Byrd Bennett Cc: Timot
- Page 737 and 738:
From: Mc Carthy, Garry F. [garry.mc
- Page 739 and 740:
Subject: Lunch with a friend Start:
- Page 741 and 742:
From: Arny Granat [ Sent: Wednesday
- Page 743 and 744:
From: "George Marquisos" < > Date:
- Page 745 and 746:
Transforming Partnerships Date of E
- Page 747 and 748:
Other Significant Information: Plea
- Page 749 and 750:
AGENDA 2013 ASPEN, COLORADO THURSDA
- Page 751 and 752:
February 20, 2014 The Honorable Rah
- Page 753 and 754:
city's activities during the confer
- Page 755:
From: Hans Detweiler [HDetweiler@cl
- Page 758:
From: Miterko, Kelly [KMiterko@who.
- Page 762 and 763:
it are confidential and intended so
- Page 764 and 765:
Lena From: Maggie Rosado [mailto:mr
- Page 766 and 767:
From: David Boul [ Sent: Friday, Ap
- Page 768 and 769:
From: Nides, Thomas R (FM) Sent: Th
- Page 770 and 771:
Chicago program page Program focus
- Page 772 and 773:
I look forward to seeing you soon.
- Page 774 and 775:
From: John Edwardson [john@johnedwa
- Page 776 and 777:
This e-mail, and any attachments th
- Page 778 and 779:
From: Johnson, Gary [GTJohnson@chic
- Page 780 and 781:
Wednesday, May 28 7:30AM - 3:00PM B
- Page 782 and 783:
-- ABBY MASTERS HALL 608.669.4257
- Page 784 and 785:
Would be honored Send details to my
- Page 786 and 787:
Jeff Essmann (Sherry) President of
- Page 788 and 789:
Corporate Participants Toney Anaya
- Page 790 and 791:
Executive Director, State & Externa
- Page 792 and 793:
- 2 - Saturday, July 12, 2014 (all
- Page 794 and 795:
afternoon Open - 2 - Friday, July 1
- Page 796 and 797:
you believe that you have received
- Page 798 and 799:
Once again, we thank you for your s
- Page 800 and 801:
Dona Sent from my iPhone On Jul 10,
- Page 802 and 803:
From: Cizner, Jenny Sent: Monday, J
- Page 804 and 805:
From: Bridget Gainer [bridget.gaine
- Page 806:
that will substantially increase th
- Page 809 and 810:
minimum wage had kept up with infla
- Page 812 and 813:
Good! I really dislike when the opp
- Page 814:
Chicago, IL 60603 60603 Chicago, IL
- Page 817 and 818:
As representatives of small busines
- Page 819 and 820:
From: Elizabeth Seebeck [ ] Sent: T
- Page 821 and 822:
Subject: American Society of News E
- Page 823 and 824:
From: Jan Starr [janstarr@csc-llc.c
- Page 825 and 826:
Updated 8/2014
- Page 827 and 828:
From: Diaz, Evelyn Sent: Friday, Se
- Page 829 and 830:
From: Giarraputo, Joy E [EXC] [Joy.
- Page 831:
www.ThorntonTomasetti.com The info
- Page 835 and 836:
WHO : • MPEA spokesperson • Con
- Page 837 and 838:
From: Henry Bienen [hsbienen@northw
- Page 839 and 840:
opened by His Highness the Aga Khan
- Page 841 and 842:
2014. More details on the program,
- Page 843 and 844:
OPENING CEREMONY On September 12, 2
- Page 845 and 846:
ARCHITECTURE “The new Toronto Mus
- Page 847 and 848:
Across from the Museum is the Ismai
- Page 849 and 850:
“The Aga Khan Museum will deliver
- Page 851 and 852:
INAUGURAL EXHIBITION AND PERFORMING
- Page 853 and 854:
From: Boone, Michelle [Michelle.Boo
- Page 855 and 856:
flight at O’Hare International Ai
- Page 857 and 858:
-- -------- Original message ------
- Page 859 and 860:
From: Tony Davis [tdavis@lindenllc.
- Page 861 and 862:
From: Rivera, Arnaldo Sent: Thursda
- Page 863 and 864:
From: melissa green [ Sent: Sunday,
- Page 865 and 866:
From: Nelson, Ashli [mailto:Ashli.N
- Page 869 and 870:
From: Debbie Gross (gross) [gross@c
- Page 871 and 872:
From: Kelley Quinn ] Sent: Sunday,
- Page 873 and 874:
From: Kelley Quinn Sent: Tuesday, O
- Page 875 and 876:
Sent: Wednesday, October 29, 2014 1
- Page 877 and 878:
Prague last year. As you can see be
- Page 879 and 880:
From: Mooney, Andrew Sent: Friday,
- Page 881 and 882:
In an ideal revision of it, he adde
- Page 883 and 884:
Attachment(s): "Redmoon 11.08.2014.
- Page 885 and 886:
From: Cizner, Jenny [Jenny.Cizner@c
- Page 887 and 888:
Thanks again for all your help -- a
- Page 889 and 890:
From: Mike Koldyke [mkoldyke@fronte
- Page 891 and 892:
From: Mooney, Andrew Sent: Friday,
- Page 893 and 894:
From: Faulman, Mike [Mike.Faulman@c
- Page 895 and 896:
From: Elizabeth Swanson [ Sent: Thu
- Page 897 and 898:
321 North Clark Street, Suite 1500
- Page 899 and 900:
From: Lupe Jimenez [ljimenez@pcsedu
- Page 901 and 902:
From: Hedy Ratner [hratner@wbdc.org
- Page 903 and 904:
Perspectives Charter Schools 1530 S
- Page 905 and 906:
Perspectives Charter Schools 1530 S
- Page 907 and 908:
Subject: Education Meeting Start: 1
- Page 909 and 910:
Educating for College, Preparing fo
- Page 911 and 912:
From: Cheryl L. Hyman [chancellorcl
- Page 915 and 916:
From: Thompson, Brian L. [brian.tho
- Page 917 and 918:
From: Thompson, Brian L. [Brian.Tho
- Page 919 and 920:
From: Diaz, Evelyn [Evelyn.Diaz@cit
- Page 921 and 922:
From: C H A R L E S S E G A R S [cs
- Page 923 and 924:
Zoning- PMD-2A Google listed as - G
- Page 925:
From: Wilson, Tom [TWILSON@allstate
- Page 928 and 929:
From: Howard Tullman [h@1871.com] S
- Page 930 and 931:
Business Development Director, 1871
- Page 932 and 933:
From: Frank Clark [frank.clark@fmce
- Page 934 and 935:
From: Mooney, Andrew Sent: Friday,
- Page 937 and 938:
President Office 21 December 2014 T
- Page 940 and 941:
From: Mc Carthy, Garry F. [garry.mc
- Page 942 and 943:
From: Mc Carthy, Garry F. [garry.mc
- Page 944 and 945:
From: limj23 [smcnay@cypresscollege
- Page 946 and 947:
From: Michelle Boone [anapaula@alpe
- Page 948:
From: TIME 100 [time100@time.com] S
- Page 951 and 952:
From: Mike Koldyke [mkoldyke@fronte
- Page 953 and 954:
From: Brian T Edwards [bedwards@nor
- Page 955 and 956:
,Henry Bienen Subject: following u
- Page 957 and 958:
ack in session since I have some le
- Page 959 and 960:
with Tyler Blackwell, the Director
- Page 961 and 962:
-- Alan Mather, Principal Lindblom
- Page 963 and 964:
2 expected release in the coming ye
- Page 965 and 966:
From: Henry Bienen [hsbienen@northw
- Page 967 and 968:
a Global City. Along with two of my
- Page 969 and 970:
prefer to wait till we’re back in
- Page 971 and 972:
http://www.english.northwestern.edu
- Page 973 and 974:
connections within this community a
- Page 976 and 977:
From: Michelle Boone [gladis@glamar
- Page 978 and 979:
From: Quinn, Kelley [Kelley.Quinn@c
- Page 980 and 981:
From: Frank Clark [frank.clark@fmce
- Page 982 and 983:
To: "mayor_re@rahmemail.com" Cc: "
- Page 984 and 985:
From: LFPLarry Levy [llevy@levyfami
- Page 986 and 987:
From: Mc Carthy, Garry F. [garry.mc
- Page 988 and 989:
Fr~a~n~ Pc~cl~c~r, a~u~~l [D~F~c~ck
- Page 990 and 991:
Sender: Rahm Emanuel Sent: Wednesd
- Page 992 and 993:
as well. I'm upset about what happe
- Page 994 and 995:
Sent from my BlackBerry 10 smartpho
- Page 996 and 997:
Subject: Drinker Biddle &Reath LLP
- Page 998 and 999:
Not much on barge. Tribune covered
- Page 1000 and 1001:
Thanks very much On Apr 15, 2015 11
- Page 1002 and 1003:
Sender: Rahm Emanuel Sent: Thursda
- Page 1004 and 1005:
On Wednesday, April 15, 2015, Lisa
- Page 1006 and 1007:
Thanks, Jesse Cell (312 Jesse H. R
- Page 1008 and 1009:
Sender: Jasmine Magana < > Sent: Th
- Page 1010 and 1011:
UN10N PACIFIC COF2pORATION 1400 Dou
- Page 1012 and 1013:
Sender: Rahm Emanuel Sent: Friday,
- Page 1014 and 1015:
Sender: Steve Koch < > Sent: Friday
- Page 1016 and 1017:
city plan commission review.April 8
- Page 1018 and 1019:
Jesse :Jesse H. Ruiz :Drinker Biddl
- Page 1020 and 1021:
Sender: Rahm Emanuel Sent: Monday,
- Page 1022 and 1023:
Jesse Cell (312)
- Page 1024 and 1025:
Sender: Rahm Emanuel Sent: Monday,
- Page 1026 and 1027:
Thanks, Jesse Cell (312
- Page 1028 and 1029:
Sender: Rahm Emanuel Sent: Monday,
- Page 1030 and 1031:
Thanks, Jesse Cell (312)
- Page 1032 and 1033:
Sender: Lisa Schrader < Sent: Monda
- Page 1034 and 1035:
Jesse H. Ruiz Drinker Biddle &Reath
- Page 1036 and 1037:
Sender: Lisa Schrader Sent: Monday,
- Page 1038 and 1039:
Jesse Cell (312) Jesse H. Ruiz Drin
- Page 1040 and 1041:
Sender: Rahm Emanuel Sent: Monday,
- Page 1042 and 1043:
On Wed, Apr 15, 2015 at 3:01 PM, Ra
- Page 1044 and 1045:
* * * * * * This message contains i
- Page 1046 and 1047:
REDACTED
- Page 1048 and 1049:
REDACTED
- Page 1050 and 1051:
3. Bronzeville • What's next afte
- Page 1052 and 1053:
i , . O: 913-794-1101 Marcelo@spri
- Page 1054 and 1055:
Marcelo Claure CEO O: 913-794-1101
- Page 1056 and 1057:
BODW 2016 HKDC is inviting Chicago
- Page 1058 and 1059:
Sender: Rahm Emanuel Sent: Wednesd
- Page 1060 and 1061:
1 Information Sheet for BODW Busine
- Page 1062 and 1063:
Gold Peak Ind~str~es (Holdings? Lim
- Page 1064 and 1065:
Sender: Victoria Watkins < Sent: Th
- Page 1066 and 1067:
With innovative private and public
- Page 1068 and 1069:
v✓~ The Connect Chica ~ o Challen
- Page 1070 and 1071:
~' '' y',t Chicago is .............
- Page 1072 and 1073:
..11 .: ~..:,Y::~..;:,;. ..- .....
- Page 1074 and 1075:
:::: Augment existing ~Y~~~~ :: .:.
- Page 1076 and 1077:
u,3t f SF'tt"3YE'%£Y~#3Es.~. ~'t#F
- Page 1078 and 1079:
Sender: Sent: Recipient: Subject: R
- Page 1080 and 1081:
Sender: Robert J. Zimmer Sent: Fri
- Page 1082 and 1083:
Company Location Jake Barton Local
- Page 1084 and 1085:
Josh McManus Rock Ventures Detroit,
- Page 1086 and 1087:
Sender: Rahm Emanuel Sent: Friday,
- Page 1088 and 1089:
Gary,IN ~.~`~ Corliss Garner BMO Ha
- Page 1090 and 1091:
VanMeter •.r.Bullhorn Creative Lo
- Page 1092 and 1093:
Sender: Rahm Emanuel Sent: Monday,
- Page 1094 and 1095:
Sender: Joe Deal < > Sent: Wednesda
- Page 1096 and 1097:
Sender: Joe Deal < > Sent: Friday,
- Page 1098 and 1099:
Sender: Rahm Emanuel Sent: Saturda
- Page 1100 and 1101:
From: Ginger Evans [mailto: Sent: S
- Page 1102 and 1103:
~ Term Sheet Commissioner Departmen
- Page 1104 and 1105:
...................................
- Page 1106 and 1107:
End location: Midway Airport, FBO A
- Page 1108 and 1109:
Sender: Brodsky, Bill Sent: Monday
- Page 1110 and 1111:
Sender: Mayor_re@rahmemail.com Sen
- Page 1112 and 1113:
Sender: Hamson, Dean Sent: Friday,
- Page 1114 and 1115:
Timing/Revenue to the City: * Sport
- Page 1116 and 1117:
only through cellphones; social gam
- Page 1118 and 1119:
Per our discussion Key consideratio
- Page 1120 and 1121:
Sender: Rahm Emanuel Sent: Thursda
- Page 1122 and 1123:
Sender: Luis Junenez < Sent: Friday
- Page 1124 and 1125:
SHUFEN ZHAO Director of Internation
- Page 1126 and 1127:
~, ~ :. Sender: Luis Jimenez < Sent
- Page 1128 and 1129:
Director of International Programs
- Page 1130 and 1131:
Sender: Rahm Emanuel Sent: Wednesd
- Page 1132 and 1133:
f f I ~L6ERPAAN—a~hlO ~I~IAi'JU 6
- Page 1134 and 1135:
Sender: Rahm Emanuel Sent: Friday,
- Page 1136 and 1137:
Sender: Adam Collins < > Sent: Satu
- Page 1138 and 1139:
Daily Press Guidance Mayor Rahm Ema
- Page 1140 and 1141:
Sender: Adam Collins < Sent: Sunday
- Page 1142 and 1143:
,. Daily Press Guidance Mayor Rahm
- Page 1144 and 1145:
Sender: Adam Collins Sent: Tuesday,
- Page 1146 and 1147:
Daily Press Guidance Mayor Rahm Ema
- Page 1148 and 1149:
Daily Press Guidance Mayor Rahm Ema
- Page 1150 and 1151:
Third, it gives Sullivan the benefi
- Page 1152 and 1153:
Sincerely, Joe Alderman Joe Moore C
- Page 1154 and 1155:
On the other hand, if Noble or anot
- Page 1156 and 1157:
Please note: Simply forwarding the
- Page 1158 and 1159:
Sender: Adam Collins < Sent: Thursd
- Page 1160 and 1161:
Daily Press Guidance Mayor Rahm Ema
- Page 1162 and 1163:
Daily Press Guidance Mayor Rahm Ema
- Page 1164 and 1165:
Daily Press Guidance Mayor Rahm Ema
- Page 1166 and 1167:
Sender: Adam Collins < Sent: Friday
- Page 1168 and 1169:
Daily Press Guidance Mayor Rahm Ema
- Page 1170 and 1171:
Sender: Adam Collins Sent: Saturday
- Page 1172 and 1173:
~:_. j Daily Press Guidance Mayor R
- Page 1174 and 1175:
Sender: Mike Rendina < Sent: Saturd
- Page 1176 and 1177:
Daily Press Guidance Mayor Rahm Ema
- Page 1178 and 1179:
Daily Press Guidance Mayor Rahm Ema
- Page 1180 and 1181:
Daily Press Guidance Mayor Rahm Ema
- Page 1182 and 1183:
`~'. Daily Press Guidance Mayor Rah
- Page 1184 and 1185:
Sender: Adam Collins Sent: Wednesda
- Page 1186 and 1187:
Daily Press Guidance Mayor Rahm Ema
- Page 1188 and 1189:
Daily Press Guidance Mayor Rahm Ema
- Page 1190 and 1191:
Daily Press Guidance Mayor Rahm Ema
- Page 1192 and 1193:
Sender: Rahm Emanuel Sent: Wednesd
- Page 1194 and 1195:
Sender: Rahm Emanuel Sent: Wednesd
- Page 1196 and 1197:
Daily Press Guidance Mayor Rahm Ema
- Page 1198 and 1199:
Daily Press Guidance Mayor Rahm Ema
- Page 1200 and 1201:
Daily Press Guidance Mayor Rahm Ema
- Page 1202 and 1203:
Sender: david spielfogel > Sent: Th
- Page 1204 and 1205:
Sender: Adam Collins < Sent: Sunday
- Page 1206 and 1207:
- Daily Press Guidance Mayor Rahm E
- Page 1208 and 1209:
Daily Press Guidance Mayor Rahm Ema
- Page 1210 and 1211:
Sender: Victoria Watkins < Sent: Mo
- Page 1212 and 1213:
Sender: Adam Collins < Sent: Tuesda
- Page 1214 and 1215:
Daily Press Guidance Mayor Rahm Ema
- Page 1216 and 1217:
Daily Press Guidance Mayor Rahm Ema
- Page 1218 and 1219:
~. Daily Press Guidance Mayor Rahm
- Page 1220 and 1221:
Daily Press Guidance Mayor Rahm Ema
- Page 1222 and 1223:
Sender: Rahm Emanuel Sent: Tuesday
- Page 1224 and 1225:
Sender: Hermene Hartman Sent: Tues
- Page 1226 and 1227:
Sender: Rahm Emanuel Sent: Thursda
- Page 1228 and 1229:
Sender: Rahm Emanuel Sent: Monday,
- Page 1230 and 1231:
Sender: Rahm Emanuel Sent: Monday,
- Page 1232 and 1233:
Sender: Rahm Emanuel Sent: Tuesday
- Page 1234 and 1235:
Thank you for everything you've don
- Page 1236 and 1237:
Sender: Don Welsh Sent: Wednesday,
- Page 1238 and 1239:
Sender: jackma Sent: Friday, June
- Page 1240 and 1241:
Sender: Rahm Emanuel Sent: Saturda
- Page 1242 and 1243:
Sender: Ruiz, Jesse Sent: Saturday
- Page 1244 and 1245:
Sender: Janey Rountree Sent: Saturd
- Page 1246 and 1247:
Sender: Rahm Emanuel Sent: Sunday,
- Page 1248 and 1249:
Drinker Biddle & Reath LLP is a Del
- Page 1250 and 1251:
}~~~ ~ Please let me know if you ha
- Page 1252 and 1253:
the claim. The Auditor General foun
- Page 1254 and 1255:
' o Keating A legislative mandate f
- Page 1256 and 1257:
Ambiguities surrounding the AMA Gui
- Page 1258 and 1259:
Sender: Rahm Emanuel Sent: Monday,
- Page 1260 and 1261:
Sender: Dold, Bruce Sent: Thursday
- Page 1262 and 1263:
Sender: Rahm Emanuel Sent: Friday,
- Page 1264 and 1265:
Sender: Rahm Emanuel Sent: Thursda
- Page 1266 and 1267:
Daily Press Guidance Mayor Rahm Ema
- Page 1268 and 1269:
Sender: Adam Collins < Sent: Tuesda
- Page 1270 and 1271:
Daily Press Guidance Mayor Rahm Ema
- Page 1272 and 1273:
Daily Press Guidance Mayor Rahm Ema
- Page 1274 and 1275:
Daily Press Guidance Mayor Rahm Ema
- Page 1276 and 1277:
Sender: Adam Collins < Sent: Wednes
- Page 1278 and 1279:
Daily Press Guidance Mayor Rahm Ema
- Page 1280 and 1281:
Daily Press Guidance Mayor Rahm Ema
- Page 1282 and 1283:
Sender: Adam Collins < > Sent: Thur
- Page 1284 and 1285:
Daily Press Guidance Mayor Rahm Ema
- Page 1286 and 1287:
Daily Press Guidance Mayor Rahm Ema
- Page 1288 and 1289:
Sender: Adam Collins < Sent: Friday
- Page 1290 and 1291:
Sender: Rahm Emanuel
- Page 1292 and 1293:
Sender: Rahm Emanuel Sent: Saturda
- Page 1294 and 1295:
Daily Press Guidance Mayor Rahm Ema
- Page 1296 and 1297:
Daily Press Guidance Mayor Rahm Ema
- Page 1298 and 1299:
,` Daily Press Guidance Mayor Rahm
- Page 1300 and 1301:
'~~~✓ Anew UIGCCC compact: Altern
- Page 1302 and 1303:
Sender: Rahm Emanuel Sent: Saturda
- Page 1304 and 1305:
Daily Press Guidance Mayor Rahm Ema
- Page 1306 and 1307:
Daily Press Guidance Mayor Rahm Ema
- Page 1308 and 1309:
Daily Press Guidance Mayor Rahm Ema
- Page 1310 and 1311:
Sender: Adam Collins < Sent: Tuesda
- Page 1312 and 1313:
Daily Press Guidance Mayor Rahm Ema
- Page 1314 and 1315:
Daily Press Guidance Mayor Rahm Ema
- Page 1316 and 1317:
Sender: Victoria Watkins < Sent: We
- Page 1318 and 1319:
' '`:?` Daily Press Guidance Mayor
- Page 1320 and 1321:
Daily Press Guidance Mayor Rahm Ema
- Page 1322 and 1323:
Sender: pain levy Sent: Monday, Jul
- Page 1324 and 1325:
do not hesitate to contact me. resp
- Page 1328 and 1329:
Introduction The Task Deloitte has
- Page 1330 and 1331:
Introduction, co~~t'~ ■ Success R
- Page 1332:
Introduction, coa~t'd ■ John Pfei
- Page 1335 and 1336:
Executive Summary, coat 'd Funding
- Page 1337 and 1338:
~.,{ ~..~,~{_ ». w.,,..... oo_~_..
- Page 1339 and 1340:
(~,:. Existing 211 Funding Models H
- Page 1341 and 1342:
Existing 211 Funding Models, cont'd
- Page 1343 and 1344:
Existing 211 Funding Models, Michig
- Page 1345 and 1346:
Existing 211 Funding 1Vlodels, cont
- Page 1347 and 1348:
Existing 211 Funding Models, c~nt'c
- Page 1349 and 1350:
Existing 211 Funding Models, cant'd
- Page 1351:
Existing 211 Funding Models, cont'd
- Page 1354 and 1355:
Potential Funding Sources, cont'd C
- Page 1356 and 1357:
Potential Funding Sources, col~zt'd
- Page 1358 and 1359:
Potential Funding Sources, c~ont'd
- Page 1360 and 1361:
Potential Funding Sources, coJ~t'~
- Page 1362 and 1363:
T f: `G . ;. ;' { r 'J. i,3 `1 .:~
- Page 1364 and 1365:
Chicago-metro 211 Value Proposition
- Page 1366 and 1367:
Chicago-metro 211 Value Proposition
- Page 1368 and 1369:
Chicago-metro 211 Value Proposition
- Page 1371 and 1372:
Proposed Next Steps Introduction Th
- Page 1373 and 1374:
Proposed Next Steps Business Case C
- Page 1375 and 1376:
Appendix: Chicago-metro 211 Value P
- Page 1377 and 1378:
Appendix: Chicago-metro 211 Value P
- Page 1379 and 1380:
Appendix: Chicago-metro 211 Value P
- Page 1381 and 1382:
Appendix: 211 San Diego, .~~lu~~t~a
- Page 1383 and 1384:
Appendix: 211 San Diego, ll~~~~t~c~
- Page 1385 and 1386:
__ ~ ~r ~ '~ Agenda Context of Stud
- Page 1387 and 1388:
PAGE 4 Context of Study National 21
- Page 1389 and 1390:
i C PAGE 6 Business Case i Presenta
- Page 1391 and 1392:
Funding Models Learning from Experi
- Page 1393 and 1394:
Value Proposition Benefits Achieved
- Page 1395 and 1396:
PAGE 12 Proposed Next Steps Critica
- Page 1397 and 1398:
February 12, 2015 To: Department of
- Page 1399:
DISTRIBUTION OF CALLS BY NEED - 201
- Page 1402 and 1403:
U :i~ Population Covered By Service
- Page 1404 and 1405:
o St. o Quad o Path o Path o Path o
- Page 1406 and 1407:
Sender: Tarrah Cooper < Sent: Frida
- Page 1408 and 1409:
Sender: Rahm Emanuel Sent: Friday,
- Page 1410 and 1411:
-Z.5% . ~~ 2015 $691,475.00 2014 $6
- Page 1412 and 1413:
Sender: Sean Rapelyea < > Sent: Sat
- Page 1414 and 1415:
+12.1% 7:00 2015 $920,550 2014 $787
- Page 1416 and 1417:
To: Sean Rapelyea < > Sent from my
- Page 1418 and 1419:
Sender: sean.rapelyea < Sent: Monda
- Page 1420 and 1421:
dissemination, distribution, printi
- Page 1422 and 1423:
w. Recipient: :i';tk+, Sender: Vict
- Page 1424 and 1425:
Sender: Clothilde Ewing < > Sent: T
- Page 1426 and 1427:
Sender: Rahm Emanuel Sent: Thursda
- Page 1428 and 1429:
Sender: Paula Wolff Sent: Friday,
- Page 1430 and 1431:
GRV Securities LLC, member F1NRA, s
- Page 1432 and 1433:
in Illinois would benefit substanti
- Page 1434 and 1435:
Sender: Sent: Recipient: Subject: R
- Page 1436 and 1437:
California issuers. "Generally spea
- Page 1438 and 1439:
Sender: CAROLE BROWN < Sent: Monday
- Page 1440 and 1441:
PRECIS° U.S. METRO MIDWEST ~~'~~ C
- Page 1442 and 1443:
About Moody's Analytics Economic &C
- Page 1444 and 1445:
ecipient of this e-mail (or the per
- Page 1446 and 1447:
Sender: Rahm Emanuel Sent: Wednesd
- Page 1448:
From: "Cullerton, John J." Date: J
- Page 1451 and 1452:
From: Mc Carthy, Garry F. [garry.mc
- Page 1453 and 1454:
Sender: Mike Faulman < Sent: Monday
- Page 1455 and 1456:
Sender: Rahm Emanuel Sent: Monday,
- Page 1457 and 1458:
Y~' Sender: melissa green Sent: Mon
- Page 1459 and 1460:
~:r~'~ Oliver Wyman has chosen Chic
- Page 1462 and 1463:
N JUST 2.5 DAYS YOU CAN EXPECT •
- Page 1464 and 1465:
AGENDA MONDAY, OCTOBER 12, 2015 Reg
- Page 1466 and 1467:
iop N us CONTACT US The 2015 Health
- Page 1469 and 1470:
Sender: Kristin Groos Richmond Sen
- Page 1471 and 1472:
Sender: Jim Steyer Sent: Tuesday,
- Page 1473 and 1474:
Sei►der: Rahm Emanuel Sent: Thur
- Page 1475 and 1476:
MAYOR'S OFFICE -CITY OF CHICAGO =~;
- Page 1477 and 1478:
the facilities and campus environme
- Page 1479 and 1480:
Sender: Rahm Emanuel Sent: Sunday,
- Page 1481 and 1482:
Sender: Joe Moore Sent: Monday, Au
- Page 1483 and 1484:
~:;, Sender: Joe Moore Sent: Monda
- Page 1485 and 1486:
Sender: Rahm Emanuel Sent: Monday,
- Page 1487 and 1488:
Sender: Rahm Emanuel Sent: Monday,
- Page 1489 and 1490:
Nfa~~~~lj+a~rm~l July 27, 2015 The
- Page 1491 and 1492:
after Broad. Best, RB Ronald Browns
- Page 1493 and 1494:
Ronald Brownstein Editorial Directo
- Page 1495 and 1496:
Sender: Rahm Emanuel Sent: Tuesday
- Page 1497 and 1498:
Sender: Rahm Emanuel Sent: Wednesd
- Page 1499 and 1500:
Sender: Rahm Emanuel Sent: Wednesd
- Page 1501 and 1502:
Sender: Paul levy < > Sent: Wednesd
- Page 1503 and 1504:
Sender: Rahm Emanuel Sent: Thursda
- Page 1505 and 1506:
Princeton office is Jonathan I. Eps
- Page 1507 and 1508:
Sender: Charlie Jones Sent: Friday
- Page 1509 and 1510:
Sender: Robert Pruzan Sent: Friday
- Page 1511 and 1512:
Current Situation ~`~'~~" ~ CENTEIi
- Page 1513 and 1514:
'~ Addressing the Budget Gap Chicag
- Page 1515 and 1516:
~_ Debt Summary Chicago tax base is
- Page 1517 and 1518:
'$~~~ CENTERdV1EW PARTNEt25 ~ -~r H
- Page 1519 and 1520:
Introduction to Centerview Partners
- Page 1521 and 1522:
Sender: Scher, PeterL Sent: Friday
- Page 1523 and 1524:
Sender: Mike Rendina < > Sent: Sund
- Page 1525 and 1526:
Below is our proposal for your disc
- Page 1527 and 1528:
'''~,,~ y.. ~:..... p"c g q 4: i~^~
- Page 1529 and 1530:
The information contained in this c
- Page 1531 and 1532:
Sender: Michael Sacks Sent: Thursd
- Page 1533 and 1534:
Sender: Ron Brownstein Sent: Thurs
- Page 1535 and 1536:
CENTER~VIEW PARTNERS .... ~~ Discus
- Page 1537 and 1538:
Budget Gap Reductions Over the past
- Page 1539 and 1540:
~ ~ ~ Pension Issues Increasing pen
- Page 1541 and 1542:
Union Negotiation Overview The City
- Page 1543 and 1544:
Debt Summary The City projected app
- Page 1545 and 1546:
s i Illustrative Income Tax Increas
- Page 1547 and 1548:
Potential Chicago Privatizations Al
- Page 1549 and 1550:
Appendix ~.;~~ ,'~. ,~ys~?' CENTERI
- Page 1551 and 1552:
Chicago Union Fact Sheet Category B
- Page 1553 and 1554:
ones Day —Relevant Experience Jon
- Page 1555 and 1556:
Sender: Robert Pruzan Sent: Monday
- Page 1557 and 1558:
Sender: Rahm Emanuel Sent: Monday,
- Page 1559 and 1560:
From: Abramson, Jerry [Jerry_E Abra
- Page 1561 and 1562:
s/zo/Zs U.S.-China Climate Leaders
- Page 1563 and 1564:
From: Green, Melissa [Melissa.Green
- Page 1565 and 1566:
Sender: Michael Sacks Sent: Thursd
- Page 1567 and 1568:
Eric, > Great catching up today. I
- Page 1569 and 1570:
Sender: Rahm Emanuel Sent: Saturda
- Page 1571 and 1572:
Sender: LFPLarry Lery Sent: Sunday
- Page 1573 and 1574:
Sender: david spielfogel < Sent: Su
- Page 1575 and 1576:
Sender: Sent: ~`- Recipient: Rahm E
- Page 1577 and 1578:
~i.\%1..r0, . ~). ` ~ii~~c~ss n~:~t
- Page 1579 and 1580:
Content i. New American University
- Page 1581 and 1582:
U ar er ~,~ ~ . comprehensive publi
- Page 1583 and 1584:
es~ ■ n s ~ ■ ra ions ■ Lever
- Page 1585 and 1586:
~~~. leadership ~~ ~~ ~ ~~~~~~~ •
- Page 1587 and 1588:
~~ ASU as a global center r ~ ~~
- Page 1589 and 1590:
ii. Enterprise Snapshot
- Page 1591 and 1592:
~~ ~✓ -~ t ~~~ Research expenditu
- Page 1593 and 1594:
T.?::• w.. ..:: :;.::; .°~e~ ..:
- Page 1595 and 1596:
L J Why Do We Need to Modify the En
- Page 1597 and 1598:
Total UG enrollment has increased b
- Page 1599 and 1600:
Pell recipients make up almost twic
- Page 1601 and 1602:
S ~* ASU has expanded and will main
- Page 1603 and 1604:
~f/ Graduation rate improvements ar
- Page 1605 and 1606:
ASU is achieving its targets for de
- Page 1607 and 1608:
.~ ASU ranks 18t" among Carnegie Do
- Page 1609 and 1610:
1. Progress in Degree Completion 1.
- Page 1611 and 1612:
1. Progress in Degree Completion 1.
- Page 1613 and 1614:
1. Progress in Degree Completion 1.
- Page 1615 and 1616:
~~ ~~ 1. Progress in Degree Complet
- Page 1617 and 1618:
2. Improving Learning Outcomes 2.1
- Page 1619 and 1620:
2. Improving Learning Outcomes 2.3
- Page 1621 and 1622:
~c~'~ , 3. Co-Curricular Innovation
- Page 1623 and 1624:
4. Further Advance Student Success
- Page 1625 and 1626:
4. Further Advance Student Success
- Page 1627 and 1628:
~~ ~ , ~ ~ ~ ~ Maricopa to ASU Path
- Page 1629 and 1630:
Measuring the i..-.~. 3 £r c E~{ri
- Page 1631 and 1632:
~~~.~ ~ :s€€ ~x:~~t~3~S 'Yc.3x`
- Page 1633 and 1634:
~/' ~ t ~ ~J Higher education needs
- Page 1635 and 1636:
~ ~f ASU Prep Academy demonstrates
- Page 1637 and 1638:
Ca p acit Y to Serve More Students
- Page 1639 and 1640:
- Advancing Research • Mayo Clini
- Page 1641 and 1642:
v. EdPlus ASU Snapshot of selected
- Page 1644 and 1645:
skcubratS College Achievement Play
- Page 1646:
June 16, 2014 "Michael Crow thinks
- Page 1652 and 1653:
v;< +:v y.
- Page 1654:
Digital Learning Platform Over 150
- Page 1657 and 1658:
Sender: Rahm Emanuel Sent: Tuesday
- Page 1659 and 1660:
Dunbar. Let me know if I can work w
- Page 1661 and 1662:
Sender: Rahm Emanuel Sent: Wednesd
- Page 1663 and 1664:
Sender: Jasmine Magana Sent: Thursd
- Page 1665 and 1666:
Sender: Rahm Emanuel Sent: Thursda
- Page 1667 and 1668:
Sender: Rahm Emanuel Sent: Friday,
- Page 1669 and 1670:
Sender: Peter Cunningham Sent: Mon
- Page 1671 and 1672:
Sender: Ruiz, Jesse Sent: Wednesda
- Page 1673 and 1674:
Sender: Melinda Kelly Sent: Wednes
- Page 1675:
~~~ ~b4 'v'vriii~ .;1.,+,~w.:~ G';
- Page 1679 and 1680:
APPENDIX A CERTIFICATION ATTENDEE I
- Page 1681 and 1682:
Audit APPENDIX A -CERTIFICATION ATT
- Page 1683 and 1684:
~w~F• ,~F~ .;nf4 ti,5` :lX~: ~7,
- Page 1685 and 1686:
Sender: Ruiz, Jesse Sent: Wednesda
- Page 1687 and 1688:
Sender: Rahm Emanuel Sent: Thursda
- Page 1689 and 1690:
tax slapped on a pack of cigarettes
- Page 1691 and 1692:
Sender: Ruiz, Jesse Sent: Friday,
- Page 1693 and 1694:
To: The 100,000 Opportunities Initi
- Page 1695 and 1696:
~' The Chicago Opportunity Fair &Fo
- Page 1697 and 1698:
Sender: Finnegan, Paul J. Sent: Fr
- Page 1699 and 1700:
Sender: Matt O'Shea Sent: Sunday,
- Page 1701 and 1702:
Sender: melissa green Sent: Thursda
- Page 1703 and 1704:
for 301ocations (and growing). We h
- Page 1705 and 1706:
addressed to you in error, please d
- Page 1707 and 1708:
, "shl(cr~,uchica~o.edu" , "liliana
- Page 1709 and 1710:
From: Bershadskaya, Eleonora Sent:
- Page 1711 and 1712:
Sent: Tuesday, September 29, 2015 4
- Page 1713 and 1714:
PRELIMINARY NOTIFICATION VIA BT. 30
- Page 1715 and 1716:
e-mail The contents of this e-mail
- Page 1717 and 1718:
STATEMENT TO CHICAGO PARK DISTRICTS
- Page 1719 and 1720:
Sender: Rahm Emanuel Sent: Wednesd
- Page 1721 and 1722:
Sender: Rahm Emanuel Sent: Wednesd
- Page 1723 and 1724:
Sender: Rahm Emanuel Sent: Tuesday
- Page 1725 and 1726:
~. !JM1 %. .Cj ~ ~~'~ ~'~'~;.. ~. p
- Page 1727 and 1728:
Sender: Michael Alter Sent: Tuesda
- Page 1729 and 1730:
Sender: Rahm Emanuel Sent: Saturda
- Page 1731 and 1732:
`~ like this: and if we had a Gener
- Page 1733 and 1734:
who already work hard, but I ask yo
- Page 1735 and 1736:
Sender: Rahm Emanuel Sent: Wednesd
- Page 1737 and 1738:
" ........................."'.....
- Page 1739 and 1740:
~~°~` investment return assumption
- Page 1741 and 1742:
D Fiscal Year Chicago Municipal Emp
- Page 1743 and 1744:
The recent academic stagnation also
- Page 1745:
addressed to you in error, please d
- Page 1748 and 1749:
Discover how Small Businesses are u
- Page 1750 and 1751:
Blogging is one of the best ways to
- Page 1752 and 1753:
Sender: Rahm Emanuel Sent: Monday,
- Page 1754 and 1755:
• Low-income CP5 students have ca
- Page 1756 and 1757:
~~i~~a~ ~~~~~c ~~c~~ls hE~ ~~r~s m
- Page 1758 and 1759:
~; ~~~I~~s r 2~~ ~ 1~ R~sl~s r~ ~ ~
- Page 1760 and 1761:
~y ~ ~~~r ~~t~ ~~~ s~~~~ ~~f~ ~~~~~
- Page 1762 and 1763:
~~~~ ~~~~~ ~ ~~n~~t,~~ 238 238 . ..
- Page 1764 and 1765:
?~o ~IA~P grade ~ ~e~d~~~ ~3c 22G ~
- Page 1766 and 1767:
~~ . ~o~f;a~nTic~~: [~o Not Gs~r£b
- Page 1768 and 1769:
~ c ~ m ;r;, z o ,~ ,~ ,• >.~ ;~i
- Page 1770 and 1771:
Los Angels Atlanta San Diego f~ ~.
- Page 1772 and 1773:
... ~ver~~~ S~~r~~ ~~ ~~~~c~~ ~~~ L
- Page 1774 and 1775:
A~~r~~~ S~~r~s f~~ ~i~~c~ ~~ L~r~ ~
- Page 1776 and 1777:
Sender: Michael Sacks Sent: Monday
- Page 1778 and 1779:
Sender: Rahm Emanuel Sent: Wednesd
- Page 1780 and 1781:
that they will have afirst-rate exp
- Page 1782 and 1783:
Sender: Howard Tullman Sent: Wedne
- Page 1784 and 1785:
Impact Engine; half a dozen industr
- Page 1786 and 1787:
***********************************
- Page 1788 and 1789:
(and potentially unfavorable) regul
- Page 1790 and 1791:
From: Marc Andreessen Date: Fri, N
- Page 1792 and 1793:
]esse H. Ruiz 312-569-1135 Direct 3
- Page 1794 and 1795:
(312) 569-1135 office (312) 569-313
- Page 1796 and 1797:
Sender: Ricketts, Tom Sent: Tuesda
- Page 1798 and 1799:
I hope we can resolve these issues
- Page 1800:
C '~~ Inline image 1
- Page 1803 and 1804:
~~~ > > GRV Securities LLC, member
- Page 1805 and 1806:
Sender: Sent: Recipient: Subject: R
- Page 1807 and 1808:
From: Kelley.Quinn@cityofchicago.or
- Page 1809 and 1810:
"To see them after the championship
- Page 1811 and 1812:
Sender: Sent: Recipient: Subject: R
- Page 1813 and 1814:
Sender: Rahm Emanuel Sent: Friday,
- Page 1815 and 1816:
Sender: Sent: Recipient: Subject: R
- Page 1817 and 1818:
Sender: Sent: Recipient: Subject: R
- Page 1819 and 1820:
Sender: Sent: Recipient: Cc: Subjec
- Page 1821 and 1822:
• Sender: Sent: Recipient: Subjec
- Page 1823 and 1824:
• Zion man shot by cops had schiz
- Page 1825 and 1826:
• You are receMng this e-mail bec
- Page 1827 and 1828:
Sender: Sent: Recipient: Subject: R
- Page 1829 and 1830:
Sender: Sent: Recipient: Subject: C
- Page 1831 and 1832:
Proposal For the past seven years,
- Page 1833 and 1834:
• Partners • Goal: Humanize his
- Page 1835 and 1836:
Sender: Sent: Recipient: Subject: R
- Page 1837 and 1838:
•\/:tMrl/;4: ~;a"l:?)/1 M:~.W.i
- Page 1839 and 1840:
The aim of these employment and tra
- Page 1841 and 1842:
A group comprised of youth, legisla
- Page 1843 and 1844:
Lost: The Crisis Of Jobless and Out
- Page 1845 and 1846:
• Executive Summary Introduction
- Page 1847 and 1848:
• 38.3% 28.5'
- Page 1849 and 1850:
• Group U.S. IIDno!a Chicago New
- Page 1851 and 1852:
• Table of Contents 1 Introductio
- Page 1853 and 1854:
• Introduction For several years,
- Page 1855 and 1856:
• • Employment-Population Ratio
- Page 1857 and 1858:
• •. In the U.S. both Whites (n
- Page 1859 and 1860:
• Only Whites (non-Hispanic or La
- Page 1861 and 1862:
• G,oup U.S. llllno}a Chicago New
- Page 1863 and 1864:
• 1&-19 - 20-24 Race/Ethnlcfl:y U
- Page 1865 and 1866:
• Black males compared to both La
- Page 1867 and 1868:
• Legend Percent of White Alone,
- Page 1869 and 1870:
• Legend Percent of Jobless Indiv
- Page 1871 and 1872:
• Conclusion Data proV!ded In thi
- Page 1873 and 1874:
• Appendix B: Data Sources and Me
- Page 1875 and 1876:
• When viewing labor force partic
- Page 1877 and 1878:
• 80.0% 75.0% 70.0% 65.0% 80.0% 5
- Page 1879:
• •
- Page 1882 and 1883:
• *******************************
- Page 1884 and 1885:
• Helping Make Communities Safer
- Page 1886 and 1887:
• Cure Violence Health Model A he
- Page 1888 and 1889:
• New University of Chicago Cease
- Page 1890 and 1891:
• Independent Evaluations in Othe
- Page 1892 and 1893:
Why Ceasefire Works 1. Ceasefire re
- Page 1894 and 1895:
• Selected Evaluations Evaluation
- Page 1896:
• Sender: Sent: Recipient: Subjec
- Page 1901 and 1902:
• Sender: Sent: Recipient: Subjec
- Page 1903 and 1904:
• Sender: Sent: Recipient: Subjec
- Page 1905 and 1906:
Jose Luis Prado has been in touch w
- Page 1907 and 1908:
• February 18, 2016 National Trus
- Page 1909 and 1910:
Sender: Sent: Recipient: Subject: R
- Page 1911 and 1912:
• NEWPO.IN-:r NEWPOINT STRATEGIES
- Page 1913 and 1914:
Sender: Rahm Emanuel Sent: Friday,
- Page 1915 and 1916:
• enforcement. The outside traine
- Page 1917 and 1918:
• Bibb Hubbard Founder & Presiden
- Page 1919 and 1920:
about Pangea to this email "infopac
- Page 1922 and 1923:
• Sender: Rahm Emanuel Sent: Tue
- Page 1924 and 1925:
• MAYOR'S PRESS OFFICE CITY OF CH
- Page 1926 and 1927:
• MAYOR'S PRESS OFFICE CITY OF CH
- Page 1928 and 1929:
• MAYOR'S PRESS OFFICE CITY OF CH
- Page 1930 and 1931:
• MAYOR'S PRESS OFFICE CITY OF CH
- Page 1932 and 1933:
• MAYOR'S PRESS OFFICE CITY OF CH
- Page 1934 and 1935:
• MAYOR'S PRESS OFFICE CITY OF CH
- Page 1936 and 1937:
• And we've seen record registrat
- Page 1938 and 1939:
• Sender: Sent: Recipient: Subjec
- Page 1940 and 1941:
Sender: Sent: • Recipient: LFPLan
- Page 1942 and 1943:
But the nation’s mayors—most of
- Page 1944 and 1945:
• Sender: Sent: Recipient: Subjec
- Page 1946 and 1947:
• Sender: Sent: Recipient: Snbjec
- Page 1948 and 1949:
• Sender: Sent: Recipient: Snbjec
- Page 1950 and 1951:
From: Hall, Abby [Abby.Hall@cityofc
- Page 1952 and 1953:
I read that "Emanuel told Israeli r
- Page 1954 and 1955:
From: Theaster Gates [theaster@uchi
- Page 1956 and 1957:
• Sender: Sent: Recipient: Subjec
- Page 1958 and 1959:
• ----.-... -.-... ~ ..... · ...
- Page 1960 and 1961:
- 3ra Edici6n lnicio de Fe y Acci6n
- Page 1962 and 1963:
Sender: Sent: Recipient: Attachment
- Page 1964 and 1965:
• Ariel Reboyras. "We have more w
- Page 1966 and 1967:
• BIA mediation standards (PATF p
- Page 1968 and 1969:
• Sender: Sent: Recipient: Subjec
- Page 1970 and 1971:
• *******************************
- Page 1972 and 1973:
• Sender: Sent: Recipient: Subjec
- Page 1974 and 1975:
• Sender: Sent: Recipient: Snbjec
- Page 1976 and 1977:
team we can discuss additional deta
- Page 1978 and 1979:
Sender: Sent: Recipient: Subject: G
- Page 1980 and 1981:
Sender: Sent: Recipient: Rahm Emanu
- Page 1982 and 1983:
• > Frederick Wilcox > > > >
- Page 1984 and 1985:
• Sender: Sent: Recipient: Subjec
- Page 1986 and 1987:
• Cl''rY 01? CH I CAO 0 FOR IMMED
- Page 1988 and 1989:
• ,.....,." ·,. · Chicago : . p
- Page 1990 and 1991:
• P02), Comprehensive Non-Discrim
- Page 1992 and 1993:
The principal or designee shall wor
- Page 1994 and 1995:
• Sender: Sent: Recipient: Subjec
- Page 1996 and 1997:
• Sender: Sent: Recipient: Subjec
- Page 1998 and 1999:
work to ensure all of our reforms w
- Page 2000 and 2001:
• Sender: Sent: Recipient: Subjec
- Page 2002 and 2003:
Privileged and Confidential Attorne
- Page 2004 and 2005:
• As you have probably seen in th
- Page 2006 and 2007:
Sender: Sent: Recipient: Subject: J
- Page 2008 and 2009:
() Sender: Sent: Recipient: Jasmine
- Page 2010 and 2011:
Sender: Rick Waddell Sent: Friday,
- Page 2012 and 2013:
Sender: Rahm Emanuel Sent: Wednesd
- Page 2014 and 2015:
From: Guthman, Jack [jguthman@taftl
- Page 2016 and 2017:
of announcements (for example, you
- Page 2018 and 2019:
Itasca had the same demographics. G
- Page 2020 and 2021:
Sender: Sent: Recipient: Mark Kelly
- Page 2022 and 2023:
With the press of a button, anyone
- Page 2024 and 2025:
Sender: Sent: Recipient: Subject: A
- Page 2026 and 2027:
Sender: Sent: Recipient: Rahm Emanu
- Page 2028 and 2029:
Sender: Sent: Recipient: Mark Kelly
- Page 2030 and 2031:
Sender: Sent: Recipient: Subject: R
- Page 2032 and 2033:
Sender: Sent: Recipient: Subject: M
- Page 2034 and 2035:
Sender: Sent: Recipient: Subject: R
- Page 2036 and 2037:
Sender: Sent: Recipient: Snbject: S
- Page 2038 and 2039:
Sender: Sent: Rahm Emanuel Friday,
- Page 2040 and 2041:
William S. Singer KIRKLAND & ELLIS
- Page 2042 and 2043:
generous in my view. Sent from my i
- Page 2044 and 2045:
From: Marilyn Katz [mkatz@mkcpr.com
- Page 2046 and 2047:
While I'm thrilled to be licensed n
- Page 2048 and 2049:
Sender: Sean Rapelyea < Sent: Thurs
- Page 2050 and 2051:
From: Negron, Michael [Michael.Negr
- Page 2052 and 2053:
Sender: paul levy < Sent: Sunday, J
- Page 2054 and 2055:
Sender: Sent: Recipient: Subject: A
- Page 2056 and 2057:
• Chicago-based investment and ad
- Page 2058 and 2059:
" TAG created proposal of "floating
- Page 2060 and 2061:
~! , ...... -,.;:i.. 'fl ·~ ' '41
- Page 2062 and 2063:
Page• 8 Source: Top urban bike pa
- Page 2064 and 2065:
• RiverRide is composed of steelr
- Page 2066:
Global leader in floating structure
- Page 2069 and 2070:
- - - - - _- .,- - Access and trans
- Page 2071 and 2072:
Page• 17 TAG HO.LDING LLC
- Page 2075 and 2076:
Page• 21 TAG HOLDING LLC
- Page 2077 and 2078:
TAG Holding LLC's Proposal for: Rrv
- Page 2079 and 2080:
• Paul A. Levy Prairie Management
- Page 2081 and 2082:
Paul A. Levy Prairie Management & D
- Page 2083 and 2084:
Luke Sequeira Adobe Youth Voices ht
- Page 2085 and 2086:
From: Megan Kaiko [mkaiko@riskybusi
- Page 2087 and 2088:
For insights on the go follow Merri
- Page 2089 and 2090:
19TH WARD PUBLIC SCHOOL MASTER PLAN
- Page 2091 and 2092:
Sender: Sent: Recipient: Subject: R
- Page 2093 and 2094:
• Sender: Sent: Recipient: Subjec
- Page 2095 and 2096:
• Republican governor of Tennesse
- Page 2097 and 2098:
Sender: Sent: Recipient: Subject: O
- Page 2099 and 2100:
I have edits for you on your piece
- Page 2101 and 2102:
Sender: Sent: • Recipient: Rahm E
- Page 2103 and 2104:
• Subject: Re: PHOTO: Chicago Pol
- Page 2105 and 2106:
MAJOR CITIES CHIEFS ASSOCIATION MAJ
- Page 2107 and 2108:
The bulletin said offi~ violated po
- Page 2109 and 2110:
• DRAFr AND CONFIDENTIAL To: Rahm
- Page 2111 and 2112:
• Federal transportation dollars
- Page 2113 and 2114:
• Sender: Rahm Emanuel Sent: Sat
- Page 2115 and 2116:
In any event, whoever redesigns Sou
- Page 2117 and 2118:
• Sender: Sent: Recipient: Subjec
- Page 2119 and 2120:
Sender: Sent: Recipient: Subject: R
- Page 2121 and 2122:
Five Years of Growth: CPS Academic
- Page 2123 and 2124:
• I 18.4 ~ 18.0 18.2 ~ 17.8 ;17.6
- Page 2125 and 2126:
• implemented full-day kindergart
- Page 2127 and 2128:
participated in the program with 70
- Page 2129 and 2130:
• Five Years of Growth: CPS Acade
- Page 2131 and 2132:
18.4 18.2 ~ 18.0 "' t 17.B ;17.6 -:
- Page 2133 and 2134:
• implemented full-day kindergart
- Page 2135 and 2136:
participated in the program with 70
- Page 2137 and 2138:
Five Years of Growth: CPS Academic
- Page 2139 and 2140:
1 · 18.4 , CPS ACT Growth 2006-201
- Page 2141 and 2142:
• implemented full-day kindergart
- Page 2143 and 2144:
participated in the program with 70
- Page 2145 and 2146:
From: Hirschfield, Eric [Eric.Hirsc
- Page 2147 and 2148:
Chicago, August 8, 2016 Forrest Cla
- Page 2149 and 2150:
July 24, 2015 Rahm Emanuel, Mayor C
- Page 2151 and 2152:
Sender: Sent: Recipient: Snbject: R
- Page 2153 and 2154:
Sender: Sent: Recipient: Attachment
- Page 2155 and 2156:
C Last year's ACT results for gradu
- Page 2157 and 2158:
Chicago's Best Kept Secret: Histori
- Page 2159 and 2160:
Sender: Rahm Emanuel Sent: Thursda
- Page 2161 and 2162:
• Last year's ACT results for gra
- Page 2163 and 2164:
• Chicago's Best Kept Secret: His
- Page 2165 and 2166:
Sender: Sent: Recipient: Attachment
- Page 2167 and 2168:
• Last year's ACT results for gra
- Page 2169 and 2170:
• Chicago's Best Kept Secret: His
- Page 2171 and 2172:
• Sender: Rahm Emanuel Sent: Thu
- Page 2173 and 2174:
• Last year's ACT results for gra
- Page 2175 and 2176:
Chicago's Best Kept Secret: Histori
- Page 2177 and 2178:
Sender: Rahm Emanuel Sent: Thursda
- Page 2179 and 2180:
• Last year's ACT results for gra
- Page 2181 and 2182:
• Chicago's Best Kept Secret: His
- Page 2183 and 2184:
• Sender: Sent: Recipient: Attach
- Page 2185 and 2186:
Last year's ACT results for graduat
- Page 2187 and 2188:
• Chicago's Best Kept Secret: His
- Page 2189 and 2190:
• Sender: Sent: Rahm Emanuel Thu
- Page 2191 and 2192:
• Last year's ACT results for gra
- Page 2193 and 2194:
• Chicago's Best Kept Secret: His
- Page 2195 and 2196:
• Sender: Sent: Recipient: Attach
- Page 2197 and 2198:
• Last year's ACT results for gra
- Page 2199 and 2200:
• Chicago's Best Kept Secret: His
- Page 2201 and 2202:
• Sender: Rahm Emanuel Sent: Thu
- Page 2203 and 2204:
• Last year's ACT results for gra
- Page 2205 and 2206:
Chicago's Best Kept Secret: Histori
- Page 2207 and 2208:
Sender: Sent: Recipient: Attachment
- Page 2209 and 2210:
Last year's ACT results for graduat
- Page 2211 and 2212:
Chicago's Best Kept Secret: Histori
- Page 2213 and 2214:
Sender: Rahm Emanuel Sent: Thursda
- Page 2215 and 2216:
Last year's ACT results for graduat
- Page 2217 and 2218:
Chicago's Best Kept Secret: Histori
- Page 2219 and 2220:
Sender: Sent: Recipient: Subject:
- Page 2221 and 2222:
• forward. Thank you and your tea
- Page 2223 and 2224:
Sender: Sent: Recipient: Snbject: A
- Page 2225 and 2226:
• Abandoned years ago as too smal
- Page 2227 and 2228:
The lack of enforcement is what is
- Page 2229 and 2230:
anyone who can get a response, it's
- Page 2231 and 2232:
Lakeview taxes - some of the highes
- Page 2233 and 2234:
From Remedial Education to career P
- Page 2235 and 2236:
Sender: Rahm Emanuel Sent: Monday,
- Page 2237 and 2238:
• Last year's ACT results for gra
- Page 2239 and 2240:
Sender: Sent: Recipient: Subject: M
- Page 2241 and 2242:
Townsend, from Chicago, who compete
- Page 2243 and 2244:
Sender: Sent: • Recipient: Rahm E
- Page 2245 and 2246:
Sender: Sent: Recipient: Rahm Emanu
- Page 2247 and 2248:
• Sender: Sent: Recipient: Rahm E
- Page 2249 and 2250:
• Sender: Sent: Recipient: Rahm E
- Page 2251 and 2252:
Sender: Sent: • Recipient: Rahm E
- Page 2253 and 2254:
Sender: Sent: • Recipient: Rahm E
- Page 2255 and 2256:
Sender: Sent: • Recipient: Rahm E
- Page 2257 and 2258:
• Sender: Sent: Recipient: Rahm E
- Page 2259 and 2260:
Sender: Sent: • Recipient: Rahm E
- Page 2261 and 2262:
Sender: Sent: • Recipient: Rahm E
- Page 2263 and 2264: • Sender: Sent: Recipient: Rahm E
- Page 2265 and 2266: Sender: Sent: • Recipient: Rahm E
- Page 2267 and 2268: Sender: Sent: • Recipient: Rahm E
- Page 2269 and 2270: Sender: Sent: • Recipient: Rahm E
- Page 2271 and 2272: • Sender: Sent: Recipient: Rahm E
- Page 2273 and 2274: • Sender: Sent: Recipient: Rahm E
- Page 2275 and 2276: • Sender: Sent: Recipient: Rahm E
- Page 2277 and 2278: Sender: Sent: Recipient: Subject: R
- Page 2279 and 2280: Sender: Sent: • Recipient: Rahm E
- Page 2281 and 2282: Sender: Sent: Recipient: Rahm Emanu
- Page 2283 and 2284: Sender: Sent: Recipient: Rahm Emanu
- Page 2285 and 2286: Sender: Sent: Recipient: Rahm Emanu
- Page 2287 and 2288: Sender: Sent: Recipient: Rahm Emanu
- Page 2289 and 2290: Sender: Sent: Recipient: Rahm Emanu
- Page 2291 and 2292: Sender: Sent: • Recipient: Rahm E
- Page 2293 and 2294: Sender: Sent: Recipient: Subject: R
- Page 2295 and 2296: Sender: Sent: Recipient: Subject: R
- Page 2297 and 2298: And on Tuesday, the Fitch ratings a
- Page 2299 and 2300: Jim Reynolds I Loop Capital Chainna
- Page 2302 and 2303: From: Negron, Michael [Michael.Negr
- Page 2304 and 2305: From: Zach Kelly Sent: Monday, Sept
- Page 2306: Hosted by Title Sponsor Net proceed
- Page 2309 and 2310: • has increased by 13 .5 percenta
- Page 2311 and 2312: Percent of Students Graduating In 5
- Page 2313: • Record Attendance Last year, at
- Page 2317 and 2318: • Record Attendance Last year, at
- Page 2319 and 2320: • Percent of Students Graduating
- Page 2321 and 2322: • Record Attendance Last year, at
- Page 2323 and 2324: • Percent of Students Graduating
- Page 2325 and 2326: • Record Attendance Last year, at
- Page 2327 and 2328: • Percent of Students Graduallng
- Page 2329 and 2330: • Record Attendance Last year, at
- Page 2331 and 2332: • Percent of Students Graduating
- Page 2333 and 2334: • Record Attendance Last year, at
- Page 2335 and 2336: Percent of Students Groduatlng In 5
- Page 2337 and 2338: • Record Attendance Last year, at
- Page 2339 and 2340: • Percent of Students Graduating
- Page 2341 and 2342: • Record Attendance Last year, at
- Page 2343 and 2344: • Percent of Students Graduating
- Page 2345 and 2346: • Record Attendance Last year, at
- Page 2347 and 2348: • Percent of Students Graduating
- Page 2349 and 2350: • Record Attendance Last year, at
- Page 2351 and 2352: Percent of Students Graduating In 5
- Page 2353 and 2354: • Record Attendance Last year, at
- Page 2355 and 2356: • Percent of Students Groduatlng
- Page 2357 and 2358: Record Attendance • , Last year,
- Page 2359 and 2360: • Percent of Students Graduating
- Page 2361 and 2362: • Record Attendance Last year, at
- Page 2363 and 2364: Percent of Students Graduating In 5
- Page 2365 and 2366:
Record Attendance Last year, attend
- Page 2367 and 2368:
Percent of Students Graduating In S
- Page 2369 and 2370:
Record Attendance Last year, attend
- Page 2371 and 2372:
Percent of Students Graduating In 5
- Page 2373 and 2374:
• Record Attendance Last year, at
- Page 2375 and 2376:
Percent of Students Graduating In 5
- Page 2377 and 2378:
• Record Attendance Last year, at
- Page 2379 and 2380:
Percent of Students Groduotlng In S
- Page 2381 and 2382:
• Record Attendance Last year, at
- Page 2383 and 2384:
Percent of Students Graduating In 5
- Page 2385 and 2386:
• Record Attendance Last year, at
- Page 2387 and 2388:
Percenl of S!udenls Graduallng In 5
- Page 2389 and 2390:
• Record Attendance Last year, at
- Page 2391 and 2392:
Percent of Students Graduating In 5
- Page 2393 and 2394:
Record Attendance Last year, attend
- Page 2395 and 2396:
Percent of Students Graduating In 5
- Page 2397 and 2398:
Record Attendance Last year, attend
- Page 2399 and 2400:
Percent of Students Graduating In 5
- Page 2401 and 2402:
Record Attendance Last year, attend
- Page 2403 and 2404:
Percen! of S!uden!s Grodua!lng In 5
- Page 2405 and 2406:
Record Attendance Last year, attend
- Page 2407 and 2408:
• Percenl of Sludenls Gradua!lng
- Page 2409 and 2410:
Record Attendance Last year, attend
- Page 2411 and 2412:
Percent of Students Graduating In 5
- Page 2413 and 2414:
Record Attendance Last year, attend
- Page 2415 and 2416:
Percent of Students Graduating In 5
- Page 2417 and 2418:
Record Attendance Last year, attend
- Page 2419 and 2420:
Percent of Students Graduallng In 5
- Page 2421 and 2422:
Sender: Sent: Recipient: Subject: N
- Page 2423 and 2424:
650-215-8332 Ryan Popple CEO, Prote
- Page 2425 and 2426:
account. Please let me know If you
- Page 2427 and 2428:
Sender: Sent: • Recipient: Subjec
- Page 2429 and 2430:
Sender: Sent: Recipient: Subject: R
- Page 2431 and 2432:
Sender: Sent: Recipient: Subject: A
- Page 2433 and 2434:
• Table of Contents Table of Cont
- Page 2435 and 2436:
• With three crews in different l
- Page 2437 and 2438:
• Examples City of Chicago - Depa
- Page 2439 and 2440:
• When we review the issues with
- Page 2441 and 2442:
• Works Cited "Canvas: Mobile Bus
- Page 2443 and 2444:
Sender: Sent: Recipient: Attachment
- Page 2445 and 2446:
• graduates enrolled in a two-yea
- Page 2447 and 2448:
• Sender: Sent: Recipient: Rahm E
- Page 2449 and 2450:
Sender: Sent: • Recipient: Rahm E
- Page 2451 and 2452:
• Sender: Sent: Recipient: Subjec
- Page 2453 and 2454:
Sender: Rahm Emanuel • Sent: Tue
- Page 2455 and 2456:
• Sender: Sent: Recipient: Rahm E
- Page 2457 and 2458:
• Prudential building downtown. L
- Page 2459 and 2460:
• Last week S&P announced they up
- Page 2461 and 2462:
• Sender: Sent: Recipient: Subjec
- Page 2463 and 2464:
• downtown. Last week we learned
- Page 2465 and 2466:
• Last week S&P announced they up
- Page 2467 and 2468:
Sender: Sent: Recipient: Subject: R
- Page 2469 and 2470:
• learned that Chicago will soon
- Page 2471 and 2472:
• Sender: Sent: Recipient: Subjec
- Page 2473 and 2474:
• Sender: Sent: Recipient: Snbjec
- Page 2475 and 2476:
• Sender: Sent: Recipient: Subjec
- Page 2477 and 2478:
Sender: Sent: Recipient: Snbject: R
- Page 2479 and 2480:
C3 PRESENTS
- Page 2481 and 2482:
• Have a great week and go Cubs .
- Page 2483 and 2484:
• Five Years of Growth: CPS Acade
- Page 2485 and 2486:
• Test scores: Last year's ACT re
- Page 2487 and 2488:
• Sender: Sent: Recipient: Subjec
- Page 2489 and 2490:
Sender: Sent: • Recipient: Rahm E
- Page 2491 and 2492:
In his speech at Benjamin Banneker
- Page 2493 and 2494:
• and school leaders so they can
- Page 2495 and 2496:
• ensures that students and famil
- Page 2497 and 2498:
EMBARGOED UNTIL 6:00AM EDT, MONDAY,
- Page 2499 and 2500:
Sender: Sent: Recipient: Rahm Emanu
- Page 2501 and 2502:
• FACT SHEET: KEEPING HEAL TH CAR
- Page 2503 and 2504:
• Sender: Sent: Recipient: Rahm E
- Page 2505 and 2506:
• Sender: Sent: Recipient: Subjec
- Page 2507 and 2508:
• From: Sent: To: Subject: paul l
- Page 2509 and 2510:
• From: Sent: To: Cc: Subject: An
- Page 2511 and 2512:
From: Sent: o: • Subject: Rahm Em
- Page 2513 and 2514:
• Sender: Rahm Emanuel Sent: Mon
- Page 2515 and 2516:
• Sender: Sent: Recipient: Rahm E
- Page 2517 and 2518:
• Summary: Chicago, Illinois; Gen
- Page 2519 and 2520:
Summary: Chicago, Illinois; General
- Page 2521 and 2522:
• Summary: Chicago, Illinois; Gen
- Page 2523 and 2524:
Summary: Chicago, Illinois; General
- Page 2525 and 2526:
• UMp/rcmced Rating Chlc:aga GO v
- Page 2527 and 2528:
• Copyright© 2016 by S&P Global
- Page 2529 and 2530:
• Best wishes, SK From: Rahm Eman
- Page 2531 and 2532:
• Sender: Sent: Recipient: Rahm E
- Page 2533 and 2534:
• Sender: Sent: Recipient: Rahm E
- Page 2535 and 2536:
• Sender: Sent: Recipient: Rahm E
- Page 2537 and 2538:
• Sender: Sent: Recipient: Rahm E
- Page 2539 and 2540:
Sender: Sent: Recipient: Rahm Emanu
- Page 2541 and 2542:
• Rahm Have a great week and go C
- Page 2543 and 2544:
• Rahm Have a great week and go C
- Page 2545 and 2546:
Sender: Sent: • Recipient: Rahm E
- Page 2547 and 2548:
• Sender: Sent: Recipient: Rahm E
- Page 2549 and 2550:
• Sender: Sent: Recipient: Rahm E
- Page 2551 and 2552:
Sender: Sent: • Recipient: Rahm E
- Page 2553 and 2554:
• Sender: Sent: Recipient: Rahm E
- Page 2555 and 2556:
• Sender: Sent: Recipient: Rahm E
- Page 2557 and 2558:
• Rahm Have a great week and go C
- Page 2559 and 2560:
• Rahm Have a great week and go C
- Page 2561 and 2562:
• Rahm Have a great week and go C
- Page 2563 and 2564:
• Rahm Have a great week and go C
- Page 2565 and 2566:
• Rahm Have a great week and go C
- Page 2567 and 2568:
• Rahm Have a great week and go C
- Page 2569 and 2570:
• Rahm Have a great week and go C
- Page 2571 and 2572:
• Sender: Sent: Recipient: Rahm E
- Page 2573 and 2574:
• Sender: Sent: Recipient: Rahm E
- Page 2575 and 2576:
• Sender: Sent: Recipient: Rahm E
- Page 2577 and 2578:
• Sender: Sent: Recipient: Rahm E
- Page 2579 and 2580:
• Sender: Sent: Recipient: Rahm E
- Page 2581 and 2582:
Sender: Sent: • Recipient: Rahm E
- Page 2583 and 2584:
• Sender: Sent: Recipient: Rahm E
- Page 2585 and 2586:
• Sender: Sent: Recipient: Rahm E
- Page 2587 and 2588:
Sender: Sent: Recipient: Rahm Emanu
- Page 2589 and 2590:
Sender: Sent: Recipient: Rahm Emanu
- Page 2591 and 2592:
• Rahm Have a great week and go C
- Page 2593 and 2594:
• Sender: Sent: Recipient: Rahm E
- Page 2595 and 2596:
• Sender: Sent: Recipient: Rahm E
- Page 2597 and 2598:
• Sender: Sent: Recipient: Rahm E
- Page 2599 and 2600:
Sender: Sent: • Recipient: Rahm E
- Page 2601 and 2602:
• Sender: Sent: Recipient: Rahm E
- Page 2603 and 2604:
Sender: Sent: • Recipient: Rahm E
- Page 2605 and 2606:
Sender: Sent: • Recipient: Rahm E
- Page 2607 and 2608:
• Sender: Sent: Recipient: Rahm E
- Page 2609 and 2610:
• Have a great week and go Cubs.
- Page 2611 and 2612:
• Have a great week and go Cubs.
- Page 2613 and 2614:
• Sender: Sent: Recipient: Rahm E
- Page 2615 and 2616:
• Sender: Sent: Recipient: Rahm E
- Page 2617 and 2618:
• Sender: Sent: Recipient: Rahm E
- Page 2619 and 2620:
• Sender: Sent: Recipient: Rahm E
- Page 2621 and 2622:
• Sender: Sent: Recipient: Rahm E
- Page 2623 and 2624:
• Sender: Sent: Recipient: Rahm E
- Page 2625 and 2626:
• Sender: Sent: Recipient: Rahm E
- Page 2627 and 2628:
• Sender: Sent: Recipient: Rahm E
- Page 2629 and 2630:
Sender: Sent: • Recipient: RahrnE
- Page 2631 and 2632:
Sender: Sent: • Recipient: Rahm E
- Page 2633 and 2634:
Sender: Sent: • Recipient: Rahm E
- Page 2635 and 2636:
Sender: Sent: • Recipient: Rahm E
- Page 2637 and 2638:
Sender: Sent: • Recipient: Rahm E
- Page 2639 and 2640:
Sender: Sent: • Recipient: Rahm E
- Page 2641 and 2642:
Sender: Sent: • Recipient: Rahm E
- Page 2643 and 2644:
Sender: Sent: • Recipient: Rahm E
- Page 2645 and 2646:
Sender: Sent: Recipient: Rahm Emanu
- Page 2647 and 2648:
• Sender: Sent: Recipient: Rahm E
- Page 2649 and 2650:
Sender: Sent: Recipient: Rahm Emanu
- Page 2651 and 2652:
• From: Sent: To: Rahm Emanuel T
- Page 2653 and 2654:
From: ,-ent: .,,.o: Rahm Emanuel T
- Page 2655 and 2656:
• From: Sent: To: Dear John: Rahm
- Page 2657 and 2658:
• From: Sent: To: Dear Sean: Rahm
- Page 2659 and 2660:
,. From: Sent To: Rahm Emanuel Wed
- Page 2661 and 2662:
• From: Sent: To: Subject: Rahm E
- Page 2663 and 2664:
From: Sent: To: Subject: Rahm Emanu
- Page 2665 and 2666:
• From: Sent: To: Subject: Ruiz,
- Page 2667:
• lkyoung@irm. themichael sorg. c
- Page 2682:
•
- Page 2685 and 2686:
The expo is part of the Mayor's age
- Page 2687 and 2688:
• Do you have what it takes to st
- Page 2689 and 2690:
• To: Mayor Rahm Emanuel Cc: Mich
- Page 2691 and 2692:
• Just to drill down a bit furthe
- Page 2693 and 2694:
• » As I mentioned in our conver
- Page 2695 and 2696:
• From: Sent: To: Subject: Rahm E
- Page 2697 and 2698:
and to waive the exorbitant fees th
- Page 3266 and 3267:
From: Mooney, Andrew Sent: Monday,
- Page 3268 and 3269:
Sent: Mon Jun 20 15:41:20 2011 Subj
- Page 3270 and 3271:
Sut~ject: Pedestrian Safety Why we
- Page 3272 and 3273:
From: Sent: To: Subject: Follow Up
- Page 3274 and 3275:
this e-mail in error, please respon
- Page 3276 and 3277:
From: mayor_re@rahmemail.com Sent:
Inappropriate
Loading...
Inappropriate
You have already flagged this document.
Thank you, for helping us keep this platform clean.
The editors will have a look at it as soon as possible.
Mail this publication
Loading...
Embed
Loading...
Delete template?
Are you sure you want to delete your template?
DOWNLOAD ePAPER
This ePaper is currently not available for download.
You can find similar magazines on this topic below under ‘Recommendations’.