MPRA
n?u=RePEc:pra:mprapa:75444&r=env
n?u=RePEc:pra:mprapa:75444&r=env

You also want an ePaper? Increase the reach of your titles
YUMPU automatically turns print PDFs into web optimized ePapers that Google loves.
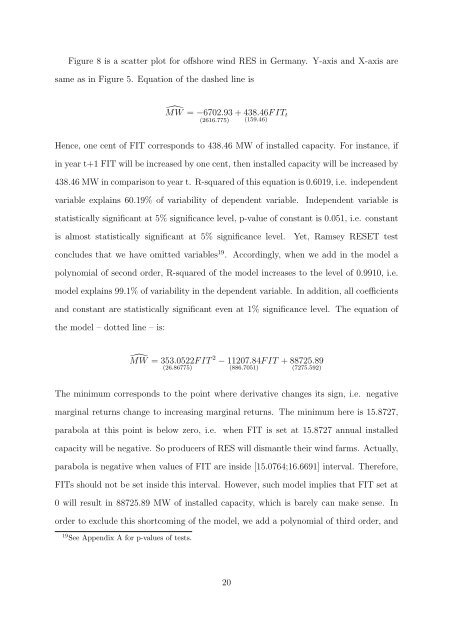
Figure 8 is a scatter plot for offshore wind RES in Germany. Y-axis and X-axis are<br />
same as in Figure 5. Equation of the dashed line is<br />
̂MW = −6702.93<br />
(2616.775)<br />
+ 438.46<br />
(159.46) F IT t<br />
Hence, one cent of FIT corresponds to 438.46 MW of installed capacity. For instance, if<br />
in year t+1 FIT will be increased by one cent, then installed capacity will be increased by<br />
438.46 MW in comparison to year t. R-squared of this equation is 0.6019, i.e. independent<br />
variable explains 60.19% of variability of dependent variable.<br />
Independent variable is<br />
statistically significant at 5% significance level, p-value of constant is 0.051, i.e. constant<br />
is almost statistically significant at 5% significance level.<br />
Yet, Ramsey RESET test<br />
concludes that we have omitted variables 19 . Accordingly, when we add in the model a<br />
polynomial of second order, R-squared of the model increases to the level of 0.9910, i.e.<br />
model explains 99.1% of variability in the dependent variable. In addition, all coefficients<br />
and constant are statistically significant even at 1% significance level. The equation of<br />
the model – dotted line – is:<br />
̂MW = 353.0522 F IT 2 − 11207.84F IT + 88725.89<br />
(26.86775) (886.7051) (7275.592)<br />
The minimum corresponds to the point where derivative changes its sign, i.e. negative<br />
marginal returns change to increasing marginal returns. The minimum here is 15.8727,<br />
parabola at this point is below zero, i.e. when FIT is set at 15.8727 annual installed<br />
capacity will be negative. So producers of RES will dismantle their wind farms. Actually,<br />
parabola is negative when values of FIT are inside [15.0764;16.6691] interval. Therefore,<br />
FITs should not be set inside this interval. However, such model implies that FIT set at<br />
0 will result in 88725.89 MW of installed capacity, which is barely can make sense. In<br />
order to exclude this shortcoming of the model, we add a polynomial of third order, and<br />
19 See Appendix A for p-values of tests.<br />
20