MPRA
n?u=RePEc:pra:mprapa:75444&r=env
n?u=RePEc:pra:mprapa:75444&r=env

Create successful ePaper yourself
Turn your PDF publications into a flip-book with our unique Google optimized e-Paper software.
with average annual growth rate of 33%.<br />
No regression was run for the Czech Republic due to lack of data.<br />
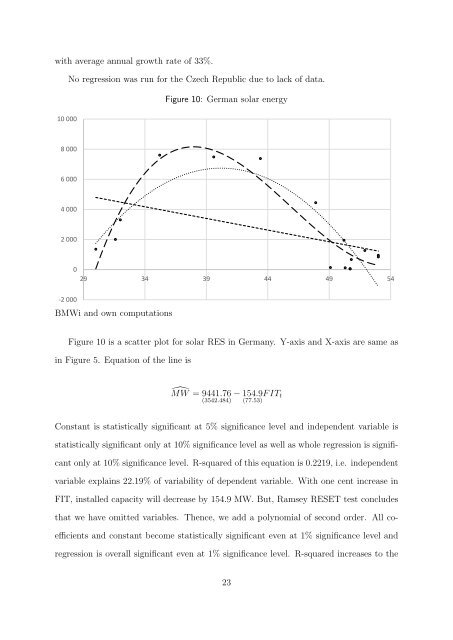
Figure 10: German solar energy<br />
10 000<br />
8 000<br />
6 000<br />
4 000<br />
2 000<br />
0<br />
29 34 39 44 49 54<br />
-2 000<br />
BMWi and own computations<br />
Figure 10 is a scatter plot for solar RES in Germany. Y-axis and X-axis are same as<br />
in Figure 5. Equation of the line is<br />
̂MW = 9441.76<br />
(3542.484) − 154.9<br />
(77.53) F IT t<br />
Constant is statistically significant at 5% significance level and independent variable is<br />
statistically significant only at 10% significance level as well as whole regression is significant<br />
only at 10% significance level. R-squared of this equation is 0.2219, i.e. independent<br />
variable explains 22.19% of variability of dependent variable. With one cent increase in<br />
FIT, installed capacity will decrease by 154.9 MW. But, Ramsey RESET test concludes<br />
that we have omitted variables. Thence, we add a polynomial of second order. All coefficients<br />
and constant become statistically significant even at 1% significance level and<br />
regression is overall significant even at 1% significance level. R-squared increases to the<br />
23