

atesteo-grc_Newsletter_EN_2016-12-26_v24_fx_600dpi

You also want an ePaper? Increase the reach of your titles
YUMPU automatically turns print PDFs into web optimized ePapers that Google loves.
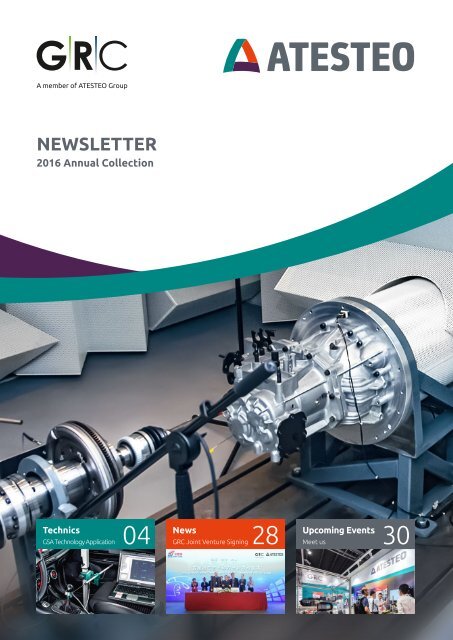
NEWSLETTER<br />
<strong>2016</strong> Annual Collection<br />
Technics<br />
GSA Technology Application<br />
News<br />
Upcoming Events<br />
04 GRC Joint Venture Signing 28 Meet us 30
Contents<br />
Editorial<br />
Company Profile<br />
Dear readers,<br />
Wolfgang Schmitz, CEO<br />
ATESTEO GmbH is a leading supplier in the international<br />
automotive industry, providing drivetrain testing,<br />
transmission engineering development and performance<br />
optimization services, and automatic equipment<br />
such as precision measuring system, test benches etc.<br />
We are a key partner of leading automotive manufacturers<br />
and suppliers around the globe. The outstanding<br />
expertise of our specialists in all dimensions of testing<br />
allows for reliable verification of drivetrains, transmission<br />
systems and automotive products. We are everywhere<br />
where automotive development takes place.<br />
Our <strong>12</strong>0 test benches in Germany, China, USA, Japan<br />
and Korea serve the automotive industry everywhere<br />
in the world.<br />
Contents...........................................................................................................................2<br />
Editorial............................................................................................................................3<br />
Company Profile.............................................................................................................3<br />
Technics............................................................................................................................ 4<br />
GSA Technology Application..........................................................................................5<br />
Introduction to NVH Vehicle Measurement.............................................................. 14<br />
NVH Test Bench and Test Program Introduction..................................................... 17<br />
Fast and Accurate Whine Optimization Process......................................................22<br />
News................................................................................................................................ 28<br />
GRC and WLY Set Up a Joint Venture Company in China........................................29<br />
Shanghai Testing Expo..................................................................................................29<br />
TMC Keynote Speech.....................................................................................................29<br />
Upcoming Events........................................................................................................ 30<br />
As the automotive industry professional journal, GRC<br />
<strong>Newsletter</strong> is going to meet with you again after our efforts<br />
from all sides.<br />
As the world’s largest automobile production and marketing<br />
country now, Chinese automotive industry plays an<br />
important role at the world’s automotive industry and it is<br />
estimated that Chinese car sales will reach to 30 million by<br />
2020. The prospect of automotive market is very promising.<br />
The new issue focuses on the introduction to gear shifting<br />
performance of transmission and NVH testing. Nowadays,<br />
consumers have high requirement on automobile gear<br />
shifting, so our experts have a detailed introduction to<br />
GSA technology application and gear shifting optimization.<br />
NVH has become a key performance indicator that<br />
customers are more concerned, and passengers and drivers<br />
are more inclined to buy a vehicle with quiet and comfortable<br />
driving space. GRC experts can measure, analyze and<br />
optimize NVH by high-tech software and techniques. In<br />
the latter half of this issue, our experts have a detailed<br />
introduction to NVH Test Program and optimization<br />
process. We are aiming to help customers to obtain the<br />
absolute dominance in the market competition through<br />
our superior service.<br />
I am particularly grateful to all the colleagues for editing<br />
this issue, and hope that all readers will enjoy our content.<br />
Look forward to seeing you soon.<br />
Kind Regards!<br />
ATESTEO Gear Research Center (China) Co. Ltd. (GRC),<br />
as the biggest operation oversea, was established<br />
in August 2006 in Suzhou Industrial Park, with the<br />
mission of providing professional powertrain testing<br />
and transmission development services for OEMs<br />
in China and Asia. GRC, who is the leader of transmission<br />
development and the provider of engineering<br />
service, completed the first 6DCT turn-key development<br />
project in China local market. GRC’s current<br />
facilities include 21 state-of-the-art powertrain test<br />
cells, prototype workshops, and modern offices<br />
equipped with CAE and CAD workstations. We can<br />
offer you drivetrain testing and technical engineering<br />
services of the highest quality.<br />
2 Contents Editorial & Company Profile 3
Technics<br />
GSA Technology Application<br />
In recent years, with the development and application of manual transmission, shift quality analysis<br />
has become more and more important. GRC’s Gear Shift Analysis (GSA) vehicle gear shift quality<br />
analysis system analyzes vehicle gearbox shift performance conveniently and flexibly without requiring<br />
big changes to the vehicle, and makes it unnecessary for the test to be conducted on the test bench.<br />
Analyzing gearshift performance within the whole vehicle is also closer to the driver’s operation in<br />
real life.<br />
System composition<br />
• GSA Technology Application<br />
• Manual Transmission Shiftability Optimization<br />
• Introduction of NVH Vehicle Measurement<br />
• NVH Test Bench and Test Program Introduction<br />
• Fast and Accurate Whine Optimization Process<br />
The GSA system consists of 4 hardware and software parts: the GSA Hardware, the GSA<br />
Data Recorder, the GSA Data Recorder Software and the GSA Analyzing Software (see<br />
Figure 1).<br />
GSA Hardware GSA Data Recorder GSA Acquisition Software GSA Analyzing Software<br />
Figure 1: GSA System<br />
Composition<br />
GRC has developed special measurement procedures and<br />
equipment appropriate to the shift characteristics of manual<br />
transmission vehicles. See Figure 2. Different types<br />
of sensors are used for the measurements, as follows:<br />
• 3-axial force sensor<br />
• 3-plan angle sensor<br />
• Displacement sensor<br />
• Two rotational speed sensors<br />
• TTL converter and cable<br />
• Two temperature sensors (K type)<br />
Figure 2: GSA Vehicle Measurement<br />
4 Technics<br />
Technics 5
Main function of GSA vehicle<br />
Software features<br />
gear shift quality analysis system<br />
GSA software functions<br />
Main testing parameters of the GSA system<br />
• Select force<br />
• Shift force<br />
• Select stroke<br />
• Shift stroke<br />
• Clutch stroke<br />
• Transmission input shaft speed*<br />
• Transmission output shaft speed*<br />
• Vehicle velocity*<br />
• Engine speed*<br />
(*appropriate sensors must be installed at the<br />
transmission)<br />
Main functions of the GSA system<br />
• Comparison of different vehicle shift performances<br />
• Evaluation of competitors‘ shift quality<br />
• Comparison of performance before and after design<br />
modifications<br />
• Performance evaluation of internal and external<br />
shift transmission mechanisms, including efficiency,<br />
rigidity etc.<br />
• Evaluation of the transmission´s shift impulse<br />
• Evaluation of the transmission´s double bump<br />
• Evaluation of the effect of clutch action on gear shift<br />
performance<br />
• Evaluation of the transmission in different stages of<br />
its life cycle<br />
GSA software is divided into two parts, a data acquisition<br />
system and a data analysis system, making for flexibility<br />
according to requirements. The software can be operated<br />
in a Microsoft Windows environment, and does not<br />
need any other special environment like MATLAB. The<br />
system can also analyze data offline. The system can fully<br />
reflect the driver‘s behavior; for example, if the driver<br />
deliberately engages in some special shift behavior, the<br />
GSA will reflect these special actions. The GSA system can<br />
if necessary be directly connected to GRC’s professional<br />
test rig operating system PDES. The system can export<br />
data in many different formats, such as Excel files, JPG,<br />
etc. Customers also can order special file formats to<br />
make comparisons with other data easier. Users can set<br />
the content of output data in whatever way suits their<br />
needs, such as shift force against shift time, shift force<br />
against shift stroke, etc.<br />
Figure 4: Software Navigation Panel<br />
Figure 5: Shift Stroke<br />
Figure 6: Shift travel - Shift Force Curve<br />
Figure 3: Shift Processes Differentiated<br />
Summary<br />
The GSA vehicle shift quality analysis system can be<br />
used for detailed testing and analysis of such features<br />
of manual transmissions in an assembled vehicle as the<br />
shift and select forces, select and shift stroke, synchronization<br />
time and double bumps. The use of a GSA system<br />
helps transmission development engineers during<br />
the development of a new transmission, during design<br />
changes of a transmission, for benchmarks against<br />
other transmissions, and during design optimization.<br />
Because the shift procedure of a manual transmission<br />
can only be analyzed statistically, many shifts must be<br />
performed to get approvable results. The measurement<br />
results also have to be evaluated by experienced<br />
transmission engineers, so that potential variations of<br />
the synchronization time, shift time or double bump<br />
behavior are interpreted correctly. In addition, test<br />
engineers need a deep understanding of the working<br />
principles of manual transmission in general (e.g. synchronizer<br />
or detent system) and interface components<br />
like the clutch.<br />
6 Technics<br />
Technics 7
Manual Transmission<br />
Shiftability Optimization<br />
Manual transmission shiftability optimization, is a combination of shiftability<br />
measurements and shift systems design optimizations. GRC is capable of<br />
delivering in both aspects on the basis of long term experience and continuous<br />
improvement of the corresponding software and hardware tools.<br />
The shiftability optimization process<br />
Shiftability optimization approach (see Figure 1) is a continuous cycle of the below stages:<br />
• Subjective evaluation of shiftability<br />
• Measurement of gear shift behavior<br />
• Design review<br />
• Improvement proposals<br />
• Change construction<br />
• Management of prototyping process<br />
Customer<br />
Responsibility<br />
Subjective evaluation on shiftability<br />
Subjective evaluation requires a driver with rich driving experience. The evaluation<br />
comprises the following aspects:<br />
Shift knob ergonomics<br />
• Knob position<br />
• Knob touch / shape<br />
Static shiftability<br />
Idle shiftability<br />
• 1 gear shiftability<br />
• R gear shiftability R<br />
Dynamic shiftability<br />
Clutch characteristics<br />
• Clutch position<br />
• Maximum force<br />
• Clutch travel<br />
• Select and shift force<br />
• Select and shift travel<br />
• Shift vibration / noise<br />
• Engagement performance<br />
• Shift snap-in<br />
• Shift friction<br />
• Disengagement performance<br />
• Shift double bump<br />
• Shift noise<br />
• Cross shift<br />
On the basis of the subjective evaluation a radar chart can be created, which reflects a<br />
kind of finger print of the vehicle‘s shiftability and allows clear comparisons between<br />
different vehicles (see Figure 2).<br />
Shift knob ergonomic<br />
8<br />
......<br />
7<br />
Select force<br />
Clutch characteristics<br />
6<br />
5<br />
Shift force<br />
Dynamic shiftability<br />
4<br />
3<br />
2<br />
1<br />
Select travel<br />
Management of<br />
Prototyping Process<br />
Subjective<br />
Evaluation of<br />
Shiftability<br />
Measurement of<br />
Gear Shift Behavior<br />
Idle shiftability<br />
0<br />
Shift travel<br />
Shift snap-in<br />
Cross shift<br />
Construction<br />
Change<br />
Improvement<br />
Proposals of<br />
Shift System<br />
Design Review of<br />
Shift System<br />
Shift noise<br />
Shift friction<br />
Figure 2:<br />
Subjective Evaluation of Shiftability<br />
Figure 1:<br />
Shiftability Optimization Process<br />
8 Technics<br />
Technics 9
Measurement of gear shift behavior<br />
Almost all of the subjective evaluation terms can be<br />
objectively quantified through GSA measurements.<br />
Then GRC engineers compare them with GRC / ATESTEO<br />
criteria to provide quantitative data for the following<br />
optimization. The following content is just a brief introduction<br />
of the GSA system, for more details please refer<br />
to the GSA articles. Figure 3 shows the GSA measurement<br />
and results example.<br />
Design review / improvement proposals<br />
According to the subjective evaluation results and objective data of GSA measurement, GRC can define which items need<br />
to be optimized and the corresponding target. Then, according to the defined target, GRC can process the shift subsystems<br />
optimization, by (for instance) tolerance stack up calculations, detent force-travel curve simulation, or cross shift<br />
route simulation.<br />
Tolerance stack up calculation<br />
Detent force-travel curve simulation<br />
Tolerance stack up calculation can review and optimize the ATESTEO DET<strong>EN</strong>T CALCULATOR can simulate each detent’s<br />
force-travel curve independently; it comprises the<br />
following shiftability items:<br />
main detent, shift rod detent and synchronizer detent.<br />
• Free play<br />
Then integrates all the curves depending on their relationships.<br />
Figure 4 shows the customer interface and the<br />
• Shift travel<br />
• Select travel<br />
parameters needed to be input.<br />
Figure 4: DET<strong>EN</strong>T CALCULATOR Customer Interface<br />
Figure 3: GSA Measurement and Results Example<br />
Detent Pin Geometry<br />
ATESTEO DET<strong>EN</strong>T CALCULATOR<br />
Shift rod detent<br />
Detent Contour Geometry<br />
Spring Characteristics<br />
Forces [N]<br />
Ball y-displacement [mm]<br />
x-displacement [mm]<br />
10 Technics<br />
Technics 11
When we get the integrated curve we can get the shift knob force-travel curve (as Figure 5).<br />
The poor positions can be found out from the simulated route, so GRC can process the<br />
specific optimization to the related parts, to get the optimum cross shift performance<br />
(as Figure 8).<br />
Force on konb (mm)<br />
Travel on konb (mm)<br />
Figure 5: Shift Knob Force-Travel Curve Simulation<br />
From the shift knob force-travel curve we can get the<br />
following information:<br />
Positive<br />
Force<br />
Neutral<br />
In Gear<br />
• Shift force<br />
• Shift snap-in<br />
• Shift friction<br />
So we can process the specific adjustment to detent<br />
contour, or their position relationships to reach the<br />
criteria. Figure 6 shows the idle shift force curve.<br />
Change construction / management of<br />
prototyping process<br />
After the customer gets the improvement proposals, the customer is in charge of.<br />
Figure 8: Optimized Cross Shift<br />
Negative<br />
Force<br />
Figure 6: Idle Shift Force Curve<br />
Prototype<br />
Manufacture<br />
Transmission<br />
Assembly<br />
Vehicle<br />
Assembly<br />
Cross shift route simulation<br />
To figure out the cross shift performance, GRC needs to simulate the cross shift route (as Figure 7).<br />
The involvement of the customer in the GRC / ATESTEO shiftability approach, is an important<br />
aspect of the process. The advantage for the customer is that the customer is<br />
directly involved in the improvement process. It also makes the approach more efficient<br />
because the customer keeps the know-how about manufacturing and processing, right<br />
from the beginning of the improvement implementation. GRC / ATESTEO also supports<br />
customers during this phase of the process. After the optimized vehicle is available, the<br />
subjective evaluation and GSA measurement need to be repeated to verify the optimized<br />
effects. If the optimization is satisfying for the customer, the process is concluded.<br />
Figure 7: Cross Shift Simulation<br />
<strong>12</strong> Technics<br />
Technics 13
Introduction to<br />
NVH Vehicle Measurement<br />
NVH is the abbreviation of three words that are Noise, Vibration and Harshness. In most cases noise<br />
exists with vibration, because noise is caused by vibration. By analyzing the NVH model, NVH is a system<br />
composed by excitation source (such as engine, transmission, etc.), channel of vibration transmission<br />
(suspension system, body) and acceptor (human).<br />
NVH is becoming a key performance indicator for customers concerned, and more and more customers<br />
tend to buy a vehicle with a quiet and comfortable passenger compartment.<br />
Figure 1: Lab Test Schematic Diagram<br />
Figure 2: Headset Microphone Measurement<br />
NVH measurement facility<br />
Most OEMs implement the NVH verification and development<br />
with the NVH laboratory (example as Figure1),<br />
namely, anechoic chamber. The laboratory is suited for<br />
vehicle measurement and assessment because of the large<br />
investment amount, long construction cycle and large<br />
maintenance and usage cost.<br />
GRC implements the NVH measurement and assessment<br />
by using convenient and fast facilities and software. The<br />
headset microphone could be used for acquiring sound<br />
pressure values (example as in Figure 2), and acceleration<br />
sensors & speed sensors which have a small size and high<br />
accuracy, are used for acquiring vibration parameters<br />
(example as Figure 3). The system tests and analyzes transmission<br />
noises, such as WHINE RATTLE and CLUNK, mainly<br />
on the vocalism principle and transfer characteristics. With<br />
shielding other low influential factors which NVH causes,<br />
the facility’s testing and analyzing efficiency even higher.<br />
Portable data acquisition equipments and laptops are used<br />
to record and analyze data.<br />
NVH measurement of content<br />
Portable data acquisition equipments are fast and convenient when installed on the<br />
vehicle to measure the below content:<br />
• Sound pressure by the driver<br />
• Rotation speed/ angular acceleration of rotating elements in the transmission<br />
• Vibration acceleration of transmission elements<br />
• Vibration acceleration of mounts in the engine compartment<br />
NVH procedure of measurement and analysis<br />
NVH subjective assessment<br />
The key objective is to find out and distinguish the excitation source during NVH measurement.<br />
The shaft speed and vibration tests are necessarily corresponding to the concerned<br />
gear, and then we can go on with the analysis based on the test result. First of all, GRC<br />
implements subjective measurement and assessment according to a strict specification. We<br />
should confirm if WHINE, RATTLE or CLUNK noise is existing. Assessment table is shown as<br />
Table 1.<br />
Tip<br />
in<br />
Item<br />
Manoeuvre<br />
Description<br />
Gear<br />
• Gear Whine<br />
Rating<br />
• Gear Rattle<br />
@1500 rpm<br />
– 7<br />
1 st<br />
@2000 rpm – 7<br />
@1500 rpm<br />
– 7<br />
2 nd<br />
@2000 rpm – 7<br />
• Driving with target<br />
@1500 rpm<br />
gear at target engine<br />
– 5<br />
3 rd<br />
@2000 rpm speed<br />
– 5<br />
@1500 rpm<br />
@2000 rpm<br />
• Fast tip in to WOT<br />
till the engine speed<br />
reaching 3000 rpm<br />
– 5<br />
4 th – 5<br />
@1500 rpm<br />
– 6<br />
5 th<br />
@2000 rpm – 7<br />
@1500 rpm<br />
– 6<br />
6 th<br />
@2000 rpm – 7<br />
Table 1: Subjective Measurement Table<br />
Figure 3: GRC Speed Sensor Installation<br />
14 Technics<br />
Technics 15
NVH measurement<br />
• Confirming the gear which should be measured<br />
specifically according to the measurement result. Designing<br />
the installation positions of acceleration and<br />
speed sensors (based on layout of transmission), and<br />
then installing the sensors. Example in Figure 4.<br />
• Fixing and connecting the data acquisition equipment<br />
with a laptop after the sensors are installed,<br />
and then configuring the data acquisition equipment<br />
channels.<br />
• Measuring and recording the data on a straight<br />
testing road under different conditions according<br />
to the requirement, and then analyzing the data by<br />
software. Example in Figure 5.<br />
Figure 4: Transmission Layout Schematic<br />
NVH Test Bench and<br />
Test Program Introduction<br />
NVH test bench description<br />
Test bench layout (see Figure 1 / Figure 2)<br />
Figure 1: Basic Layout of Semi-Anechoic Test Bench (ISO 3745 Class 1)<br />
Figure 5: Data Analysis Schematic<br />
Summary<br />
Based on the measurement of sound pressure and acceleration of elements, GRC could provide comprehensive<br />
and objective data to design/optimization engineers. The measurement is used to establish finite element model<br />
of NTF, and is helpful to execute the optimization of noise source and transfer path by modified parameters.<br />
Figure 2: Transmission Noise Test Bench<br />
16 Technics<br />
Technics 17
Acoustic properties<br />
Certification<br />
• ISO 3745 class 1 (High precision method) ISO 3745<br />
Cut-off frequency<br />
• 250 Hz<br />
Absorbers<br />
• Wedge type<br />
• Length: 340 mm<br />
Background noise level<br />
• 45 dB<br />
• Electric machines located outside of the noise chamber<br />
Decoupling<br />
• Base plate made of concrete decoupled from the<br />
structure borne noise by elastomeric blocks<br />
Natural frequency<br />
• 6 Hz<br />
Drive<br />
Input<br />
• 95 kW<br />
• 300 Nm (nominal)<br />
• 490 Nm (overload)<br />
Output<br />
• 100 kW<br />
• 454 Nm (nominal)<br />
• 640 Nm (overload)<br />
Input driveline with rigid connection of motor and transmission<br />
via a CFK shaft.<br />
NVH test program description<br />
and ‘load side’ (load motor, running at constant speed –<br />
decoupled) to enable higher vibration levels<br />
• One speed transducer is mounted on the driving motor<br />
and the other is on the input shaft (see Figure 4)<br />
• 4 microphones are positioned in an array one meter away<br />
from the transmission sample (see Figure 3/Figure 4)<br />
• 1 tri-axial accelerometer is installed (same position as in<br />
vehicle)<br />
• Rotec-System, Octobox and Artemis from HEAD acoustic<br />
are used for measurement and analysis<br />
Process of gear rattle test<br />
• The transmission is set to the test temperature before<br />
every test run<br />
• The gear which will be tested is engaged<br />
• The transmission is set to a required constant speed by<br />
the input motor<br />
• A load of torque is applied by the output engine<br />
• The frequency of the torsional acceleration is set to the<br />
corresponding 2 nd engine order<br />
• The torsion fluctuation is ramped up from nearly 0 to<br />
maximum acceleration<br />
• The radiated noise is measured by 4 Microphones located<br />
1 meter away from the test object (see Figure 4)<br />
• The A-weighted sound pressure levels of the 4 microphones<br />
are averaged and are drawn vs. the torsion<br />
acceleration<br />
• The torsional acceleration is calculated from input shaft<br />
speed<br />
• The basic noises from oil pump, gear meshing and bearing<br />
noises are contained in the complete analysis<br />
Figure 4: Measuring Points<br />
(a) Microphone Position<br />
(b) Microphone Position<br />
Description of gear rattle measurement<br />
Preparation for gear rattle test<br />
• The transmission is rigidly mounted to a fixture by the<br />
bell housing only<br />
• The differential is blocked<br />
• A short connection shaft with high torsional stiffness is<br />
used to connect the transmission input shaft via splines<br />
and a modified clutch hub<br />
• A high stiffness and low inertia connection shaft, is<br />
mounted on the load motor, and the shaft length is<br />
determined by the required motor position outside<br />
of the acoustic chamber<br />
• A dual mass flywheel is installed to achieve isolation between<br />
the test bench and the ‘vibration side’ (excitation<br />
motor and transmission running at high vibration levels)<br />
Figure 3: Positions of Microphones<br />
(c) Input Shaft Speed Sensor Position<br />
(d) Input Shaft Speed Sensor and Vibration Sensor Position<br />
18 Technics<br />
Technics 19
Description of gear whine measurement<br />
(c) Shaft Layout<br />
(d) Input Shaft Speed Sensor and Vibration Sensor Position<br />
Description of stiffness and free play measurement<br />
Preparation for stiffness and free play test (layout<br />
Process of gear stiffness and free play test<br />
Figure 5: Basic Layout of<br />
Gear Whine Measurement<br />
see Figure 5)<br />
• The transmission is rigidly mounted to a fixture by the<br />
• The transmission is set to the test temperature before<br />
every test run<br />
Preparation for the gear whine test (layout see Figure 5)<br />
Process of gear whine test<br />
bell housing only<br />
• The differential is blocked<br />
• The gear which will be tested is engaged<br />
• The transmission is set to a required constant speed by<br />
• The transmission is rigidly mounted to a fixture by the<br />
• The transmission is set to the test temperature before<br />
• A short connection shaft with high torsional stiffness is<br />
the input motor<br />
bell housing only<br />
every test run<br />
used to connect the transmission input shaft via splines<br />
• A load is applied by the motor<br />
• The differential is blocked<br />
• The gear which will be tested is engaged<br />
and a modified clutch hub<br />
• The torque is ramped up from positive torque to nega-<br />
• A short connection shaft with high torsional stiffness is<br />
• The transmission is set to a required start speed by the<br />
• A high stiffness and low inertia connection shaft is<br />
tive torque and back to positive torque (the measure-<br />
used to connect the transmission input shaft via splines<br />
output motor<br />
mounted to the load motor, and the shaft length is de-<br />
ment process is shown on Figure 7)<br />
and a modified clutch hub<br />
• A constant load is applied by the input engine<br />
termined by the required motor position outside of the<br />
• The torque is drawn vs. the differential angle (see<br />
• A high stiffness and low inertia connection shaft is<br />
• The speed is ramped up<br />
acoustic chamber<br />
Figure 8)<br />
mounted to the load motor, and the shaft length is de-<br />
• Every test run is repeated three times<br />
• A boost transmission is installed, because higher speed<br />
termined by the required motor position outside of the<br />
• The overall values and the meshing orders of the<br />
and higher torque are necessary<br />
acoustic chamber<br />
engaged gear pairs are extracted from the A-weighted<br />
• Speed and torque transducers are mounted in front of<br />
• A boost transmission is installed, because higher speed<br />
microphone signals<br />
and behind the transmission<br />
and higher torque are necessary<br />
• The analysis settings in Artemis are as following:<br />
• One speed transducer is mounted on each input shaft,<br />
• Speed and torque transducers are mounted in front of<br />
Window: Hanning<br />
output shaft and differential<br />
and behind the transmission<br />
Weighting: Fast<br />
• Rotec is used for measuring and analysis<br />
• Four microphones are positioned about one meter away<br />
Resolution: 0.1 order<br />
from the transmission sample (see Figure 3/ Figure 6)<br />
• The results are averaged over the three test runs and<br />
• 1 tri-axial accelerometer is installed (same position as in<br />
over the four microphones<br />
vehicle)<br />
• The values are drawn vs. the engine speed<br />
• Octobox and Artemis from HEAD acoustic are used for<br />
measuring and analyzing<br />
Figure 6: Measuring Points<br />
Figure 7: Measuring Process<br />
Figure 8: Torque vs Angle Displacement<br />
(a) Microphone Position<br />
(b) Shaft Layout<br />
20 Technics<br />
Technics 21
Fast and Accurate<br />
Whine Optimization Process<br />
Whine transfer<br />
Generally falls into two kinds (see Figure 2)<br />
• First is structure borne noise<br />
• Second is air borne noise<br />
Whine<br />
Fast and accurate whine optimization process (see Figure 1)<br />
Excitation<br />
Source<br />
Transfer<br />
Road<br />
Perfect international standard of “V” type whine optimization process, it can define accurately and is fast to solve<br />
systematic whine from the problem analysis to simulation.<br />
Transmission<br />
Structure Borne<br />
Air Borne<br />
Issue Reason<br />
Analysis<br />
Requirements<br />
Validation<br />
Validation<br />
Report<br />
Figure 2: Whine Analysis<br />
Here we mainly discuss internal influence factors<br />
Testing<br />
Analysis<br />
Gear<br />
Noise<br />
Vehicle<br />
Testing<br />
of transmission whine (see Figure 3 / Figure 4).<br />
Transmission<br />
TE<br />
Housing Modal<br />
and Stiffness<br />
Optimization<br />
Solution<br />
Transmission<br />
Bench Testing<br />
Gear Macro<br />
Parameter<br />
Gear Micro<br />
Parameter<br />
Bearing<br />
Clearance<br />
and Stiffness<br />
Shaft & Gear<br />
and Housing<br />
Stiffness<br />
Avoid<br />
Resonance<br />
Point<br />
Enhance<br />
Housing<br />
Stiffness<br />
Solution Simulation<br />
Analysis (CAF)<br />
Contact<br />
Pattern Testing<br />
Figure 3: Transmission Internal Whine Influential Factors<br />
Implementation<br />
Gear Macro Parameter<br />
• Mn/αn/Z/β<br />
• εα/εβ<br />
Figure 1: Whine Optimization Process<br />
Gear Micro Parameter<br />
• fHα/Cα/fHβ/Cβ/Fp/Fr<br />
• Gear Modification<br />
Whine optimization process explanation<br />
Whine reason analysis<br />
Whine principle<br />
Because the actual meshing gear cannot be carried out in accordance with the theory<br />
of involute meshing, it may cause the gear meshing transmission error, leading to gear<br />
vibration whine. Namely,<br />
Bearing Clearance and Stiffness<br />
Shaft & Gear and Housing Stiffness<br />
• Calculation and Control Bearing Clearance<br />
• Analysis Bearing Stiffness<br />
• Analysis Shaft Deflection<br />
• Analysis Housing Stiffness<br />
ω1 * R1 ≠ ω2 * R2<br />
Housing Modal a nd Stiffness<br />
• Analysis Resonance Point<br />
Figure 4: Transmission Hardware Design Whine Relative Parameters<br />
22 Technics<br />
Technics 23
Whine test and analysis<br />
To confirm the key factors<br />
affecting the whine generation<br />
and transfer through<br />
test of spectrum analysis.<br />
(see Figure 5)<br />
Whine simulation<br />
Contact pattern analysis on different load, and define<br />
gear micro modification parameter (see Figure 7).<br />
Whine optimization scheme<br />
Figure 5: Test Spectrum Analysis<br />
According to the whine design standard and test spectrum analysis, we put forward<br />
the corresponding optimization scheme, such as requirement of contact ratio, structure<br />
layout, bearing clearance, gears order analysis, etc. (see Figure 6)<br />
Figure 7: Contact Pattern Simulation<br />
Whine contact pattern test<br />
After all analysis has been finished, the gear contact pattern test needs to be implemented,<br />
and then validates if the gear modification is correct and reasonable (see Figure 8).<br />
Figure 6: Order and Parameter Analysis<br />
Figure 8: Contact Pattern Diagram<br />
24 Technics<br />
Technics 25
Whine bench test<br />
Whine vehicle test<br />
Original interior noise level<br />
Optimization interior noise level<br />
Through the transmission bench test to verify the whine<br />
improvement effect, and according to the relevant whine<br />
evaluation standard, to evaluate whether it can meet customer<br />
requirements (test bench see Figure 9).<br />
Whine optimization report<br />
If the whine bench test can meet customer requirements,<br />
the vehicle test does not generally have a problem; if the<br />
vehicle has the whine problem, it needs investigation and<br />
analysis from the related structure borne path, or resonance<br />
point of the vehicle.<br />
Overall noise<br />
Difference is only 1dB(A) between overall<br />
noise and 19 order noise → Unacceptable<br />
Difference is <strong>12</strong>dB(A) between overall noise<br />
and 19 order noise → Acceptable<br />
Combining the entire optimization process, the summary<br />
report will make the customer have the accumulation of<br />
experience and learning.<br />
19 order<br />
noise at 2 nd<br />
Sound pressure level dB(A)<br />
Engine order<br />
Coast 1000-5000 rpm<br />
Coast 1000-5000 rpm<br />
Gear modification significantly improved the gear noise level<br />
Figure 10: Whine Comparison Between Original and Optimization<br />
Figure 9: Transmission Noise Test Bench<br />
Original<br />
Figure 11: Whine Comparison between Original and Optimization<br />
Optimization<br />
Whine of transmission optimization example<br />
The gear modification is the most common and effective method at present, to solve the<br />
whine problem from the source. For example, transmission has unacceptable coast whine<br />
on 2 nd gear when the engine speed is at 1700 rpm~2300 rpm.<br />
Left ear<br />
Right ear<br />
Left ear<br />
Right ear<br />
See left of Figure 10; interior noise of 2 nd coast mode is dominated by 19 order noise of<br />
2 nd gear.<br />
Gear whine<br />
Engine order<br />
Optimization level<br />
Engine order<br />
The gear modification significantly improved the gear order noise levels, reduced noise<br />
more than 10 dB(A) at 2 nd gear, and reduced the vehicle noise level to an acceptable level<br />
(see Figure 10 / Figure 11) .<br />
19 order<br />
noise at 2 nd<br />
19 order<br />
noise at 2 nd<br />
Coast 1000-5000 rpm<br />
Coast 1000-5000 rpm<br />
<strong>26</strong> Technics<br />
Technics 27
News<br />
• GRC and WLY Set Up a Joint Venture Company in China<br />
• Shanghai Testing Expo<br />
• TMC Keynote Speech<br />
GRC and WLY Set Up<br />
a Joint Venture<br />
Company in China<br />
ATESTEO Gear Research Center (China) Co., Ltd. (GRC),<br />
who has set up a joint venture named GRC Automotive<br />
Technology (Zhejiang) Co., Ltd. with Zhejiang Wan Li<br />
Yang Co., Ltd. (WLY) on December 15 th , <strong>2016</strong>. The joint<br />
venture mainly engages in engineering and technical<br />
development services pertaining to MT, AT, CVT, DCT,<br />
and PHEV transmission as well as NEV drivetrains. It will<br />
fully integrate WLY’s market resource and production<br />
experience with GRC’s advanced development<br />
technologies and experience. The joint venture aims<br />
to improve traditional drivetrain know-how and fill<br />
the gap of transmission technology in China, so as<br />
to satisfy the demand of OEMs in drivetrain systems<br />
for traditional and new energy vehicles. It also works<br />
closely with the OEMs and the component suppliers on<br />
research and development, to create a sound ecosystem<br />
for China’s automotive industry!<br />
Shanghai Testing<br />
Expo<br />
The <strong>2016</strong> Automotive Testing Exhibition was held on<br />
27 th to 29 th of September in Shanghai. As the leader of<br />
automotive transmission industry, GRC’s products<br />
were displayed in Hall 3 Booth 11003 of the exhibition<br />
which was located in Shanghai World Expo Exhibition<br />
& Convention Center. In the exhibition, GRC presented<br />
a diverse range of high-tech products of transmission<br />
and vehicle testing, including torque measurement<br />
systems, shifting actuators, high-end equipment, and<br />
functional development and testing of drivetrain.<br />
The GRC booth with the measurement equipments<br />
attracted lots of visitors, and GRC experts gave<br />
professional explanations to them. During the<br />
exhibition, GRC got the information of over 80<br />
customers who showed interest in our business.<br />
This achievement greatly promotes the expansion<br />
of our business, and builds up our professional and<br />
customer-oriented corporate image.<br />
TMC Keynote Speech<br />
The 8 th TMC Seminar was held on 29 th and 30 th of<br />
April in Beijing. As the long-term and stable partner,<br />
GRC engineering manager, Mr. Yang Jiafeng made a<br />
technical speech titled “The Software Development<br />
of New Energy Automotive Driving System” in the first<br />
day of the seminar. After Mr. Yang had a brief introduction<br />
about the company’s rebranding, he elaborated<br />
GRC’s research and software development capabilities<br />
of the new energy automotive driving system, and GRC<br />
released the plan to promote and extend the testing<br />
technique of the driving system in the seminar.<br />
28 News<br />
News 29
Upcoming Events in 2017<br />
China<br />
International<br />
20 – 21 April<br />
TMC 2017<br />
Shanghai, China<br />
24 – <strong>26</strong> May<br />
20 – 22 June<br />
05 – 06 July<br />
19 – 21 September<br />
JSAE Automotive Engineering Exposition<br />
Yokohama, Japan<br />
2017 Testing Expo Europe<br />
Stuttgart, Germany<br />
VDI Tagung<br />
Bonn, Germany<br />
2017 Testing Expo China<br />
Shanghai, China<br />
Imprint<br />
GRC <strong>Newsletter</strong><br />
ATESTEO Gear Research Center (China) Co., Ltd.<br />
Publisher<br />
ATESTEO Gear Research Center (China) Co., Ltd.<br />
No. 11 Anzhi Street Suzhou Industrial Park<br />
215024 Suzhou, Jiangsu Province, China<br />
Telephone +86 5<strong>12</strong> 6289 6000<br />
Fax +86 5<strong>12</strong> 6289 6039<br />
www.<strong>atesteo</strong>.cn.com<br />
Project Leader<br />
Mr. Martin Börner, Marketing Director, ATESTEO GmbH (Germany)<br />
Mr. Xu Dafang, Marketing Manager, ATESTEO Gear Research Center (China) Co., Ltd.<br />
20 – 22 September<br />
24 – <strong>26</strong> October<br />
CTI Symposium China<br />
Shanghai, China<br />
2017 Testing Expo North America<br />
Novi, MI, USA<br />
20 – 22 December<br />
CTI Symposium Germany<br />
Berlin, Germany<br />
Responsible for content<br />
Dr. Kan Lei, Chairman, ATESTEO Gear Research Center (China) Co., Ltd.<br />
Mr. Zhang Dongguo, Application Engineer, ATESTEO Gear Research Center (China) Co., Ltd.<br />
Mr. Song Wenjie, Design Engineer, ATESTEO Gear Research Center (China) Co., Ltd.<br />
Mr. Zhao Jin, Application Engineer, ATESTEO Gear Research Center (China) Co., Ltd.<br />
Mr. Wang Jiangbo, Design Engineer, ATESTEO Gear Research Center (China) Co., Ltd.<br />
Mr. Wang Ke, Marketing Assistant, ATESTEO Gear Research Center (China) Co., Ltd.<br />
Concept/Design<br />
INCREON<br />
For more information www.<strong>atesteo</strong>.cn.com<br />
30 Upcoming Events Imprint 31
ATESTEO Gear Research Center (China) Co., Ltd.<br />
No. 11 Anzhi Street Suzhou Industrial Park<br />
215024 Suzhou, Jiangsu Province<br />
China<br />
Telephone +86 5<strong>12</strong> 6289 6000<br />
Fax +86 5<strong>12</strong> 6289 6039<br />
info@<strong>atesteo</strong>.cn.com<br />
ATESTEO GmbH<br />
Konrad-Zuse-Strasse 3<br />
52477 Alsdorf<br />
Germany<br />
Telephone +49 2404 9870 0<br />
Fax +49 2404 9870 109<br />
info@<strong>atesteo</strong>.com<br />
www.<strong>atesteo</strong>.cn.com