

HERB
KQBk307DTJl
KQBk307DTJl

Create successful ePaper yourself
Turn your PDF publications into a flip-book with our unique Google optimized e-Paper software.
with tens to hundreds of papers indexed each conference<br />
year for each conference. In total we have analyzed<br />
67,873 Scopus conference proceedings records. Their<br />
importance for the field is matched by their combined<br />
citation count: 765,506 at the time of writing this paper<br />
in Scopus and much more in Google Scholar. Yearly<br />
publication counts in our set grew from 5,491 in 2005 to<br />
7,747 in 2015.<br />
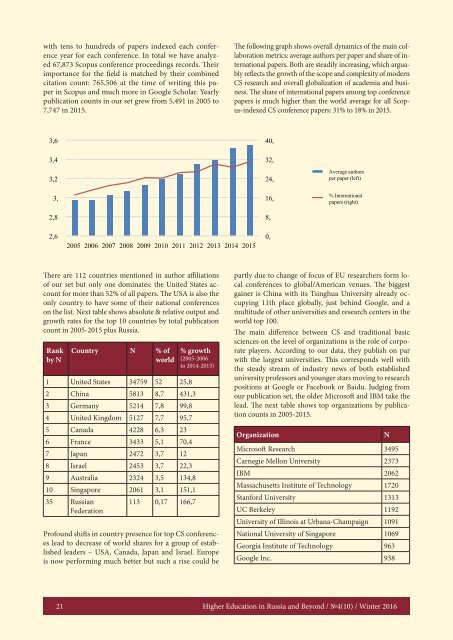
The following graph shows overall dynamics of the main collaboration<br />
metrics: average authors per paper and share of international<br />
papers. Both are steadily increasing, which arguably<br />
reflects the growth of the scope and complexity of modern<br />
CS research and overall globalization of academia and business.<br />
The share of international papers among top conference<br />
papers is much higher than the world average for all Scopus-indexed<br />
CS conference papers: 31% to 18% in 2015.<br />
3,6<br />
3,4<br />
40,<br />
32,<br />
3,2<br />
3,<br />
2,8<br />
24,<br />
16,<br />
8,<br />
Average authors<br />
per paper (left)<br />
% International<br />
papers (right)<br />
2,6<br />
2005 2006 2007 2008 2009 2010 2011 2012 2013 2014 2015<br />
0,<br />
There are 112 countries mentioned in author affiliations<br />
of our set but only one dominates: the United States account<br />
for more than 52% of all papers. The USA is also the<br />
only country to have some of their national conferences<br />
on the list. Next table shows absolute & relative output and<br />
growth rates for the top 10 countries by total publication<br />
count in 2005-2015 plus Russia.<br />
Rank<br />
by N<br />
Country N % of<br />
world<br />
1 United States 34759 52 25,8<br />
2 China 5813 8,7 431,3<br />
3 Germany 5214 7,8 99,8<br />
4 United Kingdom 5127 7,7 95,7<br />
5 Canada 4228 6,3 23<br />
6 France 3433 5,1 70,4<br />
7 Japan 2472 3,7 12<br />
8 Israel 2453 3,7 22,3<br />
9 Australia 2324 3,5 134,8<br />
10 Singapore 2061 3,1 151,1<br />
35 Russian<br />
Federation<br />
113 0,17 166,7<br />
% growth<br />
(2005-2006<br />
to 2014-2015)<br />
Profound shifts in country presence for top CS conferences<br />
lead to decrease of world shares for a group of established<br />
leaders – USA, Canada, Japan and Israel. Europe<br />
is now performing much better but such a rise could be<br />
partly due to change of focus of EU researchers form local<br />
conferences to global/American venues. The biggest<br />
gainer is China with its Tsinghua University already occupying<br />
11th place globally, just behind Google, and a<br />
multitude of other universities and research centers in the<br />
world top 100.<br />
The main difference between CS and traditional basic<br />
sciences on the level of organizations is the role of corporate<br />
players. According to our data, they publish on par<br />
with the largest universities. This corresponds well with<br />
the steady stream of industry news of both established<br />
university professors and younger stars moving to research<br />
positions at Google or Facebook or Baidu. Judging from<br />
our publication set, the older Microsoft and IBM take the<br />
lead. The next table shows top organizations by publication<br />
counts in 2005-2015.<br />
Organization<br />
Microsoft Research 3495<br />
Carnegie Mellon University 2373<br />
IBM 2062<br />
Massachusetts Institute of Technology 1720<br />
Stanford University 1313<br />
UC Berkeley 1192<br />
University of Illinois at Urbana-Champaign 1091<br />
National University of Singapore 1069<br />
Georgia Institute of Technology 963<br />
Google Inc. 938<br />
N<br />
21<br />
Higher Education in Russia and Beyond / №4(10) / Winter 2016