

Not-your-fathers-oil-and-gas-business
Not-your-fathers-oil-and-gas-business
Not-your-fathers-oil-and-gas-business

Create successful ePaper yourself
Turn your PDF publications into a flip-book with our unique Google optimized e-Paper software.
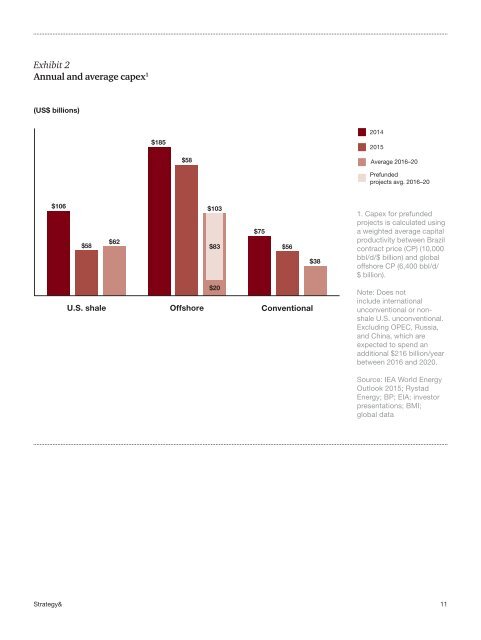
Exhibit 2<br />
Annual <strong>and</strong> average capex 1<br />
(US$ billions)<br />
$185<br />
2014<br />
2015<br />
$58<br />
Average 2016–20<br />
Prefunded<br />
projects avg. 2016–20<br />
$106<br />
$58<br />
$62<br />
$103<br />
$83<br />
$75<br />
$56<br />
$38<br />
1. Capex for prefunded<br />
projects is calculated using<br />
a weighted average capital<br />
productivity between Brazil<br />
contract price (CP) (10,000<br />
bbl/d/$ billion) <strong>and</strong> global<br />
offshore CP (6,400 bbl/d/<br />
$ billion).<br />
U.S. shale<br />
Offshore<br />
$20<br />
Conventional<br />
<strong>Not</strong>e: Does not<br />
include international<br />
unconventional or nonshale<br />
U.S. unconventional.<br />
Excluding OPEC, Russia,<br />
<strong>and</strong> China, which are<br />
expected to spend an<br />
additional $216 billion/year<br />
between 2016 <strong>and</strong> 2020.<br />
Source: IEA World Energy<br />
Outlook 2015; Rystad<br />
Energy; BP; EIA; investor<br />
presentations; BMI;<br />
global data<br />
Strategy&<br />
11