

Not-your-fathers-oil-and-gas-business
Not-your-fathers-oil-and-gas-business
Not-your-fathers-oil-and-gas-business

You also want an ePaper? Increase the reach of your titles
YUMPU automatically turns print PDFs into web optimized ePapers that Google loves.
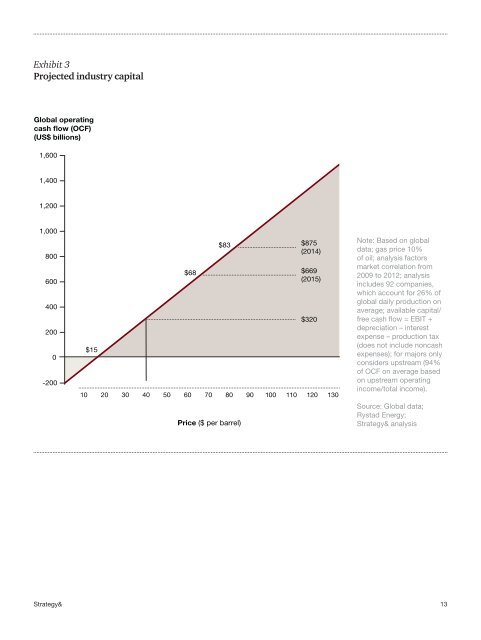
Exhibit 3<br />
Projected industry capital<br />
Global operating<br />
cash flow (OCF)<br />
(US$ billions)<br />
1,600<br />
1,400<br />
1,200<br />
1,000<br />
800<br />
600<br />
400<br />
200<br />
0<br />
-200<br />
$15<br />
$68<br />
$83<br />
Price ($ per barrel)<br />
$875<br />
(2014)<br />
$669<br />
(2015)<br />
$320<br />
10 20 30 40 50 60 70 80 90 100 110 120 130<br />
<strong>Not</strong>e: Based on global<br />
data; <strong>gas</strong> price 10%<br />
of <strong>oil</strong>; analysis factors<br />
market correlation from<br />
2009 to 2012; analysis<br />
includes 92 companies,<br />
which account for 26% of<br />
global daily production on<br />
average; available capital/<br />
free cash flow = EBIT +<br />
depreciation – interest<br />
expense – production tax<br />
(does not include noncash<br />
expenses); for majors only<br />
considers upstream (94%<br />
of OCF on average based<br />
on upstream operating<br />
income/total income).<br />
Source: Global data;<br />
Rystad Energy;<br />
Strategy& analysis<br />
Strategy&<br />
13