Food Enzymes Market - Global Forecasts to 2021
This Report provided by GrandResearchStore is about, the food enzymes market, in terms of type, application, source, formulation, and region. The food enzymes market has grown rapidly in the last few years and this trend is projected to continue over the next five years. The market is projected to reach a value of USD 2.94 billion by 2021, at a CAGR of 7.4% from 2016.
This Report provided by GrandResearchStore is about, the food enzymes market, in terms of type, application, source, formulation, and region. The food enzymes market has grown rapidly in the last few years and this trend is projected to continue over the next five years. The market is projected to reach a value of USD 2.94 billion by 2021, at a CAGR of 7.4% from 2016.

You also want an ePaper? Increase the reach of your titles
YUMPU automatically turns print PDFs into web optimized ePapers that Google loves.
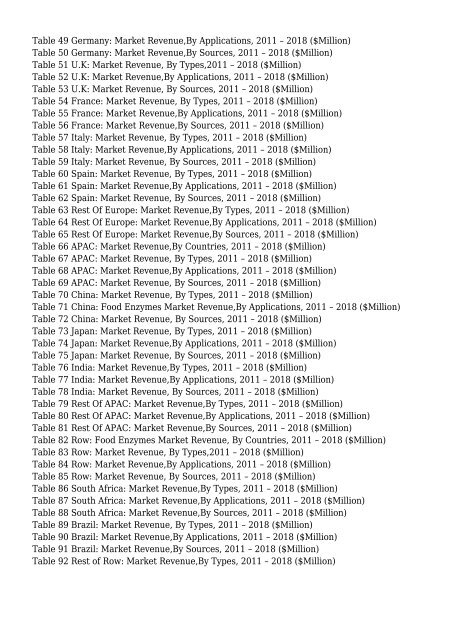
Table 49 Germany: <strong>Market</strong> Revenue,By Applications, 2011 – 2018 ($Million)<br />
Table 50 Germany: <strong>Market</strong> Revenue,By Sources, 2011 – 2018 ($Million)<br />
Table 51 U.K: <strong>Market</strong> Revenue, By Types,2011 – 2018 ($Million)<br />
Table 52 U.K: <strong>Market</strong> Revenue,By Applications, 2011 – 2018 ($Million)<br />
Table 53 U.K: <strong>Market</strong> Revenue, By Sources, 2011 – 2018 ($Million)<br />
Table 54 France: <strong>Market</strong> Revenue, By Types, 2011 – 2018 ($Million)<br />
Table 55 France: <strong>Market</strong> Revenue,By Applications, 2011 – 2018 ($Million)<br />
Table 56 France: <strong>Market</strong> Revenue,By Sources, 2011 – 2018 ($Million)<br />
Table 57 Italy: <strong>Market</strong> Revenue, By Types, 2011 – 2018 ($Million)<br />
Table 58 Italy: <strong>Market</strong> Revenue,By Applications, 2011 – 2018 ($Million)<br />
Table 59 Italy: <strong>Market</strong> Revenue, By Sources, 2011 – 2018 ($Million)<br />
Table 60 Spain: <strong>Market</strong> Revenue, By Types, 2011 – 2018 ($Million)<br />
Table 61 Spain: <strong>Market</strong> Revenue,By Applications, 2011 – 2018 ($Million)<br />
Table 62 Spain: <strong>Market</strong> Revenue, By Sources, 2011 – 2018 ($Million)<br />
Table 63 Rest Of Europe: <strong>Market</strong> Revenue,By Types, 2011 – 2018 ($Million)<br />
Table 64 Rest Of Europe: <strong>Market</strong> Revenue,By Applications, 2011 – 2018 ($Million)<br />
Table 65 Rest Of Europe: <strong>Market</strong> Revenue,By Sources, 2011 – 2018 ($Million)<br />
Table 66 APAC: <strong>Market</strong> Revenue,By Countries, 2011 – 2018 ($Million)<br />
Table 67 APAC: <strong>Market</strong> Revenue, By Types, 2011 – 2018 ($Million)<br />
Table 68 APAC: <strong>Market</strong> Revenue,By Applications, 2011 – 2018 ($Million)<br />
Table 69 APAC: <strong>Market</strong> Revenue, By Sources, 2011 – 2018 ($Million)<br />
Table 70 China: <strong>Market</strong> Revenue, By Types, 2011 – 2018 ($Million)<br />
Table 71 China: <strong>Food</strong> <strong>Enzymes</strong> <strong>Market</strong> Revenue,By Applications, 2011 – 2018 ($Million)<br />
Table 72 China: <strong>Market</strong> Revenue, By Sources, 2011 – 2018 ($Million)<br />
Table 73 Japan: <strong>Market</strong> Revenue, By Types, 2011 – 2018 ($Million)<br />
Table 74 Japan: <strong>Market</strong> Revenue,By Applications, 2011 – 2018 ($Million)<br />
Table 75 Japan: <strong>Market</strong> Revenue, By Sources, 2011 – 2018 ($Million)<br />
Table 76 India: <strong>Market</strong> Revenue,By Types, 2011 – 2018 ($Million)<br />
Table 77 India: <strong>Market</strong> Revenue,By Applications, 2011 – 2018 ($Million)<br />
Table 78 India: <strong>Market</strong> Revenue, By Sources, 2011 – 2018 ($Million)<br />
Table 79 Rest Of APAC: <strong>Market</strong> Revenue,By Types, 2011 – 2018 ($Million)<br />
Table 80 Rest Of APAC: <strong>Market</strong> Revenue,By Applications, 2011 – 2018 ($Million)<br />
Table 81 Rest Of APAC: <strong>Market</strong> Revenue,By Sources, 2011 – 2018 ($Million)<br />
Table 82 Row: <strong>Food</strong> <strong>Enzymes</strong> <strong>Market</strong> Revenue, By Countries, 2011 – 2018 ($Million)<br />
Table 83 Row: <strong>Market</strong> Revenue, By Types,2011 – 2018 ($Million)<br />
Table 84 Row: <strong>Market</strong> Revenue,By Applications, 2011 – 2018 ($Million)<br />
Table 85 Row: <strong>Market</strong> Revenue, By Sources, 2011 – 2018 ($Million)<br />
Table 86 South Africa: <strong>Market</strong> Revenue,By Types, 2011 – 2018 ($Million)<br />
Table 87 South Africa: <strong>Market</strong> Revenue,By Applications, 2011 – 2018 ($Million)<br />
Table 88 South Africa: <strong>Market</strong> Revenue,By Sources, 2011 – 2018 ($Million)<br />
Table 89 Brazil: <strong>Market</strong> Revenue, By Types, 2011 – 2018 ($Million)<br />
Table 90 Brazil: <strong>Market</strong> Revenue,By Applications, 2011 – 2018 ($Million)<br />
Table 91 Brazil: <strong>Market</strong> Revenue,By Sources, 2011 – 2018 ($Million)<br />
Table 92 Rest of Row: <strong>Market</strong> Revenue,By Types, 2011 – 2018 ($Million)