Study and analysis of feeds and fertilizers for sustainable - eXtension
Study and analysis of feeds and fertilizers for sustainable - eXtension
Study and analysis of feeds and fertilizers for sustainable - eXtension

You also want an ePaper? Increase the reach of your titles
YUMPU automatically turns print PDFs into web optimized ePapers that Google loves.
<strong>Study</strong> <strong>and</strong> <strong>analysis</strong> <strong>of</strong> <strong>feeds</strong><br />
<strong>and</strong> <strong>fertilizers</strong> <strong>for</strong> <strong>sustainable</strong><br />
aquaculture development<br />
FAO<br />
FISHERIES<br />
TECHNICAL<br />
PAPER<br />
497<br />
ISSN 0429-9345
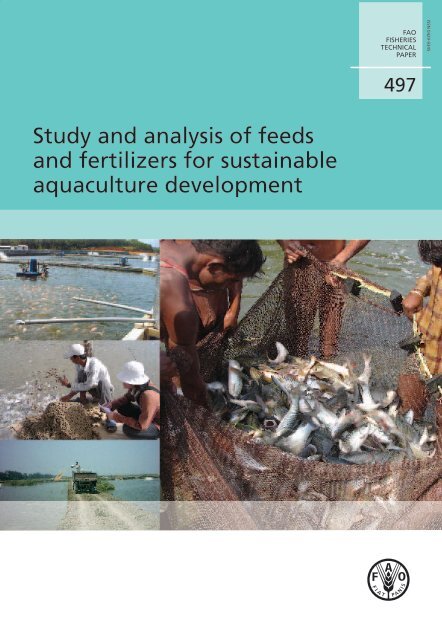
Cover photographs:<br />
Left top to bottom: Automatic silo feeders used in the intensive culture <strong>of</strong> tilapia in concrete tanks<br />
in Malaysia (courtesy <strong>of</strong> INFOFISH-Tarlochan Singh). Feeding semi-moist, farm-made feed to pangasiid<br />
catfish in ponds, Viet Nam (courtesy <strong>of</strong> L.T. Thanh Truc). Manual feeding <strong>of</strong> cultured fish at Barsiq Fish<br />
Farm, Behaira, Egypt (courtesy <strong>of</strong> Abdel-Fattah M. El-Sayed).<br />
Right: Harvest <strong>of</strong> Indian major (catla, rohu <strong>and</strong> mrigal) <strong>and</strong> exotic (silver, grass <strong>and</strong> common) carps<br />
from a polyculture pond, Punjab, India (courtesy <strong>of</strong> Abhijit Paul).
<strong>Study</strong> <strong>and</strong> <strong>analysis</strong> <strong>of</strong> <strong>feeds</strong><br />
<strong>and</strong> <strong>fertilizers</strong> <strong>for</strong> <strong>sustainable</strong><br />
aquaculture development<br />
Edited by<br />
Mohammad R. Hasan<br />
Aquaculture Management <strong>and</strong> Conservation Service<br />
Fisheries <strong>and</strong> Aquaculture Management Division<br />
FAO Fisheries <strong>and</strong> Aquaculture Department<br />
Rome, Italy<br />
Thomas Hecht<br />
Rhodes University<br />
Grahamstown, South Africa<br />
Sena S. De Silva<br />
Network <strong>of</strong> Aquaculture Centres in Asia-Pacific<br />
Bangkok, Thail<strong>and</strong><br />
<strong>and</strong><br />
Albert G.J. Tacon<br />
FAO Consultant<br />
Hawaii, United States <strong>of</strong> America<br />
FOOD AND AGRICULTURE ORGANIZATION OF THE UNITED NATIONS<br />
Rome, 2007<br />
FAO<br />
FISHERIES<br />
TECHNICAL<br />
PAPER<br />
497
The designations employed <strong>and</strong> the presentation <strong>of</strong> material in this in<strong>for</strong>mation<br />
product do not imply the expression <strong>of</strong> any opinion whatsoever on the part<br />
<strong>of</strong> the Food <strong>and</strong> Agriculture Organization <strong>of</strong> the United Nations (FAO) concerning the<br />
legal or development status <strong>of</strong> any country, territory, city or area or <strong>of</strong> its authorities,<br />
or concerning the delimitation <strong>of</strong> its frontiers or boundaries. The mention <strong>of</strong> specific<br />
companies or products <strong>of</strong> manufacturers, whether or not these have been patented, does<br />
not imply that these have been endorsed or recommended by FAO in preference to<br />
others <strong>of</strong> a similar nature that are not mentioned.<br />
The views expressed in this in<strong>for</strong>mation product are those <strong>of</strong> the authors <strong>and</strong><br />
do not necessarily reflect the views <strong>of</strong> FAO.<br />
ISBN 978-92-5-105862-6<br />
All rights reserved. Reproduction <strong>and</strong> dissemination <strong>of</strong> material in this in<strong>for</strong>mation<br />
product <strong>for</strong> educational or other non-commercial purposes are authorized without<br />
any prior written permission from the copyright holders provided the source is fully<br />
acknowledged. Reproduction <strong>of</strong> material in this in<strong>for</strong>mation product <strong>for</strong> resale or other<br />
commercial purposes is prohibited without written permission <strong>of</strong> the copyright holders.<br />
Applications <strong>for</strong> such permission should be addressed to:<br />
Chief<br />
Electronic Publishing Policy <strong>and</strong> Support Branch<br />
Communication Division<br />
FAO<br />
Viale delle Terme di Caracalla, 00153 Rome, Italy<br />
or by e-mail to:<br />
copyright@fao.org<br />
© FAO 2007
Preparation <strong>of</strong> this document<br />
This document was prepared by a group <strong>of</strong> experts under the leadership <strong>of</strong> Dr Mohammad<br />
R. Hasan as part <strong>of</strong> the FAO Aquaculture Management <strong>and</strong> Conservation Service’s<br />
(FIMA) on-going programme entity “Monitoring, Management <strong>and</strong> Conservation<br />
<strong>of</strong> Resources <strong>for</strong> Aquaculture Development”. A number <strong>of</strong> country reviews <strong>and</strong> case<br />
studies from Asia, Africa <strong>and</strong> a regional review <strong>for</strong> Latin America were commissioned<br />
to provide an overview <strong>of</strong> aquaculture <strong>and</strong> an <strong>analysis</strong> <strong>of</strong> feed <strong>and</strong> fertilizer use <strong>for</strong> the<br />
<strong>sustainable</strong> development <strong>of</strong> the sector. To reflect the diversity <strong>of</strong> aquaculture systems<br />
<strong>and</strong> practices in these regions seven countries were selected from Asia (Bangladesh,<br />
China, India, Indonesia, the Philippines, Thail<strong>and</strong> <strong>and</strong> Viet Nam), six from Latin<br />
America (Brazil, Chile, Cuba, Ecuador, Mexico <strong>and</strong> the Bolivarian Republic <strong>of</strong><br />
Venezuela) <strong>and</strong> eight from Africa (Cameroon, Egypt, Ghana, Kenya, Malawi, Nigeria,<br />
Ug<strong>and</strong>a <strong>and</strong> Zambia). The country reviews <strong>for</strong> Asia <strong>and</strong> sub-Saharan Africa were<br />
synthesized, <strong>and</strong> a global synthesis was prepared on the basis <strong>of</strong> the three regional<br />
reviews (Asia, Latin America <strong>and</strong> sub-Saharan Africa). In addition <strong>and</strong> as part <strong>of</strong> the<br />
FIMA work programme, a targeted workshop on “Use <strong>of</strong> <strong>feeds</strong> <strong>and</strong> <strong>fertilizers</strong> <strong>for</strong><br />
<strong>sustainable</strong> aquaculture development” was held in Wuxi, Jiangsu Province, China, on<br />
18-21 March 2006. The workshop was organized by FIMA <strong>of</strong> FAO in collaboration<br />
with the Freshwater Fisheries Research Centre (FFRC) <strong>of</strong> China <strong>and</strong> the Network <strong>of</strong><br />
Aquaculture Centres in Asia-Pacific (NACA).<br />
Eight Asian <strong>and</strong> six African country reviews, a case study from Viet Nam, the three<br />
regional reviews <strong>and</strong> the global synthesis <strong>and</strong> the report <strong>of</strong> the workshop are included<br />
in this document. The report <strong>and</strong> recommendations <strong>of</strong> the workshop were circulated<br />
among the participants <strong>of</strong> the workshop <strong>and</strong> FAO FIMA technical <strong>of</strong>ficers <strong>for</strong> comment<br />
<strong>and</strong> the final report is incorporated in this technical paper.<br />
The manuscripts in this technical paper were reviewed <strong>and</strong> technically edited by<br />
an editorial team led by Dr Mohammad R. Hasan. With a few exceptions, most <strong>of</strong><br />
the reports included in the document were reviewed <strong>and</strong> edited in early 2007 be<strong>for</strong>e<br />
the FAO FishStat data <strong>for</strong> 2005 was released <strong>and</strong> hence data contained in most <strong>of</strong> the<br />
reports are <strong>for</strong> 2004. Updated aquaculture data <strong>for</strong> 2005 are available on FishStat (2007)<br />
(www.fao.org/fi/statist/FISOFT/FISHPLUS.asp). For consistency <strong>and</strong> con<strong>for</strong>mity,<br />
scientific <strong>and</strong> English common names <strong>of</strong> fish species were used from FishBase (http://<br />
www.fishbase.org/home.htm). Most <strong>of</strong> the photographs in the country reviews <strong>and</strong> in<br />
the regional syntheses were provided by the authors. Where this is not the case, due<br />
acknowledgements are made to the contributors.<br />
Much gratitude is due to the review <strong>and</strong> case study authors, who faced an enormous<br />
task <strong>and</strong> showed equally enormous patience with the editors. We acknowledge<br />
Ms Helen Nakouzi, Ms Hasini Wijesuriya, Ms Elena Irde <strong>and</strong> Ms Marika Panzironi<br />
<strong>for</strong> their assistance in word processing, Ms Tina Farmer, Ms Francoise Schatto <strong>and</strong><br />
Ms Chrissi Smith-Redfern <strong>for</strong> their assistance in quality control <strong>and</strong> FAO house style<br />
<strong>and</strong> Mr José Luis Castilla Civit <strong>for</strong> layout design. The publishing <strong>and</strong> distribution <strong>of</strong> the<br />
document were undertaken by FAO, Rome.<br />
Finally, Mr Jiansan Jia, Service Chief <strong>and</strong> Dr Rohana P. Subasinghe, Senior Fishery<br />
Resources Officer (Aquaculture), FAO Aquaculture Management <strong>and</strong> Conservation<br />
Service are gratefully acknowledged <strong>for</strong> providing the means, technical advice <strong>and</strong> moral<br />
support to initiate the study <strong>and</strong> to complete the publication.<br />
iii
iv<br />
Abstract<br />
This compendium provides a comprehensive overview <strong>of</strong> feed <strong>and</strong> fertilizer use <strong>for</strong><br />
<strong>sustainable</strong> aquaculture development in developing countries. It comprises <strong>of</strong> a series<br />
<strong>of</strong> review papers, including eight country reviews from Asia (Bangladesh, China, India,<br />
Indonesia, the Philippines, Thail<strong>and</strong> <strong>and</strong> Viet Nam), six country reviews from Africa<br />
(Cameroon, Egypt, Kenya, Malawi, Nigeria <strong>and</strong> Ug<strong>and</strong>a), one case study report from<br />
Asia, three regional reviews (Asia, Latin America <strong>and</strong> sub-Saharan Africa), a global<br />
synthesis as well as the final report <strong>of</strong> the FAO Expert Workshop on “Use <strong>of</strong> <strong>feeds</strong> <strong>and</strong><br />
<strong>fertilizers</strong> <strong>for</strong> <strong>sustainable</strong> aquaculture development”, held in Wuxi, Jiangsu Province,<br />
China, on 18-21 March 2006.<br />
The country reviews provide an overview <strong>of</strong> the current status <strong>of</strong> aquaculture,<br />
a synthesis <strong>of</strong> the availability, accessibility <strong>and</strong> use <strong>of</strong> feed <strong>and</strong> fertilizer resources<br />
in relation to the diversity <strong>of</strong> farming systems <strong>and</strong> practices <strong>and</strong> an <strong>analysis</strong> <strong>of</strong> the<br />
nutritional, economic <strong>and</strong> social constraints <strong>of</strong> using these inputs. The regional reviews<br />
provide a synthesis <strong>of</strong> the country reviews by considering production trends <strong>and</strong> feed<br />
<strong>and</strong> fertilizer use from a wider geographic perspective <strong>and</strong> also analysed the projected<br />
expansion <strong>of</strong> the aquaculture sector in relation to the future availability <strong>of</strong> input<br />
commodities. The global synthesis provides a general overview <strong>and</strong> summarizes the<br />
future challenges facing the sector with respect to the use <strong>of</strong> <strong>feeds</strong> <strong>and</strong> <strong>fertilizers</strong>. The<br />
reviews as well as the case study reports provided the background in<strong>for</strong>mation <strong>for</strong> the<br />
working group sessions <strong>of</strong> the workshop.<br />
The working groups focused on the important role <strong>of</strong> farm-made aqua<strong>feeds</strong> in<br />
Asia <strong>and</strong> the need to develop <strong>and</strong> promote the use <strong>of</strong> farm-made <strong>feeds</strong> in sub-Saharan<br />
Africa, considered issues pertaining to the production <strong>and</strong> safe use <strong>of</strong> aqua<strong>feeds</strong> <strong>and</strong><br />
deliberated on the constraints faced by industrial <strong>and</strong> small-scale aquafeed producers.<br />
Several key issues <strong>and</strong> constraints were identified, categorized <strong>and</strong> prioritized <strong>and</strong><br />
appropriate actions were recommended. The workshop recommended that FAO<br />
undertake the following actions to assist regional organizations <strong>and</strong> member country<br />
governments to address the following identified issues <strong>and</strong> constraints on a regional<br />
<strong>and</strong> global perspective:<br />
• review existing national st<strong>and</strong>ards <strong>and</strong> legislation regarding nutrient specifications<br />
(where these exist) <strong>for</strong> the manufacture <strong>of</strong> industrial <strong>and</strong> farm-made aqua<strong>feeds</strong>, <strong>and</strong><br />
to provide guidelines <strong>and</strong> advisory material <strong>for</strong> different farming systems, practices<br />
<strong>and</strong> feed types;<br />
• review existing national incentive mechanisms, subsidies <strong>and</strong> taxes affecting<br />
the animal feed manufacturing sector <strong>and</strong> feed ingredient usage, including feed<br />
commodity imports <strong>and</strong> exports <strong>and</strong> developing domestic promotion strategies;<br />
• compile synopses <strong>of</strong> the nutritional requirements <strong>of</strong> major cultured fish species<br />
<strong>and</strong> the feed ingredients currently used in compound/farm-made aqua<strong>feeds</strong>,<br />
including national/regional feed ingredient source books containing in<strong>for</strong>mation<br />
on nutrient composition, quality control criteria, seasonal availability <strong>and</strong> market<br />
price;<br />
• encourage the strengthening <strong>of</strong> national/regional dialogue, exchange <strong>of</strong> in<strong>for</strong>mation<br />
<strong>and</strong> assist with the setting <strong>of</strong> research priorities between researchers, the public<br />
sector <strong>and</strong> the aquaculture sector (including farmers <strong>and</strong> feed manufacturers), by<br />
supporting the activities <strong>of</strong> national/regional organizations, implementation <strong>of</strong><br />
joint research projects, establishment <strong>of</strong> national farmer/aquafeed associations, <strong>and</strong><br />
the development <strong>of</strong> web-based in<strong>for</strong>mation <strong>and</strong> research networks; <strong>and</strong>
• strengthen capacity <strong>of</strong> farmers, feed manufacturers, private service providers,<br />
researchers <strong>and</strong> extension workers in aquaculture nutrition <strong>and</strong> feed technology,<br />
including on-farm feed management in developing countries (particularly in sub-<br />
Saharan Africa), <strong>and</strong> promote interregional cooperation.<br />
Hasan, M.R.; Hecht, T.; De Silva, S.S.; Tacon, A.G.J. (eds).<br />
<strong>Study</strong> <strong>and</strong> <strong>analysis</strong> <strong>of</strong> <strong>feeds</strong> <strong>and</strong> <strong>fertilizers</strong> <strong>for</strong> <strong>sustainable</strong> aquaculture development.<br />
FAO Fisheries Technical Paper. No. 497. Rome, FAO. 2007. 510p.<br />
v
Contents<br />
Preparation <strong>of</strong> this document iii<br />
Abstract iv<br />
Contributors ix<br />
Foreword xi<br />
Executive summary xiii<br />
Abbreviations <strong>and</strong> acronyms xvi<br />
GLOBAL SYNTHESIS AND REGIONAL REVIEWS 1<br />
Global synthesis <strong>of</strong> <strong>feeds</strong> <strong>and</strong> nutrients <strong>for</strong> <strong>sustainable</strong> aquaculture<br />
development 3<br />
Albert G.J. Tacon <strong>and</strong> Mohammad R. Hasan<br />
Feeds <strong>and</strong> <strong>fertilizers</strong>: the key to long-term sustainability <strong>of</strong><br />
Asian aquaculture 19<br />
Sena S. De Silva <strong>and</strong> Mohammad R. Hasan<br />
Feeds <strong>and</strong> <strong>fertilizers</strong> <strong>for</strong> <strong>sustainable</strong> aquaculture development:<br />
a regional review <strong>for</strong> Latin America 49<br />
A. Flores-Nava<br />
Review <strong>of</strong> <strong>feeds</strong> <strong>and</strong> <strong>fertilizers</strong> <strong>for</strong> <strong>sustainable</strong> aquaculture<br />
development in sub-Saharan Africa 77<br />
Thomas Hecht<br />
COUNTRY REVIEWS AND CASE STUDY: ASIA 111<br />
Analysis <strong>of</strong> <strong>feeds</strong> <strong>and</strong> <strong>fertilizers</strong> <strong>for</strong> <strong>sustainable</strong> aquaculture<br />
development in Bangladesh 113<br />
Benoy K. Barman <strong>and</strong> Manjurul Karim<br />
Analysis <strong>of</strong> <strong>feeds</strong> <strong>and</strong> <strong>fertilizers</strong> <strong>for</strong> <strong>sustainable</strong> aquaculture<br />
development in China 141<br />
M. Weimin <strong>and</strong> L. Mengqing<br />
Analysis <strong>of</strong> <strong>feeds</strong> <strong>and</strong> <strong>fertilizers</strong> <strong>for</strong> <strong>sustainable</strong> aquaculture<br />
development in India 191<br />
S. Ayyappan <strong>and</strong> S. Ahamad Ali<br />
Development <strong>of</strong> the aquafeed industry in India 221<br />
A. Victor Suresh<br />
Analysis <strong>of</strong> <strong>feeds</strong> <strong>and</strong> <strong>fertilizers</strong> <strong>for</strong> <strong>sustainable</strong> aquaculture<br />
development in Indonesia 245<br />
Abidin Nur<br />
Analysis <strong>of</strong> <strong>feeds</strong> <strong>and</strong> <strong>fertilizers</strong> <strong>for</strong> <strong>sustainable</strong> aquaculture<br />
development in the Philippines 269<br />
Neila S. Sumagaysay-Chavoso<br />
Analysis <strong>of</strong> <strong>feeds</strong> <strong>and</strong> <strong>fertilizers</strong> <strong>for</strong> <strong>sustainable</strong> aquaculture<br />
development in Thail<strong>and</strong> 309<br />
S. Thongrod<br />
Analysis <strong>of</strong> <strong>feeds</strong> <strong>and</strong> <strong>fertilizers</strong> <strong>for</strong> <strong>sustainable</strong> aquaculture<br />
development in Viet Nam 331<br />
Le Thanh Hung <strong>and</strong> Huynh Pham Viet Huy<br />
vii
viii<br />
Case study on the use <strong>of</strong> farm-made <strong>feeds</strong> <strong>and</strong> commercially <strong>for</strong>mulated<br />
pellets <strong>for</strong> pangasiid catfish culture in the Mekong Delta, Viet Nam 363<br />
Le Thanh Hung, Luu Thi Thanh Truc <strong>and</strong> Huynh Pham Viet Huy<br />
COUNTRY REVIEWS: AFRICA 379<br />
Analysis <strong>of</strong> <strong>feeds</strong> <strong>and</strong> <strong>fertilizers</strong> <strong>for</strong> <strong>sustainable</strong> aquaculture<br />
development in Cameroon 381<br />
Victor Pouomogne<br />
Analysis <strong>of</strong> <strong>feeds</strong> <strong>and</strong> <strong>fertilizers</strong> <strong>for</strong> <strong>sustainable</strong> aquaculture<br />
development in Egypt 401<br />
Abdel-Fattah M. El-Sayed<br />
Analysis <strong>of</strong> <strong>feeds</strong> <strong>and</strong> <strong>fertilizers</strong> <strong>for</strong> <strong>sustainable</strong> aquaculture<br />
development in Kenya 423<br />
Beatrice Ny<strong>and</strong>at<br />
Analysis <strong>of</strong> <strong>feeds</strong> <strong>and</strong> <strong>fertilizers</strong> <strong>for</strong> <strong>sustainable</strong> aquaculture<br />
development in Malawi 437<br />
S.K. Chimatiro <strong>and</strong> B.B. Chirwa<br />
Analysis <strong>of</strong> <strong>feeds</strong> <strong>and</strong> <strong>fertilizers</strong> <strong>for</strong> <strong>sustainable</strong> aquaculture<br />
development in Nigeria 453<br />
Olajide A. Ayinla<br />
Analysis <strong>of</strong> <strong>feeds</strong> <strong>and</strong> <strong>fertilizers</strong> <strong>for</strong> <strong>sustainable</strong> aquaculture<br />
development in Ug<strong>and</strong>a 471<br />
J. Rutaisire<br />
WORKSHOP REPORT 489
Contributors<br />
S. Ahamad Ali, Central Institute <strong>of</strong> Brackishwater Aquaculture, 75, Santhome High<br />
Road, RA Puarm, Chennai 600 028, India. E-mail: Ali_madras@yahoo.com<br />
Olajide A. Ayinla, Nigerian Institute <strong>for</strong> Oceanography <strong>and</strong> Marine Research, Victoria<br />
Isl<strong>and</strong>, P.M.B 12729, Lagos, Nigeria. E- mail: jideayinla@yahoo.com<br />
S. Ayyappan, Indian Council <strong>of</strong> Agricultural Research, Krishi Anusndhan Bhavan, Pusa,<br />
New Delhi 110 012, India. E-mail: ayyapans@yahoo.co.uk<br />
Benoy K. Barman, WorldFish Center, Bangladesh <strong>and</strong> South Asia Office, House 22B,<br />
Road 7, Block F, Banani, Dhaka 1213, Bangladesh. E-mail: b.barman@cgiar.org<br />
S.K. Chimatiro, Department <strong>of</strong> Fisheries, PO Box 593, Lilongwe, Malawi.<br />
E-mail: SloansC@Nepad.org<br />
B.B. Chirwa, Department <strong>of</strong> Fisheries, PO Box 593, Lilongwe, Malawi.<br />
E-mail: SloansC@Nepad.org<br />
Sena S. De Silva, Network <strong>of</strong> Aquaculture Centres in Asia-Pacific, Bangkok, PO Box<br />
1040, Kasetsart Post Office, Bangkok, 10903, Thail<strong>and</strong>. E-mail: sena.desilva@enaca.org<br />
Abdel-Fattah M. El-Sayed, Oceanography Department, Faculty <strong>of</strong> Science, Alex<strong>and</strong>ria<br />
University, Alex<strong>and</strong>ria, Egypt. E-mail: a_elsayed50@yahoo.com<br />
A. Flores-Nava, Universidad Marista de Mérida, AP 151-CORDEMEX, Mérida,<br />
Yucatán, 97300, México. E-mail: aflores@marista.edu.mx<br />
Mohammad R. Hasan, Aquaculture Management <strong>and</strong> Conservation Service, FAO<br />
Fisheries <strong>and</strong> Aquaculture Department, Viale delle Terme di Caracalla, 00153 Rome,<br />
Italy. E-mail: Mohammad.Hasan@fao.org<br />
Thomas Hecht, Department <strong>of</strong> Ichthyology <strong>and</strong> Fisheries Science, Rhodes University,<br />
Grahamstown 6140, South Africa. E-mail: t.hecht@ru.ac.za<br />
Le Thanh Hung, Faculty <strong>of</strong> Fisheries, Nong Lam University, Ho Chi Minh City,<br />
Viet Nam. E-mail: lthungts@yahoo.com.vn<br />
Huynh Pham Viet Huy, Faculty <strong>of</strong> Fisheries, Nong Lam University, Ho Chi Minh City,<br />
Viet Nam. E-mail: hpviethuy@yahoo.com<br />
Manjurul Karim, WorldFish Center, Bangladesh <strong>and</strong> South Asia Office, House 22B,<br />
Road 7, Block F, Banani, Dhaka 1213, Bangladesh. E-mail: mkarim@mail.com<br />
L. Mengqing, Yellow Sea Fisheries Research Institute, PO Box 266071, 106 Nanjing<br />
Road, Qingdao, China. E-mail: liangmq@ysfri.ac.cn<br />
Abidin Nur, Centre <strong>for</strong> Brackishwater Aquaculture Development, Jepara, Central Java,<br />
Indonesia. E-mail: abidinnur@hotmail.com<br />
Beatrice Ny<strong>and</strong>at, Department <strong>of</strong> Fisheries, PO Box 58187, 00100 Nairobi, Kenya.<br />
E-mail: tieny30@yahoo.com<br />
Victor Pouomogne, Institute <strong>of</strong> Agricultural Research <strong>for</strong> Development (IRAD),<br />
Fishculture <strong>and</strong> Inl<strong>and</strong> Fisheries Research Station, PO Box 255 Foumban, Cameroon.<br />
E-mail: pouomognev@yahoo.fr<br />
J. Rutaisire, Department <strong>of</strong> Wildlife <strong>and</strong> Animal Resources, Makerere University,<br />
Kampala, Ug<strong>and</strong>a. E-mail: jusruta@yahoo.com<br />
Neila S. Sumagaysay-Chavoso, University <strong>of</strong> the Philippines Aquaculture Society, Inc.,<br />
College <strong>of</strong> Fisheries <strong>and</strong> Ocean Sciences, Miag-ao, Iloilo, Philippines.<br />
E-mail: neila_sc@yahoo.com.sg<br />
A. Victor Suresh, Aqua Feeds: Formulation <strong>and</strong> Beyond, A3 Sanskriti Apartments, 17 &<br />
18 Velachery Bypass Road, Velachery, Chennai 600 042, India.<br />
E-mail: victor@feedware.com<br />
Albert G.J. Tacon, Aquatic Farms Ltd., 49-139 Kamehameha Hwy., Kaneohe, Hawaii<br />
96744, United States <strong>of</strong> America. E-mail: AGJTACON@aol.com<br />
ix
x<br />
S. Thongrod, Coastal Aquatic Feed Research Institute, 41/14 Moo 9, Bangphra Subdistrict,<br />
Sriracha District, Chonburi Province 20110, Thail<strong>and</strong>.<br />
E-mail: supisthongrod@yahoo.com<br />
Luu Thi Thanh Truc, Faculty <strong>of</strong> Fisheries, Nong Lam University, Ho Chi Minh City,<br />
Viet Nam. E-mail: luutruc235@yahoo.com<br />
M. Weimin, Freshwater Fisheries Research Centre, 9 East Shanshui Road, Binhu District,<br />
Wuxi 214081, China. E-mail: miaowm@ffrc.cn
Foreword<br />
Aquaculture has shown significant growth over the last three decades <strong>and</strong> it is anticipated<br />
that global aquaculture production will continue to increase. Total global fish production<br />
in 2005 was 157.53 million tonnes, <strong>of</strong> which aquaculture contributed about 40.0 percent<br />
(FAO, 2007) 1 . The average annual growth rate (APR) <strong>of</strong> the aquaculture sector during<br />
the period 1990 <strong>and</strong> 2004 was 9.4 percent per year. Aquaculture has been the fastest<br />
growing food production sector in many countries <strong>of</strong> the world <strong>for</strong> the last two decades,<br />
while capture fisheries have experienced a declining trend. Aquaculture has there<strong>for</strong>e,<br />
contributed significantly to food security <strong>and</strong> poverty alleviation in different parts <strong>of</strong> the<br />
world in parallel with the development <strong>of</strong> pr<strong>of</strong>it-oriented entrepreneurship.<br />
In intensive aquaculture feed accounts <strong>for</strong> 60-80 percent <strong>of</strong> operational cost, while<br />
in semi-intensive aquaculture systems feed <strong>and</strong> <strong>fertilizers</strong> account <strong>for</strong> about 40-60<br />
percent <strong>of</strong> production costs. Feeds <strong>and</strong> <strong>fertilizers</strong> will continue to dominate aquaculture<br />
needs. The importance <strong>of</strong> feed in aquaculture is further emphasized by the fact that<br />
about 28.2 million tonnes (44.8 percent) <strong>of</strong> total global aquaculture production in 2005<br />
was dependent on single dietary ingredients, farm-made aqua<strong>feeds</strong> <strong>and</strong> industrially<br />
manufactured aqua<strong>feeds</strong> (FAO, 2007). In 2006, approximately 25.4 million tonnes <strong>of</strong><br />
compound aquafeed was produced (Gill, 2007) 2 <strong>and</strong> used mainly <strong>for</strong> the production <strong>of</strong><br />
non-filter feeding carps, marine shrimp, salmon, marine finfish, tilapia, trout, catfish,<br />
freshwater crustaceans, milkfish <strong>and</strong> eels (Tacon, Hasan <strong>and</strong> Subasinghe, 2006) 3 .<br />
It is estimated that in 2006 the aquaculture sector consumed about 3.06 million tonnes<br />
(56.0 percent) <strong>of</strong> world fishmeal production <strong>and</strong> 0.78 million tonnes (87.0 percent) <strong>of</strong><br />
total fish oil production (Tacon, 2007) 4 , while aquaculture’s share <strong>of</strong> global industrial feed<br />
output was only four percent (Gill, 2007). In addition to fishmeal <strong>and</strong> fish oil, low value<br />
fish or ‘trash fish’ is used in many parts <strong>of</strong> the world as a complete or supplementary feed<br />
<strong>for</strong> farmed fish, crustaceans <strong>and</strong> a few mollusc species. It is estimated that approximately<br />
5 to 6 million tonnes <strong>of</strong> low value/trash fish is used as direct feed in aquaculture (Tacon<br />
Hasan <strong>and</strong> Subasinghe, 2006).<br />
Considering the dependency <strong>of</strong> carnivorous finfish <strong>and</strong> shrimp aquaculture on finite<br />
marine resources, it is unlikely that this sector will show major expansion in the near<br />
future, unless significant breakthroughs are made on the efficient use <strong>of</strong> alternatives<br />
to fishmeal <strong>and</strong> fish oil. It is anticipated that the production <strong>of</strong> freshwater finfish <strong>and</strong><br />
crustacean low on the food chain will be the major contributors to global aquaculture<br />
production in future. Much <strong>of</strong> the expansion is likely to take place in semi-intensive<br />
farming systems <strong>and</strong> feed <strong>and</strong> fertilizer availability <strong>and</strong> accessibility will be the major<br />
limiting factors to achieving regional <strong>and</strong> global production targets.<br />
To address these issues the Aquaculture Management <strong>and</strong> Conservation Service<br />
(FIMA) <strong>of</strong> the FAO Fisheries <strong>and</strong> Aquaculture Department initiated a work programme<br />
1 FAO. 2007. FAO Fisheries Department, Fishery In<strong>for</strong>mation, Data <strong>and</strong> Statistics Unit. Fishstat Plus:<br />
Universal s<strong>of</strong>tware <strong>for</strong> fishery statistical time series. Aquaculture production: quantities 1950–2005;<br />
Aquaculture production: values 1984–2005; Capture production: 1950–2005; Commodities production<br />
<strong>and</strong> trade: 1950–2005; Total production: 1970–2005, Vers. 2.30 (available at www.fao.org/fi/statist/<br />
FISOFT/FISHPLUS.asp<br />
2 Gill, C., 2007. World feed panorama: bigger cities, more feed. Feed International, 28 (1): 5-9.<br />
3 Tacon, A.G.J., Hasan, M.R. <strong>and</strong> Subasinghe, R.P., 2006. Use <strong>of</strong> fishery resources as feed inputs <strong>for</strong><br />
aquaculture development: trends <strong>and</strong> policy implications. FAO Fisheries Circular. No. 1018. Rome, FAO.<br />
99 pp.<br />
4 Tacon, A.G.J., 2007. Meeting the Feed Supply Challenges. Paper presented FAO Globefish Global Trade<br />
Conference on Aquaculture, Qingdao, China, 29–31 May 2007.<br />
xi
xii<br />
entitled “<strong>Study</strong> <strong>and</strong> <strong>analysis</strong> <strong>of</strong> <strong>feeds</strong> <strong>and</strong> nutrients (including <strong>fertilizers</strong>) <strong>for</strong> <strong>sustainable</strong><br />
aquaculture development”. After reviewing the existing status <strong>of</strong> aquaculture in relation<br />
to <strong>feeds</strong> <strong>and</strong> <strong>fertilizers</strong> <strong>and</strong> based on the recommendations made by COFI Sub-committee<br />
on Aquaculture (Beijing, Peoples’ Republic <strong>of</strong> China <strong>and</strong> Trondheim, Norway 5 ), the<br />
following key issues were prioritized <strong>and</strong> undertaken: a) an <strong>analysis</strong> <strong>of</strong> the status <strong>and</strong><br />
trends in aquaculture production (with particular reference to fish <strong>and</strong> crustacean species<br />
that are dependent on <strong>feeds</strong>) <strong>and</strong> b) analyses <strong>of</strong> issues, trends <strong>and</strong> challenges in feed <strong>and</strong><br />
fertilizer resource use <strong>for</strong> <strong>sustainable</strong> aquaculture development in developing countries<br />
in Asia, Africa <strong>and</strong> Latin America. The work programme is executed by FIMA in close<br />
collaboration with the FAO regional <strong>and</strong> sub-regional <strong>of</strong>fices <strong>and</strong> in consultation with<br />
Regional Organization (e.g. NACA), government Department <strong>of</strong> Fisheries, Universities<br />
<strong>and</strong> National Research Institutions <strong>of</strong> FAO member countries.<br />
To broaden the horizon <strong>of</strong> the consultative process <strong>and</strong> to review <strong>and</strong> analyze<br />
critical issues related to the use <strong>of</strong> <strong>feeds</strong> <strong>and</strong> <strong>fertilizers</strong> <strong>for</strong> <strong>sustainable</strong> aquaculture<br />
development, a targeted workshop on “Use <strong>of</strong> <strong>feeds</strong> <strong>and</strong> <strong>fertilizers</strong> <strong>for</strong> <strong>sustainable</strong><br />
aquaculture development” was organized in Wuxi, Jiangsu Province, China on 18-21<br />
March 2006 in collaboration with the Freshwater Fisheries Research Centre (FFRC)<br />
<strong>of</strong> China <strong>and</strong> the Network <strong>of</strong> Aquaculture Centres in Asia-Pacific (NACA). The<br />
workshop combined technical presentations <strong>and</strong> working group discussions. A number<br />
<strong>of</strong> country reviews from Asia <strong>and</strong> Africa, case studies, three regional syntheses (Asia,<br />
Africa <strong>and</strong> Latin America) <strong>and</strong> a global synthesis were commissioned prior to the<br />
workshop <strong>and</strong> selected reviews, case studies, syntheses were presented at the workshop.<br />
The workshop brought together 21 experts in the field <strong>of</strong> aquaculture nutrition <strong>and</strong><br />
aqua<strong>feeds</strong>, including the authors <strong>of</strong> the country reviews, case studies, regional <strong>and</strong> global<br />
syntheses <strong>and</strong> experts from FAO, FFRC <strong>and</strong> NACA. The workshop identified several<br />
key issues <strong>and</strong> constraints in relation to the use <strong>of</strong> <strong>feeds</strong> <strong>and</strong> <strong>fertilizers</strong> <strong>for</strong> <strong>sustainable</strong><br />
aquaculture development <strong>and</strong> recommended appropriate actions to address these issues<br />
<strong>and</strong> constraints.<br />
This technical paper presents the report <strong>of</strong> the workshop, a summary <strong>of</strong> the working<br />
group discussions <strong>and</strong> the recommendations made by the workshop, the country<br />
reviews, case study reports as well as the regional <strong>and</strong> global syntheses. It is anticipated<br />
that the identified key issues <strong>and</strong> recommendations will assist policy makers on a<br />
regional <strong>and</strong> global level to promote improved aquaculture practices <strong>and</strong> farming<br />
systems through optimal use <strong>of</strong> feed <strong>and</strong> fertilizer resources <strong>and</strong> that this will help FAO<br />
member countries to implement the provisions <strong>of</strong> the Code <strong>of</strong> Conduct <strong>for</strong> Responsible<br />
Fisheries.<br />
Jiansan Jia<br />
Chief<br />
Aquaculture Management <strong>and</strong> Conservation Service<br />
FAO Fisheries <strong>and</strong> Aquaculture Department<br />
5 FAO, 2003. Report <strong>of</strong> the Second Session <strong>of</strong> the Sub-Committee on Aquaculture. Trondheim, Norway,<br />
7–11 August 2003. FAO Fisheries Report. No. 716. Rome, FAO. 91 pp.
Executive summary<br />
For the last two decades aquaculture has been the fastest growing food production<br />
sector in many countries <strong>of</strong> the world <strong>and</strong> has contributed significantly to food security<br />
<strong>and</strong> poverty alleviation in different parts <strong>of</strong> the world in parallel with the development<br />
<strong>of</strong> pr<strong>of</strong>it-oriented entrepreneurship. The global average annual growth rate <strong>of</strong> the sector<br />
during the period 1990 <strong>and</strong> 2004 was 9.4 percent per year, while capture fisheries have<br />
experienced a declining trend.<br />
Aquaculture in Asia, Latin America <strong>and</strong> Africa is growing rapidly <strong>and</strong> this presents<br />
significant growth opportunities <strong>for</strong> the aquafeed sector. Except <strong>for</strong> salmon in Chile,<br />
warm- freshwater, omnivorous fish contribute the bulk <strong>of</strong> aquaculture production in<br />
these regions. There are notable differences among the three continents in terms <strong>of</strong><br />
production <strong>and</strong> the use <strong>of</strong> aqua<strong>feeds</strong> <strong>and</strong> each region has its own set <strong>of</strong> priorities <strong>for</strong><br />
developing the aquafeed sector. In Asia, farm-made aqua<strong>feeds</strong> play a dominant role in<br />
fish production, although intensification <strong>of</strong> farming practices is driving the growth <strong>of</strong><br />
the industrial aquafeed sector. In Latin America, industrial aqua<strong>feeds</strong> are widely used<br />
in most production systems. In sub-Saharan Africa, where aquaculture production is<br />
small, but actively growing, on-farm feed manufacturing by small- <strong>and</strong> medium-scale<br />
entrepreneurs is beginning to play an important role in aquaculture development.<br />
Underst<strong>and</strong>ing these differences <strong>and</strong> setting <strong>of</strong> priorities are critical to the future<br />
development <strong>of</strong> the aquafeed sector, particularly in the tropics.<br />
Asia accounted <strong>for</strong> 92.1 percent <strong>of</strong> global aquaculture production in 2005 (57.97 million<br />
tonnes), to which China contributed 74.6 percent. Nine other countries contributed<br />
22.7 percent. Aquaculture in Asia is primarily rural <strong>and</strong> pond-based semi-intensive<br />
farming <strong>of</strong> species low on the food chain, with the exception <strong>of</strong> shrimp <strong>and</strong> some<br />
freshwater <strong>and</strong> marine carnivorous species. Farm-made <strong>feeds</strong> are used throughout the<br />
region primarily <strong>for</strong> semi-intensive farming while nutritionally-complete, industrially<br />
manufactured <strong>feeds</strong> are used <strong>for</strong> intensive farming <strong>of</strong> high-value species.<br />
In the seven major Asian aquaculture producing countries (China, India, Indonesia,<br />
the Philippines, Viet Nam, Thail<strong>and</strong> <strong>and</strong> Bangladesh) an estimated 19.33 million tonnes<br />
<strong>of</strong> farm-made feed <strong>and</strong> 10.30 million tonnes <strong>of</strong> industrial aqua<strong>feeds</strong> were used in<br />
2003-04. It is predicted that feed usage over the next five years will increase to<br />
30.73 million tonnes <strong>and</strong> 22.24 million tonnes <strong>for</strong> farm-made <strong>and</strong> industrial aqua<strong>feeds</strong>,<br />
respectively, representing a growth <strong>of</strong> 60 <strong>and</strong> 107 percent from current levels. The<br />
current <strong>and</strong> continuing importance <strong>of</strong> farm-made <strong>feeds</strong> in Asian aquaculture calls <strong>for</strong><br />
increased efficiency in the production <strong>and</strong> use <strong>of</strong> farm-made <strong>feeds</strong>.<br />
Increased production <strong>of</strong> high-value aquatic species <strong>and</strong> intensification <strong>of</strong> existing<br />
culture practices <strong>of</strong> freshwater finfish, has contributed significantly to the increased<br />
production <strong>and</strong> utilization <strong>of</strong> industrial aquafeed in the region. To sustain the predicted<br />
increase in the use <strong>of</strong> aqua<strong>feeds</strong> requires a concerted regional research <strong>and</strong> development<br />
initiative, improvements in production technology <strong>and</strong> feeding practices. In particular<br />
these initiatives should focus on the use <strong>of</strong> fishmeal <strong>and</strong> soybean meal. It is pertinent to<br />
note that the dem<strong>and</strong> <strong>and</strong> use <strong>of</strong> fishmeal in some <strong>of</strong> the emerging aquaculture countries<br />
in Asia is increasing rapidly. For example, Viet Nam already uses approximately<br />
62 500 tonnes <strong>of</strong> fishmeal per year, solely <strong>for</strong> aquaculture. Further, in 2004 China alone<br />
imported an estimated 20.2 million tonnes <strong>of</strong> soybean, accounting <strong>for</strong> over one third<br />
<strong>of</strong> world soybean imports. Intensification <strong>of</strong> aquaculture in Asia is likely to further<br />
increase fishmeal usage with China being a decisive factor with respect to supply <strong>and</strong><br />
dem<strong>and</strong>. The search <strong>for</strong> suitable <strong>and</strong> cost-effective alternative protein sources <strong>for</strong> use<br />
xiii
xiv<br />
in industrial aqua<strong>feeds</strong> will be the most critical factor in the development <strong>of</strong> intensive<br />
aquaculture in Asia.<br />
Aquaculture in Latin America is dominated by Chile <strong>and</strong> Brazil (50.9 percent <strong>and</strong><br />
18.4 percent <strong>of</strong> Latin American production in 2005). The balance (30.7 percent) was<br />
produced by 30 other countries. On the species-group level, salmonids (primarily<br />
Altantic salmon, Salmo salar), shrimp (Pacific white shrimp, Litopenaeus vannamei), <strong>and</strong><br />
tilapia accounted <strong>for</strong> about 77 percent <strong>of</strong> regional aquaculture production. Freshwater<br />
aquaculture species includes tilapia (Oreochromis spp.), catfish, carps (common <strong>and</strong><br />
Chinese carps), rainbow trout <strong>and</strong> a number <strong>of</strong> native species, such as tambaqui<br />
(Colossoma macropomum), <strong>and</strong> pacú (Piaractus mesopotanicus). Of these species,<br />
tilapia shows the highest growth rate in production with an annual average increase <strong>of</strong><br />
15.7 percent between 1999 <strong>and</strong> 2002 followed by other species such as tambaquí, <strong>and</strong><br />
Pacú. The industry in the region is generally well developed, with production almost<br />
exclusively realized through semi-intensive <strong>and</strong> intensive farming systems.<br />
Industrially manufactured <strong>feeds</strong> are readily available in most countries. Large feed<br />
manufacturers in Chile, Brazil, Mexico, Costa Rica <strong>and</strong> Colombia produce salmon,<br />
shrimp, tilapia <strong>and</strong> trout <strong>feeds</strong>. Farm-made <strong>feeds</strong> are rarely used in the region except<br />
in localized areas in selected countries where a small number <strong>of</strong> small-scale farmers<br />
occasionally utilize some agricultural by-products to replace or complement <strong>for</strong>mulated<br />
complete diets. Opportunities to integrate aquaculture into the traditional agricultural<br />
systems by small-scale farmers is constrained by the high cost <strong>of</strong> <strong>for</strong>mulated <strong>feeds</strong>, <strong>and</strong><br />
the lack <strong>of</strong> knowledge on the use <strong>of</strong> locally available ingredients to produce low cost,<br />
farm-made aqua<strong>feeds</strong>.<br />
The aquafeed industry in Latin America is largely dependent on conventional sources<br />
<strong>of</strong> protein <strong>and</strong> fishmeal <strong>and</strong> fish oil continue to be the core dietary protein <strong>and</strong> lipid<br />
sources, respectively. Other major protein sources include a number <strong>of</strong> ingredients such<br />
as soybean meal, maize gluten meal <strong>and</strong> rendered animal byproducts. A wide range<br />
<strong>of</strong> other agri-industrial by-products <strong>and</strong> other potential nutrient sources are readily<br />
available in countries like Brazil, Ecuador <strong>and</strong> Mexico, but their use in aqua<strong>feeds</strong> is<br />
constrained by limited research.<br />
Total production in Africa in 2005 was estimated to be 656 370 tonnes, to which Egypt<br />
alone contributed about 82.2 percent. Sub-Saharan Africa accounted <strong>for</strong> 16.8 percent <strong>of</strong><br />
the total African production. Aquaculture in sub-Saharan Africa (SSA) is dominated by<br />
Nigeria contributing about 51.5 percent, while the other nine top producers contributed<br />
about 41.0 percent <strong>of</strong> SSA production. Between 1999 <strong>and</strong> 2005, overall production in SSA<br />
increased by 99 percent from 54 997 tonnes to 109 446 tonnes. However, aquaculture<br />
in SSA is widely dichotomous: more than 70 percent <strong>of</strong> the regional total production<br />
is produced on commercial farms by less than 20 percent <strong>of</strong> farmers, while less than<br />
30 percent is produced by small-scale subsistence farmers that comprise over 80 percent<br />
<strong>of</strong> all farmers. The systems used by the commercial sector range from semi-intensive to<br />
intensive pond, cage <strong>and</strong> tank culture <strong>of</strong> catfish (Clarias spp.) <strong>and</strong> tilapia (Oreochromis<br />
spp.) <strong>and</strong> high-value products such as shrimp (Madagascar <strong>and</strong> Mozambique) <strong>and</strong><br />
abalone (South Africa) while non-commercial subsistence aquaculture primarily consists<br />
<strong>of</strong> small-scale pond culture <strong>of</strong> tilapia, catfish <strong>and</strong> common carp (Cyprinus carpio).<br />
Large-scale commercial aquaculture is primarily dependent on industrially<br />
manufactured <strong>feeds</strong>. The <strong>feeds</strong> are either produced within country or imported. In most<br />
SSA countries, conventional aquafeed <strong>for</strong>mulations rely heavily on imported fishmeal<br />
to provide much <strong>of</strong> the dietary protein. The price <strong>of</strong> fishmeal coupled with high import<br />
tariffs <strong>and</strong> taxes in most countries will affect the development <strong>of</strong> the aquafeed industry<br />
in <strong>and</strong> the development <strong>of</strong> the sector in the region as a whole. The situation there<strong>for</strong>e<br />
warrants careful evaluation <strong>of</strong> alternative, locally available protein sources <strong>of</strong> animal<br />
origin, as well as greater <strong>and</strong> improved use <strong>of</strong> agricultural by-products in aquafeed<br />
<strong>for</strong>mulations.
Farm-made <strong>feeds</strong> are manufactured by individual farmers as well as small <strong>and</strong><br />
medium-scale entrepreneurs. In some countries this is a rapidly emerging manufacturing<br />
sector <strong>and</strong> the technologies employed by these entrepreneurs are simple <strong>and</strong> the feed<br />
is generally af<strong>for</strong>dable but has a limited shelf life. Country reviews <strong>of</strong> seven selected<br />
countries (Cameroon, Ghana, Kenya, Malawi, Nigeria, Ug<strong>and</strong>a <strong>and</strong> Zambia) <strong>of</strong> SSA<br />
revealed that approximately 12 000 tonnes <strong>of</strong> industrial <strong>feeds</strong> were produced in 2005<br />
contributing to a maximum <strong>of</strong> 15.6 percent <strong>of</strong> total fish production, while the production<br />
<strong>of</strong> farm-made aqua<strong>feeds</strong> produced by medium- <strong>and</strong> small-scale entrepreneurs as well as<br />
by farmers during the same period was 98 500 tonnes. The growth <strong>of</strong> the small-scale<br />
sector in the region is constrained principally by an inadequate knowledge base on<br />
the use <strong>of</strong> farm-made <strong>feeds</strong>. In addition, small-scale farmers are constrained by the<br />
availability <strong>of</strong> animal manure because <strong>of</strong> the free range nature <strong>of</strong> animal husb<strong>and</strong>ry, <strong>and</strong><br />
the cost <strong>of</strong> inorganic <strong>fertilizers</strong>. There is not much that can be done about the latter <strong>and</strong><br />
hence there is a need to focus on farm-made <strong>feeds</strong>.<br />
Already there is a substantial body <strong>of</strong> regional knowledge <strong>of</strong> the allowable inclusion<br />
levels <strong>for</strong> many locally available <strong>and</strong> on-farm feed ingredients but little has been done<br />
to evaluate these data with respect to farm economics <strong>and</strong> to translate the findings into<br />
practice. Further, in<strong>for</strong>mation on appropriate feed mixes <strong>and</strong> preparation techniques<br />
<strong>for</strong> farm-made aquafeed, subregional databanks on seasonal availability <strong>of</strong> agricultural<br />
commodities <strong>and</strong> a suitable mechanism to disseminate this in<strong>for</strong>mation are lacking.<br />
These needs must be addressed if the region is to realize its potential <strong>and</strong> production<br />
capacity. A greater degree <strong>of</strong> regional cooperation between Asia <strong>and</strong> Africa has been<br />
identified as one <strong>of</strong> the mechanisms to address these needs.<br />
There are several pivotal issues related to feed <strong>and</strong> <strong>fertilizers</strong> that the aquaculture<br />
industry in Asia, sub-Saharan Africa <strong>and</strong> Latin America will have to address in the next<br />
few years. These are:<br />
• reduced accessibility resulting from increasing costs <strong>of</strong> fishmeal <strong>and</strong> other<br />
conventional protein sources;<br />
• tougher environmental protection measures, <strong>and</strong> stringent food safety requirements<br />
<strong>and</strong> quality st<strong>and</strong>ard imposed by local governments, regional <strong>and</strong> international<br />
agreements, consumer groups <strong>and</strong> importers;<br />
• mono- <strong>and</strong> oligopoly <strong>of</strong> feed industries resulting in regionalization <strong>of</strong> markets,<br />
reduction <strong>of</strong> local competition <strong>and</strong> consequently restricting types, <strong>and</strong> quality <strong>of</strong><br />
products, particularly in Latin American countries;<br />
• assurance <strong>of</strong> national quality st<strong>and</strong>ards <strong>for</strong> raw materials, feed additives <strong>and</strong> <strong>feeds</strong>;<br />
• safe <strong>and</strong> appropriate use <strong>of</strong> aqua<strong>feeds</strong> produced by small-scale manufacturers <strong>and</strong><br />
support to improve their production technology; <strong>and</strong><br />
• development <strong>of</strong> on-farm feeding strategies <strong>and</strong> practices <strong>for</strong> improved utilization <strong>of</strong><br />
agricultural <strong>and</strong> terrestrial by-products <strong>and</strong> capacity building <strong>of</strong> small-scale farmers<br />
to make more effective farm-made <strong>feeds</strong>.<br />
These issues will have a pr<strong>of</strong>ound impact on the future development <strong>of</strong> the aquaculture<br />
sector on the three continents <strong>and</strong> must be addressed if <strong>sustainable</strong> development is to<br />
be ensured.<br />
xv
xvi<br />
Abbreviations <strong>and</strong> acronyms<br />
AARM Aquaculture <strong>and</strong> Aquatic Resources Programme, AIT, Thail<strong>and</strong><br />
ADB Asian Development Bank<br />
ADiM Aquaculture Development in Malawi<br />
AFMA Animal Feed Manufacturing Association <strong>of</strong> South Africa<br />
AFSD-BAI Animal Feed St<strong>and</strong>ard Division-Bureau <strong>of</strong> Animal Industry<br />
(Philippines)<br />
AIFP Aquaculture <strong>and</strong> Inl<strong>and</strong> Fisheries Project (Nigeria)<br />
AIT Asian Institute <strong>of</strong> Technology<br />
APR Average Percent growth Rate<br />
ASA American Soybean Association<br />
ASEAN Association <strong>of</strong> Southeast Asian Nations<br />
BAI Bureau <strong>of</strong> Animal Industry (Philippines)<br />
BAS Bureau <strong>of</strong> Agricultural Research (Philippines)<br />
BBS Bangladesh Bureau <strong>of</strong> Statistics<br />
BCA Bangladesh Census <strong>for</strong> Agriculture<br />
BDT Bangladesh Taka (currency)<br />
BFAR Bureau <strong>of</strong> Fisheries <strong>and</strong> Aquatic Resources (Philippines)<br />
BFDC Bangladesh Fisheries Development Corporation<br />
BFRI Bangladesh Fisheries Research Institute<br />
BFS Balance Fertilization Strategy<br />
BRAC Bangladesh Rural Advancement Committee<br />
BSE Bovine Spongi<strong>for</strong>m Encephalopathy<br />
CAPMS Central Agency <strong>for</strong> Public Mobilisation <strong>and</strong> Statistics, Egypt<br />
CAR Cordillera Administrative Region (Philippines)<br />
CBAD Centre <strong>for</strong> Brackishwater Aquaculture Development (Indonesia)<br />
CEPID Centre d’Excellence pour la Production, l’Innovation et le<br />
Développement<br />
CEPT Common Effective Preferential Tariff<br />
CLFMA Compound Livestock Feed Manufacturers Association, India<br />
CoC Code <strong>of</strong> Conduct<br />
CP Charoen Pokph<strong>and</strong> Foods Co. Ltd., Thail<strong>and</strong><br />
DA Department <strong>of</strong> Agriculture (Philippines)<br />
DAE Department <strong>of</strong> Agricultural Extension, Ministry <strong>of</strong> Agriculture,<br />
Bangladesh<br />
DAP Di-Ammonium Phosphate<br />
DFID Department <strong>for</strong> International Development (UK)<br />
DoF Department <strong>of</strong> Fisheries<br />
DOST Department <strong>of</strong> Science <strong>and</strong> Technology (Philippines)<br />
DTI Department <strong>of</strong> Trade <strong>and</strong> Industry (Philippines)<br />
EEZ Exclusive Economic Zone<br />
FADINAP Fertilizer Advisory, Development <strong>and</strong> In<strong>for</strong>mation Network <strong>for</strong> Asia<br />
<strong>and</strong> the Pacific<br />
FCR Feed Conversion Ratio<br />
FEWS Famine Early Warning System<br />
FIAP Fertilizer Industry Association <strong>of</strong> the Philippines<br />
FISH Fisheries Investment <strong>for</strong> Sustainable Harvest
FMB-DENR Forest Management Bureau-Department <strong>of</strong> Environment <strong>and</strong> Natural<br />
Resources (Philippines)<br />
FPA Fertilizer <strong>and</strong> Pesticide Authority (Philippines)<br />
FSR Fisheries Sector Review, Bangladesh<br />
GAFRD General Authority <strong>for</strong> Fisheries Resources Development, Egypt<br />
GAMP General Authority <strong>of</strong> Milling <strong>and</strong> Polishing, Egypt<br />
GAP Good Aquaculture Practice<br />
GDP Gross Domestic Product<br />
GIFT Genetically Improved Farmed Tilapia<br />
GI-Macro Genetic Improvement <strong>of</strong> Macrobrachium<br />
GNAEP Greater Noakhali Aquaculture Extension Project, Bangladesh<br />
ha hectare<br />
HACCP Hazard Analysis Critical Control Point<br />
HPAI Highly Pathogenic Avian Influenza<br />
HUFA Highly Unsaturated Fatty Acid<br />
IDRC International Development Research Centre, Canada<br />
IFFN Innovative Fish Farmers Network, Malawi<br />
IITA International Institute <strong>of</strong> Tropical Agriculture<br />
INCHEM International Chemical Corporation<br />
IRAD Institue <strong>of</strong> Agricultural Research <strong>for</strong> Development, Cameroon<br />
JICA Jambi Initiative <strong>for</strong> Commercial Aquaculture<br />
JICA Japan International Cooperation Agency<br />
LASADA Lagos State Agricultural Development Agency (Nigeria)<br />
LE Egyptian Pound, LE (Egypt Pound, EGP)<br />
LGU Local Government Unit<br />
LLDA Laguna Lake Development Authority (Philippines)<br />
MAAIF Ministry <strong>of</strong> Agriculture, Animal Industries <strong>and</strong> Fisheries, Ug<strong>and</strong>a<br />
MBD Microbound Diet<br />
MBS Malawi Bureau <strong>of</strong> St<strong>and</strong>ards<br />
MFN Most Favoured Nations<br />
MINEPIA Ministère de l’Elevage, des Pêches et des Industries Animales,<br />
Cameroon<br />
MOFL Ministry <strong>of</strong> Fisheries <strong>and</strong> Livestock, Bangladesh<br />
MPEDA Marine Products Export Development Authority, India<br />
NAC National Aquaculture Centre <strong>of</strong> the Department <strong>of</strong> Fisheries, Malawi<br />
NAMRIA National Mapping <strong>and</strong> Resource In<strong>for</strong>mation Authority (Philippines)<br />
NARO National Agricultural Research Organization, Ug<strong>and</strong>a<br />
NASO National Aquaculture Sector Overview, FAO<br />
NCR National Capital Region<br />
NEDA National Economic Development Authority (Philippines)<br />
NFA National Food Authority (Philippines)<br />
NGO Non Governmental Organization<br />
NIFFR National Institute <strong>for</strong> Freshwater Research, Nigeria<br />
NIOMR Nigerian Institute <strong>for</strong> Oceanography <strong>and</strong> Marine Research, Nigeria<br />
NMIS National Meat Inspection Service (Philippines)<br />
NPK Nitrogen Phosphate Potassium<br />
NPKS Mixed fertilizer containing nitrogen, phosphorus, potassium <strong>and</strong><br />
sulfur<br />
NSO National Statistics Office (Philippines)<br />
NSPFS National Special Programme <strong>for</strong> Food Security (Nigeria)<br />
PABEP Potuakhali <strong>and</strong> Barguna Aquaculture Extension Project, Bangladesh<br />
PCA Philippine Coconut Authority<br />
xvii
xviii<br />
PCV Peace Corps Volunteer (USA)<br />
PL Post Larvae<br />
PMA Plan <strong>for</strong> Modernization <strong>of</strong> Agriculture<br />
PNVRA Programme National de Recherche et de Vulgarisation Agricole,<br />
Cameroon<br />
ppm parts per million<br />
ppt part per thous<strong>and</strong><br />
QUEDANCOR Quedan Rural Credit <strong>and</strong> Guarantee Corporation (Philippines)<br />
RA Republic Act<br />
Rs Indian Rupee (INR)<br />
SEAFDEC Southeast Asian Fisheries Development Center<br />
SEAPB Service d’Appui aux Populations à la Base, Cameroon<br />
SIFAB Société Industrielle de Fabrication des Aliments pour le Bétail,<br />
Cameroon<br />
SIFAC Syndicat de la Filière Avicole au Cameroun<br />
SPF Specific Pathogen Free<br />
SSA Sub-Saharan Africa<br />
SSP Single Super Phosphate<br />
TSP Triple Super Phosphate<br />
UNDP United Nations Development Programme <strong>of</strong> the United Nations<br />
USAID United States Agency <strong>for</strong> International Development<br />
USGC United States Grain Council<br />
USh Ug<strong>and</strong>a Shilling<br />
WFP World Food Programme <strong>of</strong> the United Nations<br />
WSSV White Spot Syndrome Virus
GLOBAL SYNTHESIS AND<br />
REGIONAL REVIEWS<br />
1
Global synthesis <strong>of</strong> <strong>feeds</strong><br />
<strong>and</strong> nutrients <strong>for</strong> <strong>sustainable</strong><br />
aquaculture development<br />
Albert G.J. Tacon<br />
Aquatic Farms Ltd<br />
49-139 Kamehameha Hwy., Kaneohe, Hawaii 96744<br />
United States <strong>of</strong> America<br />
Mohammad R. Hasan<br />
Aquaculture Management <strong>and</strong> Conservation Service<br />
FAO Fisheries <strong>and</strong> Aquaculture Department, Rome 00153<br />
Italy<br />
Summary 4<br />
1. Introduction 6<br />
2. Global overview <strong>of</strong> aquaculture production <strong>and</strong> farming systems 6<br />
3. Review <strong>and</strong> <strong>analysis</strong> <strong>of</strong> aquaculture <strong>feeds</strong> <strong>and</strong> feeding 8<br />
4. Problems <strong>and</strong> constraints 12<br />
5. Recommendations concerning <strong>feeds</strong> <strong>and</strong> nutrient use 14<br />
References 15<br />
Tacon, A.G.J. <strong>and</strong> Hasan, M.R. 2007. Global synthesis <strong>of</strong> <strong>feeds</strong> <strong>and</strong> nutrients <strong>for</strong><br />
<strong>sustainable</strong> aquaculture development. In M.R. Hasan, T. Hecht, S.S. De Silva <strong>and</strong> A.G.J.<br />
Tacon (eds). <strong>Study</strong> <strong>and</strong> <strong>analysis</strong> <strong>of</strong> <strong>feeds</strong> <strong>and</strong> <strong>fertilizers</strong> <strong>for</strong> <strong>sustainable</strong> aquaculture<br />
development. FAO Fisheries Technical Paper. No. 497. Rome, FAO. pp. 3–17.<br />
3
4<br />
<strong>Study</strong> <strong>and</strong> <strong>analysis</strong> <strong>of</strong> <strong>feeds</strong> <strong>and</strong> <strong>fertilizers</strong> <strong>for</strong> <strong>sustainable</strong> aquaculture development<br />
SUMMARY<br />
The aim <strong>of</strong> the study was to review status <strong>and</strong> trends concerning the use <strong>of</strong> aquaculture<br />
<strong>feeds</strong> <strong>and</strong> nutrients (including <strong>fertilizers</strong>) within selected developing countries within<br />
sub-Saharan Africa (Cameroon, Ghana, Kenya, Malawi, Nigeria, Ug<strong>and</strong>a, Zambia),<br />
Latin America (Brazil, Chile, Cuba, Ecuador, Mexico, Bolivarian Republic <strong>of</strong> Venezuela)<br />
<strong>and</strong> Asia (Bangladesh, China, India, Indonesia, the Philippines, Thail<strong>and</strong>, Viet Nam).<br />
This synthesis paper is based on a review <strong>of</strong> the results <strong>and</strong> conclusions reached by the<br />
authors <strong>of</strong> the three regional review papers <strong>for</strong> Asia (De Silva <strong>and</strong> Hasan, 2007), Latin<br />
America (Flores-Nava, 2007) <strong>and</strong> sub-Saharan Africa (Hecht, 2007). In addition, the<br />
current paper also contains some personal observations <strong>and</strong> comments <strong>of</strong> the authors<br />
concerning feed <strong>and</strong> ingredient use within the target countries <strong>and</strong> globally.<br />
The following general observations were made on the regional reviews, namely:<br />
1. the absence <strong>of</strong> precise <strong>of</strong>ficial statistical in<strong>for</strong>mation concerning the percent <strong>of</strong><br />
aquaculture production within most developing countries using industrially<br />
compounded aqua<strong>feeds</strong>, farm-made aqua<strong>feeds</strong> or whole food items (such as trash<br />
fish), either by major cultured species group or farming system;<br />
2. the total estimated compound aquafeed production within the 20 selected countries<br />
(that collectively accounted <strong>for</strong> 86.3 percent <strong>of</strong> global aquaculture production by<br />
weight in 2003) was estimated to be just over 11.5 million tonnes (Latin America<br />
select – 1.2 million tonnes, sub-Sahara select – 12 000 tonnes <strong>and</strong> Asia select – 10.30<br />
million tonnes;<br />
3. with the possible exception <strong>of</strong> China <strong>and</strong> the selected Asian countries (where total<br />
farm-made aquafeed production was estimated at 19.3 million tonnes), the absence <strong>of</strong><br />
in<strong>for</strong>mation on total current production <strong>of</strong> farm-made aqua<strong>feeds</strong> in the selected sub-<br />
Saharan <strong>and</strong> Latin American countries;<br />
4. the importance <strong>of</strong> farm-made aqua<strong>feeds</strong> within extensive <strong>and</strong> semi-intensive pond<br />
farming systems in Asia <strong>and</strong> sub-Saharan African countries, <strong>and</strong> in particular <strong>for</strong> the<br />
production <strong>of</strong> lower value freshwater fish species <strong>for</strong> home consumption;<br />
5. with the possible exception <strong>of</strong> Brazil (in the case <strong>of</strong> freshwater fish species), the bulk<br />
<strong>of</strong> aquaculture species produced in the selected Latin American countries were higher<br />
value species destined <strong>for</strong> export to developed country markets, including salmonids<br />
(Chile) <strong>and</strong> marine shrimp (Brazil, Cuba, Ecuador, Mexico, Bolivarian Republic <strong>of</strong><br />
Venezuela). A similar situation also existed in the selected Asian countries (with<br />
the exception <strong>of</strong> freshwater food-fish species), with the bulk <strong>of</strong> penaeid shrimp <strong>and</strong><br />
marine finfish production destined <strong>for</strong> export; over 99 percent <strong>of</strong> global farmed<br />
shrimp production being produced in developing countries, primarily <strong>for</strong> export to<br />
developed country markets <strong>of</strong> North America, Europe <strong>and</strong> Japan;<br />
6. the increasing national, regional <strong>and</strong> global competition <strong>for</strong> available feed <strong>and</strong> nutrient<br />
resources between the aquaculture sector <strong>and</strong> the animal livestock sector, including<br />
humans <strong>for</strong> direct food use <strong>and</strong> the need <strong>for</strong> the aquaculture sector to identify <strong>and</strong><br />
utilize more <strong>sustainable</strong> feed <strong>and</strong> nutrient sources as feed inputs to maintain the<br />
growth <strong>and</strong> long term sustainability <strong>of</strong> the regional aquaculture sectors;<br />
7. realisation that the bulk <strong>of</strong> small-scale farmers in sub-Saharan Africa <strong>and</strong> to a lesser<br />
extent within the selected Asian <strong>and</strong> Latin American countries do not have the<br />
financial resources to purchase feed <strong>and</strong>/or nutrient inputs <strong>for</strong> their aquaculture<br />
operations;<br />
8. the increased dependence <strong>and</strong> use <strong>of</strong> fishmeal <strong>and</strong> fish oil (including lower value trash<br />
fish species) within <strong>feeds</strong> <strong>for</strong> higher value cultured species destined <strong>for</strong> exports;<br />
9. although Latin American countries are currently self sufficient in fishmeal <strong>and</strong> fish oil<br />
supplies, the selected Asian <strong>and</strong> sub-Saharan countries are currently all net importers<br />
<strong>of</strong> fishmeal <strong>and</strong>/or fish oil;<br />
10. the trend toward the development <strong>and</strong> use <strong>of</strong> more environmentally friendly <strong>feeds</strong> <strong>and</strong><br />
feeding regimes, including the increasing development <strong>and</strong> use <strong>of</strong> highly digestible
Global synthesis <strong>of</strong> <strong>feeds</strong> <strong>and</strong> nutrients <strong>for</strong> <strong>sustainable</strong> aquaculture development 5<br />
extruded aqua<strong>feeds</strong> by the commercial aquafeed sector, in particular within those<br />
countries where environmental degradation <strong>and</strong> water pollution are major/potential<br />
aquaculture development issues;<br />
11. the trend within some regions, including the Latin American region, toward the<br />
consolidation <strong>of</strong> the commercial aquafeed manufacturing sector, which in some<br />
cases has resulted in regionalization <strong>of</strong> markets, thus reducing local competition <strong>and</strong><br />
consequently restricting types, presentations <strong>and</strong> even quality <strong>of</strong> products;<br />
12. the recognition <strong>of</strong> the important role played by national feed industry associations<br />
<strong>and</strong> government policy, to improve feed manufacturing, feed storage <strong>and</strong> quality<br />
control guidelines, import restrictions, duties, customs clearance procedures <strong>and</strong><br />
incentives <strong>and</strong> by so doing facilitating the <strong>sustainable</strong> development <strong>of</strong> the resident<br />
aquafeed manufacturing sector <strong>and</strong> ensuring that the farmer receives a consistence<br />
quality product targeted to the dietary needs <strong>of</strong> the cultured species;<br />
13. the lack <strong>of</strong> in<strong>for</strong>mation <strong>and</strong> regulation concerning the presence <strong>of</strong> heavy metal <strong>and</strong><br />
other environmental contaminants within aqua<strong>feeds</strong> (<strong>and</strong> consequently the cultured<br />
aquaculture product) <strong>and</strong> possible short <strong>and</strong> long term effects on human health,<br />
including possible export/import restrictions;<br />
14. the lack <strong>of</strong> resident expertise <strong>and</strong> training opportunities in aquaculture nutrition <strong>and</strong><br />
feed manufacturing technology within most sub-Saharan African countries, including<br />
<strong>feeds</strong> <strong>and</strong> feeding based development projects <strong>and</strong> undergraduate <strong>and</strong> postgraduate<br />
university training courses;<br />
15. the lack <strong>of</strong> ready available practical in<strong>for</strong>mation concerning the dietary nutrient<br />
requirements <strong>of</strong> the major fed aquaculture species, including up-to-date in<strong>for</strong>mation<br />
concerning aquaculture nutrition, feed ingredient usage, feed <strong>for</strong>mulation feed<br />
manufacture <strong>and</strong> on-farm feed management, including the development <strong>and</strong> use <strong>of</strong><br />
appropriate on-farm research methods; <strong>and</strong><br />
16. the recognition <strong>of</strong> the global importance <strong>of</strong> China in the production <strong>of</strong> farmed<br />
aquatic produce, including importation <strong>of</strong> key feed ingredients <strong>and</strong> nutrients, <strong>and</strong><br />
possible long terms effects on global fish supplies, fish prices <strong>and</strong> the long term global<br />
sustainability <strong>of</strong> the aquaculture sector.
6<br />
<strong>Study</strong> <strong>and</strong> <strong>analysis</strong> <strong>of</strong> <strong>feeds</strong> <strong>and</strong> <strong>fertilizers</strong> <strong>for</strong> <strong>sustainable</strong> aquaculture development<br />
1. INTRODUCTION<br />
This paper presents a global overview <strong>of</strong> aquaculture <strong>feeds</strong> <strong>and</strong> feeding, with particular<br />
reference to the production <strong>and</strong> use <strong>of</strong> <strong>feeds</strong> <strong>and</strong> <strong>fertilizers</strong> by the rapidly growing<br />
aquaculture sector in Asia, sub-Saharan Africa <strong>and</strong> Latin America. Although this<br />
overview draws heavily upon the findings <strong>and</strong> conclusions <strong>of</strong> three regional review<br />
papers <strong>of</strong> De Silva <strong>and</strong> Hasan (2007) <strong>for</strong> Asia (country reviews: Bangladesh, China,<br />
India, Indonesia, the Philippines, Thail<strong>and</strong>, Viet Nam), Hecht (2007) <strong>for</strong> sub-Saharan<br />
Africa (country reviews: Cameroon, Ghana, Kenya, Malawi, Nigeria, Ug<strong>and</strong>a, Zambia)<br />
<strong>and</strong> <strong>of</strong> Flores-Nava (2007) <strong>for</strong> Latin America (country reviews: Brazil, Chile, Cuba,<br />
Ecuador, Mexico, the Bolivarian Republic <strong>of</strong> Venezuela), other available in<strong>for</strong>mation<br />
sources were also consulted where relevant.<br />
FIGURE 1<br />
Total aquaculture production by continent<br />
Oceania - 162 156 tonnes<br />
Africa - 656 370 tonnes<br />
North America - 862 160 tonnes<br />
South America - 1 165 435 tonnes<br />
Europe - 2 140 442 tonnes<br />
Asia - 57 972 483 tonnes<br />
0 10 20 30 40 50 60 70<br />
2. GLOBAL OVERVIEW OF AQUACULTURE<br />
PRODUCTION AND FARMING SYSTEMS<br />
In 2005, global aquaculture production reached<br />
63.0 million tonnes, valued at US$78.4 billion<br />
(FAO, 2007). Moreover, the sector has been<br />
growing at an average compound rate (APR) <strong>of</strong><br />
9.2 percent per year since 1990, increasing over<br />
3.7 fold from 16.83 million tonnes in 1990 to<br />
63.0 million tonnes in 2005.<br />
By continent, Asia is by far the largest<br />
producer <strong>of</strong> aquaculture products (Figure 1).<br />
In 2005 Asia produced 57.97 million tonnes<br />
or 92.1 percent <strong>of</strong> total global production<br />
by weight (80.5 percent by value),<br />
followed by Europe 2.14 million tonnes<br />
TABLE 1<br />
Summary <strong>of</strong> reported total aquaculture production in Asia in 2005<br />
Country/species Production (tonnes) Value (US$ billion)<br />
Total<br />
Top 10 countries by production<br />
57 972 483 63.14<br />
China<br />
43 269 413<br />
39.79<br />
India<br />
2 842 419<br />
3.92<br />
Indonesia<br />
2 124 093<br />
2.32<br />
Philippines<br />
1 895 848<br />
0.90<br />
Viet Nam<br />
1 467 300<br />
2.94<br />
Japan<br />
1 253 963<br />
4.27<br />
Thail<strong>and</strong><br />
1 144 011<br />
1.69<br />
Republic <strong>of</strong> Korea<br />
1 057 386<br />
1.45<br />
Bangladesh<br />
882 091<br />
1.25<br />
Democratic People’s Republic <strong>of</strong> Korea<br />
Top finfish & crustacean species groups<br />
507 995<br />
0.30<br />
Freshwater fish<br />
Crustaceans<br />
Marine fish<br />
Diadromous fish1 24 419 668<br />
24.76<br />
3 644 151<br />
14.26<br />
1 305 507<br />
4.23<br />
Top cultivated finfish & crustacean species<br />
1 032 377<br />
2.21<br />
Carps, barbels & other cyprinids<br />
19 088 487<br />
17.36<br />
Miscellaneous freshwater fish2 Shrimp<br />
Tilapia<br />
Freshwater crustaceans<br />
3 741 385<br />
2 376 161<br />
1589 796<br />
998 598<br />
1 Includes salmonids, milkfish, eels <strong>and</strong> sturgeons;<br />
2 Includes catfishes, m<strong>and</strong>arin fish (in the case <strong>of</strong> China), snakehead <strong>and</strong> gourami, etc.<br />
Source: FAO (2007)<br />
5.78<br />
9.19<br />
1.61<br />
4.35
Global synthesis <strong>of</strong> <strong>feeds</strong> <strong>and</strong> nutrients <strong>for</strong> <strong>sustainable</strong> aquaculture development 7<br />
(3.4 percent by weight), South America 1.16 million tonnes (1.85 percent), North America<br />
0.86 million tonnes (1.37 percent), Africa 0.66 million tonnes (1.0 percent) <strong>and</strong> Oceania<br />
0.14 million tonnes (0.26 percent) (FAO, 2007).<br />
On the basis <strong>of</strong> the three geographic regions surveyed in this report, total aquaculture<br />
production by major producing country <strong>and</strong> by major cultivated finfish <strong>and</strong> crustacean<br />
species groups is summarized in Tables 1, 2 <strong>and</strong> 3.<br />
TABLE 2<br />
Summary <strong>of</strong> reported total aquaculture production in Latin America <strong>and</strong> the Caribbean in 2005<br />
Country/species Production (tonnes) Value (US$ billion)<br />
Total<br />
Top 10 countries by production<br />
1 401 554 5.69<br />
Chile<br />
713 706<br />
3.12<br />
Brazil<br />
257 783<br />
0.91<br />
Mexico<br />
117 514<br />
0.47<br />
Ecuador<br />
78 300<br />
0.31<br />
Colombia<br />
60 072<br />
0.28<br />
Honduras<br />
29 380<br />
0.05<br />
Peru<br />
27 468<br />
0.17<br />
Costa Rica<br />
24 038<br />
0.08<br />
Cuba<br />
22 635<br />
0.03<br />
Bolivarian Republic <strong>of</strong> Venezuela<br />
Top finfish & crustacean species groups<br />
22 210<br />
0.07<br />
Diadromous fish1 Freshwater fish<br />
Crustaceans<br />
Marine fish<br />
Top cultivated finfish & crustacean species<br />
Salmonids<br />
Shrimp<br />
Tilapia<br />
Miscellaneous freshwater fish2 Carps, barbels & other cyprinids<br />
617 540<br />
351 242<br />
279 303<br />
8 521<br />
617 540<br />
278 385<br />
182 266<br />
92 260<br />
76 716<br />
1 2 Includes salmonids <strong>and</strong> sturgeons; Includes catfishes, pacu <strong>and</strong> Colossoma, etc.<br />
Source: FAO (2007)<br />
2.85<br />
0.99<br />
1.27<br />
0.12<br />
TABLE 3<br />
Summary <strong>of</strong> reported total aquaculture production in sub-Saharan Africa in 2005<br />
Region/country/species Production (tonnes) Value (US$ billion)<br />
Total<br />
Top 10 countries by production<br />
109 466 0.296<br />
Nigeria<br />
Ug<strong>and</strong>a<br />
Madagascar<br />
South Africa<br />
Tanzania<br />
Zambia<br />
Congo<br />
Zimbabwe<br />
Togo<br />
Mozambique<br />
Top finfish & crustacean species groups<br />
Freshwater fish<br />
Crustaceans<br />
Diadromous fish<br />
Marine fish<br />
Top cultivated finfish & crustacean species<br />
Miscellaneous freshwater fish1 Tilapia<br />
Shrimp<br />
1 Includes catfishes, snakeheads <strong>and</strong> African bonytongue, etc.<br />
Source: FAO (2007)<br />
56 355<br />
10 817<br />
8 500<br />
6 142<br />
6 011<br />
5 125<br />
2 965<br />
2 452<br />
1 535<br />
1 278<br />
88 831<br />
7 907<br />
1 045<br />
594<br />
59 069<br />
27 004<br />
7 893<br />
2.85<br />
1.26<br />
0.48<br />
0.32<br />
0.18<br />
0.159<br />
0.012<br />
0.034<br />
0.036<br />
0.001<br />
0.009<br />
0.007<br />
0.005<br />
0.003<br />
0.007<br />
0.213<br />
0.043<br />
0.004<br />
0.003<br />
0.159<br />
0.050<br />
0.042
8<br />
<strong>Study</strong> <strong>and</strong> <strong>analysis</strong> <strong>of</strong> <strong>feeds</strong> <strong>and</strong> <strong>fertilizers</strong> <strong>for</strong> <strong>sustainable</strong> aquaculture development<br />
Interestingly, despite the differences in size between the three target regions, the<br />
growth <strong>of</strong> the aquaculture sector within each region has been remarkably similar; total<br />
production in Asia increasing 4.0 fold from 14.50 million tonnes in 1990 to 57.97 million<br />
tonnes in 2005 at an average APR <strong>of</strong> 9.7 percent, total production in Latin America <strong>and</strong><br />
the Caribbean increasing 6.1 fold from 230 658 tonnes in 1990 to 1 401 554 tonnes in<br />
2005 with an average APR <strong>of</strong> 12.8 percent, <strong>and</strong> in sub-Saharan Africa total production<br />
increasing 5.9 fold from 18 410 tonnes in 1990 to 109 466 tonnes in 2005 at an average<br />
APR <strong>of</strong> 12.6 percent (FAO, 2007).<br />
Moreover, aquaculture production within each region is currently dominated by one<br />
country, namely China (43.27 million tonnes or 74.6 percent <strong>of</strong> total Asia production;<br />
Table 1), Chile (713 706 tonnes or 50.9 percent <strong>of</strong> total Latin America <strong>and</strong> Caribbean<br />
production; Table 2) <strong>and</strong> Nigeria (56 355 tonnes or 51.5 percent <strong>of</strong> total sub-Saharan<br />
Africa production; Table 3). However, the production <strong>of</strong> major fed species within these<br />
regions is quite different, ranging from mainly freshwater fish species <strong>and</strong> crustaceans<br />
in sub-Saharan Africa (includes catfishes <strong>and</strong> tilapia on the African mainl<strong>and</strong>, <strong>and</strong><br />
penaeid shrimp in Madagascar <strong>and</strong> the Seychelles), primarily freshwater fish <strong>and</strong><br />
crustacean species in Asia (includes carps, tilapia, m<strong>and</strong>arin fish, snakehead, catfishes,<br />
freshwater crabs <strong>and</strong> prawns, milkfish, eels, <strong>and</strong> marine fish <strong>and</strong> penaeid shrimp), to<br />
mainly diadromous salmonid <strong>and</strong> penaeid shrimp species in Latin America <strong>and</strong> the<br />
Caribbean.<br />
In general the farming or production systems employed by farmers within the<br />
different regions reflect the intended market (domestic or export) <strong>and</strong> value (high or<br />
low) <strong>of</strong> the cultured target species. Thus farming systems typically range from the use<br />
<strong>of</strong> lower-cost earthen pond-based extensive <strong>and</strong> semi-intensive production systems <strong>for</strong><br />
the mass production <strong>of</strong> lower-value freshwater fish species (mainly cyprinids, tilapia<br />
<strong>and</strong> the diadromous milkfish) destined <strong>for</strong> local domestic consumption, to the use<br />
<strong>of</strong> more intensive pond, cage or tank-based production systems <strong>for</strong> the production<br />
<strong>of</strong> higher-value carnivorous fish species (marine fish, salmonids, eels, m<strong>and</strong>arin fish,<br />
snakehead) <strong>and</strong> crustaceans (marine shrimp, freshwater prawns, crabs, etc) <strong>for</strong> export<br />
or high-end domestic markets.<br />
With the possible exception <strong>of</strong> Brazil (in the case <strong>of</strong> freshwater fish species), the bulk<br />
<strong>of</strong> aquaculture species produced within the selected Latin American countries were<br />
higher-value species (in marketing terms) destined <strong>for</strong> export to developed country<br />
markets, including salmonids (Chile) <strong>and</strong> marine shrimp (Brazil, Cuba, Ecuador,<br />
Mexico, Bolivarian Republic <strong>of</strong> Venezuela). A similar situation exists in the selected<br />
Asian countries (with the exception <strong>of</strong> freshwater food-fish species), where the bulk <strong>of</strong><br />
marine finfish <strong>and</strong> shrimp production is also destined <strong>for</strong> export. It is also <strong>of</strong> interest<br />
to note that over 99.67 percent <strong>of</strong> global farmed shrimp production in 2005 (2 675 336<br />
tonnes) was produced in developing countries (FAO, 2007) <strong>and</strong> exported mainly to the<br />
developed country markets <strong>of</strong> North America, Europe <strong>and</strong> Japan.<br />
Finally, with the possible exception <strong>of</strong> the recent reduced growth observed in the<br />
production <strong>of</strong> the lower-value filter feeding fish species in China (FAO, 2007), the<br />
growth <strong>of</strong> fed-species within all three regions continues to exhibit double digit growth<br />
rates. The current major production constraints <strong>for</strong> fed-species are either market related<br />
(decreasing market prices due to increased production <strong>and</strong>/or international competition)<br />
or environmental (intensification <strong>of</strong> farming practices leading to eutrophication <strong>of</strong><br />
receiving waterbodies, increasing disease occurrence <strong>and</strong>/or due to increasing concerns<br />
regarding food <strong>and</strong> feed safety).<br />
3. REVIEW AND ANALYSIS OF AQUACULTURE FEEDS AND FEEDING<br />
Feeding methods<br />
Globally the feeding methods employed by farmers can be divided into three basic<br />
categories, namely:
Global synthesis <strong>of</strong> <strong>feeds</strong> <strong>and</strong> nutrients <strong>for</strong> <strong>sustainable</strong> aquaculture development 9<br />
• no feeding: fish/crustacean growth dependent upon the natural productivity<br />
<strong>of</strong> the waterbody or culture environment (typical <strong>of</strong> traditional extensive pond<br />
farming systems);<br />
• endogenous feeding: fish/crustacean growth dependent upon the increased<br />
endogenous or in-situ production <strong>of</strong> natural food organisms <strong>and</strong> plants within the<br />
culture system either 1) indirectly through the application <strong>of</strong> substrates so as to<br />
increase the surface area available <strong>for</strong> natural food production (by using woody<br />
branches <strong>and</strong> plant stems or artificial substrates) <strong>and</strong>/or 2) directly through the<br />
application <strong>of</strong> chemical <strong>fertilizers</strong> <strong>and</strong>/or organic manures as a source <strong>of</strong> nutrients <strong>for</strong><br />
natural animal <strong>and</strong> plant biota (typical <strong>of</strong> modified extensive pond farming systems);<br />
• exogenous feeding: fish/shrimp growth dependent upon the external supply <strong>of</strong><br />
<strong>feeds</strong>, either (i) in the <strong>for</strong>m <strong>of</strong> single agricultural feed ingredients or simple feed<br />
mixtures/mashes (usually used as supplementary <strong>feeds</strong> in combination with<br />
endogenous feeding regimes), (ii) in the <strong>for</strong>m <strong>of</strong> a single food item <strong>of</strong> high nutrient<br />
value (such as trash fish, marine invertebrates – worms, crabs, shrimp) <strong>and</strong>/or (iii)<br />
in the <strong>for</strong>m <strong>of</strong> a <strong>for</strong>mulated nutritionally complete compounded diet (the latter<br />
either produced on-farm or <strong>of</strong>f-farm by a commercial feed compounder.<br />
As with farming systems, the choice <strong>of</strong> the feeding method is based upon a variety<br />
<strong>of</strong> different factors (which in turn may vary from country to country <strong>and</strong> farmer to<br />
farmer), including the aim <strong>of</strong> the farming activity (local/home consumption or cash<br />
crop/export), the market value <strong>of</strong> the cultured species, the financial resources <strong>of</strong> the<br />
farmer <strong>and</strong> the local market availability <strong>of</strong> appropriate <strong>fertilizers</strong> <strong>and</strong> <strong>feeds</strong>. Thus<br />
feeding methods may range from the use <strong>of</strong> lower-cost endogenous feeding strategies<br />
based on the use <strong>of</strong> <strong>fertilizers</strong> <strong>and</strong> manures within controlled eutrophic or green-water<br />
extensive pond culture systems <strong>for</strong> the production <strong>of</strong> lower-value (in marketing terms)<br />
filter feeding <strong>and</strong>/or benthic detritivorous fish species (such as silver carp <strong>and</strong> bighead<br />
carp, mullet <strong>and</strong> milkfish, respectively), to the use <strong>of</strong> higher-cost nutritionally complete<br />
extruded pelleted diets <strong>for</strong> the production <strong>of</strong> high-value carnivorous marine finfish<br />
within intensive floating cage farming systems.<br />
Fish <strong>and</strong> crustacean species<br />
Although no <strong>of</strong>ficial statistical in<strong>for</strong>mation exists concerning the farming systems<br />
<strong>and</strong> feeding regimes employed by farmers <strong>for</strong> each <strong>of</strong> the major cultivated finfish <strong>and</strong><br />
crustacean species within each <strong>of</strong> the regions targeted within this report, it is estimated<br />
that only 34.46 million tonnes or 54.7 percent <strong>of</strong> total global aquaculture production in<br />
2005 was dependent upon endogenous <strong>and</strong> exogenous feeding (calculated from FAO,<br />
2007), including:<br />
• 8.79 million tonnes <strong>of</strong> filter-feeding carp species (major species – silver carp,<br />
bighead carp, rohu, catla: usually cultured as a polyculture <strong>of</strong> mixed species under<br />
extensive pond culture conditions using endogenous feeding <strong>and</strong>/or low-cost<br />
supplementary <strong>feeds</strong>);<br />
• 16.85 million tonnes <strong>of</strong> herbivorous/omnivorous fish species (major species<br />
– grass carp, common carp, crucian carp, Nile tilapia, milkfish, mrigal carp, white<br />
amur bream, channel catfish, amur catfish, flathead grey mullet: usually cultured<br />
as a monoculture under semi-intensive <strong>and</strong> intensive culture conditions using<br />
endogenous <strong>and</strong>/or exogenous feeding);<br />
• 3.96 million tonnes <strong>of</strong> crustaceans (major species: Pacific white shrimp, giant tiger<br />
prawn, Chinese river crab, oriental river prawn, giant freshwater prawn, red swamp<br />
crawfish, banana prawn, swimming crabs: usually cultured as a monoculture<br />
under semi-intensive or intensive culture conditions using endogenous <strong>and</strong>/or<br />
exogenous feeding); <strong>and</strong><br />
• 4.66 million tonnes <strong>of</strong> predominantly animal protein consuming or carnivorous<br />
fish species (major species: Atlantic salmon, rainbow trout, black carp, snakehead,
10<br />
<strong>Study</strong> <strong>and</strong> <strong>analysis</strong> <strong>of</strong> <strong>feeds</strong> <strong>and</strong> <strong>fertilizers</strong> <strong>for</strong> <strong>sustainable</strong> aquaculture development<br />
FIGURE 2<br />
Finfish production by feeding habit (values expressed in thous<strong>and</strong> tonnes – tt, live weight<br />
equivalents)<br />
30000<br />
25000<br />
20000<br />
15000<br />
10000<br />
5000<br />
0<br />
tt<br />
GR OWTH (% A PR ) 1970 -1980 1980 -1990 1990 -2000 1970 -2002 2002 -2003<br />
Carnivores 11.0% 9.5% 10.6% 10.3% 4.6%<br />
Filter feeders 6.0% 12.5% 9.1% 8.6% 3.6%<br />
O m nivores/herbivores 5.7% 12.5% 10.6% 9.2% 6.5%<br />
Total finfish 6.4% 12.1% 10.3% 9.2% 5.4%<br />
1 9 7 0 1 9 7 2 1 9 7 4 1 9 7 6 1 9 7 8 1 9 8 0 1 9 8 2 1 9 8 4 1 9 8 6 1 9 8 8 1 9 9 0 1 9 9 2 1 9 9 4 1 9 9 6 1 9 9 8 2 0 0 0 2 0 0 2<br />
C A R N IV O R E S FILTE R FE E D E R S O M N IV O R E S /H E R B IV O R E S TO TAL FIN FIS H<br />
Source: Tacon, Hasan <strong>and</strong> Subasinghe (2006)<br />
Japanese eel, Japanese seabass, m<strong>and</strong>arin fish, Japanese amberjack, swamp eel,<br />
coho salmon, gilthead seabream, silver seabream, large yellow croaker, grouper)<br />
<strong>and</strong> 0.20 million tonnes <strong>of</strong> reptiles (major species: s<strong>of</strong>t-shell turtle): usually<br />
cultured as a monoculture under semi-intensive or intensive culture conditions<br />
using exogenous feeding (complete pelleted <strong>feeds</strong> <strong>and</strong>/or trash fish).<br />
Figure 2 shows the reported increase in production <strong>of</strong> cultured finfish by feeding<br />
habit, from which it is evident that the highest overall growth rate was recorded<br />
<strong>for</strong> carnivorous finfish species (10.3 percent), followed by omnivorous/herbivorous<br />
species (9.2 percent) <strong>and</strong> filter feeding species (8.6 percent). Of particular note, was the<br />
significant decline in the production rate <strong>of</strong> filter feeding species over the last decade.<br />
Compound aquafeed production<br />
In most developed countries, almost all cultured finfish <strong>and</strong> crustacean species are<br />
currently reared on industrially compounded aqua<strong>feeds</strong> <strong>and</strong> total aquafeed production<br />
is annually reported. Un<strong>for</strong>tunately in most developing countries there is no precise<br />
statistical in<strong>for</strong>mation concerning the percent <strong>of</strong> aquaculture production that is<br />
attributable to industrially compounded aqua<strong>feeds</strong>, farm-made aqua<strong>feeds</strong> or whole<br />
food items (such as trash fish), either by major cultured species group or farming<br />
system.<br />
On the basis <strong>of</strong> the in<strong>for</strong>mation presented in the three regional reviews (De Silva<br />
<strong>and</strong> Hasan, 2007; Flores-Nava, 2007; Hecht, 2007), total estimated compound aquafeed<br />
production within the 20 selected countries (which collectively accounted <strong>for</strong> 86.3 percent<br />
<strong>of</strong> total global aquaculture production by weight in 2003; FAO, 2007) was estimated to<br />
be just over 11.5 million tonnes (Latin America select – 1.2 million tonnes, Asia select<br />
– 10.30 million tonnes <strong>and</strong> sub-Saharan Africa select – 12 000 tonnes). These estimates<br />
compare very favourably with those reported by Tacon (2004a) <strong>of</strong> 1.3 <strong>and</strong> 10.9 million<br />
tonnes <strong>for</strong> the same selected countries in Latin America <strong>and</strong> Asia, respectively.<br />
Tacon (2007) estimated that the global production <strong>of</strong> industrially compounded<br />
aqua<strong>feeds</strong> in 2005 was about 23.13 million tonnes (Figure 3). This figure compares<br />
favourably with Gill (2007), who estimated global aquafeed production to be<br />
approximately 25.4 million tonnes or 4 percent <strong>of</strong> global industrial animal feed<br />
production <strong>of</strong> 635 million tonnes in 2006.
Global synthesis <strong>of</strong> <strong>feeds</strong> <strong>and</strong> nutrients <strong>for</strong> <strong>sustainable</strong> aquaculture development 11<br />
Of particular note is the general trend<br />
within some regions, <strong>and</strong> in particular<br />
the Latin American region, toward the<br />
consolidation <strong>of</strong> the commercial aquafeed<br />
manufacturing sector, which in some cases<br />
has resulted in regionalization <strong>of</strong> markets,<br />
thus reducing local competition <strong>and</strong><br />
consequently restricting types, presentations<br />
<strong>and</strong> even quality <strong>of</strong> products, e.g. Brazil,<br />
Chile <strong>and</strong> Mexico (Flores-Nava, 2007).<br />
The important role played by<br />
government <strong>and</strong> national feed industry<br />
associations in setting policy guidelines <strong>and</strong><br />
criteria <strong>for</strong> the <strong>sustainable</strong> development <strong>of</strong><br />
the aquafeed manufacturing sector within<br />
the three target regions was particularly<br />
stressed. For example, government policy<br />
<strong>and</strong> feed associations can play critical roles<br />
included the establishment <strong>of</strong> good feed<br />
FIGURE 3<br />
Estimated global compound aquafeed production in<br />
2005 <strong>for</strong> major farmed species<br />
(values expressed as % total aquafeed production, dry<br />
as fed basis)<br />
1.1%<br />
FRESHWATER<br />
CRUSTACEANS, 4.3%<br />
MARINE SHRIMP, 18.1%<br />
TILAPIA, 9.5%<br />
CATFISH, 4.1%<br />
SALMON, 7.7%<br />
TROUT, 3.2%<br />
MILKFISH, 2.3%<br />
EEL, 1.8%<br />
FEEDING CARPS,<br />
41.8%<br />
manufacturing practices (feed storage, quality control guidelines, record keeping <strong>and</strong><br />
good on-farm feed management), the setting <strong>and</strong>/or removal <strong>of</strong> feed ingredient import<br />
restrictions <strong>and</strong> duties <strong>and</strong> through the establishment <strong>of</strong> improved customs clearance<br />
procedures <strong>and</strong> export incentives. Apart from ensuring the <strong>sustainable</strong> development<br />
<strong>of</strong> the aquafeed manufacturing sector, attention to the above mentioned issues would<br />
in turn ensure that farmers would receives a consistent cost-effective quality product<br />
targeted to the dietary needs <strong>of</strong> the cultured species (FAO, 2001).<br />
Farm-made aquafeed production<br />
Except <strong>for</strong> Asia, where total farm-made aquafeed production was estimated at<br />
19.3 million tonnes (De Silva <strong>and</strong> Hasan, 2007), there is no accurate in<strong>for</strong>mation on<br />
the current production <strong>of</strong> farm-made aqua<strong>feeds</strong> in the selected sub-Saharan (except<br />
Nigeria) <strong>and</strong> Latin American countries. Hecht (2007) noted that approximately<br />
70 percent <strong>of</strong> the 35 570 tonnes <strong>of</strong> aquafeed used Nigeria consisted <strong>of</strong> farm-made <strong>feeds</strong>.<br />
According to De Silva <strong>and</strong> Hasan (2007) farm-made aquafeed production within the<br />
selected Asian countries was as follows:<br />
• China – 10.88 million tonnes (compared with 7.8 million tonnes <strong>of</strong> industrially<br />
compounded aqua<strong>feeds</strong>);<br />
• India – 6.16 million tonnes (compared with 238 883 tonnes <strong>of</strong> compound aqua<strong>feeds</strong>);<br />
• Viet Nam – 800 000 tonnes (compared with 696 000 tonnes <strong>of</strong> compound<br />
aqua<strong>feeds</strong>);<br />
• Thail<strong>and</strong> – 762 173 tonnes (compared with 822 500 tonnes <strong>of</strong> compound aqua<strong>feeds</strong>);<br />
• Philippines – 384 896 tonnes (compared with 204 396 tonnes <strong>of</strong> compound<br />
aqua<strong>feeds</strong>); <strong>and</strong><br />
• Indonesia – 275 850 tonnes (compared with 490 000 tonnes <strong>of</strong> compound<br />
aqua<strong>feeds</strong>).<br />
However, no indication was given if farm-made aquafeed production was based on<br />
a wet, semi-moist or dry weight basis.<br />
The important role played by farm-made aqua<strong>feeds</strong> within extensive <strong>and</strong> semiintensive<br />
pond farming systems <strong>and</strong> in particular <strong>for</strong> the production <strong>of</strong> lower value,<br />
freshwater fish species <strong>for</strong> home consumption was particularly highlighted. For<br />
example, in India farm-made aqua<strong>feeds</strong> represent 96.3 percent <strong>of</strong> the total feed used by<br />
farmers (De Silva <strong>and</strong> Hasan, 2007), <strong>and</strong> provide the mainstay <strong>of</strong> feed inputs within the<br />
selected sub-Saharan countries (Hecht, 2007).<br />
MARINE FISH, 6.0%<br />
Total estimated compound aquafeed production in 2005 – 23.13 million tonnes<br />
Source: Tacon (2007)
12<br />
<strong>Study</strong> <strong>and</strong> <strong>analysis</strong> <strong>of</strong> <strong>feeds</strong> <strong>and</strong> <strong>fertilizers</strong> <strong>for</strong> <strong>sustainable</strong> aquaculture development<br />
4. PROBLEMS AND CONSTRAINTS<br />
The following problems <strong>and</strong> constraints to <strong>feeds</strong> <strong>and</strong> feeding were reported within the<br />
regional reviews, namely:<br />
Use <strong>of</strong> trash fish as fish feed<br />
A problem reported in some Asian <strong>and</strong> sub-Saharan countries has been due to the<br />
increased competition between humans <strong>and</strong> aquaculture <strong>for</strong> the use <strong>of</strong> low value fish<br />
or ‘trash fish’ as feed (Edwards, Tuan <strong>and</strong> Allan, 2004; FAO, 2004; Hecht, 2007). Fish<br />
species generally considered under this category include small pelagic filter feeding<br />
species such as anchovy, herring, sardines, pilchards, omena, pony fish <strong>and</strong> small<br />
sergestid shrimp.<br />
Although there are no <strong>of</strong>ficial estimates concerning the amount <strong>of</strong> low value fish<br />
used in aquaculture, Allan (2004) <strong>and</strong> Tacon (2004a) have estimated that the total use is<br />
between 5 <strong>and</strong> 6 million tonnes, respectively. For example, according to D’Abramo, Mai<br />
<strong>and</strong> Deng (2002) the marine aquaculture sector in mainl<strong>and</strong> China in 2000 consumed<br />
4 million tonnes <strong>of</strong> ‘trash fish’. Similarly, Edwards, Tuan <strong>and</strong> Allan (2004) estimated that<br />
the total use <strong>of</strong> ‘trash fish’ by the aquaculture industry in Viet Nam was between 176 420<br />
<strong>and</strong> 323 440 tonnes, with trash fish representing an estimated 36 percent <strong>of</strong> the total<br />
marine fisheries catch in 2001. The above estimates also agree with the disposition <strong>of</strong><br />
the global fisheries catch (FAO, 2007), <strong>for</strong> which the difference between the proportion<br />
<strong>of</strong> total l<strong>and</strong>ings destined <strong>for</strong> non-food uses (28.28 million tonnes) <strong>and</strong> reduction (21.38<br />
million tonnes) in 2003 was around 6.9 million tonnes (FAO, 2007).<br />
Apart from the potential environmental polluting effect <strong>and</strong> disease risks <strong>of</strong> using<br />
non-processed trash fish products as aquaculture feed, there are growing concerns<br />
that the increasing dem<strong>and</strong> <strong>for</strong> these products by the aquaculture sector may result in<br />
increasing fishing pressure on available fish stocks (FAO, 2004) <strong>and</strong> drive up the cost<br />
<strong>of</strong> ‘trash fish’ <strong>and</strong> out <strong>of</strong> the economic grasp <strong>and</strong> reach <strong>of</strong> the poor <strong>and</strong> needy <strong>for</strong> direct<br />
human consumption (Edwards, Tuan <strong>and</strong> Allan, 2004; Normile, 2002). For example,<br />
Allan (2004) reported that the price <strong>of</strong> ‘trash fish’ in Viet Nam has doubled due to the<br />
increasing dem<strong>and</strong> <strong>for</strong> the product from the domestic aquaculture sector.<br />
Fish species reportedly commonly being fed trash fish include marine <strong>and</strong> freshwater<br />
carnivorous fish species in China (D’Abramo, Mai <strong>and</strong> Deng, 2002) <strong>and</strong> Viet Nam<br />
(Edwards, Tuan <strong>and</strong> Allan, 2004), <strong>and</strong> more recently tuna in Mexico (Flores-Nava, 2007<br />
<strong>and</strong> personal observation). For example, according to Allan (2004) the on-growing <strong>of</strong><br />
wild-caught southern bluefin tuna in Australia requires 50 000 to 60 000 tonnes <strong>of</strong><br />
pilchards or ‘baitfish’ <strong>for</strong> a tuna biomass increase <strong>of</strong> 3 000 tonnes. This is equivalent to<br />
a ‘pelagic fish’ to ‘farm fish’ conversion ratio <strong>of</strong> 16.6:1 – 20:1. Similar conversion ratios<br />
have been reported by other authors <strong>for</strong> tuna, with mean food conversion ratios <strong>for</strong><br />
on-growing tuna in the Mediterranean region typically ranging from 15 to 20:1, to as<br />
low as 8:1 <strong>and</strong> 12.5:1 <strong>for</strong> fingerlings <strong>and</strong> juveniles using baitfish in Japan (Ottolenghi<br />
et al., 2004).<br />
Use <strong>of</strong> fishmeal <strong>and</strong> fish oil as fish feed<br />
One <strong>of</strong> the biggest problems <strong>and</strong> constraints facing the animal <strong>and</strong> aquafeed industry<br />
is the current dependence <strong>of</strong> the aquaculture sector upon fishmeal <strong>and</strong> fish oil as a<br />
cost-effective source <strong>of</strong> high quality animal protein <strong>and</strong> essential dietary lipids (Barlow,<br />
2003; FIN, 2004; Hardy <strong>and</strong> Tacon, 2002; Huntington, 2004; Huntington et al., 2004;<br />
New <strong>and</strong> Wijkstrom, 2002; Pike, 2005; Sea<strong>feeds</strong>, 2003). This dependency is particularly<br />
strong <strong>for</strong> those higher value species feeding high on the aquatic food chain, including<br />
all farmed carnivorous finfish species <strong>and</strong> most omnivorous/scavenging crustacean<br />
species (Allan, 2004; Hardy, 2003; Pike <strong>and</strong> Barlow, 2003; Tacon, 2004a; Zaldivar,<br />
2004). The apparent higher dependency <strong>of</strong> these cultured species <strong>for</strong> fishmeal <strong>and</strong> fish<br />
oil is primarily due to their more exacting dietary requirements <strong>for</strong> high quality animal
Global synthesis <strong>of</strong> <strong>feeds</strong> <strong>and</strong> nutrients <strong>for</strong> <strong>sustainable</strong> aquaculture development 13<br />
protein, essential omega-3 fatty acids <strong>and</strong><br />
essential trace minerals (Hardy et al., 2001;<br />
Pike, 1998).<br />
According to Tacon, Hasan <strong>and</strong><br />
Subasinghe (2006) the aquafeed sector<br />
consumed about 52.6 percent <strong>and</strong> 86.8<br />
percent <strong>of</strong> the total global production <strong>of</strong><br />
fishmeal (Figure 4) <strong>and</strong> fish oil (Figure 5) in<br />
2003, respectively.<br />
It is important to note here that the total<br />
estimated amount <strong>of</strong> fishmeal <strong>and</strong> fish oil<br />
used within aqua<strong>feeds</strong> has grown over threefold<br />
from 963 to 2 936 thous<strong>and</strong> tonnes <strong>and</strong><br />
from 234 to 802 thous<strong>and</strong> tonnes from 1992<br />
to 2003, respectively (Tacon, Hasan <strong>and</strong><br />
Subasinghe, 2006). However, this increase<br />
in usage is in line with the almost threefold<br />
increase in total finfish <strong>and</strong> crustacean<br />
aquaculture production over this period,<br />
from 10.9 to 29.8 million tonnes from 1992<br />
to 2003 (FAO, 2007).<br />
Apart from the fact that the total global<br />
supplies <strong>of</strong> fishmeal <strong>and</strong> fish oil are limited in<br />
terms <strong>of</strong> quantity <strong>and</strong> availability (fishmeal<br />
<strong>and</strong> fish oil supplies fluctuated between 5<br />
<strong>and</strong> 7 million tonnes <strong>and</strong> 0.7–1.3 million<br />
tonnes over the past decade, respectively)<br />
(FAO, 2007), there is increasing competition<br />
<strong>for</strong> direct human consumption <strong>of</strong> many the<br />
pelagics currently used to make fishmeal <strong>for</strong><br />
animal feeding (Hecht, 2007; Wray, 2001;<br />
Zaldivar, 2004).<br />
Although Latin American countries<br />
are currently generally self sufficient in<br />
fishmeal <strong>and</strong> fish oil supplies, the Asian<br />
<strong>and</strong> sub-Saharan countries surveyed in the<br />
regional reviews were all net importers <strong>of</strong><br />
fishmeal <strong>and</strong>/or fish oil. In 2003, China<br />
FIGURE 4<br />
Estimated global use <strong>of</strong> fishmeal (percentage <strong>of</strong> dry<br />
as fed basis) within compound aqua<strong>feeds</strong> in 2003<br />
by major species. Total estimated fishmeal used in<br />
aqua<strong>feeds</strong> was 2 936 thous<strong>and</strong> tonnes or 52.6% <strong>of</strong><br />
total reported world production in 2003<br />
Freshwater crustaceans 4,7%<br />
Marine shrimp 22.8%<br />
Marine fish 20.1%<br />
Trout 7.4%<br />
Salmon 19.5%<br />
Eel 5.8%<br />
Milkfish 1.2%<br />
Carp 14.9%<br />
Tilapia 2.7%<br />
Catfish 0.8%<br />
Source: Tacon, Hasan <strong>and</strong> Subasinghe (2006)<br />
FIGURE 5<br />
Estimated global use <strong>of</strong> fish oil (percentage <strong>of</strong> dry<br />
as fed basis) within compound aqua<strong>feeds</strong> in 2003 by<br />
major cultivated species. Total estimated fish oil used<br />
in aqua<strong>feeds</strong> in 2003 was 802 thous<strong>and</strong> tonnes or<br />
86.8% <strong>of</strong> total reported world production<br />
Marine fish 13.8%<br />
Trout 14.4%<br />
Salmon 51.0%<br />
Eel 1.4%<br />
Milkfish 0.6%<br />
Carp 5.5%<br />
Tilapia 2.0%<br />
Catfish 1.0%<br />
FW crustaceans 1.7%<br />
Marine shrimp 7.3%<br />
Source: Tacon, Hasan <strong>and</strong> Subasinghe (2006)<br />
alone imported 803 thous<strong>and</strong> tonnes <strong>of</strong> fishmeal, accounting <strong>for</strong> 22.5 percent <strong>of</strong> total<br />
global fishmeal imports (FAO, 2005) <strong>and</strong> <strong>for</strong> about one third <strong>of</strong> world soybean imports<br />
(Tacon, 2005a; Tuan, Fang <strong>and</strong> Cao, 2004);<br />
Other reported regional constraints<br />
In addition to the use <strong>of</strong> fishmeal <strong>and</strong> fish oil, the following other regional problems<br />
<strong>and</strong> constraints were reported, namely:<br />
• Realization that the bulk <strong>of</strong> small-scale farmers in sub-Saharan Africa <strong>and</strong> to a<br />
lesser extent within many <strong>of</strong> the selected Asian <strong>and</strong> Latin American countries, do<br />
not have the financial resources to purchase feed <strong>and</strong>/or nutrient inputs <strong>for</strong> their<br />
aquaculture operations;<br />
• General lack <strong>of</strong> resident expertise <strong>and</strong> training opportunities in aquaculture<br />
nutrition <strong>and</strong> feed manufacturing technology within most sub-Saharan<br />
African countries, including <strong>feeds</strong> <strong>and</strong> feeding based development projects <strong>and</strong><br />
undergraduate <strong>and</strong> postgraduate university training courses (Hecht, 2007);
14<br />
<strong>Study</strong> <strong>and</strong> <strong>analysis</strong> <strong>of</strong> <strong>feeds</strong> <strong>and</strong> <strong>fertilizers</strong> <strong>for</strong> <strong>sustainable</strong> aquaculture development<br />
• Trend toward the development <strong>and</strong> use <strong>of</strong> more environmentally friendly <strong>feeds</strong><br />
<strong>and</strong> feeding regimes, including the increasing development <strong>and</strong> use <strong>of</strong> highly<br />
digestible extruded aqua<strong>feeds</strong> by the commercial aquafeed sector, <strong>and</strong> in particular<br />
within those countries where environmental degradation <strong>and</strong> water pollution are<br />
major/potential aquaculture development issues (e.g. Chile – Tacon, 2005b);<br />
• General lack <strong>of</strong> in<strong>for</strong>mation <strong>and</strong> regulation concerning the presence <strong>of</strong> heavy<br />
metal <strong>and</strong> other environmental contaminants within aqua<strong>feeds</strong> (<strong>and</strong> consequently<br />
the cultured aquaculture product) <strong>and</strong> possible short <strong>and</strong> long term effects on<br />
human health, including possible export/import restrictions (De Silva <strong>and</strong> Hasan,<br />
2007; Tacon, 2005b);<br />
• General lack <strong>of</strong> ready available practical in<strong>for</strong>mation concerning the dietary<br />
nutrient requirements <strong>of</strong> the major fed aquaculture species, including up-todate<br />
in<strong>for</strong>mation concerning aquaculture nutrition, feed ingredient usage, feed<br />
<strong>for</strong>mulation, feed manufacture <strong>and</strong> on-farm feed management, including the<br />
development <strong>and</strong> use <strong>of</strong> appropriate on-farm research methods;<br />
• Recognition <strong>of</strong> the increasing competition <strong>and</strong> limited availability <strong>of</strong> available<br />
l<strong>and</strong> <strong>and</strong> freshwater <strong>for</strong> inl<strong>and</strong>-based aquaculture operations (De Silva <strong>and</strong><br />
Hasan, 2007), <strong>and</strong> the need to further explore <strong>and</strong> exp<strong>and</strong> marine-based <strong>of</strong>f-shore<br />
aquaculture technologies <strong>and</strong> opportunities; <strong>and</strong><br />
• Recognition <strong>of</strong> the global importance <strong>of</strong> China in the production <strong>of</strong> farmed<br />
aquatic produce, including importation <strong>of</strong> key feed ingredients <strong>and</strong> nutrients,<br />
<strong>and</strong> possible long terms effects on global fish supplies, fish prices <strong>and</strong> the long<br />
term global sustainability <strong>of</strong> the aquaculture sector (Hishamunda <strong>and</strong> Subasinghe,<br />
2003; Tacon, 2005a).<br />
5. RECOMMENDATIONS CONCERNING FEEDS AND NUTRIENT USE<br />
On the basis <strong>of</strong> the country reviews, regional syntheses/reviews <strong>and</strong> published<br />
in<strong>for</strong>mation/literature, the following recommendations <strong>and</strong> policy guidelines<br />
concerning <strong>feeds</strong> <strong>and</strong> nutrient use can be made:<br />
• The need <strong>for</strong> governments within major aquaculture producing countries to limit<br />
the use <strong>of</strong> ‘trash fish’ or low value fish species <strong>for</strong> use as feed <strong>for</strong> the production <strong>of</strong><br />
high value fish or shellfish species, <strong>and</strong> in particular within those countries where<br />
trash fish is consumed directly by the rural poor;<br />
• The need <strong>for</strong> governments within major aquaculture producing countries to<br />
prohibit the recycling <strong>of</strong> aquaculture products within aqua<strong>feeds</strong>, <strong>and</strong> in particular<br />
the intra-species recycling <strong>of</strong> aquaculture products, <strong>for</strong> strict biosecurity concerns<br />
<strong>and</strong> potential accumulation <strong>of</strong> environmental contaminants;<br />
• The need <strong>for</strong> governments to encourage the increased use <strong>and</strong> recycling <strong>of</strong><br />
adequately processed terrestrial animal by-product meals within compound<br />
aqua<strong>feeds</strong> as a means <strong>of</strong> safely recycling animal by-products from terrestrial<br />
warm-blooded farm animals through a completely different animal food chain;<br />
• The need <strong>for</strong> governments to promote <strong>and</strong> encourage the aquaculture sector to<br />
utilize the largely untapped existing feed-grade waste streams within the fisheries<br />
sector, including fisheries bycatch <strong>and</strong> discards <strong>and</strong> fishery processing wastes<br />
(Bechtel, 2003; Li et al., 2004; Rathbone et al., 2001);<br />
• The need <strong>for</strong> governments to further encourage <strong>and</strong> promote the culture <strong>of</strong> aquatic<br />
species feeding low on the aquatic food chain, which can utilize locally available<br />
nutrient <strong>and</strong> aquatic resources, including marine <strong>and</strong> freshwater aquatic plants,<br />
filter feeding molluscs <strong>and</strong> fishes, herbivorous/omnivorous finfish <strong>and</strong> crustacean<br />
species <strong>and</strong> aquatic species tolerant <strong>of</strong> poor water quality;<br />
• The need <strong>for</strong> governments to further promote <strong>and</strong> encourage the integration<br />
<strong>of</strong> aquaculture with other agricultural farming activities such as irrigation,<br />
crop production <strong>and</strong> animal husb<strong>and</strong>ry <strong>and</strong> by so doing improve resource use
Global synthesis <strong>of</strong> <strong>feeds</strong> <strong>and</strong> nutrients <strong>for</strong> <strong>sustainable</strong> aquaculture development 15<br />
efficiency <strong>and</strong> productivity, including water <strong>and</strong> nutrient use <strong>and</strong> the development<br />
<strong>of</strong> organic aquaculture production systems (Tacon <strong>and</strong> Brister, 2002);<br />
• The need <strong>for</strong> governments to further promote <strong>and</strong> encourage the development <strong>of</strong><br />
new innovative floc-based zero water exchange culture systems to further reduce<br />
the dependence <strong>of</strong> the marine shrimp aquaculture sector upon fishmeal <strong>and</strong> fish<br />
oil as feed inputs (Tacon et al., 2002; Tacon, Nates <strong>and</strong> McNeil, 2005);<br />
• As stated in the FAO Code <strong>of</strong> Conducted <strong>for</strong> Responsible Fisheries “States should<br />
encourage the use <strong>of</strong> fish <strong>for</strong> human consumption <strong>and</strong> promote consumption <strong>of</strong><br />
fish whenever appropriate” (FAO, 1995), <strong>and</strong> discourage the use <strong>of</strong> food-fish fit<br />
<strong>for</strong> human consumption <strong>for</strong> animal feeding; <strong>and</strong><br />
• In line with the Rome Declaration on World Food Security <strong>and</strong> the World Food<br />
Summit Plan <strong>of</strong> Action, that aquaculture activity do no harm to the existing food<br />
supplies <strong>of</strong> the poor, but rather help by providing much needed af<strong>for</strong>dable aquatic<br />
food produce <strong>and</strong> employment opportunities within both inl<strong>and</strong> <strong>and</strong> coastal rural<br />
communities (Tacon, 2001).<br />
REFERENCES<br />
Barlow, S., 2003. World market overview <strong>of</strong> fishmeal <strong>and</strong> fish oil, pp. 11-25. In: Bechtel, P.J.<br />
(editor), Advances in seafood by-products: 2002 conference proceedings. Alaska Sea Grant<br />
College Program, University <strong>of</strong> Alaska Fairbanks, Fairbanks, 566 pp.<br />
Bechtel, P.J. 2003. (ed.), Advances in seafood by-products: 2002 conference proceedings.<br />
Alaska Sea Grant College Program, University <strong>of</strong> Alaska Fairbanks, Fairbanks, 566 pp.<br />
D’Abramo, L.R., Mai, K. & Deng, D.-F. 2002. Aquaculture <strong>feeds</strong> <strong>and</strong> production in the<br />
People’s Republic <strong>of</strong> China – progress <strong>and</strong> concerns. World Aquaculture, 33: 25-27.<br />
De Silva, S.S. <strong>and</strong> Hasan, M.R. 2007. Feeds <strong>and</strong> <strong>fertilizers</strong>: the key to long term<br />
sustainability <strong>of</strong> Asian aquaculture (this volume).<br />
Edwards, P., Tuan L.A. & Allan, G.L. 2004. A survey <strong>of</strong> marine trash fish <strong>and</strong> fishmeal as<br />
aquaculture feed ingredients in Vietnam. Australian Centre <strong>for</strong> International Agricultural<br />
Research. ACIAR Working Paper 57, Elect Printing, Canberra, 56 pp.<br />
FAO. 1995. Code <strong>of</strong> conduct <strong>for</strong> responsible fisheries. Rome, FAO. 41 pp.<br />
FAO. 2001. Good aquaculture feed manufacturing practice. FAO Technical Guidelines <strong>for</strong><br />
Responsible Fisheries. No.5.1. Rome, FAO. 2001. 50 pp.<br />
FAO. 2004. Press Release. Overfishing on the increase in Asia-Pacific seas: decline in<br />
valuable fish species, better management required – FAO Report RAP 04/30 (http://<br />
www.fao.or.th/Press_Releases/Rap04-30.htm)<br />
FAO. 2005. FAO Fisheries Department, Fishery In<strong>for</strong>mation, Data <strong>and</strong> Statistics Unit.<br />
Fishstat Plus: Universal s<strong>of</strong>tware <strong>for</strong> fishery statistical time series. Aquaculture production:<br />
quantities 1950-2003, Aquaculture production: values 1984-2003; Capture production:<br />
1950-2003; Commodities production <strong>and</strong> trade: 1950-2003; Total production: 1970-2003,<br />
Vers. 2.30<br />
FAO. 2007. FAO Fisheries Department, Fishery In<strong>for</strong>mation, Data <strong>and</strong> Statistics Unit.<br />
Fishstat Plus: Universal s<strong>of</strong>tware <strong>for</strong> fishery statistical time series. Aquaculture production:<br />
quantities 1950-2005, Aquaculture production: values 1984-2005; Capture production:<br />
1950-2005; Commodities production <strong>and</strong> trade: 1950-2005; Total production: 1970-2005,<br />
Vers. 2.30<br />
FIN (Fishmeal In<strong>for</strong>mation Network). 2004. Fishmeal facts <strong>and</strong> figures – November 2004<br />
update (http://www.gafta.com/fin/finfacts.html)<br />
Flores-Nava, A. 2007. Analysis <strong>of</strong> <strong>feeds</strong> <strong>and</strong> <strong>fertilizers</strong> <strong>for</strong> <strong>sustainable</strong> aquaculture<br />
development in Latin America (this volume).<br />
Gill, C. 2007. World feed panorama: bigger cities, more feed. Feed International, 28(1):5-9.<br />
Hardy, R.W. 2003. Marine byproducts <strong>for</strong> aquaculture, pp. 141–152. In P.J. Bechtel, (ed.)<br />
Advances in seafood byproducts: 2002 conference proceedings. Fairbanks, Alaska Sea<br />
Grant College Program, University <strong>of</strong> Alaska Fairbanks, 566 pp.
16<br />
<strong>Study</strong> <strong>and</strong> <strong>analysis</strong> <strong>of</strong> <strong>feeds</strong> <strong>and</strong> <strong>fertilizers</strong> <strong>for</strong> <strong>sustainable</strong> aquaculture development<br />
Hardy, R.W. & Tacon, A.G.J. 2002. Fishmeal: historical uses, production trends <strong>and</strong> future<br />
outlook <strong>for</strong> supplies, pp.311-325. In: Stickney, R.R. & MacVey, J.P. (eds.), Responsible<br />
Marine Aquaculture. CABI Publishing, New York, 391 pp.<br />
Hardy, R.W., Higgs, D.A., Lall, S.P. & Tacon, A.G.J. 2001. Alternative dietary protein <strong>and</strong><br />
lipid sources <strong>for</strong> <strong>sustainable</strong> production <strong>of</strong> salmonids. Fisken og Havet, No. 8, 53 pp. (also<br />
available at http://www.imr.no/english/products/imr_publications/fisken_og_havet)<br />
Hecht, T. 2007. A review <strong>of</strong> <strong>feeds</strong> <strong>and</strong> <strong>fertilizers</strong> <strong>for</strong> <strong>sustainable</strong> aquaculture development<br />
in sub-Saharan Africa (this volume).<br />
Huntington, T.C. 2004. Feeding the fish: <strong>sustainable</strong> fish feed <strong>and</strong> Scottish aquaculture.<br />
Report to the Joint Marine Programme (Scottish Wildlife Trust <strong>and</strong> WWF Scotl<strong>and</strong>) <strong>and</strong><br />
RSPB Scotl<strong>and</strong>. Poseidon Aquatic Resource Management Ltd, Lymington, Hampshire,<br />
UK. August 2004.(http://www.wwf.org.uk/filelibrary/pdf/feedingthefish.pdf).<br />
Huntington, T., Frid, C., Banks, R.,Scott, C. & Paramor, O. 2004. Assessment <strong>of</strong> the<br />
sustainability <strong>of</strong> industrial fisheries producing fishmeal <strong>and</strong> fish oil. Report to the Royal<br />
Society <strong>for</strong> the Protection <strong>of</strong> Birds (RSPB). Poseidon Aquatic Resource Management<br />
Ltd, Lymington, Hampshire, UK. June 2004. (http://www.rspb.org.uk/Images/fishmeal_<br />
tcm5-58613.pdf).<br />
Hishamunda, N. & Subasinghe, R. 2003. Aquaculture development in China. The role <strong>of</strong><br />
public sector policies. FAO Fisheries Technical Paper No. 427, FAO, Rome, Italy. 66 pp.<br />
Hong, W. & Zhang, Q. 2001. The status <strong>of</strong> marine fish culture in China. World Aquaculture,<br />
32:18-67.<br />
Li, P., Wang, X., Hardy, R.W. & Gatlin III, D.M. 2004. Nutritional value <strong>of</strong> fisheries bycatch<br />
<strong>and</strong> by-product meal in the diet <strong>of</strong> red drum (Sciaenops ocellatus). Aquaculture,<br />
236: 485-496.<br />
Normile, D. 2002. Poor to feel pinch <strong>of</strong> rising prices. Science, 298: 5596.<br />
New, M.B. & Wijkström, U.N. 2002. Use <strong>of</strong> fishmeal <strong>and</strong> fish oil in aqua<strong>feeds</strong>: further<br />
thoughts on the fishmeal trap. FAO Fisheries Circular No. 975. Rome. 61 pp.<br />
Ottolenghi, F., Silvestri, C., Giordano, P., Lovatelli, A., & New, M.B. 2004. Capturebased<br />
aquaculture. The fattening <strong>of</strong> eels, groupers, tunas <strong>and</strong> yellowtails. Rome, FAO.<br />
2004. 308 pp.<br />
Pike, I.H. 1998. Future supplies <strong>of</strong> fishmeal <strong>and</strong> fish oil: quality requirements <strong>for</strong><br />
aquaculture. pp. 39–49. In International aquafeed directory <strong>and</strong> buyers guide 1998.<br />
Middelsex, Uxbridge, Turret Rai Plc.<br />
Pike, I. H. 2005. Eco-efficiency in aquaculture: global catch <strong>of</strong> wild fish used in aquaculture.<br />
International Aquafeed, 8(1): 38-40.<br />
Pike, I.H. & Barlow, S.M. 2003. Impact <strong>of</strong> fish farming on fish stocks. pp. 24–29. In<br />
International aquafeed –directory <strong>and</strong> buyers’ guide 2003. Luton, UK, Turret West Ltd,<br />
Bartham Press.<br />
Rathbone, C.K., Babbitt, J.K., Dong, F.M. & Hardy, R.W. 2001. Per<strong>for</strong>mance <strong>of</strong> juvenile<br />
Coho Salmon Oncorhynchus kisutch fed diets containing meals from fish wastes,<br />
deboned fish wastes, or skin-<strong>and</strong>-bone by-product as the protein ingredient. Journal <strong>of</strong><br />
the World Aquaculture Society, 32: 21-29.<br />
SEAFEEDS (Sustainable Environmental Aquaculture Feeds). 2003. Final report <strong>of</strong> the<br />
Sea<strong>feeds</strong> Workshop organized <strong>and</strong> chaired by Nautilus Consultants in association with<br />
the Stirling University Institute <strong>of</strong> Aquaculture, Stirling 8th – 9th April 2003. (http://<br />
www.nautilus-consultants.co.uk/sea<strong>feeds</strong>/Files/Final%20Report.pdf).<br />
Tacon, A.G.J. 2001. Increasing the contribution <strong>of</strong> aquaculture <strong>for</strong> food security <strong>and</strong><br />
poverty alleviation, pp.67-77. In: R.P. Subasinghe, P. Bueno, M.J. Phillips, C. Hough &<br />
S.E. McGladdery (Eds.) Aquaculture in the Third Millennium. Technical Proceedings<br />
<strong>of</strong> the Conference on Aquaculture in the Third Millennium, Bangkok, Thail<strong>and</strong>, 20-25<br />
February 2000.<br />
Tacon, A.G.J. 2004a. Estimated major finfish <strong>and</strong> crustacean aquafeed markets: 2000 to<br />
2003. International Aquafeed, 7(5): 37-41.
Global synthesis <strong>of</strong> <strong>feeds</strong> <strong>and</strong> nutrients <strong>for</strong> <strong>sustainable</strong> aquaculture development 17<br />
Tacon, A.G.J. 2004b. Use <strong>of</strong> fishmeal <strong>and</strong> fish oil in aquaculture: a global perspective.<br />
Aquatic Resources, Culture & Development, 1: 3-14.<br />
Tacon, A.G.J. 2004c. The recycling <strong>of</strong> nutrients within food wastes within aquatic<br />
food production systems: aquaculture – the aquatic blue revolution phenomenon. In:<br />
Waldron, K.W., Faulds, C.B. & Smith, A.C. (Eds.), Total Food 2004: Exploiting Coproducts,<br />
Minimising Waste. Institute <strong>of</strong> Food Research, Norwich, Engl<strong>and</strong> (In press).<br />
Tacon, A.G.J. 2005a. Aquaculture country statistical pr<strong>of</strong>ile: China – an awakening <strong>and</strong><br />
hungry giant. International Aquafeed, 8(2): 34-35.<br />
Tacon, A.G.J. 2005b. Salmon aquaculture dialogue: status <strong>of</strong> in<strong>for</strong>mation on salmon<br />
aquaculture feed <strong>and</strong> the environment. International Aquafeed, 8(4): 22-37.<br />
Tacon, A.G.J. 2007. Global aquaculture production highlights <strong>and</strong> estimated compound<br />
aquafeed use in 2005. International Aquafeed, 10(2):40-44.<br />
Tacon, A.G.J. & De Silva,S.S. 1997. Feed preparation <strong>and</strong> feed management strategies<br />
within semi-intensive fish farming systems in the tropics. Aquaculture, 151: 379-404.<br />
Tacon, A.G.J. & Brister, D.J. 2002. Organic aquaculture: current status <strong>and</strong> future<br />
prospects, pp. 163-176. In: Nadia El-Hage Scialabba & Caroline Hattam (Eds.), Organic<br />
agriculture, environment <strong>and</strong> food security. Environment <strong>and</strong> Natural Resources Service,<br />
Sustainable Development Department. Rome, FAO, 252 pp.<br />
Tacon, A.G.J., Cody, J.J., Conquest, L.D., Divakaran, S., Forster, I.P. & Decamp, O.E.<br />
2002. Effect <strong>of</strong> culture system on the nutrition <strong>and</strong> growth per<strong>for</strong>mance <strong>of</strong> Pacific white<br />
shrimp Litopenaeus vannamei (Boone) fed different diets. Aquaculture Nutrition, 8:<br />
121-139.<br />
Tacon, A.G.J., Nates, S.F. & McNeil, R.J. 2005. Overview <strong>of</strong> farming systems <strong>for</strong> marine<br />
shrimp with particular reference to <strong>feeds</strong> <strong>and</strong> feeding. In: Shrimp Culture: Economics,<br />
Market <strong>and</strong> Trade. Blackwell Publishing (In Press).<br />
Tacon, A.G.J., Hasan, M.R. & Subasinghe, R.P. 2006. Use <strong>of</strong> fishery resources as feed<br />
inputs <strong>for</strong> aquaculture development: trends <strong>and</strong> policy implications. FAO Fisheries<br />
Circular No. 1018, Rome, FAO, 99 pp.<br />
Tuan, F.C., Fang, C. & Cao, Z. 2004. China’s soybean imports expected to grow despite<br />
short-term disruptions. Economic Research Service, USDA, Outlook Report No.<br />
OCS04J01, Oct 2004, 14 pp.<br />
Wray, T. 2001. Making the most <strong>of</strong> jack mackerel. Seafood International, July 2001,<br />
pp.39-43.<br />
Zaldivar, M.J. 2004. Review <strong>of</strong> the commercial situation <strong>of</strong> fishmeal <strong>and</strong> fish oil <strong>and</strong> the<br />
new requirements imposed on them. Paper presented at Tecnica Aqua Sur 2004 (Chile),<br />
March 2004 (http://www.iffo.org.uk/tech/TecnAqua.htm).
Feeds <strong>and</strong> <strong>fertilizers</strong>: the key to<br />
long-term sustainability <strong>of</strong> Asian<br />
aquaculture<br />
Sena S. De Silva 1<br />
School <strong>of</strong> Life <strong>and</strong> Environmental Sciences, Deakin University<br />
PO Box 423, Warrnambool, Victoria 3280<br />
Australia<br />
Mohammad R. Hasan<br />
Aquaculture Management <strong>and</strong> Conservation Service<br />
FAO Fisheries <strong>and</strong> Aquaculture Department, Rome 00153<br />
Italy<br />
Summary 20<br />
1. Introduction 21<br />
2. Feeds <strong>and</strong> feeding practices in Asian aquaculture 28<br />
3. Fertilizer usage in Asian aquaculture 29<br />
4. Aqua<strong>feeds</strong> 31<br />
5. Major trends in relation to aqua<strong>feeds</strong> in Asian aquaculture 42<br />
6. Asian aqua<strong>feeds</strong> in a global context: issues <strong>and</strong> challenges 42<br />
7. Policy developments 43<br />
8. Future needs 43<br />
9. Conclusions 44<br />
Acknowledgements 45<br />
References 45<br />
De Silva, S.S. <strong>and</strong> Hasan, M.R. 2007. Feeds <strong>and</strong> <strong>fertilizers</strong>: the key to long-term<br />
sustainability <strong>of</strong> Asian aquaculture. In M.R. Hasan, T. Hecht, S.S. De Silva <strong>and</strong> A.G.J.<br />
Tacon (eds). <strong>Study</strong> <strong>and</strong> <strong>analysis</strong> <strong>of</strong> <strong>feeds</strong> <strong>and</strong> <strong>fertilizers</strong> <strong>for</strong> <strong>sustainable</strong> aquaculture<br />
development. FAO Fisheries Technical Paper. No. 497. Rome, FAO. pp. 19–47.<br />
1 Network <strong>of</strong> Aquaculture Centres in Asia-Pacific, Bangkok, PO Box 1040, Kasetsart Post Office,<br />
Bangkok, 10903, Thail<strong>and</strong>.<br />
19
20<br />
<strong>Study</strong> <strong>and</strong> <strong>analysis</strong> <strong>of</strong> <strong>feeds</strong> <strong>and</strong> <strong>fertilizers</strong> <strong>for</strong> <strong>sustainable</strong> aquaculture development<br />
SUMMARY<br />
Asian aquaculture is dominated by inl<strong>and</strong>, semi-intensive finfish culture <strong>and</strong> production<br />
has been increasing over the years. However, the rate <strong>of</strong> increase is decreasing, except<br />
in Viet Nam, <strong>and</strong> overall production is likely to stabilize around year 2015. The major<br />
factors that will sustain aquaculture production in Asia are <strong>feeds</strong> <strong>and</strong> feed management.<br />
Asian aquaculture is still largely a rural <strong>and</strong> semi-intensive activity, baring exceptions<br />
such as shrimp culture, <strong>and</strong> consequently the sector to a large extent is dependent on<br />
farm-made <strong>feeds</strong>. However, the use <strong>of</strong> commercial <strong>feeds</strong> in Asia is also increasing. There<br />
have been substantive improvements in farm-made feed <strong>for</strong>mulation <strong>and</strong> manufacturing.<br />
Throughout the region there is an increase in the number <strong>of</strong> small-scale processors who<br />
make customised <strong>feeds</strong>, according to required specifications <strong>and</strong> this has lead to greater<br />
feed efficacy, reduction in feed costs <strong>and</strong> improved feed quality. There is an urgent need<br />
to investigate ways <strong>and</strong> means to further improve farm-made <strong>feeds</strong> through suitable<br />
research <strong>and</strong> development programmes in collaboration with farmers <strong>and</strong> small scale<br />
processors <strong>and</strong> to develop appropriate policies to encourage growth in this sector. The<br />
first step towards achieving these goals will be to assess the types <strong>of</strong> feed produced<br />
by small-scale producers <strong>and</strong> the magnitude <strong>of</strong> the sector <strong>and</strong> to evaluate the current<br />
efficacies <strong>of</strong> non-commercial <strong>feeds</strong>.<br />
Asian finfish mariculture is almost totally dependent on the use <strong>of</strong> trash fish, a<br />
resource that is declining <strong>and</strong> a practice that results in much environmental degradation.<br />
As such there is an urgent need to encourage farmers to change to farm-made <strong>and</strong> or<br />
commercial <strong>feeds</strong>. If this is not accomplished the sector is unlikely to be <strong>sustainable</strong>.<br />
Asia is a net importer <strong>and</strong> the biggest user <strong>of</strong> fishmeal <strong>and</strong> fish oil. It is there<strong>for</strong>e not<br />
immune to global issues in respect <strong>of</strong> fishmeal <strong>and</strong> fish oil usage in aqua<strong>feeds</strong>. Overall,<br />
the use <strong>of</strong> animal by-products <strong>and</strong> fishing industry wastes <strong>for</strong> aqua<strong>feeds</strong> is restricted.<br />
There is a need to encourage the use <strong>of</strong> such ingredients in aqua<strong>feeds</strong>. Although many<br />
studies have been undertaken on fishmeal replacement the results are rarely translated<br />
into practices, <strong>and</strong> as such there is a need to bring about an effective dialogue between<br />
research <strong>and</strong> development <strong>and</strong> the feed industry. Throughout the region there are<br />
growing concerns with regard to feed quality <strong>and</strong> consequently suitable guidelines <strong>and</strong><br />
certification processes have to be introduced.
Feeds <strong>and</strong> <strong>fertilizers</strong>: the key to long-term sustainability <strong>of</strong> Asian aquaculture 21<br />
1. INTRODUCTION<br />
Over the last three decades food fish production has become the domain <strong>of</strong> the<br />
developing world, in particular Asia (Delgado et al., 2003). In 2004, world aquaculture<br />
contributed nearly 33 percent to the global food fish supply, amounting to 54.8 million<br />
tonnes <strong>and</strong> valued at US$67.3 billion. To this, Asia contributed 91.2 percent (49.98<br />
million tonnes), valued at US$55.1 billion (FAO, 2006). Asia has an estimated human<br />
population <strong>of</strong> 3.68 billion that is expected to increase to 4.78 billion by 2025 (http://<br />
esa.un.org/unpp/). Most <strong>of</strong> the worlds major fish stocks are over fished <strong>and</strong> catches in<br />
many <strong>of</strong> the major fisheries are either static or are declining. Aquaculture is the only<br />
option to increase fish production <strong>and</strong> to narrow the gap between supply <strong>and</strong> dem<strong>and</strong>.<br />
Because <strong>of</strong> its rapid growth in the last three decades the aquaculture sector now faces<br />
new <strong>and</strong> dem<strong>and</strong>ing environmental, social, resource allocation <strong>and</strong> technological<br />
challenges. These must now be addressed <strong>and</strong> overcome to maintain the momentum<br />
in the sector.<br />
This paper considers the current use <strong>of</strong> <strong>feeds</strong> <strong>and</strong> other nutrients in Asian aquaculture<br />
as key components <strong>for</strong> the <strong>sustainable</strong> development <strong>of</strong> the sector in the next two to<br />
three decades. This synthesis is mostly based on comparable analyses undertaken <strong>for</strong><br />
Bangladesh, China, India, Indonesia, the Philippines, Thail<strong>and</strong> <strong>and</strong> Viet Nam, which<br />
are the major contributors to aquaculture production in the region, a review <strong>of</strong> the<br />
relevant literature <strong>and</strong> FAO (2006) production statistics.<br />
Recent trends in aquaculture in the region are briefly summarized to place the<br />
significance <strong>of</strong> <strong>feeds</strong> <strong>and</strong> feeding into perspective within the context <strong>of</strong> Asian aquaculture.<br />
This provides the background <strong>for</strong> the <strong>analysis</strong> <strong>and</strong> is used to assess possible future trends<br />
that might impact on the <strong>sustainable</strong> development <strong>of</strong> the sector as a whole.<br />
1.1 Brief review <strong>of</strong> the Asian aquaculture sector<br />
The trends <strong>and</strong> most <strong>of</strong> the key aspects <strong>of</strong> global <strong>and</strong> Asian aquaculture up to the<br />
year 2000 are summarized in NACA/FAO (2001). Table 1 summarizes the trends <strong>and</strong><br />
developments in freshwater, brackish-water <strong>and</strong> marine aquaculture <strong>for</strong> the 15 year<br />
period from 1995 to 2004. From these data it is evident that aquaculture production<br />
by volume <strong>and</strong> value has increased substantially in all <strong>of</strong> the major producer countries.<br />
Over the 15 year period the seven countries, which <strong>for</strong>m the basis <strong>of</strong> this review,<br />
contributed over 85 percent to the total Asian aquaculture production <strong>and</strong> over<br />
70 percent globally. However, the contribution by value <strong>of</strong> marine aquaculture has<br />
remained below 50 percent <strong>of</strong> the global total <strong>and</strong> there is no discernable up or<br />
downward trend in this regard (Table 1). The data also clearly show the dominance <strong>of</strong><br />
China in aquaculture production in all three environments.<br />
Aquaculture in the seven countries was dominated by finfish production (Table 2).<br />
The seven countries contributed in excess <strong>of</strong> 90 percent to Asian <strong>and</strong> 80 percent to<br />
global fish production, although the bulk <strong>of</strong> finfish produced are relatively low value<br />
species. These trends are further summarized in Figures 1 to 4, using five year averages<br />
<strong>for</strong> the period 1980 to 2004. The trends can be summarized as follows:<br />
• aquaculture production, by volume <strong>and</strong> value, has increased significantly in all <strong>of</strong><br />
the countries under consideration;<br />
• the main contributor has been China;<br />
• marine <strong>and</strong> freshwater aquaculture have contributed almost equally to the total<br />
production (including seaweeds <strong>and</strong> molluscs);<br />
• in terms <strong>of</strong> finfish <strong>and</strong> crustaceans, fresh <strong>and</strong> brackish-water aquaculture<br />
production is considerably higher than the output from mariculture; <strong>and</strong><br />
• apart from Viet Nam, there has been a significant decrease in the rate <strong>of</strong> growth in<br />
production in Asia <strong>and</strong> globally.<br />
In a nutshell, aquaculture production is still increasing in most countries in Asia<br />
<strong>and</strong> globally. However, the rate <strong>of</strong> increase is declining <strong>and</strong> is likely to reach a plateau
22<br />
3 000<br />
2 000<br />
1 000<br />
0<br />
<strong>Study</strong> <strong>and</strong> <strong>analysis</strong> <strong>of</strong> <strong>feeds</strong> <strong>and</strong> <strong>fertilizers</strong> <strong>for</strong> <strong>sustainable</strong> aquaculture development<br />
within the next two decades. As such, it is imperative that measures are taken to curtail<br />
the decline in the growth rate <strong>of</strong> the sector.<br />
Aquaculture Production per year<br />
(thous<strong>and</strong> tonnes)<br />
Average value per year<br />
(million US$)<br />
FIGURE 1<br />
Annual mean aquaculture production by volume (a) <strong>and</strong> value (b) in the seven<br />
target countries, Asia <strong>and</strong> the world <strong>for</strong> the period 1980–2004. The mean is<br />
based on five-year averages, except <strong>for</strong> the period 2000–2004<br />
70 000<br />
60 000<br />
50 000<br />
40 000<br />
30 000<br />
20 000<br />
10 000<br />
0<br />
Source: FAO (2006)<br />
Bangladesh India Indonesia<br />
Philippines Thail<strong>and</strong> Vietnam<br />
China Asia World<br />
80-85 86-90 91-95 96-00 01-03<br />
Year<br />
Bangladesh China India<br />
Indonesia Philippines Thail<strong>and</strong><br />
Vietnam Asia World<br />
84-85 86-90 91-95 96-00 01-03<br />
Year<br />
a<br />
b<br />
60 000<br />
50 000<br />
40 000<br />
30 000<br />
20 000<br />
10 000<br />
0
Feeds <strong>and</strong> <strong>fertilizers</strong>: the key to long-term sustainability <strong>of</strong> Asian aquaculture 23<br />
TABLE 1<br />
Freshwater, brackish-water <strong>and</strong> marine aquaculture production by volume <strong>and</strong> value (excluding aquatic plants) in Bangladesh, China, India, Indonesia, the Philippines,<br />
Thail<strong>and</strong> <strong>and</strong> Viet Nam, <strong>for</strong> 1995, 2000 <strong>and</strong> 2004<br />
Bangladesh China India Indonesia Philippines Thail<strong>and</strong> Viet Nam Asia %Asia World %World<br />
Production (tonnes)<br />
1995<br />
Brackish 45 735 78 416 70 000 361 247 237 091 265 889 71 816 1 226 824 92.1 1 556 967 72.6<br />
Freshwater 271 338 9 407 600 1 588 799 279 845 97 664 200 782 295 933 12 633 079 96.1 13 529 722 89.7<br />
Marine 0 6 369 637 8 0 26 829 92 833 13 320 7 817 311 83.2 9 295 327 70.0<br />
Total 317 073 15 855 653 1 658 807 641 092 361 584 559 504 381 069 21 677 214 91.2 2 438 2016 81.1<br />
2000<br />
Brackish 86 944 217 994 96 715 422 802 241 455 319 171 93 502 1 584 101 93.3 2 134 481 69.3<br />
Freshwater 570 176 15 169 365 1 844 236 363 111 112 033 271 012 365 015 19 268 522 97.0 20 420 935 91.6<br />
Marine 0 9 193 312 1253 2587 40 375 147 972 40 000 10 627 795 88.7 12 918 891 73.0<br />
Total 657 120 24 580 671 1 942 204 788 500 393 863 738 155 498 517 31 480 418 94.0 35 474 307 83.4<br />
2004<br />
Brackish 97 537 789 435 120 367 547 008 262 555 406 988 339 555 2 714 471 94.4 3 369 563 76.1<br />
Freshwater 817 215 18 514 778 2 351 968 488 079 180 875 365 478 703 827 24 426 877 95.9 25 751 633 90.9<br />
Marine 0 11 310 785 0 22 955 68 790 400 400 155 235 13 333 283 89.7 16 360 181 73.1<br />
Total 914 752 30 614 998 2 472 335 1 058 042 512 220 1 172 866 1 198 617 40 474 631 93.8 45 481 377 83.4<br />
Value (US$ thous<strong>and</strong>)<br />
1995<br />
Brackish 204 784 588 120 485 034 1 265 468 1 084 858 1 619 858 397 517 6 174 534 91.4 7 471 128 75.6<br />
Freshwater 410 477 8 993 265 1 461 414 684 320 163 399 217 869 488 290 15 451 048 80.4 17 756 250 70.0<br />
Marine 0 6 122 494 11 0 5 558 34 591 14 652 10 317 059 59.9 13 947 110 44.3<br />
Total 615 261 15 703 878 1 946 459 1 949 787 1 253 815 1 872 318 900 458 31 942 641 75.9 39 174 488 61.9<br />
2000<br />
Brackish 239 218 1 307 964 806 473 1 381 333 541 101 2 226 488 440 297 7 428 577 93.5 9 165 349 75.8<br />
Freshwater 799 884 14 941 990 1 704 376 854 825 121 295 246 009 511 021 21 594 939 88.8 24 410 584 78.6<br />
Marine 0 8 067 186 331 9 537 18 332 41 349 40 000 11 825 944 69.1 17 502 750 46.7<br />
Total 1 039 102 24 317 140 2 511 179 2 245 695 680 728 2 513 846 991 318 40 849 460 84.0 51 078 683 67.2<br />
2004<br />
Brackish 244 789 2 683 980 718 936 1 434 487 493 448 1 175 581 1 232 614 8 585 414 93.0 10 307 611 77.7<br />
Freshwater 1 118 391 19 870 645 2 217 543 504 489 161 736 349 589 1 05 5741 28 452 981 88.8 31 755 255 79.6<br />
Marine 0 8 314 984 0 191 028 45 670 61 456 155 235 12 990 642 67.5 21430 417 40.9<br />
Total 1 363 180 30 869 609 2 936 479 2 130 004 700 854 1 586 626 2 443 589 50 029 036 84.0 6 3493 284 66.2<br />
Source: FAO (2006)
24<br />
TABLE 2<br />
Aquaculture production by volume <strong>and</strong> value <strong>of</strong> finfish, crustaceans <strong>and</strong> molluscs in Bangladesh, China, India, Indonesia, the Philippines, Thail<strong>and</strong>, <strong>and</strong> Viet Nam, <strong>for</strong> 1995,<br />
2000 <strong>and</strong> 2004, in Asia <strong>and</strong> globally<br />
Bangladesh China India Indonesia Philippines Thail<strong>and</strong> Viet Nam Asia %Asia World %World<br />
Production (tonnes)<br />
1995<br />
Finfish 283 043 9 493 597 1 588 799 492 578 241 703 197 904 295 933 13 420 931 93.8 14 994 370 84.0<br />
Crustaceans 34 030 181 880 70 000 148 514 93 275 268 550 71 816 906 026 95.8 1 101 693 78.7<br />
Molluscs 0 6 162 731 8 0 26 606 92 833 13 320 7 295 062 86.3 8 230 344 76.5<br />
Total 317 073 15 838 208 1 658 807 641 092 361 584 559 287 381 069 21 622 019 91.4 24 326 407 81.2<br />
2000<br />
<strong>Study</strong> <strong>and</strong> <strong>analysis</strong> <strong>of</strong> <strong>feeds</strong> <strong>and</strong> <strong>fertilizers</strong> <strong>for</strong> <strong>sustainable</strong> aquaculture development<br />
Finfish 592 473 15 074 183 1 827 636 641 677 315 865 268 995 365 015 20 013 066 95.4 22 745 339 83.9<br />
Crustaceans 64 647 807 095 113 315 146 823 46 819 319 788 93 502 16 44 365 96.8 1 820 196 87.5<br />
Molluscs 0 8 607 050 1 253 0 31 179 147 972 40 000 9 686 477 91.1 10 771 451 82.0<br />
Total 657 120 24 488 328 1 942 204 788 500 393 863 736 755 498 517 31 343 908 94.1 35 336 986 83.5<br />
2004<br />
Finfish 839 585 17 834 881 2 300 350 803 135 437 051 349 356 761 566 24 757 653 94.2 28 165 039 82.8<br />
Crustaceans 75 167 1 995 164 171 985 241 874 44 216 418 510 281 816 3 338 706 96.7 3 679 753 87.7<br />
Molluscs 0 10 438 313 0 12 991 30 953 400 400 155 235 11 998 256 92.0 13 255 852 83.3<br />
Total 914 752 30 268 358 2 472 335 1 058 000 512 220 1 168 266 1 198 617 40 094 615 93.8 45 100 644 83.4<br />
Value (US$ thous<strong>and</strong>)<br />
1995<br />
Finfish 410 810 8 781 638 1 461 414 1 084 314 469 697 207 479 488 290 18 681 500 69.1 23 686 176 54.5<br />
Crustaceans 204 451 1 122 471 485 034 865 473 779 135 1 628 238 397 517 5 894 083 93.0 6 976 619 78.6<br />
Molluscs 0 5 721 267 11 0 4 983 34 591 14 652 7 191 233 80.3 8 332 397 69.3<br />
Total 615 261 15 625 376 1 946 459 1 949 787 1 253 815 1 870 308 900 458 31 766 816 76.1 38 995 192 61.9<br />
2000<br />
Finfish 788 363 13 161 581 1 649 596 1 383 896 382 538 234 280 511 021 23 119 776 78.3 31 048 878 58.3<br />
Crustaceans 250 739 3 640 098 861 253 861 799 293 363 2 231 269 440 297 8 990 595 95.4 10 088 486 85.0<br />
Molluscs 0 7 173 792 331 0 4 827 41 349 40 000 8 318 827 87.3 9 515 080 76.3<br />
Total 1 039 102 23 975 471 2 511 179 2 245 695 680 728 2 506 898 991 318 40 429 197 84.0 50 652 444 67.0<br />
2004<br />
Finfish 1 038 702 15 937 967 1 950 815 939 396 434 691 311 556 1 142 349 27 888 121 78.0 37 920 700 57.4<br />
Crustaceans 324 478 7 201 207 985 663 1 053 692 262 596 1 199 547 1 146 005 12 849 252 94.7 14 360 890 84.8<br />
Molluscs 0 6 557 577 0 136 764 3 567 61 456 155 235 8 055 705 85.8 99 71 105 69.4<br />
Total 1 363 180 29 696 751 2 936 479 2 129 852 700 854 1 572 559 2 443 589 48 793 079 83.7 62 252 695 65.5<br />
Source: FAO (2006)
Feeds <strong>and</strong> <strong>fertilizers</strong>: the key to long-term sustainability <strong>of</strong> Asian aquaculture 25<br />
n<br />
o<br />
i<br />
t<br />
c<br />
u<br />
d<br />
o<br />
r<br />
p<br />
e<br />
r<br />
u<br />
t<br />
l<br />
u<br />
c<br />
a<br />
u<br />
q<br />
a<br />
n<br />
a<br />
e<br />
M<br />
e<br />
u<br />
l<br />
a<br />
v<br />
n<br />
a<br />
e<br />
M<br />
)<br />
s<br />
e<br />
n<br />
n<br />
o<br />
t<br />
d<br />
n<br />
a<br />
s<br />
u<br />
o<br />
h<br />
t<br />
(<br />
r<br />
a<br />
e<br />
y<br />
r<br />
e<br />
p<br />
)<br />
$<br />
S<br />
U<br />
n<br />
o<br />
i<br />
l<br />
l<br />
i<br />
m<br />
(<br />
r<br />
a<br />
e<br />
y<br />
r<br />
e<br />
p<br />
FIGURE 2<br />
Mean aquaculture production by volume (a) <strong>and</strong> value (b) by species groups<br />
<strong>for</strong> the period 1980–2004 in Asian countries<br />
30000<br />
25 000<br />
20 000<br />
15 000<br />
10 000<br />
5 000<br />
0<br />
45 000<br />
40 000<br />
35 000<br />
30 000<br />
25 000<br />
20 000<br />
15 000<br />
10 000<br />
5 000<br />
0<br />
h<br />
s<br />
e<br />
d<br />
a<br />
l<br />
g<br />
n<br />
a<br />
B<br />
h<br />
s<br />
e<br />
d<br />
a<br />
l<br />
g<br />
n<br />
a<br />
B<br />
a<br />
n<br />
i<br />
h<br />
C<br />
a<br />
n<br />
i<br />
h<br />
C<br />
Source: FAO (2006)<br />
a<br />
i<br />
d<br />
n<br />
I<br />
a<br />
i<br />
d<br />
n<br />
I<br />
a<br />
i<br />
s<br />
e<br />
n<br />
o<br />
d<br />
n<br />
I<br />
a<br />
i<br />
s<br />
e<br />
n<br />
o<br />
d<br />
n<br />
I<br />
s<br />
e<br />
n<br />
i<br />
p<br />
p<br />
i<br />
l<br />
i<br />
h<br />
P<br />
d<br />
n<br />
a<br />
l<br />
i<br />
a<br />
h<br />
T<br />
Freshwater fish Crustaceans Marine fish<br />
V i e t n a m<br />
A s i a<br />
W o r l d<br />
h<br />
s<br />
e<br />
d<br />
a<br />
l<br />
g<br />
n<br />
a<br />
B<br />
a<br />
n<br />
i<br />
h<br />
C<br />
a<br />
i<br />
d<br />
n<br />
I<br />
a<br />
i<br />
s<br />
e<br />
n<br />
o<br />
d<br />
n<br />
I<br />
s<br />
e<br />
n<br />
i<br />
p<br />
p<br />
i<br />
l<br />
i<br />
h<br />
P<br />
d<br />
n<br />
a<br />
l<br />
i<br />
a<br />
h<br />
T<br />
V i e t n a m<br />
A s i a<br />
W o r l d<br />
80-85 86-90 91-95 96-00 01-03<br />
s<br />
e<br />
n<br />
i<br />
p<br />
p<br />
i<br />
l<br />
i<br />
h<br />
P<br />
Freshwater fish Crustaceans Marine fish<br />
d<br />
n<br />
a<br />
l<br />
i<br />
a<br />
h<br />
T<br />
Vietnam Asia<br />
World h<br />
s<br />
e<br />
d<br />
a<br />
l<br />
g<br />
n<br />
a<br />
B<br />
a<br />
n<br />
i<br />
h<br />
C<br />
a<br />
i<br />
d<br />
n<br />
I<br />
a<br />
i<br />
s<br />
e<br />
n<br />
o<br />
d<br />
n<br />
I<br />
s<br />
e<br />
n<br />
i<br />
p<br />
p<br />
i<br />
l<br />
i<br />
h<br />
P<br />
d<br />
n<br />
a<br />
l<br />
i<br />
a<br />
h<br />
T<br />
Vietnam Asia<br />
World h<br />
s<br />
e<br />
d<br />
a<br />
l<br />
g<br />
n<br />
a<br />
B<br />
a<br />
n<br />
i<br />
h<br />
C<br />
a<br />
i<br />
d<br />
n<br />
I<br />
a<br />
i<br />
s<br />
e<br />
n<br />
o<br />
d<br />
n<br />
I<br />
s<br />
e<br />
n<br />
i<br />
p<br />
p<br />
i<br />
l<br />
i<br />
h<br />
P<br />
84-85 86-90 91-95 96-00 01-03<br />
d<br />
n<br />
a<br />
l<br />
i<br />
a<br />
h<br />
T<br />
Vietnam Asia<br />
World h<br />
s<br />
e<br />
d<br />
a<br />
l<br />
g<br />
n<br />
a<br />
B<br />
a<br />
n<br />
i<br />
h<br />
C<br />
a<br />
i<br />
d<br />
n<br />
I<br />
a<br />
i<br />
s<br />
e<br />
n<br />
o<br />
d<br />
n<br />
I<br />
a<br />
b<br />
s<br />
e<br />
n<br />
i<br />
p<br />
p<br />
i<br />
l<br />
i<br />
h<br />
P<br />
d<br />
n<br />
a<br />
l<br />
i<br />
a<br />
h<br />
T<br />
Vietnam Asia<br />
World h<br />
s<br />
e<br />
d<br />
a<br />
l<br />
g<br />
n<br />
a<br />
B<br />
h<br />
s<br />
e<br />
d<br />
a<br />
l<br />
g<br />
n<br />
a<br />
B<br />
a<br />
n<br />
i<br />
h<br />
C<br />
a<br />
n<br />
i<br />
h<br />
C<br />
a<br />
i<br />
d<br />
n<br />
I<br />
a<br />
i<br />
d<br />
n<br />
I<br />
a<br />
i<br />
s<br />
e<br />
n<br />
o<br />
d<br />
n<br />
I<br />
a<br />
i<br />
s<br />
e<br />
n<br />
o<br />
d<br />
n<br />
I<br />
s<br />
e<br />
n<br />
i<br />
p<br />
p<br />
i<br />
l<br />
i<br />
h<br />
P<br />
s<br />
e<br />
n<br />
i<br />
p<br />
p<br />
i<br />
l<br />
i<br />
h<br />
P<br />
d<br />
n<br />
a<br />
l<br />
i<br />
a<br />
h<br />
T<br />
d<br />
n<br />
a<br />
l<br />
i<br />
a<br />
h<br />
T<br />
V i e t n a m<br />
Vietnam A s i a<br />
W o r l d<br />
Asia<br />
World
26<br />
% rate <strong>of</strong> change <strong>of</strong> mean production<br />
in 5 year blocks<br />
<strong>Study</strong> <strong>and</strong> <strong>analysis</strong> <strong>of</strong> <strong>feeds</strong> <strong>and</strong> <strong>fertilizers</strong> <strong>for</strong> <strong>sustainable</strong> aquaculture development<br />
FIGURE 3<br />
Percent rate <strong>of</strong> change in mean aquaculture production (in five year blocks) <strong>for</strong><br />
selected Asian nations, whole <strong>of</strong> Asia <strong>and</strong> the world<br />
120<br />
100<br />
80<br />
60<br />
40<br />
20<br />
0<br />
Bangladesh<br />
1.2 Strategies <strong>for</strong> increasing<br />
aquaculture production in a<br />
<strong>sustainable</strong> manner<br />
While retaining a rural base, many<br />
factors were responsible <strong>for</strong> the upsurge<br />
in Asian aquaculture production. In<br />
addition to technological advances<br />
<strong>and</strong> improvements, the <strong>for</strong>emost<br />
factors that led to the rapid growth<br />
<strong>of</strong> aquaculture in the region were<br />
the increasing gap between food fish<br />
dem<strong>and</strong> <strong>and</strong> supply <strong>and</strong> the subsequent<br />
support by governments to develop<br />
rural <strong>and</strong> industrial scale aquaculture.<br />
The main technological advances<br />
that contributed to the increases in<br />
production were:<br />
• advances in hypophysation<br />
China<br />
Source: calculated from FAO (2006)<br />
India<br />
86-90/80-85<br />
91-95/86-90<br />
96-00/90-95<br />
01-03/96-00<br />
Indonesia<br />
techniques <strong>and</strong> the virtual elimination <strong>of</strong> the dependency on wild juveniles (apart<br />
from a few cultured species);<br />
• advances in husb<strong>and</strong>ry techniques, such as the adoption <strong>of</strong> “polyculture” systems<br />
<strong>and</strong> improved management procedures;<br />
• genetic improvement <strong>of</strong> a number <strong>of</strong> species <strong>and</strong> the development <strong>of</strong> monosex<br />
tilapia culture<br />
• improvements in disease prevention <strong>and</strong> control; <strong>and</strong><br />
• improvements in feed <strong>for</strong>mulations <strong>and</strong> manufacture <strong>and</strong> feeding practices.<br />
The surface area used <strong>for</strong> aquaculture in Asia has been increasing. The area currently<br />
used <strong>for</strong> aquaculture in the region is summarized in Table 3. There is little scope to<br />
increase production by increasing the area under culture, especially in inl<strong>and</strong> waters.<br />
The reason <strong>for</strong> this is although Asia has the largest inl<strong>and</strong>/freshwater resources<br />
Philippines<br />
Thail<strong>and</strong><br />
Vietnam<br />
FIGURE 4<br />
Percent change in Asian aquaculture production<br />
over time<br />
Percent<br />
80<br />
70<br />
60<br />
50<br />
40<br />
30<br />
20<br />
10<br />
0<br />
Asia<br />
y = -0,3719x 2 + 6,1379x + 44,466<br />
R 2 = 0,8681<br />
World<br />
0 5 10 15 20<br />
Five year periods (1980-2004)<br />
Source: calculated from FAO (2006)
Feeds <strong>and</strong> <strong>fertilizers</strong>: the key to long-term sustainability <strong>of</strong> Asian aquaculture 27<br />
TABLE 3<br />
Estimated area (ha) available <strong>and</strong>/or documented to be used <strong>for</strong> aquaculture in different environments in<br />
seven Asian countries<br />
Environment Country<br />
Bangladesh China India Indonesia Philippines Thail<strong>and</strong> Viet Nam<br />
Freshwater (finfish)<br />
Ponds 305 025 1.858x10⁶ 247 500 97 821 14 531 118 002 120 000<br />
Depressions 5 488 130 000 2 007<br />
Reservoirs/lakes 2.334 x10⁶ 270 000 219 000 340 000<br />
Cages 466* 59<br />
Others<br />
Freshwater (prawn etc)<br />
471 600 151 414** 23 432** 580 000**<br />
Ponds<br />
Brackish water<br />
41 870<br />
Pond<br />
Cages<br />
217 877 154 600 370 824 239 323 83 919<br />
Marine -<br />
Cage units 715 750 196 198 660 000***<br />
* Inl<strong>and</strong> cages; **primarily paddy fields; *** tidal flats; empty spaces = no data<br />
Source: data <strong>for</strong> Bangladesh, China, India, Indonesia, Philippines, Thail<strong>and</strong> <strong>and</strong> Viet Nam were obtained respectively from Barman<br />
<strong>and</strong> Karim (2007); Cen <strong>and</strong> Zhang (1999); Ayyappan <strong>and</strong> Ahamad Ali (2007); Nur (2007); Sumagaysay-Chavoso (2007); Thongrod<br />
(2007); <strong>and</strong> Hung <strong>and</strong> Huy (2007)<br />
among all continents, the per caput availability is lowest (Nguyen <strong>and</strong> De Silva, 2006;<br />
Figure 5). As such, increasing competition <strong>for</strong> this relatively scarce primary resource<br />
(in addition to the dem<strong>and</strong> <strong>for</strong> l<strong>and</strong>) will probably not permit significant expansion<br />
<strong>of</strong> inl<strong>and</strong> aquaculture, except perhaps the use <strong>of</strong> reservoirs <strong>for</strong> cage <strong>and</strong> cove culture<br />
<strong>and</strong> culture-based fisheries (De Silva, 2003). On the other h<strong>and</strong>, unplanned <strong>and</strong> overly<br />
ambitious developments in reservoir cage culture can be counter productive, as has<br />
been the case in certain Asian countries (Abery et al., 2005).<br />
In essence there are two possible strategies to increase future aquaculture production<br />
in Asia. These are genetic improvements <strong>and</strong> advances in feed <strong>and</strong> feed technology. The<br />
most notable advances in genetic improvements have been made <strong>for</strong> salmonids <strong>and</strong><br />
tilapias (Gedram, 2000) <strong>and</strong> these have to be emulated <strong>for</strong> some <strong>of</strong> the more important<br />
aquaculture species in Asia. In following this approach care has to be taken to preserve<br />
the genetic integrity <strong>of</strong> individual species <strong>and</strong> to conserve biodiversity. Some genetic<br />
manipulations such as the hybridisation <strong>of</strong> the Asian catfish (Clarias macrocephalus)<br />
with the African catfish (C. gariepinus) could have long term negative impacts on<br />
Total availability (km 3 /year)<br />
16 000<br />
14 000<br />
12 000<br />
10 000<br />
8 000<br />
6 000<br />
4 000<br />
2 000<br />
0<br />
Total availability<br />
Per capita availability<br />
2 9 0 0<br />
4 . 2 3<br />
7 8 9 0<br />
17 . 4 0<br />
Europe N&C<br />
America<br />
Source: Nguyen <strong>and</strong> De Silva (2006)<br />
FIGURE 5<br />
Total <strong>and</strong> per caput inl<strong>and</strong> water availability per continents<br />
4 0 5 0<br />
5 . 7 2<br />
13 5 10<br />
3 . 9 2<br />
12 0 3 0<br />
3 8 . 2 0<br />
8 2 . 2 0<br />
2 3 6 0<br />
Africa Asia S America Australia &<br />
Oceania<br />
Continent<br />
90<br />
80<br />
70<br />
60<br />
50<br />
40<br />
30<br />
20<br />
10<br />
0<br />
Per capita availability (m 3 /year)
28<br />
<strong>Study</strong> <strong>and</strong> <strong>analysis</strong> <strong>of</strong> <strong>feeds</strong> <strong>and</strong> <strong>fertilizers</strong> <strong>for</strong> <strong>sustainable</strong> aquaculture development<br />
FIGURE 6<br />
Global <strong>and</strong> Asian production <strong>of</strong> soybean meal <strong>and</strong> fishmeal (in million tonnes) <strong>and</strong> the<br />
percent contribution by Asia to global production <strong>and</strong> consumption<br />
SBM production (million tonnes)/ percent<br />
Source: Tacon (2004)<br />
140<br />
120<br />
100<br />
80<br />
60<br />
40<br />
20<br />
0<br />
SBM FM<br />
World Asia Production Consumption<br />
natural population structure <strong>and</strong> the conservation <strong>of</strong> biodiversity (Na-Nakorn, 2005)<br />
<strong>and</strong> could lead to negative public perception on aquaculture developments.<br />
Developments in <strong>feeds</strong> <strong>and</strong> feed management have a crucial role to play in the future<br />
expansion <strong>of</strong> Asian aquaculture, particularly with respect to the rapidly increasing<br />
dem<strong>and</strong> <strong>for</strong> commercial <strong>feeds</strong> by the shrimp, marine <strong>and</strong> freshwater finfish sectors<br />
(Chamberlain, 1993; Gill, 1997; New <strong>and</strong> Csavas, 1995; Tacon <strong>and</strong> De Silva, 1997;<br />
De Silva, 1999; Hasan, 2001; Tacon, 2004; Tacon, Hasan <strong>and</strong> Subasibghe, 2006). The<br />
dem<strong>and</strong> <strong>for</strong> commercial aquaculture <strong>feeds</strong> has also recently become more contentious,<br />
particularly with regard to the supply <strong>of</strong> fishmeal <strong>and</strong> fish oil. Aquaculture has<br />
become the single largest consumer <strong>of</strong> these commodities <strong>of</strong> all animal husb<strong>and</strong>ry<br />
sectors. Aquaculture’s share <strong>of</strong> fishmeal use has increased from 10 percent in 1988<br />
to 46 percent in 2002 (Barlow <strong>and</strong> Pike, 2001; Pike, 2005). Similarly, there has been a<br />
drastic increase in the share <strong>of</strong> fish oil usage from 16 percent in 1988 to 81 percent in<br />
2002. Pike (2005) further predicted that in 2012, aquaculture will use 50 <strong>and</strong> 88 percent<br />
fishmeal <strong>and</strong> fish oil, respectively. Aquaculture’s share <strong>of</strong> total fishmeal <strong>and</strong> fish oil<br />
use is there<strong>for</strong>e expected to increase, respectively, from 46 percent <strong>and</strong> 81 percent in<br />
2002, to 50 percent <strong>and</strong> 88 percent by 2012. The consequences <strong>of</strong> these trends to the<br />
Asian region, that accounts <strong>for</strong> over 90 percent <strong>of</strong> global aquaculture production,<br />
is immediately obvious. Moreover, the dem<strong>and</strong> <strong>and</strong> use <strong>of</strong> fishmeal in some <strong>of</strong> the<br />
emerging aquaculture countries in Asia is increasing rapidly. For example, Viet Nam<br />
already uses approximately 62 500 tonnes <strong>of</strong> fishmeal per year, solely <strong>for</strong> aquaculture<br />
(see Figure 6 <strong>and</strong> also refer to www.gafta.com/fin/finfacts3.html.)<br />
2. FEEDS AND FEEDING PRACTICES IN ASIAN AQUACULTURE<br />
Aquaculture is very diverse because <strong>of</strong> the number <strong>of</strong> species cultured, singly <strong>and</strong> or in<br />
combination, the differences in the environment – freshwater, brackish water or marine,<br />
the intensity <strong>of</strong> the practice, the nature <strong>of</strong> the containment – ponds, cages, raceways,<br />
etc, as well as the socio-economic milieu in which it occur. This diversity is similarly<br />
reflected in the array <strong>of</strong> different <strong>feeds</strong>, feeding practices <strong>and</strong> the use <strong>of</strong> organic or<br />
inorganic <strong>fertilizers</strong>. For the purposes <strong>of</strong> this paper, <strong>feeds</strong> <strong>and</strong> feeding practices in Asian<br />
aquaculture are considered in relation to culture intensity, i.e. extensive, semi- <strong>and</strong><br />
intensive culture practices.<br />
50<br />
40<br />
30<br />
20<br />
10<br />
0<br />
FM production (million tonnes)/ percent
Feeds <strong>and</strong> <strong>fertilizers</strong>: the key to long-term sustainability <strong>of</strong> Asian aquaculture 29<br />
Feed efficacy also has the potential to bring about major changes in culture<br />
practices, even in the case <strong>of</strong> small-scale, rural aquaculture enterprises. For example,<br />
in the Mekong Delta in southern Viet Nam it has been reported that high feed costs<br />
in pangasiid cage culture has brought about a significant shift to pond culture (Hung<br />
<strong>and</strong> Merican, 2006). The significant point is that the overall production cost per kg<br />
ranged from VND 8 000 to 11 000 in ponds as opposed to VND 8 153 to 11 619 in<br />
cages (US$1.00 = VND 15 000), <strong>of</strong> which <strong>feeds</strong> accounted <strong>for</strong> 78 to 90 percent <strong>of</strong> total<br />
production costs, respectively, indicating that even minor reductions in unit production<br />
cost can result in major shifts from one production system to another.<br />
2.1 Extensive systems<br />
Extensive aquaculture in Asia is practised in several ways. In all countries considered<br />
here, large areas are devoted to extensive earthen pond aquaculture, primarily <strong>for</strong> finfish<br />
<strong>and</strong> shrimp culture. By definition, external <strong>feeds</strong> are not applied in extensive systems,<br />
but more <strong>of</strong>ten than not organic <strong>and</strong> inorganic <strong>fertilizers</strong> are applied to augment natural<br />
food production in the systems.<br />
2.2 Semi-intensive systems<br />
Asian aquaculture is dominated by semi-intensive freshwater, earthen pond culture<br />
systems. In these systems natural productivity is enhanced with <strong>fertilizers</strong> <strong>and</strong> the fish<br />
or shrimp are provided with supplemental <strong>feeds</strong>. Feeds are mostly farm-made or made<br />
according to farmer specifications by local feed processing plants. For example, in<br />
India <strong>and</strong> Bangladesh almost all inl<strong>and</strong> finfish production is semi-intensive <strong>and</strong> is based<br />
on farm-made <strong>feeds</strong>. There is an increasing trend in some Asian countries <strong>for</strong> smallscale,<br />
commercial feed manufacturers to produce relatively large quantities <strong>of</strong> <strong>feeds</strong>,<br />
<strong>for</strong> a particular species <strong>and</strong> hence supply the dem<strong>and</strong>s within a region. Good examples<br />
are the pangasiid feed producers in the Mekong delta in Viet Nam (Hung, Truc <strong>and</strong><br />
Huy, 2007). These <strong>feeds</strong> are not necessarily nutritionally wholesome <strong>and</strong> indeed need<br />
not be so.<br />
2.3 Intensive systems<br />
Intensive aquaculture practices in Asia are by <strong>and</strong> large restricted to shrimp culture,<br />
inl<strong>and</strong> <strong>and</strong> marine finfish cage culture, as well as freshwater culture <strong>of</strong> some high value<br />
species such as eels in China. In intensive systems the cultured stock has to be provided<br />
with a complete feed that meets all the nutritional requirements <strong>of</strong> the species. Such<br />
<strong>feeds</strong> are species specific <strong>and</strong> in most culture practices will account <strong>for</strong> 40 to 60 percent<br />
<strong>of</strong> recurrent production costs.<br />
3. FERTILIZER USAGE IN ASIAN AQUACULTURE<br />
There is a long history <strong>of</strong> organic <strong>and</strong> inorganic fertilizer use in pond culture <strong>of</strong><br />
filter feeding finfish species in Asia. The dynamics <strong>of</strong> fertilizer use <strong>and</strong> its efficacy in<br />
aquaculture is fairly well understood (Hepher, 1988; New, Tacon <strong>and</strong> Csavas, 1994).<br />
In extensive systems <strong>fertilizers</strong> are <strong>of</strong>ten the only input <strong>and</strong> in semi-intensive systems<br />
fertilizer may be regularly <strong>and</strong> or infrequently applied. Culture systems in which<br />
fertilizer is the only input are more <strong>of</strong>ten than not small-scale, single pond operations,<br />
except perhaps milk fish culture operations in which even large operations use<br />
<strong>fertilizers</strong> to induce the growth <strong>of</strong> “lab lab”.<br />
Almost all extensive <strong>and</strong> the majority <strong>of</strong> semi-intensive aquaculture operations<br />
in Asia, with minor exceptions, are dependent on the use <strong>of</strong> fertilizer <strong>and</strong> organic<br />
manures. Fertilizer <strong>and</strong> manure usage in aquaculture varies considerably among Asian<br />
countries (Table 4). In general, the use <strong>of</strong> fresh manure is preferred over the application<br />
<strong>of</strong> dry manure. This is because nutrient delivery from wet manure is faster <strong>and</strong> more<br />
efficient. In India <strong>and</strong> Bangladesh cattle <strong>and</strong> buffalo manure is extensively used in
30<br />
TABLE 4<br />
Fertilizer use/availability (2003-04) in some Asian countries<br />
Projected requirement (2020)<br />
Fertilizer use<br />
Total usage<br />
(kg or tonnes/ha/year)<br />
Organic Inorganic Organic Inorganic<br />
Yield<br />
(kg/ha/year)<br />
Culture period<br />
(days)<br />
Country/species<br />
<strong>Study</strong> <strong>and</strong> <strong>analysis</strong> <strong>of</strong> <strong>feeds</strong> <strong>and</strong> <strong>fertilizers</strong> <strong>for</strong> <strong>sustainable</strong> aquaculture development<br />
Bangladesh<br />
Shrimp spp.* 100–120 200–400 BDT 200** Solid biodegradable from<br />
market waste etc are also<br />
used<br />
Organic manure 190.15 million<br />
tonnes; nitrogen fertilizer<br />
190 000 tonnes; phosphate<br />
fertilizer 190 000 tonnes<br />
Nitrogen fertilizer<br />
100 000 tonnes;<br />
phosphate fertilizer<br />
100 000 tonnes<br />
Nitrogen fertilizer<br />
1 600 tonnes;<br />
phosphate fertilizer<br />
1 600 tonnes<br />
100 million tonnes (cattle<br />
dung <strong>and</strong> poultry manure)<br />
Nitrogen fertilizer<br />
200 kg; phosphate<br />
fertilizer 200 kg<br />
20 tonnes<br />
(cattle dung<br />
<strong>and</strong> poultry<br />
Variable Variable;<br />
>2 000<br />
India<br />
Freshwater<br />
finfish (Indian<br />
major <strong>and</strong><br />
manure)<br />
Chinese carps)<br />
Organic manure 164 500 tonnes;<br />
nitrogen fertilizer 3 050 tonnes;<br />
phosphate fertilizer 3 050 tonnes<br />
86 600 tonnes (cattle dung<br />
<strong>and</strong> poultry manure)<br />
Nitrogen fertilizer 45 kg;<br />
phosphate fertilizer 45 kg<br />
2 500 kg<br />
(cattle dung<br />
<strong>and</strong> poultry<br />
manure)<br />
NA 860<br />
(40–1 180)<br />
Freshwater<br />
prawn<br />
Organic manure 187 500 tonnes;<br />
nitrogen fertilizer 2 250 tonnes;<br />
phosphate fertilizer 1 500 tonnes<br />
125 000 tonnes Nitrogen fertilizer<br />
1 500 tonnes;<br />
phosphate fertilizer<br />
1 000 tonnes<br />
1 250 kg Nitrogen fertilizer 15 kg;<br />
phosphates 10 kg<br />
Shrimp NA 730<br />
(460–1 890)<br />
NA Variable 118 kg 29 kg 19 600 tonnes 7 600 tonnes<br />
Indonesia<br />
Finfish<br />
(freshwater)<br />
Shrimp (brackish NA Variable 22 kg 13 kg<br />
water)<br />
Philippines<br />
All fish species 2 000 kg 670 kg 489 998 tonnes 190 930 tonnes Projected requirement will<br />
remain same <strong>for</strong> the next 10<br />
years<br />
*Extensive shrimp aquaculture in Bangladesh is primarily dependent on natural recruitment <strong>of</strong> shrimp post-larvae.**Quantitative in<strong>for</strong>mation on fertilizer use <strong>for</strong> Bangladesh is not available, although farmers<br />
spend an average <strong>of</strong> 200 Bangladesh taka (BDT) per ha per year (US$1.00 = BDT 65.00)<br />
Source: data <strong>for</strong> Bangladesh, India, Indonesia <strong>and</strong> Philippines were obtained respectively from Barman <strong>and</strong> Karim (2007); Ayyappan <strong>and</strong> Ahamad Ali (2007); Nur (2007); <strong>and</strong> Sumagaysay-Chavoso (2007) <strong>and</strong><br />
personal observations.
Feeds <strong>and</strong> <strong>fertilizers</strong>: the key to long-term sustainability <strong>of</strong> Asian aquaculture 31<br />
aquaculture. With the increasing industrialisation <strong>of</strong> poultry production in most Asian<br />
countries, in the last ten to fifteen years, poultry manure has become readily available<br />
<strong>for</strong> use in aquaculture. In the Philippines poultry manure, which ranges in price from<br />
US$16.36 to 21.82/tonne, is preferred over other organic <strong>fertilizers</strong>. Other livestock<br />
manure, mudpress (agricultural waste from sugar mills) <strong>and</strong> rice bran are also used to<br />
enhance natural pond productivity but to a much lesser extent. In most countries, fish<br />
farmers usually only apply organic <strong>fertilizers</strong> during pond preparation, although some<br />
also apply <strong>fertilizers</strong> during the rearing period to maintain the growth <strong>of</strong> phyto- <strong>and</strong><br />
zooplankton.<br />
The availability <strong>of</strong> manure, particularly in rural areas has continued to sustain carp<br />
culture practices in many countries, <strong>and</strong> milk fish culture in the Philippines in particular.<br />
Improved manure <strong>and</strong> system management has contributed significantly towards the<br />
growth <strong>of</strong> the carp <strong>and</strong> milkfish sectors <strong>and</strong> indirectly has made farmers independent<br />
<strong>of</strong> commercial <strong>feeds</strong>. In Viet Nam, the use <strong>of</strong> <strong>fertilizers</strong> <strong>and</strong> manure in aquaculture is<br />
less common than in other Asian countries <strong>and</strong> is <strong>of</strong>ten confined to the nursery stages<br />
when juvenile fish generally per<strong>for</strong>m better on natural food organisms. On the other<br />
h<strong>and</strong>, sewage cum fish culture in urban areas in Viet Nam is popular <strong>and</strong> encouraged.<br />
In the Philippines, there is a greater dependence on inorganic <strong>fertilizers</strong> in comparison<br />
to most other countries. In some countries there are increasing bio-security concerns<br />
with regard to the use <strong>of</strong> animal manure, especially in shrimp culture in Indonesia.<br />
4. AQUAFEEDS<br />
4.1 General considerations<br />
It is difficult, if not impossible, to differentiate accurately between industrial aquafeed<br />
production <strong>and</strong> total animal feed production. This is because the same ingredients are<br />
<strong>of</strong>ten used <strong>for</strong> aqua- or other animal <strong>feeds</strong> <strong>and</strong> similar industrial production processes.<br />
However, only a small proportion <strong>of</strong> feed production plants in Asia is dedicated aquafeed<br />
manufacturers <strong>and</strong> the bulk <strong>of</strong> <strong>feeds</strong> used in Asian aquaculture are non-industrial <strong>feeds</strong><br />
<strong>and</strong> hence estimates can be made <strong>of</strong> total aquafeed production <strong>and</strong> consumption.<br />
China <strong>and</strong> India are among the world’s top ten animal feed producers, accounting<br />
<strong>for</strong> 11.9 percent (72.7 million tonnes) <strong>and</strong> 1.6 percent (9.6 million tonnes) respectively<br />
<strong>of</strong> global industrial animal feed production (Gill, 2006). As will become apparent<br />
later, only a very small proportion <strong>of</strong> the industrially produced <strong>feeds</strong> in both <strong>of</strong> these<br />
countries, <strong>and</strong> Asia in general, are used in aquaculture. For example, aquaculture in<br />
India used 0.24 millon tonnes <strong>of</strong> industrial feed in 2003 amounting to only 3.7 percent<br />
<strong>of</strong> the total aquafeed <strong>of</strong> 6.4 million tonnes (Victor Suresh, pers. comm.).<br />
4.2 Types <strong>of</strong> aqua<strong>feeds</strong><br />
Asian aqua<strong>feeds</strong> can be broadly divided into four categories. The potential <strong>of</strong> each <strong>of</strong><br />
these feed types in relation to production/yield is shown in Figure 7.<br />
1. Materials <strong>and</strong> or ingredients <strong>of</strong> plant origin that are used singly or in combination<br />
with others (<strong>of</strong> plant or animal origin) but with little or no processing. Such<br />
<strong>feeds</strong> are mostly used at the lower end <strong>of</strong> the semi-intensive culture spectrum,<br />
<strong>for</strong> example in home ponds. The <strong>feeds</strong>/ingredients vary in quality <strong>and</strong> nutrient<br />
content, e.g. rice bran <strong>of</strong> rather limited nutritional value <strong>and</strong>/or mixed with dried<br />
fish <strong>of</strong> high nutritional value.<br />
2. Materials <strong>of</strong> animal origin, primarily trash fish that is used singly or in<br />
combination with others but with little or no processing. Such <strong>feeds</strong> are mostly<br />
used at the upper end <strong>of</strong> semi-intensive to intensive culture practices <strong>and</strong> mainly<br />
in marine fish culture, e.g. grouper (Epinephelus spp.), Asian seabass (Lates<br />
calcarifer) <strong>and</strong> cobia (Rachycentron canadum).<br />
3. Mixtures <strong>of</strong> ingredients that are subjected to some <strong>for</strong>m <strong>of</strong> processing (simple<br />
grinding, mixing <strong>and</strong> cooking resulting in a moist dough or in simple pellets).
32<br />
<strong>Study</strong> <strong>and</strong> <strong>analysis</strong> <strong>of</strong> <strong>feeds</strong> <strong>and</strong> <strong>fertilizers</strong> <strong>for</strong> <strong>sustainable</strong> aquaculture development<br />
Processing is done on farm or in small processing plants, according to the<br />
specifications <strong>of</strong> the farmer. Collectively these <strong>feeds</strong> are designated as farm-made<br />
<strong>feeds</strong>, <strong>and</strong> <strong>of</strong>ten are the main stay in semi-intensive aquaculture. In the literature<br />
they are also commonly referred to as supplementary <strong>feeds</strong> (De Silva, 1994).<br />
4. Feeds that are manufactured by industrial feed milling plants that are distributed<br />
<strong>and</strong> sold using conventional market chains. Such <strong>feeds</strong> are expected to fulfil all<br />
the nutrient requirements <strong>of</strong> the cultured species <strong>and</strong> are mostly used in intensive<br />
practices, <strong>of</strong>ten by relatively large-scale aquaculture operations. The ingredient<br />
composition <strong>and</strong> all aspects pertaining to feed <strong>for</strong>mulation <strong>and</strong> manufacturing<br />
processes are normally based on research findings <strong>and</strong> farmers normally do not<br />
make any input into ingredient selection <strong>and</strong> or feed <strong>for</strong>mulations. These <strong>feeds</strong><br />
are sold under different trade names, generally in 20–25 kg bags <strong>and</strong> are available<br />
<strong>for</strong> post-larval <strong>and</strong> shrimp grow-out, tilapia fingerlings <strong>and</strong> grow-out, common<br />
carp, eels, seabass <strong>and</strong> so <strong>for</strong>th. The nutrient specifications (percent moisture <strong>and</strong><br />
protein, lipid, ash, energy content <strong>and</strong> certain manufacturers will also provide<br />
percent nitrogen free extract <strong>and</strong> fibre content data) as well as the pellet size are<br />
indicated on the packaging.<br />
Irrespective <strong>of</strong> the feed category the majority <strong>of</strong> the ingredients used in the <strong>feeds</strong>,<br />
particularly in categories (iii) <strong>and</strong> (iv) are fairly common ingredients. The key ingredients,<br />
fishmeal, soybean meal, various oilseed cakes are also used in the production <strong>of</strong> other<br />
animal <strong>feeds</strong> <strong>and</strong> hence aquaculture is a direct competitor with other animal husb<strong>and</strong>ry<br />
practices. For Asia as a whole the situation is further exacerbated as its contribution to<br />
the world supply <strong>of</strong> these three principal ingredients is minimal in comparison to the<br />
proportion that is used by the regional animal feed industry (Figure 6). For example,<br />
while Asia produces only 17 percent it consumes 47 percent <strong>of</strong> the global fishmeal<br />
supply.<br />
FIGURE 7<br />
A schematic representation <strong>of</strong> the effectiveness <strong>of</strong> <strong>fertilizers</strong> <strong>and</strong> different feed types<br />
on aquaculture production
Feeds <strong>and</strong> <strong>fertilizers</strong>: the key to long-term sustainability <strong>of</strong> Asian aquaculture 33<br />
4.3 Current usage<br />
A conservative estimate <strong>of</strong> current aquafeed use in Asia, based on data provided <strong>for</strong> the<br />
target countries, is 19.3 <strong>and</strong> 10.3 million tonnes <strong>of</strong> farm-made <strong>and</strong> commercial <strong>feeds</strong>,<br />
respectively (Tables 5 <strong>and</strong> 6). It is likely that the consumption <strong>of</strong> farm-made <strong>feeds</strong> is<br />
significantly underestimated in view <strong>of</strong> the difficulties in accurately assessing feed use.<br />
For example, feed usage in back yard pond culture, which is widespread throughput<br />
the region, is rarely accounted <strong>for</strong>. Also, some countries with limited aquaculture<br />
activities have not been taken into account in the above estimates. For example, Hong<br />
Kong used 9 600 tonnes <strong>of</strong> trash fish in 2002 in its relatively small mariculture sector<br />
(Chau <strong>and</strong> Sadovy, 2005), <strong>and</strong> Sri Lanka used 4 104 tonnes <strong>of</strong> shrimp feed in 2004<br />
(Weerakoon, pers. comm.).<br />
Based on the above feed use estimates <strong>and</strong> assuming, rather conservatively that<br />
farm-made <strong>and</strong> commercial <strong>feeds</strong> have food conversion ratios <strong>of</strong> 2.0 <strong>and</strong> 1.3:1,<br />
respectively, the total estimated feed use is expected to yield 17.6 million tonnes <strong>of</strong><br />
finfish <strong>and</strong> crustaceans. However, the recorded production <strong>for</strong> 2003 was 24.04 million<br />
tonnes (marine finfish = 531 556 tonnes, freshwater finfish = 21 146 200 tonnes <strong>and</strong><br />
crustaceans = 2 361 055 tonnes), a difference <strong>of</strong> nearly 6.5 million tonnes. The question<br />
there<strong>for</strong>e, arises whether feed usage is grossly under-represented <strong>and</strong>/or that the 6.5<br />
million tonne difference is accounted <strong>for</strong> by extensive practices, although this is highly<br />
unlikely. Un<strong>for</strong>tunately, data pertaining to production in relation to feed use in the<br />
different countries are not available <strong>and</strong> are difficult to collate, except <strong>of</strong> course <strong>for</strong><br />
the use <strong>of</strong> commercial <strong>feeds</strong> in some practices (Abery et al., 2005). However, such data<br />
may be very useful in evaluating the efficacy <strong>of</strong> feed types, which in turn would be <strong>of</strong><br />
use in bringing about improvements, especially in the case <strong>of</strong> farm-made <strong>feeds</strong> that are<br />
extensively used in some countries in the region, e.g. India <strong>and</strong> Viet Nam.<br />
4.4 Aquafeed projections<br />
In Tables 5 <strong>and</strong> 6 an attempt is made to predict future feed use in the target countries.<br />
The total estimates <strong>for</strong> farm-made <strong>and</strong> commercial <strong>feeds</strong> by 2013 are 30.7 million <strong>and</strong><br />
22.2 million tonnes, respectively (Figure 8). These predicted values represent increases<br />
<strong>of</strong> 60 <strong>and</strong> 107 percent <strong>for</strong> farm-made <strong>and</strong> commercial feed use, respectively from<br />
current levels. For both groups <strong>of</strong> <strong>feeds</strong> the highest dem<strong>and</strong> will be from China. Even<br />
FIGURE 8<br />
Current <strong>and</strong> predicted use <strong>of</strong> farm-made <strong>and</strong> commercial <strong>feeds</strong> in Asia <strong>and</strong> projected<br />
percent increase<br />
Volume (million tonnes)/ % increase<br />
140<br />
120<br />
100<br />
80<br />
60<br />
40<br />
20<br />
0<br />
Farm-made feed<br />
Commercial feed<br />
Current 2010 % Increase
34<br />
<strong>Study</strong> <strong>and</strong> <strong>analysis</strong> <strong>of</strong> <strong>feeds</strong> <strong>and</strong> <strong>fertilizers</strong> <strong>for</strong> <strong>sustainable</strong> aquaculture development<br />
TABLE 5<br />
Current <strong>and</strong> projected use (tonnes) <strong>of</strong> single ingredient <strong>and</strong> farm-made <strong>feeds</strong> in aquaculture in selected<br />
Asian countries<br />
Feeds<br />
Current use<br />
Bangladesh China India Indonesia Philippines Thail<strong>and</strong> Viet Nam<br />
Finfish 50 000 10 350 000 6 144 947a 223 850 500 000<br />
Shrimp 20 000 530 000 ~20 000b 42 000<br />
Others 10 000<br />
Total 70 000 10 880 000 6 164 947 275 850 384 896 762 173c 800 000<br />
Projected needs: 2013<br />
Finfish 13 056 000d 7 994 431e 828 088<br />
Shrimp 636 000d 276 134 1 500 000<br />
Trash fish 4 000 000 1 000 000<br />
Total 91 000e 17 692 000 8 270 565 358 605e 828 088e 990 824e 2 500 000<br />
a Rice <strong>and</strong> wheat bran, oilseed cakes, marine ingredients, others; b Fishmeal, squid meal, shrimp meal, mantis shrimp meal, soybean<br />
meal, flour, fish oil, lecithin, binders; c including trash fish used in diets <strong>for</strong> seabass <strong>and</strong> grouper; d Based on a 20 percent increase<br />
<strong>of</strong> current usage; e Based on a 30 percent increase on current use. Note that in Viet Nam, an estimated 300 000 tonnes <strong>of</strong> trash<br />
fish is used in aqua<strong>feeds</strong>. Predictions <strong>for</strong> the increase in shrimp production in India <strong>and</strong> <strong>for</strong> finfish <strong>and</strong> shrimp production <strong>and</strong><br />
trash fish usage in Viet Nam were made on estimated increases in production volume, <strong>and</strong> using reasonable FCRs. Calculations<br />
were done using 2003 data to ensure consistency between different countries.<br />
Source: Country reviews <strong>and</strong> personal communications with the authors.<br />
TABLE 6<br />
Number <strong>of</strong> aquafeed mills operating in selected Asian countries, current <strong>and</strong> projected production <strong>and</strong> the<br />
major ingredients used (tonnes). Please note that the projections <strong>for</strong> India are <strong>for</strong> the year 2020 <strong>and</strong> the<br />
others <strong>for</strong> 2013<br />
Mills/production<br />
Number<br />
Bangladesh China India Indonesia Philippines Thail<strong>and</strong> Viet Nam<br />
Fish - - 1 - - 12 13<br />
Shrimp - - 28 - - 34 23<br />
Fish & shrimp<br />
Production<br />
Current<br />
14 360 - 20 78 14 -<br />
Fishmeal NA 1 500 000 48 0001 34 485 30 630 248 500 62 500<br />
Soybean meal NA 2 340 000 33 000 4 523 55 437 145 950 100 000<br />
Corn/wheat NA 1 550 000 30 000 24 310 NA 78 750 NA<br />
Total<br />
Projected<br />
60 000 7 800 000 238 883 490 000 204 396 822 500 696 000<br />
Fishmeal NA 4 050 000 133 1471 70 000 105 905 NA NA<br />
Soybean meal NA 4 800 000 67 650 15 000 179 146 NA NA<br />
Corn/wheat NA 3 004 000 61 500 50 000 297 334 NA NA<br />
Total NA 16 000 000 347 500 1 000 000 658 313 2 736 336 1 500 000<br />
1 Also includes shrimp meal, mantis shrimp meal; NA= data not available or insufficient data available to make predictions.<br />
Calculations were done using 2003 data to ensure consistency between different countries.<br />
Source: Country reviews <strong>and</strong> personal communications with the authors.<br />
in those Asian countries where aquaculture is a relatively minor industry the dem<strong>and</strong><br />
<strong>for</strong> aqua<strong>feeds</strong> is expected to increase three to four fold by 2013. For example, in<br />
Sri Lanka that has a small aquaculture industry it is projected that feed usage will increase<br />
three fold to 12 400 tonnes by 2010 (Weerakoon, pers. comm.). Moreover, Malaysia has<br />
adopted a suite <strong>of</strong> aggressive aquaculture development strategies (Malaysian Ninth<br />
Five Year Plan, 2006 to 2010) <strong>and</strong> envisages to increase aquaculture production from<br />
150 000 tonnes (current) to 600 000 tonnes by the year 2010. Obviously such increases<br />
in production (approximately 20 percent per year) have to go h<strong>and</strong> in h<strong>and</strong> with feed<br />
availability.
Feeds <strong>and</strong> <strong>fertilizers</strong>: the key to long-term sustainability <strong>of</strong> Asian aquaculture 35<br />
4.5 Ingredients used in aqua<strong>feeds</strong><br />
As pointed out previously, the key ingredients used in aqua<strong>feeds</strong>, particularly those<br />
used in commercial <strong>feeds</strong>, are common to those used in terrestrial animal <strong>feeds</strong>.<br />
Consequently, there will be higher levels <strong>of</strong> competition <strong>for</strong> these ingredients in the<br />
global market, in particular <strong>for</strong> ingredients such as fishmeal, fish oil, soybean meal<br />
<strong>and</strong> vitamin <strong>and</strong> mineral pre-mixes. The advantage, if any, in favour <strong>of</strong> aqua<strong>feeds</strong> is<br />
that aquaculture practices in Asia are predominantly extensive <strong>and</strong> semi-intensive <strong>and</strong><br />
<strong>for</strong> many more years to come will be using farm-made <strong>feeds</strong>. These <strong>feeds</strong> allow <strong>for</strong><br />
the incorporation <strong>of</strong> a much greater variety <strong>of</strong> ingredients. Moreover many <strong>of</strong> these<br />
ingredients directly <strong>and</strong> or indirectly act as nutrient sources that augment natural<br />
food production in ponds. These issues have been dealt with in detail previously (De<br />
Silva, 1994; Wood et al., 1992). The study by Wood (op cit.) raised the question <strong>of</strong> the<br />
value <strong>of</strong> conventional nutritional wisdom in relation to aquaculture in the tropics <strong>and</strong><br />
suggested that the provision <strong>of</strong> nutritionally complete diets in tropical systems may not<br />
always be needed.<br />
Ingredients used in aqua<strong>feeds</strong> are either <strong>of</strong> plant or <strong>of</strong> animal origin. Generally, the<br />
plant products are less costly <strong>and</strong> also have the advantage <strong>of</strong> being relatively easily<br />
accessible <strong>and</strong> available, baring a few exceptions <strong>and</strong> tend to be the mainstay <strong>of</strong> farmmade<br />
<strong>feeds</strong>.<br />
4.5.1 Plant <strong>and</strong> agricultural by-products used in aqua<strong>feeds</strong><br />
A large variety <strong>of</strong> plant by-products are used in the production <strong>of</strong> aqua<strong>feeds</strong>, predominantly<br />
<strong>for</strong> the extensive <strong>and</strong> semi-intensive aquaculture feed categories (i) <strong>and</strong><br />
(ii) (see above). The exceptions are soybean meal <strong>and</strong> wheat flour that are also used in<br />
feed categories (iii) <strong>and</strong> (iv). Soybean meal is one <strong>of</strong> the most widely used ingredients<br />
in all types <strong>of</strong> <strong>feeds</strong>. This is because <strong>of</strong> its favourable nutritional composition <strong>and</strong><br />
digestibility, its availability <strong>and</strong> long shelf life.<br />
The most commonly used plant based ingredients in Asian aqua<strong>feeds</strong> <strong>and</strong> their<br />
availability are summarized in Table 7. The data is by no means exhaustive but provides<br />
an indication <strong>of</strong> the main ingredients that are used in the seven target countries.<br />
The majority <strong>of</strong> these ingredients are either used singly or in various combinations.<br />
However, the extent <strong>of</strong> use <strong>of</strong> plant based agricultural by-products, despite the fact that<br />
some have a high protein content, in aqua<strong>feeds</strong> is limited. Foremost among factors that<br />
discourage the use <strong>of</strong> agricultural plant based by-products are:<br />
• unfavourable amino acid balance;<br />
• inferior digestibility;<br />
• presence <strong>of</strong> anti-nutritional factors; <strong>and</strong><br />
• localised <strong>and</strong> seasonal availability.<br />
The first three <strong>of</strong> the above factors have been addressed extensively (Tacon, 1987;<br />
De Silva <strong>and</strong> Anderson, 1995; Hertrampf <strong>and</strong> Pascual, 2000; <strong>and</strong> contributions to this<br />
volume). Despite extensive research the incorporation <strong>of</strong> plant based by-products in<br />
aqua<strong>feeds</strong> is limited. This issue is discussed in greater detail later.<br />
In general, Asian aquaculture relies heavily on agricultural produce <strong>and</strong> by-products.<br />
Consequently, there is increasing competition from alternative users <strong>and</strong> this has led<br />
to substantial price increases. Availability, seasonality <strong>and</strong> the dem<strong>and</strong> <strong>for</strong> plant based<br />
agricultural by-products varies appreciably between countries.<br />
Throughout the region, there is little data on competitive uses <strong>of</strong> agricultural byproducts<br />
in animal husb<strong>and</strong>ry <strong>and</strong> other <strong>for</strong>ms <strong>of</strong> agriculture. The lack <strong>of</strong> this crucial<br />
in<strong>for</strong>mation is largely due to the difficulties <strong>of</strong> data collation <strong>and</strong> the absence <strong>of</strong><br />
interdisciplinary approaches to natural resource use patterns in all farming systems.<br />
Aquaculture, as the newly emerged farming system, on the present scale <strong>of</strong> activities,<br />
will in all probability have to take the lead in assessing comparative resource use,<br />
particularly in rural areas where the issue is pivotal.
36<br />
<strong>Study</strong> <strong>and</strong> <strong>analysis</strong> <strong>of</strong> <strong>feeds</strong> <strong>and</strong> <strong>fertilizers</strong> <strong>for</strong> <strong>sustainable</strong> aquaculture development<br />
TABLE 7<br />
Commonly available <strong>and</strong> potentially useful agricultural by-products <strong>and</strong> plants used in Asian aqua<strong>feeds</strong>.<br />
Where available, estimates <strong>of</strong> availability is in thous<strong>and</strong> tonnes/year. Figures in parentheses indicate current<br />
estimated usage in aqua<strong>feeds</strong><br />
Ingredient<br />
Bangladesh China India* Indonesia Philippines** Thail<strong>and</strong> Viet Nam<br />
Plants/leaf meals<br />
Azolla +<br />
Cassava + 201 +<br />
Duckweed + + +<br />
Leucaena + 0.6<br />
Spirulina + +<br />
Water hyacinth<br />
Water velvet<br />
Brans<br />
+ + +<br />
Black gram + +<br />
Corn 1 137 4 000 (79)<br />
Lentil +<br />
Rice 1 254 + 3 000–3 500 + 1 450 + 3 350 (300–500)<br />
Wheat<br />
Oil cakes<br />
+ + 2 000–2 500 + + +<br />
Coconut 86 140–160 + 704 (9.6) +<br />
Cottonseed 4 000–5 000 750–800<br />
Groundnut 30 14 000–15 000 8 000–8 500 +<br />
Linseed + 100<br />
Mustard/rapeseed 234 5 000–5 800<br />
Rapeseed 5 000 (4 000)<br />
Sesame + 450–500<br />
Soybean meal/<br />
cake<br />
15 500–17 550 5 000–5 500 + (55.4) 298 (141) 1 185 (80–132)<br />
Sunflower<br />
Others<br />
Corn gluten<br />
+ 800–1 000<br />
Corn meal + + + + 3 735 + +<br />
Molasses + + +<br />
Pulses + +<br />
Rice (broken) + + + 399 2 010<br />
Sorghum 7 500–8 000 +<br />
Tapioca/cassava 5 600–6 000 + 1 040 + 5 230 (30–45)<br />
Wheat flour + + + + +<br />
Wheat gluten + +<br />
*Current usage in aquaculture: rice <strong>and</strong> wheat bran 85.8 thous<strong>and</strong> tonnes, oil cakes/meals 39.0 thous<strong>and</strong> tonnes, marine<br />
ingredients 75.5 thous<strong>and</strong> tonnes, cereal 30.0 thous<strong>and</strong> tonnes, others 2.6 thous<strong>and</strong> tonnes; **current usage in aquaculture: rice<br />
bran/corn bran/wheat flour 94 thous<strong>and</strong> tonnes.<br />
Source: data <strong>for</strong> Bangladesh, China, India, Indonesia, the Philippines, Thail<strong>and</strong> <strong>and</strong> Viet Nam were obtained respectively from<br />
Barman <strong>and</strong> Karim (2007); Weimin <strong>and</strong> Mengqing (2007); Ayyappan <strong>and</strong> Ahamad Ali (2007); Nur (2007); Sumagaysay-Chavoso<br />
(2007); Thongrod (2007); <strong>and</strong> Hung <strong>and</strong> Huy (2007)<br />
4.5.2 Animal industry by-products used in aqua<strong>feeds</strong><br />
a) The animal husb<strong>and</strong>ry industry<br />
Asia, particularly China, India <strong>and</strong> Thail<strong>and</strong>, has considerably large animal husb<strong>and</strong>ry<br />
industries, in particular poultry <strong>and</strong> pig industries. The processing waste resulting from<br />
these industries are substantial. Overall, the use <strong>of</strong> animal husb<strong>and</strong>ry by-products,<br />
such as bone meal, blood meal <strong>and</strong> feather meal, is not adequately organized such<br />
that the use <strong>of</strong> many <strong>of</strong> these highly nutritious materials, even though there are no<br />
legal restrictions (e.g. such as in the use <strong>of</strong> bone meal in Europe), is rather sporadic<br />
<strong>and</strong> isolated. The approximate availability <strong>of</strong> potentially useful animal industry byproducts<br />
<strong>for</strong> aqua<strong>feeds</strong> is presented in Table 8.
Feeds <strong>and</strong> <strong>fertilizers</strong>: the key to long-term sustainability <strong>of</strong> Asian aquaculture 37<br />
In most instances, animal industry by-products are mainly used <strong>for</strong> farm-made<br />
<strong>feeds</strong> <strong>and</strong> are rarely incorporated into commercial <strong>feeds</strong>.<br />
b) Fishing industry by-products<br />
The nutrient composition <strong>of</strong> fish by-products, from the surimi industry, fish canning<br />
industries, filleting plants <strong>and</strong> the like has been shown to be very close to that <strong>of</strong><br />
fishmeal (Gunasekera et al., 2002). This clearly indicates the potential <strong>of</strong> these resources<br />
as a possible replacement <strong>for</strong> fishmeal in aqua<strong>feeds</strong>. For example, it has been estimated<br />
that India produces some 340 000 tonnes <strong>of</strong> fish industry waste that is available <strong>for</strong><br />
aqua<strong>feeds</strong>.<br />
With one or two exceptions, the only by-product that has been used to any<br />
substantial extent in Asian aqua<strong>feeds</strong> is shrimp processing waste, primarily in the <strong>for</strong>m<br />
<strong>of</strong> shrimp head meal. A recent development in Viet Nam is the use <strong>of</strong> processing waste<br />
from Pangasius catfish culture. Viet Nam is the largest producer <strong>of</strong> pangasiid catfish<br />
(Pangasius hypophthalamus <strong>and</strong> P. bocoutii) in the region, producing around 300 000<br />
tonnes per annum, which generates approximately 210 000 tonnes <strong>of</strong> waste (Hung <strong>and</strong><br />
Huy, 2007; Hung, Truc <strong>and</strong> Huy, 2007). The bulk <strong>of</strong> the waste is used <strong>for</strong> the extraction<br />
<strong>of</strong> oil <strong>and</strong> <strong>for</strong> inclusion in farm-made <strong>feeds</strong>. This is unique <strong>and</strong> illustrates how<br />
aquaculture waste can be used efficiently <strong>and</strong> effectively. Considering that aquaculture<br />
in Asia is <strong>of</strong>ten practised in sizeable clusters, the strategy adopted in the Mekong delta<br />
should be replicated in areas where there are adequate volumes <strong>of</strong> waste products. This<br />
could result in significant cost savings <strong>and</strong> employment in a region.<br />
TABLE 8<br />
Commonly available animal industry by-products (thous<strong>and</strong> tonnes) in several Asian countries. Figures in<br />
parentheses indicate current estimated usage in aqua<strong>feeds</strong><br />
Ingredient<br />
Country<br />
Bangladesh China India Indonesia Philippines Thail<strong>and</strong> Viet Nam<br />
Blood meal + + + 46.8 +<br />
Meat <strong>and</strong> bone meal + + 55.2 243.5 +<br />
Catfish waste 210<br />
Feather meal + + 23.0 +<br />
Fishmeal + + 202–208 + (30.6) 611<br />
(234.5)<br />
Fish silage +<br />
Krill meal +<br />
Nereis meal +<br />
Poultry <strong>of</strong>fal 65 45.9 +<br />
Shrimp meal + 106 +<br />
248–255<br />
(46.5–62.5)<br />
Shrimp head meal 31 + 7.2 (1.7) + 60–70<br />
Silk worm pupae + + 40<br />
Slaughterhouse waste + + +<br />
Snail meal +<br />
Squid meal + 19–21 +<br />
Trash fish 5 316* + 756*<br />
(131.9)<br />
933.2<br />
(176.4–363.4)<br />
Source: data <strong>for</strong> Bangladesh, China, India, Indonesia, the Philippines, Thail<strong>and</strong> <strong>and</strong> Viet Nam were obtained respectively from<br />
Barman <strong>and</strong> Karim (2007); Weimin <strong>and</strong> Mengqing (2007); Ayyappan <strong>and</strong> Ahamad Ali (2007); Nur (2007); Sumagaysay-Chavoso<br />
(2007); Thongrod (2007); <strong>and</strong> Hung <strong>and</strong> Huy (2007). *Fung-Smith et al. (2005)
38<br />
<strong>Study</strong> <strong>and</strong> <strong>analysis</strong> <strong>of</strong> <strong>feeds</strong> <strong>and</strong> <strong>fertilizers</strong> <strong>for</strong> <strong>sustainable</strong> aquaculture development<br />
c) Trash fish<br />
Asian finfish mariculture, particularly grouper <strong>and</strong> cobia farming, is growing rapidly<br />
in China, Viet Nam <strong>and</strong> Indonesia <strong>and</strong> is largely still dependent on trash fish as a feed.<br />
It has been estimated that Viet Nam will use nearly one million tonnes <strong>of</strong> trash fish<br />
<strong>and</strong> China will require approximately 4 million tonnes <strong>of</strong> trash fish by 2013 to sustain<br />
marine cage culture activities. Trash fish is mainly obtained from commercial marine<br />
fisheries although a fair share is also supplied by artisanal fisheries, particularly in Viet<br />
Nam. The supply <strong>of</strong> trash fish in Asia is highly seasonal <strong>and</strong> dwindling (Edwards,<br />
Tuan <strong>and</strong> Allan, 2004). However, the dem<strong>and</strong> <strong>for</strong> the commodity by the marine finfish<br />
culture sector in many countries is high <strong>and</strong> increasing. There is a growing concern<br />
with regard to the environmental effects <strong>of</strong> using trash fish in aquaculture. Moreover,<br />
its efficacy as an aquafeed is debateable <strong>and</strong> its preferred use appears in many instances<br />
to be based more on farmer perceptions than economic reality. For example, a recent<br />
study on grouper cage culture in Viet Nam showed that the average survival, FCR <strong>and</strong><br />
cost <strong>of</strong> production using <strong>for</strong>mulated pellets were 62.2 percent, 2.12:1 <strong>and</strong> US$2.18/kg<br />
as opposed to 54.5 percent, 7.38:1 <strong>and</strong> US$2.58 using trash fish, respectively (Anon.,<br />
2006).<br />
There is an urgent need to reduce the dependence <strong>of</strong> the industry on trash fish in<br />
the ensuing years. This can only be achieved through the development <strong>of</strong> suitable dry,<br />
pellet <strong>feeds</strong> <strong>and</strong> appropriate on-farm R&D activities to convince farmers <strong>of</strong> the benefits<br />
<strong>of</strong> being less reliant on trash fish.<br />
4.6 Aquafeed <strong>for</strong>mulations<br />
4.6.1 Farm-made <strong>and</strong> or “semi-commercial” <strong>for</strong>mulations<br />
As mentioned above, semi-intensive finfish culture is the dominant aquaculture<br />
practice in Asia <strong>and</strong> is primarily dependent on farm-made <strong>and</strong>/or “semi-commercially”<br />
prepared aqua<strong>feeds</strong>. The <strong>for</strong>mulations <strong>of</strong> these <strong>feeds</strong> differ considerably regionally <strong>and</strong><br />
nationally (Table 9) <strong>and</strong> are mostly determined by ingredient availability <strong>and</strong> cost.<br />
In general however, a few base ingredients are used <strong>and</strong> these normally are soybean<br />
meal, wheat flour <strong>and</strong> rice bran, supplemented with fishmeal or with an ingredient that<br />
matches the composition <strong>of</strong> fishmeal as closely as possible. It is however, difficult to<br />
generalise as farm-made <strong>feeds</strong> may be very species specific (Table 10).<br />
Efficacy <strong>of</strong> farm-made <strong>and</strong> or “semi-commercial” <strong>feeds</strong><br />
Considering that the bulk <strong>of</strong> aquaculture production in Asia is dependent on<br />
farm-made <strong>and</strong> or “semi-commercial” aqua<strong>feeds</strong> <strong>and</strong> the fact that there has been a<br />
considerable increase in aquaculture production over the past decade, it is reasonable<br />
to conclude that the efficacy <strong>of</strong> these <strong>feeds</strong> has contributed substantially to the growth<br />
<strong>of</strong> the sector. However, this fact <strong>of</strong>ten goes un-noticed <strong>and</strong> receives little attention.<br />
A possible way to infer the efficacy <strong>of</strong> these <strong>feeds</strong> is to consider production levels in<br />
different culture systems (Table 11). From these data it is evident that the production<br />
levels <strong>for</strong> a variety <strong>of</strong> systems are substantial, especially considering the level <strong>of</strong> inputs<br />
<strong>and</strong> the capital investment. It would be most useful to obtain more detailed data on<br />
these aspects <strong>and</strong> to conduct a comprehensive <strong>analysis</strong>. This would no doubt provide<br />
valuable in<strong>for</strong>mation to increase production even further. The recent changes in<br />
pangasiid culture (see above <strong>and</strong> Hung, Truc <strong>and</strong> Huy, 2007) (Figure 9) serves as a good<br />
example to illustrate this point. Clearly, many more such focused studies are needed<br />
to increase our underst<strong>and</strong>ing <strong>of</strong> farm-made <strong>feeds</strong>, which can only result in bringing<br />
about further improvements in feed efficacy.
Feeds <strong>and</strong> <strong>fertilizers</strong>: the key to long-term sustainability <strong>of</strong> Asian aquaculture 39<br />
TABLE 9<br />
Examples <strong>of</strong> ingredient composition (arranged in descending order <strong>of</strong> inclusion level) <strong>and</strong> other relevant in<strong>for</strong>mation, where available, <strong>for</strong> selected farm-made <strong>feeds</strong> (<strong>for</strong><br />
grow-out unless otherwise stated) in selected Asian countries<br />
Country/Species Ingredients Preparation/ feeding Cost (US$/kg) % Protein<br />
Bangladesh<br />
Carps MOC, RB/WB Made into wet balls<br />
Pangasius (catfish) RB, MOC, WF, WB, RB, FM, BM MOC is soaked <strong>for</strong> 24 h <strong>and</strong> mixed with other ingredients;<br />
made into balls<br />
Carp <strong>and</strong> shrimp MOC, DFM, RB, WF, molasses 0.25<br />
28.5<br />
RSM, SBM, WF, corn, WB, FM, binder NA NA<br />
Shrimp RB, MOC, WF, molasses<br />
China (only selected examples are given)<br />
Tilapia (grow out) SBM, wheat middling., corn, PBM FM, VO, VMPM Where needed ingredients are minced <strong>and</strong> / or ground<br />
Common carp, crucian carp,<br />
<strong>and</strong> mixed <strong>and</strong> then cooked<br />
tilapia<br />
Grass carp, amur bream RSM, WF, corn, WB, SBM, binder<br />
Chinese mitten crab SBM, RSM, FM, WF, WB, shell meal, MIA, others NA NA<br />
Giant freshwater prawn SBM, RSM, WF, FM, WB, shell meal, binder, VMPM NA NA<br />
India<br />
Indian major carps RB, PC, CSC 0.10 20<br />
0.45<br />
Shrimp- made to order DFM, mantis shrimp, sergestid shrimp, SBM, SWP, MG, WF,<br />
GRM, RB, FO<br />
Indonesia<br />
Juvenile grouper TF, FM, GRM, cassava starch, FO Moist feed- prepared daily 48<br />
Philippines<br />
Milkfish RB, SBM, FM, FO 0.38 26.7<br />
Tilapia Cassava flour, SBM, FM, CM, RB, VMPM 0.56 28.1<br />
Catfish SBM, RB, FM, WF, SBO, VMPM 0.40 34.2<br />
Grouper FM, MBM, BM, SM, SBM, VM, FO, VMPM 1.30 44.0<br />
Mudcrab MBM, FM, WF, RB, CB, SW 0.78 40.1<br />
Tiger prawn FM, SBM, SM, WF, RB, SW, FO, SBO, cholesterol, VMPM 0.81 41.7<br />
Thail<strong>and</strong><br />
Walking catfish <strong>and</strong> tilapia FM, cassava starch, RB, VO, VMPM, binder Ground, mixed <strong>and</strong> fed; prepared daily; may use feed<br />
0.45 37.5<br />
(larvae)<br />
bags<br />
Walking catfish (grow out) SMB, dried cassava, coconut meal, CM, FM, FO, VPM 0.24 28<br />
Shrimp, carnivorous marine TF, other ingredients, VMPM Ground, extruded, cooked; cooked feed cooled; packed<br />
NA NA<br />
fish<br />
<strong>and</strong> stored in ice; shelf life 1 week<br />
Viet Nam<br />
Catfish RB, TF, SBM Mixed <strong>and</strong> ground on site<br />
Grouper TF Chopped <strong>and</strong> fed<br />
CB- corn bran; CM- coconut meal; CSC- cotton seed cake; DFM- dry fishmeal; FM- fishmeal; FO- fish oil; GRM- groundnut meal; MBM- meat <strong>and</strong> bone meal; MG- maize gluten; MIA- moult inducing agent;<br />
MOC- mustard oil cake; PC- peanut cake; RB- rice bran; RSM- rape seed meal; SM- shrimp meal; SBM- soybean meal; SBO-soybean oil; SW- seaweed; SWP- silk worm pupae; TF- trash fish; VO- vegetable oil;<br />
WB- wheat bran; WF- wheat flour, WG- wheat gluten; WM- wheat meal, PBM- poultry by-product meal, VMPM- Vitamin <strong>and</strong> mineral premix<br />
Source: data <strong>for</strong> Bangladesh, China, India, Indonesia, the Philippines, Thail<strong>and</strong> <strong>and</strong> Viet Nam were obtained respectively from Barman <strong>and</strong> Karim (2007); Weimin <strong>and</strong> Mengqing (2007); Ayyappan <strong>and</strong> Ahamad<br />
Ali (2007); Nur (2007); Sumagaysay-Chavoso (2007); Thongrod (2007); <strong>and</strong> Hung <strong>and</strong> Huy (2007)
40<br />
<strong>Study</strong> <strong>and</strong> <strong>analysis</strong> <strong>of</strong> <strong>feeds</strong> <strong>and</strong> <strong>fertilizers</strong> <strong>for</strong> <strong>sustainable</strong> aquaculture development<br />
TABLE 10<br />
Different feed <strong>for</strong>mulations <strong>for</strong> two pangasiid catfish (Pangasius hypophthalamus <strong>and</strong><br />
P. bocoutii) in the Mekong Delta<br />
Ingredients Formulation 1 Formulation 2<br />
Trash fish 20–30%<br />
Rice bran 50–70% 40–50%<br />
Broken rice 10–20% -<br />
Soybean meal - 20–30%<br />
Fish by-products - 10 –30%<br />
Others (corn, vegetables) - 20%<br />
Source: Hung, Truc <strong>and</strong> Huy (2007)<br />
TABLE 11<br />
Production levels using farm-made <strong>and</strong> or “semi-commercial” aqua<strong>feeds</strong> in different countries<br />
Country/ Species groups Type <strong>of</strong> culture Production (kg/ha/year)<br />
Bangladesh<br />
India<br />
Major carps Pond/polyculture 2 000–3 000<br />
Shrimp/ carps Pond 2 800–3 000<br />
Major carps Pond/polyculture 5 000–8 000<br />
Philippines<br />
Milkfish Pond/monoculture 1 500–3 500*<br />
Viet Nam<br />
Pangasiid catfish Cage culture 150–200**<br />
*kg/ha/crop; **kg/m 3 /crop<br />
Source: data <strong>for</strong> Bangladesh, India, the Philippines, <strong>and</strong> Viet Nam were obtained respectively from Barman <strong>and</strong><br />
Karim (2007); Ayyappan <strong>and</strong> Ahamad Ali (2007); Sumagaysay-Chavoso (2007); <strong>and</strong> Hung <strong>and</strong> Huy (2007)<br />
The future <strong>of</strong> farm-made <strong>feeds</strong><br />
It is important to note that production per unit area has increased over the years with<br />
the use <strong>of</strong> farm-made <strong>and</strong> or “semi-commercially” aqua<strong>feeds</strong>. This increase is at least<br />
partially attributable to improvements in feed <strong>for</strong>mulations as well as improvements<br />
in the processing techniques. As pointed out previously, such improvements as<br />
well as the increasing trend to include vitamin <strong>and</strong> mineral pre-mixes <strong>and</strong> binders<br />
are mostly brought about by farmer interventions <strong>and</strong> this has led to greater feed<br />
utilization efficiency. Over a decade ago, De Silva <strong>and</strong> Davy (1992) identified the need<br />
<strong>for</strong> a concerted research ef<strong>for</strong>t on farm-made <strong>feeds</strong>. They suggested then that farmmade<br />
<strong>feeds</strong> will continue to constitute the “back-bone” <strong>of</strong> aquaculture in Asia <strong>and</strong><br />
those improvements to these <strong>feeds</strong> could result in very significant production gains.<br />
For the following reason this call is made again. Farmers have continued to bring<br />
about improvements to feed <strong>for</strong>mulations primarily based on trial <strong>and</strong> error. If such<br />
improvements were to be backed up with focused research then farm-made <strong>feeds</strong> will<br />
make an even greater contribution to the <strong>sustainable</strong> development <strong>of</strong> aquaculture in<br />
Asia.<br />
Finally, there is an unknown factor in relation to the efficacy <strong>of</strong> farm-made <strong>feeds</strong>.<br />
It is not known how much <strong>of</strong> the feed provided is utilized directly as opposed to its<br />
indirect “fertilizer” value. The latter may be an important factor that could provide<br />
clues <strong>for</strong> further increasing the efficacy <strong>of</strong> these <strong>feeds</strong>, there<strong>for</strong>e bringing about a saving<br />
in ingredient use <strong>and</strong> costs.<br />
Constraints <strong>and</strong> needs<br />
As pointed out above, the lack <strong>of</strong> research has impeded <strong>and</strong> constrained developments<br />
in farm-made <strong>and</strong> or “semi-commercial” aqua<strong>feeds</strong>. In addition, there are other local<br />
constraints that operate <strong>and</strong> hinder growth in the sector. Foremost among these,<br />
is the availability <strong>of</strong> key ingredients <strong>and</strong> access to these on a regular basis. This is<br />
primarily a consequence <strong>of</strong> poor market chains, which in turn may be a reflection
Feeds <strong>and</strong> <strong>fertilizers</strong>: the key to long-term sustainability <strong>of</strong> Asian aquaculture 41<br />
<strong>of</strong> the scant recognition by the<br />
authorities <strong>of</strong> the importance <strong>of</strong><br />
efficient distribution channels<br />
to aquaculture production. The<br />
provision <strong>of</strong> suitable credit,<br />
storage facilities <strong>and</strong> the like,<br />
in a given region, may mitigate<br />
against some <strong>of</strong> these factors.<br />
Given that a high proportion<br />
<strong>of</strong> aqua<strong>feeds</strong> is made by<br />
small, semi-commercial feed<br />
processors there is an increasing<br />
need to provide suitable support<br />
<strong>for</strong> this manufacturing sector.<br />
This would facilitate greater<br />
efficiency, which would result<br />
in overall feed cost reductions<br />
<strong>and</strong> enhance productivity. Most<br />
importantly, this sector needs<br />
easier access to credit such that<br />
they can improve their storage<br />
as well as processing facilities.<br />
The development <strong>of</strong> this<br />
important feed manufacturing<br />
Production cost per kg fish (US$)<br />
FIGURE 9<br />
Comparison <strong>of</strong> the efficacy <strong>of</strong> farm-made versus pellet <strong>feeds</strong> in<br />
pangasiid aquaculture in the Mekong Delta<br />
1.00<br />
0.80<br />
0.60<br />
0.40<br />
0.20<br />
0.00<br />
sector would also be greatly facilitated by training extension <strong>of</strong>ficers to monitor <strong>and</strong><br />
provide advice on ingredient selection, feed <strong>for</strong>mulation <strong>and</strong> processing. This will<br />
enhance farmer <strong>and</strong> processor confidence <strong>and</strong> stimulate the adoption <strong>of</strong> new <strong>and</strong> cost<br />
effective <strong>for</strong>mulations.<br />
4.6.2 Commercial <strong>for</strong>mulations<br />
Commercial aquafeed <strong>for</strong>mulations are <strong>of</strong>ten considered as “trade secrets” <strong>and</strong> are not<br />
generally available to the public. The bulk <strong>of</strong> aquafeed production in Asia comprises<br />
shrimp <strong>feeds</strong>. Current regulations require the manufacturer to provide in<strong>for</strong>mation<br />
on the quantity in each container, the type <strong>of</strong> feed <strong>and</strong> its gross nutrient composition.<br />
Needless to say, quality control measures with respect to food products in Asia are<br />
not as stringent as in the developed world, <strong>and</strong> aqua<strong>feeds</strong> are no exception in this<br />
regard. For example, a recent study has shown that in the majority <strong>of</strong> <strong>feeds</strong> the protein<br />
content was overestimated, whilst the fibre <strong>and</strong> the fat content were underestimated<br />
(Kader, Hossain <strong>and</strong> Hasan, 2005). Similarly, poor gonadal recrudescence <strong>and</strong> the<br />
consequent inability to artificially propagate two mahseer species (Tor tambroides <strong>and</strong><br />
T. douronensis) in Sarawak, East Malaysia, was attributed to sub-st<strong>and</strong>ard (no HUFA)<br />
commercial <strong>feeds</strong> on which these fish were reared (Ingram et al., 2005).<br />
4.6.3 The need <strong>for</strong> regulatory measures<br />
Many <strong>of</strong> the Asian countries have recently introduced <strong>and</strong> or are in the process <strong>of</strong><br />
introducing quality control measures <strong>for</strong> commercial aqua<strong>feeds</strong>. However, in most<br />
cases such regulations are restricted to the minimum <strong>and</strong> maximum inclusion levels<br />
<strong>of</strong> the gross nutrients <strong>for</strong> a particular species or life history stage. In general there are<br />
no regulations on heavy metal <strong>and</strong> or other organic compounds contents that may<br />
affect human health. Exporters <strong>of</strong> aquaculture products have to comply with stringent<br />
health <strong>and</strong> quality control measures <strong>and</strong> <strong>for</strong> this reason farmers require more detailed<br />
in<strong>for</strong>mation. Moreover, regulations are effectively quite useless if they are not en<strong>for</strong>ced<br />
through a regular monitoring programme.<br />
0.62<br />
0.64<br />
Source: Hung, Truc <strong>and</strong> Huy (2007)<br />
Farm-made feed Pellet<br />
0.55<br />
Cage Pond<br />
Culture facilities<br />
0.60
42<br />
<strong>Study</strong> <strong>and</strong> <strong>analysis</strong> <strong>of</strong> <strong>feeds</strong> <strong>and</strong> <strong>fertilizers</strong> <strong>for</strong> <strong>sustainable</strong> aquaculture development<br />
5. MAJOR TRENDS IN RELATION TO AQUAFEEDS IN ASIAN AQUACULTURE<br />
Although there is a general increase in the use <strong>of</strong> commercial <strong>feeds</strong> in most Asian countries<br />
this trend is <strong>of</strong>ten masked by changes that are occurring in semi-intensive aquaculture.<br />
Increasingly, small-scale semi-intensive farmers are mechanizing their farm-made feed<br />
processing facilities, mostly through improvisation <strong>and</strong> adaptation <strong>of</strong> old machinery<br />
meant <strong>for</strong> other purposes. The other notable trend (see above) is the rapid growth <strong>of</strong> the<br />
“semi-commercial” feed processors, who provide customised <strong>for</strong>mulations on dem<strong>and</strong><br />
<strong>and</strong> in small, af<strong>for</strong>dable quantities. This trend is most prevalent in Bangladesh <strong>and</strong> India,<br />
with the Philippines following suite. This practice enables the farmer to contain feed costs<br />
<strong>and</strong> hence is in a better position to manage the cash flow <strong>of</strong> the enterprise. This practice<br />
also allows the farmer to test various feed <strong>for</strong>mulations at virtually no extra cost. As<br />
referred to above, such farmer initiated trials have contributed substantially to increased<br />
production levels. If a system were to be introduced to monitor the composition <strong>of</strong> the<br />
<strong>feeds</strong> on a regular basis <strong>and</strong> to link this with the seasonal availability <strong>of</strong> ingredients then<br />
further improvements <strong>and</strong> cost savings could most certainly be achieved.<br />
During the last decade finfish mariculture has become increasingly dependent on<br />
trash fish. This is a major concern <strong>and</strong> <strong>for</strong> several reasons is unlikely to be <strong>sustainable</strong><br />
in the long-term. The reasons include the rapidly dwindling “trash fish” resource<br />
(Edwards, Tuan <strong>and</strong> Allan, 2004), environmental degradation resulting from the use <strong>of</strong><br />
trash fish <strong>and</strong> most importantly the growing public perception <strong>and</strong> awareness that the<br />
resource should be used <strong>for</strong> food instead <strong>of</strong> an animal feed. There is an urgent need to<br />
address this dilemma. The only possible option is <strong>for</strong> finfish mariculture operators to<br />
shift from using trash fish to “semi-commercial” or commercial aqua<strong>feeds</strong>. To expedite<br />
this shift may require the setting up <strong>of</strong> mariculture demonstration units to convince the<br />
practitioners <strong>of</strong> the benefits <strong>of</strong> using specifically <strong>for</strong>mulated <strong>feeds</strong>.<br />
6. ASIAN AQUAFEEDS IN A GLOBAL CONTEXT: ISSUES AND CHALLENGES<br />
Since the initial coining <strong>of</strong> the term “the fishmeal trap” <strong>and</strong> its potential consequences on<br />
aquaculture developments (Wijkstrom <strong>and</strong> New, 1989), much water has “flown under<br />
the bridge”. Public concern regarding the use <strong>of</strong> fishmeal <strong>and</strong> fish oil in aquaculture<br />
has taken centre stage <strong>and</strong> has generated much controversy <strong>and</strong> debate (Naylor et al.,<br />
2000). Two facts can be discerned from the controversies:<br />
• Most <strong>of</strong> the criticisms were aimed at salmonid culture; <strong>and</strong><br />
• Many <strong>of</strong> the issues raised can, to a great extent, be refuted as the data that were<br />
used <strong>for</strong> the analyses are not necessarily fool pro<strong>of</strong> in trying to illustrate the<br />
detrimental effects <strong>of</strong> salmon culture on the environment in a holistic manner.<br />
Similarly, there is increasing public concern about the overall impacts <strong>of</strong> aquaculture<br />
on environmental quality. Needless to say, the onus is on aquaculture, particularly<br />
salmonid aquaculture, to defend its position <strong>and</strong> to clean up its act where necessary.<br />
But what does all this mean <strong>for</strong> Asian aquaculture?<br />
Tacon (2004) estimated that fishmeal usage by 2010 (Figure 10) <strong>for</strong> carnivorous,<br />
temperate fish aquaculture will probably decrease by 10.7 percent to 305 378 tonnes<br />
<strong>and</strong> that fishmeal use <strong>for</strong> tropical fish aquaculture (carps, tilapia, milk fish, Chinese<br />
bream, etc), particularly in Asia, will increase by 7 percent to 713 500 tonnes. It is<br />
suggested that the reduction in fishmeal usage by carnivorous species aquaculture will<br />
be primarily achieved through decreases in the dietary protein content <strong>of</strong> <strong>feeds</strong> <strong>and</strong><br />
there<strong>for</strong>e the level <strong>of</strong> fishmeal inclusion. By 2010, Asia is also expected to account <strong>for</strong><br />
another 25 percent <strong>of</strong> global fishmeal usage <strong>for</strong> shrimp <strong>feeds</strong> <strong>and</strong> that this will amount<br />
to 713 500 tonnes. Based on these estimates Asia will use a minimum <strong>of</strong> 50 percent<br />
<strong>of</strong> global fishmeal production. Tacon (2004) also projected that “marine species”<br />
aquaculture, by 2010, will use 27.1 percent <strong>of</strong> the global fishmeal supply. Given that<br />
Asian marine finfish culture is currently based largely on trash fish it is difficult to<br />
estimate what proportion <strong>of</strong> this will be consumed in Asia.
Feeds <strong>and</strong> <strong>fertilizers</strong>: the key to long-term sustainability <strong>of</strong> Asian aquaculture 43<br />
FIGURE 10<br />
Current <strong>and</strong> projected commercial feed usage by different categories <strong>of</strong> cultured finfish<br />
groups <strong>and</strong> shrimp<br />
Percent utilisation <strong>of</strong> fish meal<br />
30<br />
25<br />
20<br />
15<br />
10<br />
5<br />
0<br />
Source: Tacon (2004)<br />
Marine<br />
fish<br />
2001 2010<br />
Salmon Trout Eels Carps Milkfish Catfish Tilapia Shrimp<br />
On the assumption that Tacon’s (2004) projections are reasonable it is clear that the<br />
aquafeed industry in Asia, in the <strong>for</strong>eseeable future, will have to find ways <strong>and</strong> means<br />
<strong>of</strong> reducing fishmeal usage. The biggest challenge lies in the reduction <strong>of</strong> fishmeal usage<br />
in aqua<strong>feeds</strong> <strong>for</strong> omnivorous species.<br />
7. POLICY DEVELOPMENTS<br />
It is difficult to pin-point significant policy developments that have facilitated aquafeed<br />
production in Asia. One reason <strong>for</strong> this may be that the aquafeed sector is too small to<br />
have gained recognition <strong>and</strong> attention by government planners, except perhaps in Viet<br />
Nam, where the sector is increasingly recognized as a significant contributor to <strong>for</strong>eign<br />
exchange earnings <strong>and</strong> national GDP.<br />
The aquafeed sector in most Asian countries is dependent on a number <strong>of</strong> imported<br />
ingredients, most notably fishmeal <strong>and</strong> additives <strong>and</strong> will continue to be so well into<br />
the <strong>for</strong>eseeable future. Perhaps one <strong>of</strong> the most important policy developments that<br />
should be considered is the provision <strong>of</strong> appropriate tax incentives to small-scale feed<br />
processors <strong>and</strong> the reduction <strong>and</strong>/or abolition <strong>of</strong> import duties on selected ingredients.<br />
It is common knowledge that some <strong>of</strong> the larger aquafeed companies in the major<br />
aquaculture countries in the region are recording large pr<strong>of</strong>it margins, while the<br />
small-scale processors rarely make sufficient pr<strong>of</strong>its to enable expansion, resulting<br />
in decreasing competitiveness in the market place. This is not a healthy trend <strong>for</strong> the<br />
sector in general. It may be worthwhile <strong>for</strong> countries to consider levying a fee on<br />
unit tonnage production by manufactures whose capacity <strong>and</strong> market share exceeds a<br />
certain proportion. This revenue could be used <strong>for</strong> research <strong>and</strong> development activities.<br />
However, such steps have to be in con<strong>for</strong>mity with other feed manufacturing industries<br />
in the primary production sector <strong>and</strong> have to be assessed <strong>and</strong> determined on a country<br />
wise basis.<br />
8. FUTURE NEEDS<br />
The <strong>for</strong>emost future task <strong>of</strong> the aquafeed industry in Asia will be to reduce its<br />
dependence on trash fish <strong>and</strong> fishmeal (<strong>and</strong> oil). Clearly, there will have to be a shift<br />
from trash fish usage to farm-made, “semi-commercial” <strong>feeds</strong> <strong>and</strong> or commercial <strong>feeds</strong>.
44<br />
<strong>Study</strong> <strong>and</strong> <strong>analysis</strong> <strong>of</strong> <strong>feeds</strong> <strong>and</strong> <strong>fertilizers</strong> <strong>for</strong> <strong>sustainable</strong> aquaculture development<br />
Such changes will have to involve a fair quantum <strong>of</strong> research <strong>and</strong> development work,<br />
which will have to go h<strong>and</strong> in h<strong>and</strong> with extension services to facilitate the change. To<br />
reduce the use <strong>of</strong> fishmeal in commercial <strong>feeds</strong> will be more difficult <strong>and</strong> can only be<br />
affected by the industry. There has been on-going research on fishmeal substitution<br />
<strong>for</strong> almost all species that are cultured in Asia. Some <strong>of</strong> the results are encouraging but<br />
findings are rarely translated into commercial practice. The reasons <strong>for</strong> this are not clear<br />
but a remedy has to be found. Perhaps feed manufacturers do not perceive the need to<br />
change because <strong>of</strong> their current market share <strong>and</strong> pr<strong>of</strong>it margins. Alternatively, there<br />
may be genuine practical problems in translating the research results into commercial<br />
practise. Irrespective <strong>of</strong> the reason or reasons there is a need <strong>for</strong> urgent dialogue as the<br />
sector as a whole faces serious challenges <strong>and</strong> these can only be wholly or partially<br />
solved through cooperation <strong>and</strong> involvement by all.<br />
It is most likely that the current regional growth <strong>of</strong> the aquaculture sector will<br />
be sustained largely by improvements in farm-made <strong>and</strong> or “semi-commercial” feed<br />
<strong>for</strong>mulation <strong>and</strong> processing. It was previously concluded that most <strong>of</strong> the advances in<br />
the efficacy <strong>of</strong> these feed can be attributed to farmers. To meet the needs <strong>and</strong> future<br />
dem<strong>and</strong>s <strong>of</strong> the aquaculture sector it is imperative to launch a concerted research<br />
ef<strong>for</strong>t on farm-made <strong>feeds</strong> <strong>and</strong> in particular on ingredient quality, seasonal variability,<br />
marketing <strong>and</strong> storage, improvements in processing technology, feed <strong>for</strong>mulation <strong>and</strong><br />
the most effective way <strong>of</strong> presenting the <strong>feeds</strong>. As most semi-intensive aquaculture<br />
practices <strong>and</strong> their ancillary industries occur in clusters findings will be easily<br />
disseminated <strong>and</strong> adopted by the practitioners.<br />
More <strong>and</strong> more farm-made <strong>feeds</strong> are likely to be processed by dedicated smallscale<br />
feed processors in future <strong>and</strong> feed “manufacturing/ processing” chains are likely<br />
to develop in most clusters. To facilitate this process will require the engagement <strong>of</strong><br />
suitable qualified aquaculture extension workers.<br />
There is a substantial in<strong>for</strong>mation on the nutritional requirements <strong>of</strong> almost all<br />
major fish <strong>and</strong> crustacean species cultured in Asia, as well as in<strong>for</strong>mation on apparent<br />
digestibilities, fishmeal substitution <strong>and</strong> other related aspects. The synoptic collation <strong>of</strong><br />
this in<strong>for</strong>mation <strong>for</strong> each species will help to eliminate duplication <strong>of</strong> research ef<strong>for</strong>ts<br />
<strong>and</strong> will provide useful in<strong>for</strong>mation to bring about improved feed <strong>for</strong>mulations.<br />
The commercial aquafeed sector is not without its own problems, particularly the<br />
smaller manufacturers <strong>and</strong> the specialized feed mills that manufacture shrimp <strong>feeds</strong>.<br />
The highly seasonal nature <strong>of</strong> shrimp production <strong>for</strong>ces many <strong>of</strong> the manufacturers to<br />
operate far below their capacity, <strong>of</strong>ten making such operations barely viable. However,<br />
these manufacturers are <strong>of</strong>ten located in areas where culture practices are clustered,<br />
thereby reducing transport <strong>and</strong> storage costs. It is important that this sector is provided<br />
with appropriate incentives to remain economically viable.<br />
9. CONCLUSIONS<br />
Globally <strong>and</strong> in Asia, aquaculture faces a challenging decade ahead, particularly because<br />
<strong>of</strong> the increasing competition <strong>for</strong> primary resources <strong>and</strong> growing public concern <strong>and</strong><br />
perceptions about the sector. Added to all this are the increasingly stringent quality<br />
control measures imposed by exporters that may restrict aquaculture practices in<br />
future. Asian aquaculture has a predominantly rural, small-holder base <strong>and</strong> is likely to<br />
continue that way, except perhaps with regard to shrimp culture. This foundation is, in<br />
a way, advantageous <strong>for</strong> it to retain its momentum <strong>and</strong> sustainability.<br />
However, the momentum <strong>of</strong> Asian aquaculture can only be sustained if feed inputs<br />
do not become a limiting factor, <strong>and</strong> if further improvements are made to feed quality<br />
<strong>and</strong> availability at reasonable prices. In both semi-intensive <strong>and</strong> intensive aquaculture<br />
<strong>feeds</strong> <strong>of</strong>ten account <strong>for</strong> 40 to 60 percent <strong>of</strong> recurrent costs, <strong>and</strong> as pr<strong>of</strong>it margins in<br />
most aquaculture practices are relatively narrow, it is imperative that <strong>feeds</strong> are available<br />
at a reasonable price.
Feeds <strong>and</strong> <strong>fertilizers</strong>: the key to long-term sustainability <strong>of</strong> Asian aquaculture 45<br />
Asian aquaculture is dominated by semi-intensive production <strong>and</strong> the bulk <strong>of</strong><br />
production is dependent on farm-made <strong>and</strong>/or “semi-commercial” aqua<strong>feeds</strong>. Farmer<br />
ingenuity has led to significant improvements in feed <strong>for</strong>mulations <strong>and</strong> processing.<br />
To further improve these <strong>feeds</strong>, which are the key to sustaining the sector <strong>and</strong> its<br />
momentum, there is a need <strong>for</strong> a concerted research <strong>and</strong> development ef<strong>for</strong>t in all Asian<br />
countries, backed up by improved extension services.<br />
There has been a gradual increase in the use <strong>of</strong> commercial aqua<strong>feeds</strong> over the<br />
years in Asian aquaculture <strong>and</strong> this is principally attributable to the growth in shrimp<br />
culture, which has almost reached saturation levels in most countries. There is evidence<br />
to suggest that some aqua<strong>feeds</strong> do not con<strong>for</strong>m to their specified <strong>for</strong>mulations <strong>and</strong><br />
hence there is a need <strong>for</strong> more stringent regulatory measures. Furthermore, throughout<br />
Asia there is a need <strong>for</strong> the commercial feed industry to be more mindful <strong>of</strong> research<br />
results, particularly with respect to fishmeal replacement studies <strong>and</strong> hence there is a<br />
great need <strong>for</strong> improved dialogue between research <strong>and</strong> industry.<br />
The Asian finfish mariculture sector has to rapidly reduce its dependence on trash<br />
fish. Farmers must be encouraged to switch to commercial or other appropriate farmmade<br />
<strong>feeds</strong>. This may require regional government support. If this switch does not<br />
occur then finfish mariculture in Asia is doomed.<br />
The commercial aquafeed sector in Asia is dependent on fishmeal (<strong>and</strong> fish oil)<br />
imports. Furthermore, Asian aquaculture is not immune to global changes <strong>and</strong><br />
controversies that are emerging in regard to these key ingredients. Such changes<br />
tend to influence policy makers at national <strong>and</strong> international level. Consequently the<br />
Asian aquaculture industry needs to be proactive through suitable remedial <strong>and</strong> or<br />
mitigating measures. It is in this context <strong>and</strong> the fact that the bulk <strong>of</strong> Asian aquaculture<br />
production occurs in semi-intensive systems that it may be advantageous <strong>for</strong> the<br />
sector to concentrate its ef<strong>for</strong>ts on improving farm-made <strong>and</strong> or “semi-commercial”<br />
aqua<strong>feeds</strong> <strong>and</strong> developing more appropriate feeding practices.<br />
ACKNOWLEDGEMENTS<br />
The authors are thankful to the Food <strong>and</strong> Agriculture Organization <strong>of</strong> the United<br />
Nations <strong>and</strong> in particular to the Aquaculture Management <strong>and</strong> Conservation Service<br />
(FIMA) <strong>of</strong> the FAO Fisheries <strong>and</strong> Aquaculture Department <strong>for</strong> initiating the study.<br />
REFERENCES<br />
Abery, N.W., Sukadi, F., Budhiman, A.A., Kartamihardja, E.S., Koeshendrajana, S.,<br />
Buddhiman & De Silva, S.S. 2005. Fisheries <strong>and</strong> cage culture <strong>of</strong> three reservoirs in<br />
west Java, Indonesia; a case study <strong>of</strong> ambitious developments <strong>and</strong> resulting interactions.<br />
Fisheries Management <strong>and</strong> Ecology, 12: 315–330.<br />
Barlow, S.M. & Pike, I.H. 2001. Sustainability <strong>of</strong> fishmeal <strong>and</strong> oil supply. Paper presented at<br />
the Scottish Norwegian Marine Fish Farming Conference ‘Sustainable Future <strong>for</strong> Marine<br />
Fish Farming’, 14-15 June 2001, University <strong>of</strong> Stirling, Stirling, Scotl<strong>and</strong> (available at<br />
http://www.stir.ac.uk/aqua.staq/conference).<br />
Pike, I.H. 2005. Eco-efficiency in aquaculture: global catch <strong>of</strong> wild fish used in aquaculture.<br />
International Aquafeed, 8 (1): 38–40.<br />
Anonymous. 2006. First with grouper <strong>feeds</strong> in Vietnam. Aqua Culture Asia Pacific, 2 (3):<br />
8–9.<br />
Ayyappan, S. & Ahamad Ali, S. 2007. Analysis <strong>of</strong> <strong>feeds</strong> <strong>and</strong> <strong>fertilizers</strong> <strong>for</strong> <strong>sustainable</strong><br />
aquaculture development in India (this volume).<br />
Barman, B.K. & Karim, K. 2007. Analysis <strong>of</strong> <strong>feeds</strong> <strong>and</strong> <strong>fertilizers</strong> <strong>for</strong> <strong>sustainable</strong><br />
aquaculture development in Bangladesh (this volume).<br />
Cen, D. & Zhang, D. 1998. Development <strong>and</strong> status <strong>of</strong> the aquaculture industry in the<br />
People’s Republic <strong>of</strong> China. World Aquaculture, 29: 52–56.
46<br />
<strong>Study</strong> <strong>and</strong> <strong>analysis</strong> <strong>of</strong> <strong>feeds</strong> <strong>and</strong> <strong>fertilizers</strong> <strong>for</strong> <strong>sustainable</strong> aquaculture development<br />
Chamberlain, G.W. 1993. Aquaculture trends <strong>and</strong> feed projections. World Aquaculture,<br />
24: 19–29.<br />
De Silva, S.S. & Anderson, T.A. 1995. Finfish Nutrition in aquaculture. London, Chapman<br />
& Hall. 395 pp.<br />
De Silva, S.S. & Davy, F.B. 1992. Strategies <strong>for</strong> finfish nutrition research <strong>for</strong> semi-intensive<br />
aquaculture in Asia. Asian Fisheries Science, 5: 129–144.<br />
De Silva, S.S. 1994. Supplementary feeding in semi-intensive aquaculture systems. pp. 24–<br />
60. In M.B. New, A.G.J. Tacon & I. Csavas, (eds.) Farm-made aqua<strong>feeds</strong>. FAO Fisheries<br />
Technical Paper No. 343. Rome, FAO.<br />
De Silva, S.S. 1999. Feed resources, usage <strong>and</strong> sustainability. pp. 223–244. In N. Svennevig,<br />
H. Reinersten & M.B. New, (eds.) Sustainable Aquaculture. Food <strong>for</strong> the Future? A.A.<br />
Balkema Publishers, Rotterdam.<br />
De Silva, S.S. 2003. Culture-based fisheries: an underutilized opportunity in aquaculture.<br />
Aquaculture, 221: 221–243.<br />
Delgado, C.L., Wada, N., Rosegrant, M.W., Meijer, S. & Ahmed, M. 2003. Fish to 2020.<br />
Supply <strong>and</strong> dem<strong>and</strong> in a changing global market. International Food Policy Research<br />
Institute, Washington, D.C. 226 pp.<br />
Edwards, P., Tuan, L.H. & Allan, G. 2004. A survey <strong>of</strong> marine trash fish <strong>and</strong> fishmeal as<br />
aquaculture feed ingredients in Vietnam. ACIAR Working paper 57, ACIAR, Canberra.<br />
56 pp.<br />
FAO. 2006. FAO Fisheries Department, Fishery In<strong>for</strong>mation, Data <strong>and</strong> Statistics Unit.<br />
Fishstat Plus: Universal s<strong>of</strong>tware <strong>for</strong> fishery statistical time series. Aquaculture production:<br />
quantities 1950-2004, Aquaculture production: values 1984-2004; Capture production:<br />
1950-2004; Commodities production <strong>and</strong> trade: 1950-2004; Total production: 1970-2004,<br />
Vers. 2.30 (available at www.fao.org/fi/statist/FISOFT/FISHPLUS.asp).<br />
Fung-Smith, S., Lindebo, E. <strong>and</strong> Staples, D. 2005. Asian fisheries today: the production<br />
<strong>and</strong> use <strong>of</strong> low value/trash fish from marine fisheries in the Asia-Pacific region. RAP<br />
Publication 2005/16. Bangkok, FAORAP. 38 pp.<br />
Gedram, T. 2000. Genetic improvement <strong>of</strong> cold water fish species. Aquaculture Research,<br />
31: 25–33.<br />
Gill, C. 2006. World feed panorama. Feeds more pr<strong>of</strong>itable but disease breeds uncertainty.<br />
Feed International, January 2006, pp. 5–12.<br />
Gill, C. 1997. World feed panorama. High cost <strong>of</strong> <strong>feeds</strong>tuffs: Global impact, response. Feed<br />
International, January 1997, pp. 6–16.<br />
Gunasekera, R.M. , Turoczy, N.J., De Silva, S.S., Gavine, F. & Gooley, G.J. 2002. An<br />
evaluation <strong>of</strong> the potential suitability <strong>of</strong> selected aquatic food processing industry waste<br />
products in <strong>feeds</strong> <strong>for</strong> three fish species, based on similarity <strong>of</strong> chemical constituents.<br />
Journal <strong>of</strong> Aquatic Food Product Technology, 11: 57–78.<br />
Hasan, M.R. 2001. Nutrition <strong>and</strong> feeding <strong>for</strong> <strong>sustainable</strong> aquaculture development in the<br />
third millennium. pp. 193–219. In R.P. Subasinghe, P. Bueno, M.J. Phillips, C. Hough,<br />
S.E. McGladdery & J.R. Arthur, (eds.) Aquaculture in the Third Millennium. Technical<br />
Proceedings <strong>of</strong> the Conference on Aquaculture in the Third Millennium, Bangkok,<br />
Thail<strong>and</strong>, 20-25 February 2000, Bangkok, NACA <strong>and</strong> Rome, FAO.<br />
Hepher, B. 1988. Nutrition <strong>of</strong> pond fishes. Cambridge, Cambridge University Press. 380 pp.<br />
Hertrampf, J.W. & Pascual, F.P. 2000. H<strong>and</strong>book on Ingredients <strong>for</strong> Aquaculture Feeds.<br />
London, Kluwer Academic Publishers. 573 pp.<br />
Hung, L.T. & Huy, H.P.V. 2007. Analysis <strong>of</strong> <strong>feeds</strong> <strong>and</strong> <strong>fertilizers</strong> <strong>for</strong> <strong>sustainable</strong> aquaculture<br />
development in Viet Nam (this volume).<br />
Hung, L.T., Truc, L.T.T. & Huy, H.P.V. 2007. Case study on the use <strong>of</strong> farm-made feed<br />
<strong>and</strong> commercially <strong>for</strong>mulated pellets <strong>for</strong> pangasiid catfish culture in the Mekong Delta,<br />
Viet Nam (this volume).<br />
Hung, L.T. & Merican, Z. 2006. Freshwater fish culture in Vietnam <strong>for</strong> the global white<br />
fish market. AquaCulture Asia-Pacific, 2 (3): 14–15.
Feeds <strong>and</strong> <strong>fertilizers</strong>: the key to long-term sustainability <strong>of</strong> Asian aquaculture 47<br />
Ingram, B., Sungan, S., Gooley, G., Sim S.Y., Tinggi, D. & De Silva, S.S. 2005. Induced<br />
spawning, larval development <strong>and</strong> rearing <strong>of</strong> two indigenous Malaysian mahseer, Tor<br />
tambroides <strong>and</strong> T. douronensis. Aquaculture Research, 36: 1001–1014.<br />
Kader, M.A., Hossain, M.A. & Hasan, M.R. 2005. A survey <strong>of</strong> the nutrient composition <strong>of</strong><br />
some commercial fish <strong>feeds</strong> available in Bangladesh. Asian Fisheries Science, 18: 59–69.<br />
NACA/FAO. 2001. Aquaculture in the Third Millennium. In R.P.Subasinghe, P.B. Bueno,<br />
M.J. Phillips, C. Hough, S.E. McGladdery, R.J. Arthur, eds. Technical Proceedings <strong>of</strong><br />
the Conference on Aquaculture in the Third Millennium, Bangkok, Thail<strong>and</strong>, 20-25<br />
February 2000. Bangkok, NACA, <strong>and</strong> Rome, FAO. 471 pp.<br />
Na-Nakorn, U. 2004. A perspective on breeding <strong>and</strong> genetics <strong>of</strong> walking catfish in<br />
Thail<strong>and</strong>. Aquaculture Asia, IX (4): 10–14.<br />
Naylor, R.L., Goldburg, R.J., Primavera, J., Kautsky, N., Beveridge, M.C.M., Clay, J.,<br />
Folkes, C., Lubchence, J., Mooney, H. & Troell, M. 2000. Effects <strong>of</strong> aquaculture on<br />
world food supplies. Nature, 405: 1017– 1024.<br />
New, M. & Csavas, I. 1995. The use <strong>of</strong> marine resource in aqua<strong>feeds</strong>. pp. 43–78. In H.<br />
Reinersten & H.Haal<strong>and</strong>, (eds.), Sustainable Fish Farming. Proceedings <strong>of</strong> the First<br />
International Symposium on Sustainable Fish Farming, Oslo, Norway, August 1994.<br />
A.A. Balkema, Rotterdam.<br />
New, M.B., Tacon, A.G.J. & Csavas, I. (eds.) 1994. Farm-made aqua<strong>feeds</strong>. FAO Fisheries<br />
Technical Paper No. 343. Rome, FAO. 434 pp.<br />
Nur, A. 2007. Analysis <strong>of</strong> <strong>feeds</strong> <strong>and</strong> <strong>fertilizers</strong> <strong>for</strong> <strong>sustainable</strong> aquaculture development in<br />
Indonesia (this volume).<br />
Sumagaysay-Chavoso, N.S. 2007. Analysis <strong>of</strong> <strong>feeds</strong> <strong>and</strong> <strong>fertilizers</strong> <strong>for</strong> <strong>sustainable</strong><br />
aquaculture development in the Philippines (this volume).<br />
Tacon, A.G.J. & De Silva, S.S. 1997. Feed preparation <strong>and</strong> feed management strategies<br />
within semi-intensive fish farming systems in the tropics. Aquaculture, 151: 379–405.<br />
Tacon, A.G.J. 1987. The nutrition <strong>and</strong> feeding <strong>of</strong> farmed fish <strong>and</strong> shellfish- a training<br />
manual. Nutrient sources <strong>and</strong> composition. FAO, GCP/RLA/075/ITA, Field Document<br />
5/E. Rome, FAO. 129 pp.<br />
Tacon, A.G.J. 2004. Use <strong>of</strong> fishmeal <strong>and</strong> fish oil in aquaculture: a global perspective.<br />
Aquatic Resources Culture <strong>and</strong> Development, 1: 3–14.<br />
Tacon, A.G.J., Hasan, M.R. <strong>and</strong> Subasinghe, R.P. 2006. Use <strong>of</strong> fishery resources as feed<br />
inputs <strong>for</strong> aquaculture development: trends <strong>and</strong> policy implications. FAO Fisheries<br />
Circular No. 1018. Rome, FAO. 99 pp.<br />
Thongrod, S. 2007. Analysis <strong>of</strong> <strong>feeds</strong> <strong>and</strong> <strong>fertilizers</strong> <strong>for</strong> <strong>sustainable</strong> aquaculture development<br />
in Thail<strong>and</strong> (this volume).<br />
Weimin, M. & Mengqing, L. 2007. Analysis <strong>of</strong> <strong>feeds</strong> <strong>and</strong> <strong>fertilizers</strong> <strong>for</strong> <strong>sustainable</strong><br />
aquaculture development in China (this volume).<br />
Wijkstrom, U.N. & New, M.B. 1989. Fish <strong>for</strong> feed: a help or a hindrance to aquaculture in<br />
2000? INFOFISH International, 6/89: 48–52.<br />
Wood, J.F., Brown, J.H., MacLean, M.H. & Rajendran, I. 1992. Feeds <strong>for</strong> artisanal shrimp<br />
culture in India- their development <strong>and</strong> evaluation. BOBP/REP/52, Bay <strong>of</strong> Bengal<br />
Programme. Madras, India. 60 pp.
Feeds <strong>and</strong> <strong>fertilizers</strong> <strong>for</strong> <strong>sustainable</strong><br />
aquaculture development:<br />
a regional review <strong>for</strong> Latin America<br />
A. Flores-Nava<br />
Universidad Marista de Mérida<br />
AP 151-CORDEMEX, Mérida, Yucatán, 97300<br />
México<br />
Summary 50<br />
1. General overview <strong>of</strong> aquaculture in Latin America 51<br />
2. Overview <strong>of</strong> aquaculture practices <strong>and</strong> farming systems 53<br />
3. Review <strong>of</strong> <strong>fertilizers</strong> <strong>and</strong> fertilization 59<br />
4. The aquafeed industry in Latin America 63<br />
5. A review <strong>of</strong> <strong>feeds</strong> <strong>and</strong> feeding in aquaculture 65<br />
6. The possible impact <strong>of</strong> <strong>feeds</strong> on the <strong>sustainable</strong> development <strong>of</strong><br />
aquaculture in Latin America 70<br />
7. Recommendations 72<br />
Acknowledgements 73<br />
References 73<br />
Flores-Nava, A. 2007. Feeds <strong>and</strong> <strong>fertilizers</strong> <strong>for</strong> <strong>sustainable</strong> aquaculture development: a<br />
regional review <strong>for</strong> Latin America. In M.R. Hasan, T. Hecht, S.S. De Silva <strong>and</strong> A.G.J.<br />
Tacon (eds). <strong>Study</strong> <strong>and</strong> <strong>analysis</strong> <strong>of</strong> <strong>feeds</strong> <strong>and</strong> <strong>fertilizers</strong> <strong>for</strong> <strong>sustainable</strong> aquaculture<br />
development. FAO Fisheries Technical Paper. No. 497. Rome, FAO. pp. 49–75.<br />
49
50<br />
<strong>Study</strong> <strong>and</strong> <strong>analysis</strong> <strong>of</strong> <strong>feeds</strong> <strong>and</strong> <strong>fertilizers</strong> <strong>for</strong> <strong>sustainable</strong> aquaculture development<br />
SUMMARY<br />
In 2004 total aquaculture production in Latin America (South <strong>and</strong> Central America<br />
<strong>and</strong> the Caribbean) was 1.32 million tonnes. This review focuses on six countries<br />
(Brazil, Chile, Cuba, Ecuador, Mexico <strong>and</strong> the Bolivarian Republic <strong>of</strong> Venezuela),<br />
which collectively accounted <strong>for</strong> 86.8 percent <strong>of</strong> the total production. The balance is<br />
contributed by 29 other countries. Chile is the largest producer country contributing 51<br />
percent to total production.<br />
Given the semi-intensive <strong>and</strong> intensive nature <strong>of</strong> most production systems, there is<br />
an almost exclusive dependence on manufactured <strong>feeds</strong> throughout the region. Although<br />
<strong>fertilizers</strong>, chiefly inorganic, are still widely used there is a gradual decline in organic <strong>and</strong><br />
inorganic fertilizer use as farmers are shifting to more intensive systems.<br />
High quality aqua<strong>feeds</strong> are produced <strong>for</strong> at least 9 species, in more than 200 feed mills<br />
throughout the region. Sinking as well as extruded floating pellets are available in a wide<br />
range <strong>of</strong> sizes. Protein levels, depending on the species, range from 25 to 42 percent. In<br />
2003 Chile produced 750 000 tonnes <strong>of</strong> high protein <strong>feeds</strong> <strong>for</strong> Atlantic salmon <strong>and</strong> is the<br />
largest producer in the region. Feeds <strong>for</strong> marine shrimp <strong>and</strong> tilapia follow in terms <strong>of</strong><br />
volume, <strong>and</strong> these are produced <strong>and</strong> traded in a number <strong>of</strong> countries in the region.<br />
Despite the regions high biodiversity <strong>and</strong> availability <strong>of</strong> agricultural <strong>and</strong> industrial<br />
by-products little has been done to gradually replace fishmeal, fish oil <strong>and</strong> soybean<br />
meal. The price <strong>of</strong> these feed commodities is increasing due to rising dem<strong>and</strong> <strong>and</strong> climate<br />
induced erratic supplies, hence feed prices will continue to escalate.<br />
The Latin American aquafeed industry maintains close links with farmers <strong>and</strong><br />
provides them with technical assistance <strong>and</strong> credit. This relationship influences the<br />
feeding regimes <strong>and</strong> practices, which are practically the same throughout the region.<br />
Farmers are increasingly <strong>for</strong>ming clusters, which allow them to use economies <strong>of</strong> scale,<br />
implement quality assurance strategies <strong>and</strong> strengthen their capacity to comply with<br />
international food safety requirements. As a consequence traceability <strong>and</strong> food safety<br />
programmes are rapidly being adopted by the industry <strong>and</strong> governments are gradually<br />
following suite.<br />
In response to disease outbreaks <strong>and</strong> national environmental regulations, heterotrophic<br />
systems are gradually becoming common in the region, especially in shrimp <strong>and</strong><br />
tilapia farms. This presents opportunities <strong>for</strong> reducing aquaculture discharges into the<br />
environment <strong>and</strong> improved feed utilization.<br />
Small-scale aquaculture <strong>and</strong> agriculture farmers that wish to integrate aquaculture<br />
into their traditional agricultural systems are constrained by the high cost <strong>of</strong> <strong>for</strong>mulated<br />
<strong>feeds</strong> <strong>and</strong> the lack <strong>of</strong> basic knowledge on the use <strong>of</strong> locally available ingredients <strong>for</strong> the<br />
production <strong>of</strong> low cost, farm-made <strong>feeds</strong>. This could make a significant contribution<br />
to the economic sustainability <strong>of</strong> rural aquaculture, thus benefiting large sectors <strong>of</strong> the<br />
population.
Feeds <strong>and</strong> <strong>fertilizers</strong> <strong>for</strong> <strong>sustainable</strong> aquaculture development: a regional review <strong>for</strong> Latin America 51<br />
1. GENERAL OVERVIEW OF AQUACULTURE IN LATIN AMERICA<br />
In 2004, the estimated total aquaculture production (excluding seaweeds <strong>and</strong> aquatic<br />
plants) <strong>for</strong> the Latin American region (South <strong>and</strong> Central America <strong>and</strong> the Caribbean)<br />
was 1.32 million tonnes, representing 2.3 percent <strong>of</strong> the global aquaculture production<br />
(FAO, 2006a), showing an overall average growth <strong>of</strong> 21.3 percent per year during the<br />
period 1950–2004 (FAO, 2006b). Throughout the region the aquaculture sector has<br />
been growing rapidly in the last decade. Since 1994 total production <strong>for</strong> the region has<br />
increased by 73 percent. This review focuses on the six countries (Figure 1), which on<br />
a combined basis account <strong>for</strong> 86.8 percent <strong>of</strong> the regions total production.<br />
FIGURE 1<br />
Aquaculture production statistics <strong>for</strong> the six most important producer countries<br />
in Latin America <strong>for</strong> 1970, 1990 <strong>and</strong> 2004<br />
Source: FAO (2006a)<br />
The six countries included in this review are Brazil, Chile, Cuba, Ecuador, Mexico<br />
<strong>and</strong> Bolivarian Republic <strong>of</strong> Venezuela. In 2004, Chile contributed 51.1 percent <strong>of</strong><br />
the regional total, based chiefly on the production <strong>of</strong> Atlantic salmon (Salmo salar),<br />
followed by Brazil (20.4 percent) with a more diversified industry in which Pacific white<br />
shrimp (Litopenaeus vannamei) is the most important <strong>and</strong> with increasing production<br />
levels <strong>of</strong> tilapia, carp <strong>and</strong> native finfish such as the tambaqui (Colossoma macropomum)<br />
<strong>and</strong> pacú (Piaractus mesopotamicus). Mexico, in which marine shrimp <strong>and</strong> tilapia are the<br />
most important species, is the third largest producer (6.7 percent), followed by Ecuador<br />
(4.8 percent), which is the regions top exporter <strong>of</strong> shrimp (Table 1).<br />
While the review only considers six countries to illustrate among other aspects the<br />
geographical diversity <strong>of</strong> aquaculture in the region, the sector is also well developed in<br />
several other countries (Table 2). The expansion <strong>of</strong> the aquaculture industry within the<br />
region has been stimulated by a steady increase in <strong>for</strong>eign investment, as well as local<br />
agricultural diversification <strong>and</strong> expansion <strong>of</strong> international markets <strong>for</strong> fishery products.<br />
Overall this has resulted in a rapidly growing, export-orientated sector.<br />
Apart from Chile, where the industry is based on temperate species, all other countries<br />
<strong>of</strong> the region practice aquaculture <strong>of</strong> tropical <strong>and</strong> sub-tropical species. Since the early<br />
1970’s there has been a general <strong>and</strong> distinct trend towards greater intensification,<br />
from extensive to intensive systems. This has stimulated the development <strong>of</strong> support<br />
industries <strong>and</strong> services such as producers <strong>and</strong> suppliers <strong>of</strong> <strong>feeds</strong>, <strong>fertilizers</strong>, consulting<br />
services, equipment, drugs, etc.
52<br />
<strong>Study</strong> <strong>and</strong> <strong>analysis</strong> <strong>of</strong> <strong>feeds</strong> <strong>and</strong> <strong>fertilizers</strong> <strong>for</strong> <strong>sustainable</strong> aquaculture development<br />
TABLE 1<br />
Aquaculture production (tonnes) <strong>and</strong> value (thous<strong>and</strong> US$) <strong>of</strong> the top ten aquaculture<br />
producing countries <strong>of</strong> Latin America in 2004<br />
Country<br />
Volume<br />
(tonnes)<br />
% <strong>of</strong> regional<br />
production<br />
Value<br />
(thous<strong>and</strong> US$)<br />
% <strong>of</strong> regional<br />
value<br />
Chile 674 979 51.1 2 814 837 53.6<br />
Brazil 269 699 20.4 965 628 18.4<br />
Mexico 89 037 6.7 291 329 5.5<br />
Ecuador 63 579 4.8 292 077 5.6<br />
Colombia 60 072 4.5 277 036 5.3<br />
Cuba 27 562 2.1 29 434 0.6<br />
Costa Rica 24 708 1.9 80 218 1.5<br />
Honduras 22 520 1.7 114 942 2.2<br />
Bolivarian Republic <strong>of</strong> Venezuela 22 210 1.7 65 785 1.3<br />
Peru 22 199 1.7 130 555 2.5<br />
Source: FAO (2006a)<br />
TABLE 2<br />
The range <strong>of</strong> aquaculture production<br />
volumes (2004) in Latin American<br />
countries not included in this review<br />
Production<br />
Country<br />
(tonnes)<br />
>60 000 Colombia<br />
20 000–-30 000 Costa Rica<br />
Honduras<br />
Peru<br />
10 000–12 000 Belize<br />
4 000–8 000 Guatemala<br />
Jamaica<br />
Nicaragua<br />
Panama<br />
1 000–3 000 Dominican Republic<br />
El Salvador<br />
Paraguay<br />
400–1 000 Bolivia<br />
Guyana<br />
Puerto Rica<br />
Source: FAO (2006a)<br />
Contrary to many Asian <strong>and</strong> African<br />
countries (see De Silva <strong>and</strong> Hasan, 2007 <strong>and</strong><br />
also Hecht, 2007), the bulk <strong>of</strong> the aquaculture<br />
industry in Latin America is export-orientated.<br />
However, price-related market constraints have<br />
recently prompted shrimp producers to focus on<br />
local markets. This has been greatly facilitated<br />
in countries such as Brazil <strong>and</strong> Mexico where<br />
economic stability has improved the purchasing<br />
power <strong>of</strong> a growing middle class.<br />
The Chilean salmon industry is expected<br />
to keep pace with the rising global dem<strong>and</strong><br />
<strong>for</strong> the next decade. However, the number <strong>of</strong><br />
salmon farming companies is likely to remain<br />
unchanged as the relatively few larger firms<br />
have strongly consolidated their international<br />
market share.<br />
Overall, the regional expectations <strong>of</strong><br />
increased production levels <strong>of</strong> shrimp have been<br />
high. However, both climatic (El Niño events<br />
in Ecuador) <strong>and</strong> pathogenic outbreaks (severe<br />
viral epizootics in Central <strong>and</strong> South America) have caused regional production to<br />
grow slower than expected over the last five years. The lower than expected growth<br />
rate has to a certain extent been counterbalanced by an expansion in the overall regional<br />
open pond surface area.<br />
The regional aquaculture industry will face several challenges in the decade ahead.<br />
In particular these are: decreasing international prices <strong>for</strong> some species like shrimp <strong>and</strong><br />
tilapia due to steady increases in supply; increasing cost <strong>of</strong> fishmeal; non-competitive<br />
energy <strong>and</strong> wage levels in some Latin American countries in relation to Asian producers<br />
<strong>and</strong> tougher environmental protection measures imposed by local governments as well<br />
as regional <strong>and</strong> international agreements, which result in higher investment costs to<br />
meet quality <strong>and</strong> sanitary st<strong>and</strong>ards.<br />
Despite the challenges, the industry’s horizon seems promising, stimulated by<br />
continued <strong>for</strong>eign investment, steady regional economic growth <strong>and</strong> stability <strong>and</strong><br />
local economic diversification towards aquaculture. These factors, together with<br />
the increasing adoption <strong>of</strong> responsible, certifiable aquaculture practices by new <strong>and</strong><br />
established farmers, ensure higher productivity, better quality <strong>and</strong> continued presence<br />
in both North American <strong>and</strong> European markets.
���������������������������������������������<br />
Feeds <strong>and</strong> <strong>fertilizers</strong> <strong>for</strong> <strong>sustainable</strong> aquaculture development: a regional review <strong>for</strong> Latin America 53<br />
2. OVERVIEW OF AQUACULTURE PRACTICES AND FARMING SYSTEMS<br />
2.1 Chile<br />
The evolution <strong>of</strong> Chilean aquaculture can be divided into “be<strong>for</strong>e <strong>and</strong> after” the salmon<br />
industry. The first attempts to culture aquatic organisms in the country date back to<br />
1850, with the introduction <strong>of</strong> rainbow trout <strong>and</strong> common carp. However, the sector<br />
only really took <strong>of</strong>f in the early 1990s after the introduction <strong>of</strong> Atlantic salmon (Salmo<br />
salar).<br />
Between 1993 <strong>and</strong> 2004 salmonid (trout <strong>and</strong> all salmon species) production increased<br />
seven-fold from 77 500 tonnes to 568 900 tonnes (FAO, 2006a). In 2002, salmon<br />
exports reached 350 000 tonnes (Figure 2), <strong>and</strong> in 2004 cultured salmon was second<br />
to copper in the ranking <strong>of</strong> Chilean export products, reaching US$1 439.4 million <strong>and</strong><br />
representing five percent <strong>of</strong> the total national value <strong>of</strong> exports (Aqua.cl, 2005: www.<br />
aqua.cl). Other aquaculture species <strong>of</strong> economic importance in the country include<br />
rainbow trout (Onchorhynchus mykiss), oysters (Ostrea chilensis, Crassostrea gigas),<br />
scallops (Argopecten purpuratus); macroalgae (Gracilaria spp); turbot (Scophthalmus<br />
maximus) <strong>and</strong> abalone (Haliotis spp) (Table 3).<br />
Culture systems<br />
In general Chilean aquaculture is intensive <strong>and</strong> chiefly devoted to marine species, with<br />
the exception <strong>of</strong> rainbow trout. Coastal aquaculture is practically feasible in all regions<br />
<strong>of</strong> the country, although the density <strong>of</strong> aquafarms (salmon <strong>and</strong> trout), is significantly<br />
higher in southern areas (regions X <strong>and</strong> XI), due to the presence <strong>of</strong> fjords <strong>and</strong> other<br />
naturally protected areas (Figure 3). The culture <strong>of</strong> molluscs, flatfish <strong>and</strong> marine<br />
macrophytes is practiced mostly in the north, in regions III <strong>and</strong> IV. Table 4 summarizes<br />
the culture systems <strong>and</strong> production parameters <strong>of</strong> several commercially important<br />
aquaculture species <strong>of</strong> Chile.<br />
TABLE 3<br />
Production (tonnes) <strong>and</strong> value (thous<strong>and</strong> US$) <strong>of</strong> the most important aquaculture species in<br />
Chile <strong>for</strong> the period 1999–2003<br />
Year Atlantic<br />
salmon<br />
Rainbow<br />
trout<br />
Gracilaria Oysters Turbot Abalone Total export<br />
value<br />
1999 179 774 50 414 31 278 26 400 333 48 -<br />
2000 296 311 79 566 33 471 24 859 259 66 999 229<br />
2001 460 065 109 895 65 638 25 852 303 73 1 002 026<br />
2002 345 582 105 410 14 597 18 482 217 60 1 000 092<br />
2003 377 350 109 658 16 259 18 723 340 80 1 177 954<br />
Source: Aqua.cl magazine (March, 2005) available at www.aqua.cl<br />
FIGURE 2<br />
Evolution <strong>of</strong> Chilean salmon exports <strong>for</strong> the period 1990–2002<br />
Source: Villarroel (2003)<br />
FIGURE 3<br />
Aerial view <strong>of</strong> a salmon cage farm<br />
in a Chilean Fjord<br />
COURTESY OF M. ARANEDA
54<br />
<strong>Study</strong> <strong>and</strong> <strong>analysis</strong> <strong>of</strong> <strong>feeds</strong> <strong>and</strong> <strong>fertilizers</strong> <strong>for</strong> <strong>sustainable</strong> aquaculture development<br />
TABLE 4<br />
Summary <strong>of</strong> culture parameters employed <strong>for</strong> important aquaculture species in Chile<br />
Species System Culture facilities Stocking<br />
density<br />
Atlantic salmon,<br />
Salmo salar<br />
Rainbow trout,<br />
Onchorhynchus<br />
mykiss<br />
Red abalone,<br />
Haliotis<br />
rufescens<br />
Intensive Hatchery-reared alevines<br />
cultured in round tanks<br />
in freshwater until smolts<br />
are transferred to cages<br />
in estuaries <strong>and</strong> fjords<br />
Intensive 2–6 m x 12–30m concrete<br />
or earthen raceways,<br />
water exchange:<br />
100–400%/day in<br />
90–230 m3 cages<br />
Intensive Trocophore <strong>and</strong> veliger<br />
tank rearing.<br />
Settling tanks with algal<br />
grazing sheets.<br />
Juvenile rearing tanks<br />
(2x10m)<br />
10 000/m 2<br />
(alevines)<br />
60–120 kg/m3 (fattening)<br />
10–20 kg/m3 (earthen ponds)<br />
30–90 kg/m 3<br />
(cages)<br />
200–300/m 2<br />
(larval stages)<br />
60–100/m 2<br />
(juveniles)<br />
Source: M. Araneda, Universidad Católica del Norte, Chile (2006, pers. comm.)<br />
Feeding Source <strong>of</strong> larvae<br />
or juveniles<br />
45% protein<br />
35–42% protein<br />
trout feed<br />
Diatoms<br />
Macrocystis<br />
Gracilaria <strong>and</strong><br />
artificial <strong>feeds</strong><br />
Artificial<br />
insemination in<br />
hatchery<br />
Artificial<br />
insemination in<br />
hatchery<br />
Thermal or UVinduction<br />
to<br />
spawn<br />
2.2 Mexico<br />
Although dating back to the late 18th century, aquaculture in Mexico only became<br />
an important economic activity in the early 1970s. Over the past three decades, the<br />
industry has grown rapidly in terms <strong>of</strong> production volumes, economic contribution<br />
<strong>and</strong> number <strong>of</strong> species cultured. In 2004, aquaculture production in Mexico amounted<br />
to 89 037 tonnes, which accounted <strong>for</strong> approximately 5.7 percent <strong>of</strong> the total national<br />
fisheries production (capture fisheries plus aquaculture) <strong>of</strong> 1.57 million tonnes (FAO,<br />
2006a). The most important aquaculture species <strong>of</strong> the country, both by volume <strong>and</strong><br />
value, are marine shrimp <strong>and</strong> tilapia. In 2002, shrimp <strong>and</strong> tilapia accounted <strong>for</strong> 73 <strong>and</strong><br />
14 percent in terms <strong>of</strong> total aquaculture produce value, respectively (SAGARPA, 2002),<br />
while in 2004 these proportions had shifted to 82.4 <strong>and</strong> 5.3 percent, respectively (FAO,<br />
2006a). Pacific white shrimp (Litopenaeus vannamei) accounts <strong>for</strong> over 90 percent <strong>of</strong><br />
shrimp production in Mexico.<br />
Other finfish species include carp (Cyprinus carpio) along with Chinese carps,<br />
rainbow trout (Oncorhynchus mykiss), channel catfish (Ictalurus punctatus), largemouth<br />
bass (Micropterus salmoides) <strong>and</strong> the native white fish (Chirostoma spp.). The two most<br />
important mollusc species are Crassostrea virginica, which accounts <strong>for</strong> 97 percent<br />
<strong>of</strong> oyster production <strong>and</strong> the introduced C. gigas, through intensive, closed-cycle<br />
production, contributed with the balance (SAGARPA 2002), although the <strong>for</strong>mer is<br />
chiefly produced through enhanced fisheries. The industry is mainly concentrated in<br />
the north western states <strong>of</strong> the country.<br />
TABLE 5<br />
Percent contribution by species groups to total<br />
Mexican aquaculture production <strong>and</strong> value in 2004<br />
Species<br />
groups<br />
Percent contribution<br />
to total production<br />
Percent contribution<br />
to total value<br />
Shrimps 70.0 82.4<br />
Tilapia 7.9 5.2<br />
Carps 13.5 4.0<br />
Trout 3.9 3.8<br />
Tuna 0.6 2.5<br />
Catfish 1.1 0.7<br />
Shellfish 2.0 0.8<br />
Others 1.0 0.6<br />
Note: Total production = 89 037 tonnes; total value = US$291.33<br />
million<br />
Source: FAO (2006a)<br />
Culture systems<br />
Some 61 aquatic species are farmed in Mexico,<br />
<strong>for</strong> which a wide spectrum <strong>of</strong> aquaculture<br />
systems are employed, ranging from fisheries<br />
enhancement, culture in enclosures, extensive,<br />
semi-intensive <strong>and</strong> intensive pond culture<br />
as well as tanks <strong>and</strong> raceways. In the case<br />
<strong>of</strong> shrimp farming, larviculture is strongly<br />
encouraged by government, although smallscale<br />
farmers still depend on wild post larvae.<br />
Captive breeding is becoming a regular practice,<br />
although the majority <strong>of</strong> hatcheries still rely on<br />
wild breeders.
Feeds <strong>and</strong> <strong>fertilizers</strong> <strong>for</strong> <strong>sustainable</strong> aquaculture development: a regional review <strong>for</strong> Latin America 55<br />
TABLE 6<br />
Summary <strong>of</strong> aquaculture practices <strong>of</strong> commercially important aquaculture species in Mexico<br />
Species Farming/culture<br />
system<br />
Pacific white<br />
shrimp,<br />
Litopenaeus<br />
vannamei<br />
Tilapia,<br />
Oreochromis<br />
spp.<br />
Japanese<br />
oyster,<br />
Crassostrea<br />
gigas<br />
Extensive 5–80 ha ponds with tidal or<br />
minimum water exchange<br />
(150,000<br />
cells/ml) algal counts are<br />
maintained in 5 m 3 -fiberglass<br />
round tanks. Larvae attach onto<br />
crushed or whole shells. Spat<br />
(3–4mm) transferred to shallow,<br />
productive coastal lagoons in<br />
either Nestier boxes or hanging<br />
ropes with shells in floating rafts.<br />
1–5 /m 2 Inorganic<br />
fertilization<br />
sometimes<br />
supplemented<br />
with low quality<br />
shrimp feed.<br />
6–25 /m 2 Initial inorganic<br />
fertilization.<br />
Supplementary<br />
shrimp feed<br />
throughout the<br />
culture period.<br />
25–150 /m 2 100% high<br />
quality shrimp<br />
feed. Use <strong>of</strong><br />
probiotics is<br />
common.<br />
Initial stage:<br />
80–100/m 3 .<br />
Final stage:<br />
50–75/m 3<br />
Broodstock:<br />
1–2/m 2<br />
Sex reversal:<br />
2 000 /m 3 .<br />
Nursery:<br />
120–150/m 2 .<br />
Initial stage ongrowing:<br />
20–25/m 2 .<br />
Final stage:<br />
5–10/m2 Broodstock:<br />
1–2/m2 Sex reversal:<br />
2 000–2 500/m3 .<br />
Nursery:<br />
120–300/m2 .<br />
Initial stage ongrowing:<br />
80–60/m2 .<br />
Intermediate<br />
stage: 40/m2 ,<br />
final stage:<br />
25/m2 .<br />
Larval culture:<br />
1–3 larvae/ml.<br />
Nestier boxes:<br />
Initial: 3 000<br />
juveniles/box.<br />
Culled down to<br />
80/box at harvest.<br />
Bags: 600/bag,<br />
culled down<br />
to 60/bag at<br />
harvest.<br />
100% tilapia<br />
feed.<br />
Initial inorganic<br />
fertilization in<br />
nursery stage.<br />
Tilapia feed from<br />
nursery through<br />
to harvest.<br />
High quality<br />
tilapia feed.<br />
Larval culture:<br />
Axenic culture <strong>of</strong><br />
phytoplankton.<br />
Grow-out: natural<br />
productivity.<br />
Source <strong>of</strong> larvae<br />
Mostly<br />
seasonally<br />
caught larvae<br />
from the wild.<br />
Hatcheryproduced.<br />
Most intensive<br />
farms have<br />
hatcheries <strong>and</strong><br />
produce their<br />
own postlarvae.<br />
Hatcheryproduced,<br />
sex-reversed<br />
fingerlings. Most<br />
farms buy from<br />
independent<br />
hatcheries.<br />
Hatcheryproduced,<br />
sex-reversed<br />
fingerlings. Most<br />
farms buy from<br />
independent<br />
hatcheries.<br />
Hatcheryproduced,<br />
sex-reversed<br />
fingerlings. All<br />
intensive farms<br />
produce their<br />
own seed.<br />
Exclusively from<br />
hatchery<br />
1No nursery stage implies that PL/fry are stocked directly into on-growing ponds, as opposed to stocking them in nursery ponds<br />
<strong>and</strong> then transferring <strong>for</strong> on-growing; 2Polyvinyl chloride; 3lps= litre per second<br />
Source: author’s database
56<br />
FIGURE 4<br />
National production <strong>of</strong> farmed shrimp in Ecuador<br />
<strong>for</strong> the period <strong>of</strong> 2000–2005 (production <strong>for</strong> 2005<br />
is estimated)<br />
Thous<strong>and</strong> tonnes<br />
100<br />
90<br />
80<br />
70<br />
60<br />
50<br />
40<br />
30<br />
20<br />
10<br />
0<br />
2000 2001 2002 2003 2004 2005<br />
Y e a r<br />
Source: M. Dewind, National Chamber <strong>of</strong> Aquaculturists <strong>of</strong><br />
Ecuador (2006, pers. comm.)<br />
<strong>Study</strong> <strong>and</strong> <strong>analysis</strong> <strong>of</strong> <strong>feeds</strong> <strong>and</strong> <strong>fertilizers</strong> <strong>for</strong> <strong>sustainable</strong> aquaculture development<br />
A range <strong>of</strong> slight variants <strong>of</strong> the “Galveston method” are employed in the<br />
approximately 40 shrimp hatcheries in the country. However, st<strong>and</strong>ard techniques<br />
include mass-production <strong>of</strong> larvae in 10–20 m 3 indoor, highly aerated tanks, at densities<br />
ranging between 45 <strong>and</strong> 100/l. Apart from live food, supplementary feeding is a<br />
growing practice, including commercially produced dry, moist, semi-moist <strong>and</strong> liquid<br />
<strong>for</strong>mulae.<br />
The bulk <strong>of</strong> tilapia farms (80 percent) have a closed-cycle operation, which allows<br />
<strong>for</strong> year round production <strong>of</strong> juveniles. Table 6 presents several culture systems <strong>and</strong><br />
management practices used in Mexico.<br />
2.3 Ecuador<br />
Ecuadorian aquaculture began in the early 1970´s, when shrimp farming gradually<br />
replaced banana plantations along the coastal plains <strong>of</strong> Guayas Province. Ideal climatic<br />
conditions, low production costs <strong>and</strong> abundant naturally occurring shrimp larvae<br />
stimulated the impressive growth <strong>of</strong> the Ecuadorian shrimp farming industry over the<br />
last 30 years, thus becoming the largest marine shrimp producer <strong>of</strong> the Americas, <strong>and</strong><br />
the number one exporter to the United States.<br />
Despite favourable climatic conditions, the spectrum <strong>of</strong> aquaculture species <strong>of</strong><br />
Ecuador is poor. Marine shrimp (Pacific white shrimp L. vannamei <strong>and</strong> blue shrimp<br />
L stylirostris), are by far the most important culture species, constituting 93.7 percent <strong>of</strong><br />
the total national aquaculture production. The shrimp industry in Ecuador uses some<br />
140 000 ha <strong>of</strong> extensive <strong>and</strong> semi-intensive ponds (National Agriculture In<strong>for</strong>mation<br />
Service, Ministry <strong>of</strong> Agriculture <strong>of</strong> Ecuador, 2004). However, viral epizootics badly<br />
impacted the shrimp industry during the 1980´s <strong>and</strong> 1990´s, resulting in significant<br />
reductions in shrimp production volumes. The industry began to recover in 2004/05<br />
(Figure 4). As a result <strong>of</strong> the disease problems in the shrimp industry, farmers began to<br />
look <strong>for</strong> alternatives, among which tilapia has been the most popular choice. Figure 5<br />
shows the trend in tilapia production, which has grown almost three-fold over the past<br />
4 years.<br />
FIGURE 5<br />
Aquaculture production <strong>of</strong> tilapia in Ecuador<br />
2000–2005 (production <strong>for</strong> the year 2005 is<br />
estimated)<br />
Thous<strong>and</strong> tonnes<br />
12<br />
10<br />
8<br />
6<br />
4<br />
2<br />
0<br />
2000 2001 2002 2003 2004 2005<br />
Y e a r<br />
Source: M. Dewind, National Chamber <strong>of</strong> Aquaculturists <strong>of</strong><br />
Ecuador (2006, pers. comm.)
Feeds <strong>and</strong> <strong>fertilizers</strong> <strong>for</strong> <strong>sustainable</strong> aquaculture development: a regional review <strong>for</strong> Latin America 57<br />
TABLE 7<br />
Summary <strong>of</strong> aquaculture practices <strong>for</strong> commercially important aquaculture species in Ecuador<br />
Species Farming<br />
system<br />
Shrimp,<br />
Litopenaeus<br />
vannamei<br />
L. stylirostris Extensive<br />
L. occidentalis<br />
Tilapia,<br />
Oreochromis spp<br />
Rainbow trout,<br />
Oncorhynchus<br />
mykiss<br />
Semiintensive<br />
Semiintensive<br />
Culture facilities Stocking<br />
density<br />
5–30 ha ponds with tidal or<br />
minimum water exchange<br />
(
58<br />
<strong>Study</strong> <strong>and</strong> <strong>analysis</strong> <strong>of</strong> <strong>feeds</strong> <strong>and</strong> <strong>fertilizers</strong> <strong>for</strong> <strong>sustainable</strong> aquaculture development<br />
TABLE 8<br />
Summary <strong>of</strong> aquaculture practices <strong>of</strong> commercially important aquaculture species in the<br />
Bolivarian Republic <strong>of</strong> Venezuela<br />
Species Culture facilities Stocking density Fertilization/feeding<br />
Shrimp<br />
L. vannamei<br />
L. stylirostris<br />
L. schmitti<br />
Tambaqui, Colossoma<br />
macropomum<br />
0.05–0.1 ha nursery<br />
raceways or ponds <strong>and</strong> 2–12<br />
ha grow-out ponds<br />
120–200/m 2<br />
nursery 7–40/m 2<br />
grow-out<br />
Fertilizer<br />
<strong>and</strong> 25–35% protein<br />
feed<br />
0.05–0.1 ha ponds 1/m 2 Fresh fruits <strong>and</strong> 20%<br />
protein feed<br />
Tilapia, Oreochromis spp 0.1–0.2 ha ponds 20/m 2 nursery <strong>and</strong><br />
3–5/m 2 grow-out<br />
Rainbow trout,<br />
Oncorhynchus mykiss<br />
Pelleted feed<br />
12–30 x 2.5–8m raceways 10–24 kg/m 3 20–33% protein<br />
tilapia feed<br />
Source: J. Velazco, National Fisheries <strong>and</strong> Aquaculture Institute, Bolivarian Republic <strong>of</strong> Venezuela (2006, pers. comm.)<br />
Culture systems<br />
Table 8 summarizes the main characteristics <strong>of</strong> the most representative culture systems<br />
employed by farmers in Venezuela.<br />
2.5 Brazil<br />
Aquaculture has been practiced in Brazil since the early 1900´s. Given its continental<br />
dimensions <strong>and</strong> climatic diversity, both temperate <strong>and</strong> tropical species are widely<br />
cultured. Currently, there are at least 64 species cultured in the country, including a<br />
number <strong>of</strong> native fish. Predominately based on small-scale farms, Brazilian aquaculture<br />
production in 2004 amounted to some 269 699 tonnes, valued at some US$965.6<br />
million (FAO, 2006a). In 2003 there were approximately 100 000 farms occupying an<br />
area <strong>of</strong> 80 000 hectares. In 2004, finfish production comprised 62.7 percent by volume<br />
(66.3 percent by value) <strong>and</strong> shrimp production accounted <strong>for</strong> 28.1 percent by volume<br />
<strong>and</strong> 31.4 percent by value. Fish production was dominated by cichlids (25.6 percent),<br />
characins (mainly chachama) 17.9 percent <strong>and</strong> cyprinids (16.7 percent) (FAO, 2006a)<br />
Shrimp farming began in the early 1980´s <strong>and</strong> after the introduction <strong>of</strong> L. vannamei<br />
in 1995 the industry exp<strong>and</strong>ed rapidly.<br />
Culture systems<br />
A wide range <strong>of</strong> aquaculture systems are employed in Brazil that include all levels<br />
<strong>of</strong> intensification, depending on the species, the region <strong>and</strong> the environment. Table 9<br />
presents a summary <strong>of</strong> the main characteristics <strong>of</strong> the culture strategies <strong>for</strong> the most<br />
important aquaculture species <strong>of</strong> the country.<br />
TABLE 9<br />
Summary <strong>of</strong> culture systems <strong>for</strong> important aquaculture species in Brazil<br />
Species Scientific name Culture facilities Stocking density Fertilization/feeding<br />
Shrimp,<br />
L. vannamei<br />
L. stylirostris <strong>and</strong> L. schmitti<br />
0.05–0.1 ha nursery<br />
flow-through channels<br />
or ponds, <strong>and</strong> 2–40 ha<br />
grow-out ponds.<br />
120–200/m 2 <strong>for</strong> nursery<br />
<strong>and</strong> 7–40/m 2 <strong>for</strong> growout<br />
Fertilizer <strong>and</strong> 25–35% protein<br />
feed<br />
Pacú, Piaractus mesopotamicus 0.05–0.1 ha ponds 1/m 2 Fresh fruits <strong>and</strong> 20% protein<br />
feed<br />
Tilapia, Oreochromis spp 0.1–0.2 ha ponds<br />
Silver carp, Hypophthalmichthys<br />
molitrix; grass carp,<br />
Ctenopharyngodon idella;<br />
common carp, Cyprinus carpio<br />
Tambaquí, Colossoma<br />
macropomum<br />
Rainbow trout, Oncorhynchus<br />
mykiss<br />
2–38 m 3 cages in<br />
reservoirs<br />
20/m 2 nursery,<br />
3–5/m 2 grow-out<br />
80–100/m 3 juveniles <strong>and</strong><br />
20–50/m 3 final stage<br />
Pelleted feed<br />
Extruded pelleted feed<br />
0.1–1.5 ha ponds 0.1–0.5/m 2 in polyculture Organic <strong>and</strong> inorganic fertilizer;<br />
chopped grass.<br />
0.05–0.1 ha ponds<br />
2–16 m 3 cages<br />
12–30 x 2.5–8m<br />
raceways<br />
0.25–1.0/m 2<br />
30/m 3 initial stocking<br />
<strong>and</strong> 10–15/m 3 final stage<br />
Chopped meat <strong>and</strong> fruits in<br />
juveniles <strong>and</strong> 20% pelleted feed<br />
in final stage<br />
10–24 kg/m 3 20–33% protein tilapia feed<br />
Source: FAO Fisheries Global In<strong>for</strong>mation System (2006); M. Hipólito, Biology Institute <strong>of</strong> Sao Paulo, Brazil (2005, pers. comm.)
Feeds <strong>and</strong> <strong>fertilizers</strong> <strong>for</strong> <strong>sustainable</strong> aquaculture development: a regional review <strong>for</strong> Latin America 59<br />
2.6 Cuba<br />
Aquaculture is a strategic activity in Cuba both <strong>for</strong> producing animal protein <strong>and</strong><br />
<strong>for</strong> earning <strong>for</strong>eign currency through export. The absence <strong>of</strong> suitable native species<br />
<strong>for</strong> cost-effective aquaculture was the reason <strong>for</strong> introducing a wide range <strong>of</strong> species.<br />
These are cultured both extensively <strong>and</strong> semi-intensively in more than 148 000 ha <strong>of</strong><br />
small to medium sized reservoirs nationwide. In addition, there are 26 state-owned <strong>and</strong><br />
operated fish breeding stations where fry <strong>of</strong> different species are mass produced <strong>and</strong><br />
distributed to 30 stations <strong>for</strong> on-growing with approximately 1 000 ha <strong>of</strong> fish ponds.<br />
In 2004, total Cuban aquaculture production amounted to some 27 562 tonnes valued<br />
at US$29.4 million (FAO, 2006a).<br />
Fish is the most important product <strong>and</strong> collectively contributed 94.3 percent to total<br />
production by volume <strong>and</strong> 91.3 percent by value (FAO, 2006a). The main species are<br />
Oreochromis spp, common carp Cyprinus carpio, channel catfish Ictalurus punctatus,<br />
<strong>and</strong> Chinese grass carp Ctenopharyngodon idella <strong>and</strong> silver carp Hypophthalmichthys<br />
molitrix. The white shrimp L. vannamei <strong>and</strong> the native white shrimp L. schmitti<br />
are cultured in 4 semi-intensive farms, using larvae produced in 3 hatcheries. Total<br />
production <strong>of</strong> farmed shrimp was 1 370 tonnes in 2003, which then accounted <strong>for</strong> 5.1<br />
percent by volume <strong>and</strong> 17.2 percent by value (the reported production <strong>for</strong> 2004 was<br />
390 tonnes, but it is not known whether this is an error) (FAO, 2006a). Other species<br />
cultured in the country are the African catfish Clarias gariepinus <strong>and</strong> the Australian<br />
crayfish Cherax quadricarinatus, which were recently introduced.<br />
Culture systems are mostly extensive. Stock enhancement is largely practiced<br />
through stocking <strong>of</strong> hatchery-reared fingerlings in large to medium sized reservoirs,<br />
which sometimes are organically or inorganically fertilized, as well as in earthen ponds<br />
that range from 0.01–0.3 ha. Most finfish species are stocked at between 0.1 <strong>and</strong> 2/m 2<br />
<strong>and</strong> fed a wide variety <strong>of</strong> locally available protein sources, since aquaculture <strong>feeds</strong> are<br />
almost only available <strong>for</strong> shrimp farming.<br />
Shrimp farming is semi-intensive. Hatchery-reared post-larvae are stocked in<br />
previously fertilized ponds at densities that vary between 80 <strong>and</strong> 150/m 2 during the<br />
nursery stage <strong>and</strong> between 12 <strong>and</strong> 20/m 2 in the growout stage. Shrimp are fed 20–35<br />
percent protein <strong>feeds</strong>. Water exchange in shrimp ponds fluctuates between 3 <strong>and</strong> 15<br />
percent/day <strong>and</strong> aeration is not employed (Toledo, 2004).<br />
3. REVIEW OF FERTILIZERS AND FERTILIZATION<br />
Fertilization <strong>of</strong> aquaculture ponds <strong>for</strong> tropical species is a wide-spread practice<br />
throughout Latin America. The exceptions are Chile, where temperate species such<br />
as Atlantic salmon <strong>and</strong> abalone are reared intensively <strong>and</strong> other intensive farms in the<br />
region where the species depend entirely on commercial <strong>feeds</strong>.<br />
Given that shrimp <strong>and</strong> tilapia farming are the most important aquaculture activities in<br />
Latin America, except Chile, management strategies including fertilization are similar in<br />
most countries. Furthermore, international trade in <strong>fertilizers</strong> is dynamic within the region,<br />
such that a variety <strong>of</strong> br<strong>and</strong>s with different chemical compositions are readily available.<br />
3.1 Inorganic fertilization<br />
Brackish-water aquaculture<br />
The majority (more than 80 percent) <strong>of</strong> shrimp farms in the region are considered to<br />
be semi-intensive. Although higher levels <strong>of</strong> control <strong>and</strong> inputs are increasingly being<br />
introduced to counteract possible pathogenic outbreaks, shrimp are still partially<br />
dependent on natural pond productivity that is enhanced through the application <strong>of</strong><br />
inorganic <strong>fertilizers</strong>. Application rates <strong>and</strong> strategies have been st<strong>and</strong>ardized through<br />
research by fertilizer companies <strong>and</strong> the academic sector.<br />
A rapid survey carried out as part <strong>of</strong> the present <strong>analysis</strong> in Mexico, Guatemala<br />
<strong>and</strong> Belize showed that respectively 22 out <strong>of</strong> 27 (81 percent); 8 out <strong>of</strong> 8 (100 percent)
60<br />
<strong>Study</strong> <strong>and</strong> <strong>analysis</strong> <strong>of</strong> <strong>feeds</strong> <strong>and</strong> <strong>fertilizers</strong> <strong>for</strong> <strong>sustainable</strong> aquaculture development<br />
<strong>and</strong> 4 out <strong>of</strong> 5 (80 percent) <strong>of</strong> the surveyed farmers use indirect or subjective methods<br />
(Secchi disk or apparent colour <strong>of</strong> pond water) to determine whether a pond should be<br />
fertilized or not, <strong>and</strong> only 4 out <strong>of</strong> 40 (10 percent) employ direct phytoplankton counts<br />
as an indicator <strong>of</strong> the need to fertilize.<br />
Two common application methods employed by shrimp farmers in the region were<br />
observed during the present <strong>analysis</strong>, viz. direct application <strong>of</strong> water-dissolved <strong>fertilizers</strong><br />
<strong>and</strong> a point-source gradual release method. Direct application involves calculating the<br />
amount <strong>of</strong> different <strong>fertilizers</strong> required according to st<strong>and</strong>ard equations, dissolving<br />
the mixed <strong>fertilizers</strong> in water <strong>and</strong> applying the solution to ponds in which the water<br />
level has been reduced to around 0.1 m during peak light hours, where after the pond<br />
is gradually filled. The point-source application method is more commonly used by<br />
small-scale farmers. It also involves calculating the required quantity <strong>of</strong> fertilizer per<br />
pond <strong>and</strong> then dividing it into several bags through which nutrient leaching can take<br />
place. The bags are submersed <strong>and</strong> tied to poles in the pond that have been arranged in<br />
a pattern to ensure homogenous distribution <strong>of</strong> nutrients.<br />
Inorganic nitrogen <strong>and</strong> phosphorus <strong>fertilizers</strong> are available in all countries <strong>of</strong> the<br />
region. Table 10 presents a summary <strong>of</strong> chemical composition <strong>and</strong> application rates <strong>of</strong><br />
inorganic <strong>fertilizers</strong> employed by shrimp farmers in a selected number <strong>of</strong> countries in<br />
Latin America.<br />
A typical inorganic fertilization strategy employed by Brazilian farmers is presented<br />
in Table 11. In some regions where soils are low in silicon, Sodium metasilicate is<br />
applied at a rate <strong>of</strong> 750 cm 3 /ha (Nunes, 2000).<br />
TABLE 10<br />
Summary <strong>of</strong> inorganic fertilizer application methods employed by shrimp farmers in Latin American<br />
countries<br />
Fertilizer Composition<br />
(% N, P <strong>and</strong> K)<br />
Chemical<br />
composition<br />
Application<br />
rate/cycle<br />
Degree <strong>of</strong><br />
use<br />
Country<br />
Urea 46-0-0 NH2-CO-NH2 20–24 kg/ha *** Brazil, Colombia, Cuba,<br />
Ecuador, El Salvador,<br />
Guatemala, Honduras, Mexico,<br />
Panama, Peru, Bolivarian<br />
Republic <strong>of</strong> Venezuela<br />
Single<br />
superphosphate<br />
0-20-0 Ca(H2PO4) 2 1.3–3.9 kg/ha ** Brazil, Ecuador, Mexico<br />
Triple<br />
superphosphate<br />
(TSP)<br />
Diammonium<br />
phosphate (DAP)<br />
Monoammonium<br />
phosphate<br />
0-42-0 Ca(H2PO4) 2 0.9–2.4 kg/ha *** Brazil, Colombia Cuba, Ecuador,<br />
El Salvador, Honduras, Mexico,<br />
Panama, Peru, Bolivarian<br />
Republic <strong>of</strong> Venezuela<br />
16-24-0 (NH4) 2HPO4 0.9–3.0 kg/ha * Ecuador, Mexico, Honduras,<br />
Panama<br />
8-24-0 NH4HPO4 3.7–5.2 kg/ha ** Ecuador<br />
***Widely used, **Common, *Low use<br />
Sources: MIDA (1998); Nunes (2000, 2004); J. Zendejas, Cargill-Purina, Mexico (2006, pers. comm.); author’s own data<br />
TABLE 11<br />
St<strong>and</strong>ard inorganic fertilization procedure employed by Brazilian shrimp farmers<br />
Procedure (steps) Application rate<br />
1 Pond water level is raised to 0.3 m 9 kg urea + 0.9 kg TSP/ha<br />
2 Pond left <strong>for</strong> two days to bloom<br />
3 Pond water level raised at 50% the operational level 14 kg urea + 1.4 kg TSP/ha<br />
4 Pond water static <strong>for</strong> 3 days to bloom<br />
5 Pond water level raised to full level (0.9–1.1 m) 23 kg urea + 2.3 kg TSP/ha<br />
6 Pond water static <strong>for</strong> another five days<br />
7 Stocking <strong>of</strong> juveniles. Water exchange starts <strong>and</strong> is<br />
gradually increased.<br />
Source: Cook <strong>and</strong> Clif<strong>for</strong>d (1998)<br />
Maintenance rates according to pond<br />
productivity
Feeds <strong>and</strong> <strong>fertilizers</strong> <strong>for</strong> <strong>sustainable</strong> aquaculture development: a regional review <strong>for</strong> Latin America 61<br />
TABLE 12<br />
Combined (organic/inorganic) fertilization strategy employed by Ecuadorian shrimp farmers<br />
Fertilizer Initial application rate<br />
(kg/ha)<br />
Maintenance application rate<br />
(kg/ha)*<br />
Dried chicken manure 1 000 0<br />
Ground rice bran 50–200 6.8<br />
Urea 28 2.4<br />
Monoammonium phosphate 2.4 0.4<br />
Sodium metasilicate 10 1.5<br />
*If Secchi disk reading >45 cm<br />
Source: Nicovita (1999)<br />
In a relatively small proportion <strong>of</strong> farms (approximately 13 percent in the case<br />
<strong>of</strong> Mexico <strong>and</strong> 25 percent in the case <strong>of</strong> Ecuador) a combination <strong>of</strong> inorganic <strong>and</strong><br />
organic <strong>fertilizers</strong> is employed. A typical combined fertilization strategy employed by<br />
Ecuadorian shrimp farmers is presented in Table 12.<br />
In Cuba, inorganic fertilizer is applied routinely during the production cycle <strong>of</strong><br />
Cherax quadricarinatus. Dry chicken manure (500 kg/ha) <strong>and</strong> hay (1 000–1 250 kg/ha)<br />
are applied prior to stocking juveniles in grow-out ponds (Toledo, Centro de Preparación<br />
Acuicola Mampostón, 2005, pers. comm).<br />
A new generation <strong>of</strong> more specifically “aqua-balanced” <strong>fertilizers</strong> is being used in<br />
some countries <strong>of</strong> the region. Such is the case <strong>of</strong> a product called Fertilizarina (Protinal-<br />
Proagro, Venezuela) manufactured in Venezuela <strong>and</strong> sold locally. This product is an<br />
organic aquaculture fertilizer with a C:N ratio <strong>of</strong> 25:1 that has been specifically designed<br />
to enhance microbiotic colonization <strong>of</strong> the pond, thus stimulating the development <strong>of</strong><br />
the heterotrophic food web.<br />
Freshwater aquaculture<br />
Because <strong>of</strong> the increasing shift towards intensification, inorganic fertilization <strong>of</strong><br />
freshwater aquaculture ponds is declining in the Americas. Only a few species <strong>of</strong><br />
commercial relevance are cultured in extensive <strong>and</strong> semi-intensive farming systems<br />
using chemical <strong>fertilizers</strong>, e.g. monoculture <strong>of</strong> tilapia <strong>and</strong> common carp <strong>and</strong> to a lesser<br />
extent polyculture <strong>of</strong> Chinese carps in certain areas in Brazil <strong>and</strong> Mexico. A typical<br />
fertilizer schedule <strong>for</strong> juvenile tilapia in Ecuador is Urea at 20–30 kg/ha <strong>and</strong> TSP at<br />
2–5 kg/ha. In southern Mexico, tilapia farmers administer single superphosphate at<br />
8 kg/ha (dissolved in water) prior to stocking fingerling ponds. Depending on water<br />
turbidity, they subsequently apply 200–250 kg/ha <strong>of</strong> dried chicken manure.<br />
3.2 Organic fertilization<br />
Some <strong>of</strong> the larger semi-intensive shrimp <strong>and</strong>/or tilapia farms, medium-sized fish (carp<br />
or tilapia) <strong>and</strong> red claw farmers <strong>and</strong> many small-scale farmers use manure as fertilizer.<br />
However, given the availability <strong>and</strong> relatively low price <strong>of</strong> chemical <strong>fertilizers</strong>, the<br />
overall use <strong>of</strong> animal manure <strong>and</strong> or other <strong>for</strong>ms <strong>of</strong> organic <strong>fertilizers</strong> in aquaculture<br />
is limited.<br />
Animal manure is the most widely used <strong>for</strong>m, although many other agriculture byproducts<br />
are used to enhance nutrient levels in ponds. Table 13 presents a summary <strong>of</strong><br />
such products with recommended application rates.
62<br />
<strong>Study</strong> <strong>and</strong> <strong>analysis</strong> <strong>of</strong> <strong>feeds</strong> <strong>and</strong> <strong>fertilizers</strong> <strong>for</strong> <strong>sustainable</strong> aquaculture development<br />
TABLE 13<br />
Organic nutrients used as aquaculture <strong>fertilizers</strong> in Latin American countries<br />
Source <strong>of</strong><br />
nutrient<br />
St<strong>and</strong>ard application<br />
rate*<br />
Chicken manure 250–500 kg/ha Shrimp, tilapia,<br />
carp, red claw<br />
Species cultured Countries Level <strong>of</strong><br />
aquaculture<br />
Mexico, Ecuador, Cuba, Panama,<br />
Honduras, Brazil, Guatemala, Peru,<br />
Bolivarian Republic <strong>of</strong> Venezuela<br />
Commercial<br />
Cattle manure 500 kg/ha Carps Brazil, Cuba Commercial<br />
Pig manure 550–750 kg/ha Carps, tilapia Cuba Commercial<br />
Rice bran 300–400 kg/ha Shrimp Brazil, Ecuador, Mexico Commercial<br />
Sugar cane fibre 800 kg/ha Shrimp Belize, Brazil, Cuba, Honduras Commercial<br />
Molasses 19–120 kg/ha/week Shrimp Belize, Ecuador, Panama, Peru, Commercial<br />
Molasses 30–120 kg/ha Shrimp Colombia Commercial<br />
Chopped fresh 1 000–1 250 kg/ha Tilapia, pacú Brazil, Cuba, Mexico, Bolivarian Subsistence<br />
vegetable<br />
Republic <strong>of</strong> Venezuela<br />
Chopped weed 2 000–2 500 kg/ha Tilapia Guatemala, El Salvador, Mexico,<br />
Panama<br />
Subsistence<br />
Soybean meal 300–500 kg/ha Shrimp Brazil, Ecuador, Mexico, Honduras,<br />
Panama<br />
Commercial<br />
Alfalfa meal 280 kg/ha Tilapia Mexico, Panama Experimental<br />
Hay 1000–1 250 kg/ha Red claw Cuba<br />
Chaya (green<br />
leaves)<br />
20–30 kg/100 m2 /day Tilapia Mexico Subsistence<br />
C<strong>of</strong>fee pulp 300–600 kg/ha Tilapia, carp Cuba, Brazil, Mexico Subsistence<br />
Sources: Palomo <strong>and</strong> Arriaga (1993); MIDA (1998); Olvera (1994); S. Toledo, Mampostón, Cuba (2005, pers. comm.); M. Guillian,<br />
Ecuador (2006, pers. comm.); J. Zendejas, Cargill-Purina, Mexico (2005, pers. comm.)<br />
3.3 Availability<br />
Chemical <strong>fertilizers</strong> are inexpensive <strong>and</strong> readily available throughout Latin America,<br />
due to an ever increasing dem<strong>and</strong> by large <strong>and</strong> small-scale agriculture. The dem<strong>and</strong><br />
<strong>for</strong> <strong>fertilizers</strong> by agriculture is several orders <strong>of</strong> magnitude higher than the dem<strong>and</strong><br />
from aquaculture, hence aquafarmers are largely reliant on the types <strong>and</strong> composition<br />
<strong>of</strong> chemical <strong>fertilizers</strong> used by their local agriculture counterparts. Any shifts in<br />
the agriculture dem<strong>and</strong> <strong>for</strong> certain <strong>fertilizers</strong> may hold distinct disadvantages <strong>for</strong><br />
aquafarmers. For example, because <strong>of</strong> decreasing dem<strong>and</strong> the largest producer <strong>of</strong><br />
fertilizer in Mexico stopped the production <strong>of</strong> urea in 1998 (Espinosa-Carmona, 2002)<br />
(Table 14), one <strong>of</strong> the most common nitrogen sources <strong>for</strong> aquaculture ponds in Mexico.<br />
Since then urea is imported <strong>and</strong> this has put pressure on the price.<br />
Throughout the region there is very little structured research on fertilization in<br />
aquaculture, hence the adoption <strong>of</strong> general st<strong>and</strong>ard rates <strong>and</strong> methods <strong>of</strong> application.<br />
For example, farmers take little cognisance <strong>of</strong> soil or incoming water chemistry.<br />
Organic <strong>fertilizers</strong> are widely available throughout Latin America. The agriculturebased<br />
economy <strong>of</strong> many <strong>of</strong> the countries in the region, provide a huge potential<br />
resource base. The overall tendency to intensify culture practices on large-scale farms,<br />
together with a more efficient cost/benefit ratio <strong>of</strong> using readily available inorganic<br />
<strong>fertilizers</strong>, has encouraged the use <strong>of</strong> chemical as opposed to organic inputs. The<br />
rapidly emerging dem<strong>and</strong> <strong>for</strong> organically-grown products may however stimulate the<br />
dem<strong>and</strong> <strong>for</strong> organic nutrient sources by aquaculture.<br />
TABLE 14<br />
Production <strong>of</strong> inorganic <strong>fertilizers</strong> in Mexico between 1980 <strong>and</strong> 2000 (thous<strong>and</strong> tonnes)<br />
Year<br />
Fertilizer<br />
1980 1985 1990 1995 2000<br />
Urea 401 1367 1415 1508 0<br />
Ammonium sulphate 1069 1614 1596 1108 1446<br />
Diammonium phosphate 111 91 684 540 290<br />
Single superphosphate 275 314 176 117 75<br />
Triple superphosphate 115 253 235 281 85<br />
Source: Espinosa-Carmona (2002)
Feeds <strong>and</strong> <strong>fertilizers</strong> <strong>for</strong> <strong>sustainable</strong> aquaculture development: a regional review <strong>for</strong> Latin America 63<br />
Generally speaking, prices <strong>of</strong> inorganic <strong>fertilizers</strong> are relatively low. The cost <strong>of</strong><br />
inorganic fertilization usually accounts <strong>for</strong> 5 percent <strong>of</strong> the costs <strong>of</strong> <strong>feeds</strong> in shrimp<br />
farms (Flores-Nava, 1994). Prices <strong>of</strong> organic <strong>fertilizers</strong> have been gradually increasing<br />
as a result <strong>of</strong> a growing dem<strong>and</strong> <strong>for</strong> manure as a source <strong>of</strong> protein in animal husb<strong>and</strong>ry<br />
(e.g. reaching US$130/tonne <strong>for</strong> chicken manure in Mexico).<br />
3.4 Sustainability<br />
Table 15 presents a summary <strong>of</strong> factors affecting the <strong>sustainable</strong> use <strong>of</strong> <strong>fertilizers</strong> in<br />
Latin American aquaculture.<br />
TABLE 15<br />
Summary <strong>of</strong> positive <strong>and</strong> negative externalities likely to affect the sustainability <strong>of</strong> the use <strong>of</strong> <strong>fertilizers</strong> in<br />
aquaculture in Latin America<br />
Factor Inorganic <strong>fertilizers</strong> Organic <strong>fertilizers</strong><br />
Positive Negative Positive Negative<br />
Form <strong>of</strong><br />
production<br />
Potential<br />
environmental<br />
impact <strong>of</strong> use<br />
Market<br />
related issues<br />
Increased number<br />
<strong>of</strong> industries (i.e.,<br />
Brazil <strong>and</strong> Mexico)<br />
that produce<br />
nitrogen <strong>fertilizers</strong><br />
in <strong>sustainable</strong> <strong>for</strong>ms<br />
(atmospheric sources)<br />
Possibility <strong>of</strong> using the<br />
adequate chemical<br />
balance <strong>for</strong> the type<br />
<strong>of</strong> water <strong>and</strong>/or soil<br />
where it is to be<br />
applied<br />
Inexpensive due to<br />
large supply <strong>for</strong> the<br />
agriculture sector<br />
Legal aspects Growing concern<br />
puts pressure on<br />
governments <strong>for</strong><br />
tougher regulations<br />
Risk <strong>of</strong> decline <strong>of</strong><br />
phosphoric rocks if<br />
used in excess<br />
Increasing risk <strong>of</strong><br />
eutrophication <strong>of</strong><br />
receiving water<br />
bodies. Most<br />
countries in the<br />
region still with s<strong>of</strong>t<br />
control measures<br />
Specific availability<br />
dependent on the<br />
needs <strong>of</strong> the local<br />
agriculture sector.<br />
Ecological awareness<br />
<strong>of</strong> consumers will<br />
decrease dem<strong>and</strong> <strong>for</strong><br />
chemical inputs<br />
Adequate regulations<br />
still a long way from<br />
becoming strict laws.<br />
Sustainable if sources<br />
are chemical-free<br />
Could be a<br />
stimulating factor <strong>for</strong><br />
re-using agricultural<br />
wastes, thus reducing<br />
organic discharges.<br />
Wide spectrum <strong>of</strong><br />
inexpensive nutrient<br />
sources locally<br />
available in every<br />
region.<br />
Growing dem<strong>and</strong> <strong>for</strong><br />
“organic” labelled<br />
products will trigger<br />
dem<strong>and</strong> <strong>for</strong> organic<br />
inputs.<br />
Pressure upon<br />
agriculture <strong>and</strong> livestock<br />
farmers to<br />
adequately dispose<br />
wastes. Their use in<br />
aquaculture could be<br />
a solution<br />
Availability Widely available Limited diversity Widely available.<br />
Possibility <strong>of</strong> widening<br />
the spectrum <strong>of</strong><br />
nutrient sources<br />
Intensive <strong>for</strong>m <strong>of</strong><br />
agriculture or animal<br />
husb<strong>and</strong>ry involves the<br />
use <strong>of</strong> antibiotics or<br />
pesticides that can be<br />
transferred in by-products<br />
used in aquaculture<br />
Potential dissemination <strong>of</strong><br />
pathogens if manures are<br />
not certified by sanitary<br />
personnel.<br />
Opportunity cost <strong>of</strong> avian<br />
manures is high due to<br />
growing dem<strong>and</strong> as a<br />
source <strong>of</strong> protein <strong>for</strong><br />
cattle or pigs. An increase<br />
in the dem<strong>and</strong> by the<br />
“organic aquaculture”<br />
sector is likely to put<br />
further pressure on prices.<br />
No regulations regarding<br />
possible toxicity or<br />
pathogenicity <strong>of</strong> animal<br />
or agricultural<br />
by-products<br />
Increasing dem<strong>and</strong> <strong>for</strong> a<br />
wider spectrum <strong>of</strong> users<br />
will affect availability in<br />
the short term<br />
4. THE AQUAFEED INDUSTRY IN LATIN AMERICA<br />
The animal feed milling industry <strong>of</strong> Latin America has grown steadily over the past<br />
30 years, as a result <strong>of</strong> the intensification <strong>and</strong> expansion <strong>of</strong> the poultry, cattle, pig <strong>and</strong><br />
aquaculture sectors throughout the region. Brazil <strong>and</strong> Mexico rate among the worlds<br />
top 10 animal feed producing nations (J. Cordeiro, Assoc. Nacional de Fabricantes de<br />
Alimentos do Brasil (ANFAL), Brazil, 2005, pers. comm.). Animal feed production in<br />
Latin American countries is summarized in Figure 6 <strong>and</strong> Table 16 summarizes aquafeed<br />
production in the six target countries as well as in Guatemala.<br />
Salmon, shrimp <strong>and</strong> tilapia farming are the largest <strong>and</strong> most dynamic aquaculture<br />
activities in the region <strong>and</strong> the overall volume <strong>of</strong> aquafeed production is largely a<br />
reflection <strong>of</strong> the per<strong>for</strong>mance <strong>of</strong> these sectors in each country. Large-scale events such<br />
as over-production <strong>of</strong> <strong>feeds</strong> or the outbreak <strong>of</strong> epizootics can have a direct <strong>and</strong> serious<br />
impact on the aquaculture sector, inclusive <strong>of</strong> the aquafeed industry.
64<br />
FIGURE 6<br />
Production <strong>of</strong> animal <strong>feeds</strong> in Latin American<br />
countries in 2003<br />
Source: J. Cordeiro, ANFAL, Brazil (2005, pers. comm.)<br />
<strong>Study</strong> <strong>and</strong> <strong>analysis</strong> <strong>of</strong> <strong>feeds</strong> <strong>and</strong> <strong>fertilizers</strong> <strong>for</strong> <strong>sustainable</strong> aquaculture development<br />
Figure 7 shows the production <strong>of</strong> shrimp<br />
<strong>and</strong> tilapia <strong>feeds</strong> in Brazil <strong>and</strong> Mexico. After<br />
an unprecedented increase in shrimp feed<br />
production <strong>of</strong> 46 percent in 2002, severe viral<br />
epizootics hit the Mexican shrimp farming sector,<br />
thus drastically reducing to only 4 percent the<br />
expected feed dem<strong>and</strong>, despite an expansion <strong>of</strong><br />
more than 10 percent in the shrimp culture surface<br />
area. Ecuador, the largest shrimp producer on<br />
the continent has also been severely hit by a<br />
range <strong>of</strong> viral epizootics. The first occurred in<br />
the early 1990´s when Taura syndrome caused<br />
a reduction <strong>of</strong> over 20 percent in the overall<br />
shrimp production <strong>and</strong> then in 1999, a year<br />
on year collapse <strong>of</strong> nearly 50 percent caused<br />
by “white spot” disease. Similar events have<br />
been experienced throughout Central America<br />
<strong>and</strong> all have had a negative impact on aquafeed<br />
production in the region.<br />
TABLE 16<br />
Production <strong>of</strong> aquaculture <strong>feeds</strong>, percent contribution to total national animal feed production <strong>and</strong> the<br />
number <strong>of</strong> aquafeed mills in several Latin American countries in 2003<br />
Country Number <strong>of</strong> feed mills<br />
producing aqua<strong>feeds</strong><br />
Production <strong>of</strong> aqua<strong>feeds</strong> in<br />
2003 (tonnes)<br />
% <strong>of</strong> national<br />
total animal feed<br />
production<br />
Source<br />
Chile 10 750 000 15 Villarroel (2003), Infante (2003)<br />
Brazil 30 200 000 0.5 Waldige <strong>and</strong> Caseiro (2003); Scorvo<br />
(2003)<br />
Mexico 11 109 000 0.7 Panorama Acuicola (2004a)<br />
Ecuador 12 97 000 6.9 M. Dewind, National Chamber <strong>of</strong><br />
Aquaculturists <strong>of</strong> Ecuador, pers. comm.<br />
Sistema de In<strong>for</strong>mación Agropecuaria<br />
de Ecuador (2003, pers. comm.)<br />
Bolivarian<br />
Republic <strong>of</strong><br />
Venezuela<br />
Cuba 2<br />
(one experimental)<br />
4 30 000 1.7 J. Velazco, National Institute <strong>of</strong><br />
Fisheries, pers. comm.<br />
4 000 (commercial shrimp<br />
feed) <strong>and</strong> 187 000 silage<br />
(experimental)<br />
– S. Toledo, Centro de Preparación<br />
Acuícola Mampostón, Cuba, pers.<br />
comm. <strong>and</strong> Toledo (2004)<br />
Guatemala 1 8 000 2 J. Zendejas, Cargill-Purina, pers. comm.<br />
FIGURE 7<br />
Shrimp <strong>and</strong> finfish feed production in Brazil <strong>and</strong> Mexico during the period 2001–2005<br />
(figures <strong>for</strong> the year 2005 are estimated)<br />
Source: Waldige <strong>and</strong> Caseiro (2003); J. Zendejas, Cargill-Purina, Mexico (2005, pers. comm.)
Feeds <strong>and</strong> <strong>fertilizers</strong> <strong>for</strong> <strong>sustainable</strong> aquaculture development: a regional review <strong>for</strong> Latin America 65<br />
5. A REVIEW OF FEEDS AND FEEDING IN AQUACULTURE<br />
5.1 Feed composition<br />
Although only a few large feed companies compete <strong>for</strong> the growing aquafeed market in<br />
the region, there is a wide spectrum <strong>of</strong> br<strong>and</strong>s, species-specific <strong>feeds</strong> <strong>and</strong> <strong>for</strong>mulations<br />
available in the Americas. Typical proximate analyses <strong>and</strong> compositions <strong>of</strong> commercial<br />
shrimp <strong>and</strong> freshwater fish <strong>feeds</strong> in Latin America are presented in Tables 17 <strong>and</strong> 18.<br />
In Brazil <strong>and</strong> Mexico manufacturers recognise the growing environmental concerns<br />
<strong>and</strong> state that their <strong>feeds</strong> are highly water stable to minimize leaching <strong>of</strong> nutrients such<br />
as phosphorus into the environment. Paradoxically, <strong>feeds</strong> in Brazil have the highest<br />
phosphorus levels in the region.<br />
Water stability <strong>of</strong> shrimp <strong>feeds</strong> varies between 30 minutes <strong>and</strong> 3 hours, depending<br />
on the binding agent used (author’s observations).<br />
Water stability <strong>of</strong> pellets depends on the processing technique. Sinking pellets <strong>for</strong><br />
catfish <strong>and</strong> carp have a low stability (3–15 minutes, according to Nicovita, Ecuador),<br />
while extruded floating pellets are significantly more water stable.<br />
TABLE 17<br />
Proximate composition <strong>of</strong> commercial marine shrimp diets in selected Latin American countries<br />
Country Crude protein Crude lipid Crude fibre Phosphorus Sources (Br<strong>and</strong>)<br />
Brazil 25–40 5.0–8.0 4.5–6.0 0.7–1.45 www.agribr<strong>and</strong>s.com.br<br />
www.guabi.com.br<br />
www.classipet.com.br<br />
Ecuador 20–45 5.0–8.0 3.0–5.0 1.0–1.5 www.nicovita.com.ec<br />
Guatemala 20–35 6.5–8.5 4.0–5.0 0.9–1.25 www.agribr<strong>and</strong>s.com.gu<br />
Mexico 20–40 6.0–9.5 4.0–5.0 0.9–1.25 www.agribr<strong>and</strong>s.com.mx<br />
www.nutrinas.com.mx<br />
www.piasa.com.mx<br />
www.ziegler.com.mx<br />
Panama 20–35 4.0–9.0 3.5–6.0 1.20 J. Zendejas (2005, pers. comm.);<br />
Agribr<strong>and</strong>s Purina, Mexico (2005,<br />
pers. comm.)<br />
Bolivarian<br />
Republic <strong>of</strong><br />
Venezuela<br />
25–35 4.0–8.0 3.0–5.0 0.9–1.4 www.agribr<strong>and</strong>s.com.ve<br />
TABLE 18<br />
Proximate composition <strong>of</strong> commercially available finfish <strong>feeds</strong> in Latin America<br />
% Tilapia Carp Trout Sources (Br<strong>and</strong>)<br />
BRAZIL<br />
ECUADOR<br />
MEXICO<br />
BOLIVARIAN<br />
REPUBLIC OF<br />
VENEZUELA<br />
Crude protein 20–42 20–35 30–55<br />
Crude lipid 4–6 3–6 6–12<br />
Crude fibre 6–10 6–10 4–5<br />
Phosphorus 0.6–1.2 0.6–1.2 0.6–1.0<br />
Crude protein 25–45 - 35–50<br />
Crude lipid 3–6 - 6–9<br />
Crude fibre 5–9 - 4–6<br />
Phosphorus 0.9–1.3 - 0.9–1.0<br />
Crude protein 25–42 22–30 35–55<br />
Crude lipid 3–4 3–4 8–12<br />
Crude fibre 5–10 5–10 4–6<br />
Phosphorus 0.7–1.0 0.7–1.0 0.9–1.2<br />
Crude protein 20–28 - 40–45<br />
Crude lipid 5.0–6.5 - 10–12<br />
Crude fibre 3–6 - 3–6<br />
Phosphorus 1.0–1.2 - 0.9–1.2<br />
www.agribr<strong>and</strong>s.com.br<br />
www.classipet.com.br<br />
www.cocari.com.br<br />
www.guabi.com.br<br />
www.socil.com.br<br />
www.nicovita.com.ec<br />
M. Dewind, National Chamber<br />
<strong>of</strong> Aquaculturists <strong>of</strong> Ecuador,<br />
(2005, pers. comm.)<br />
www.agribr<strong>and</strong>s.com.mx<br />
www.nutrinas.com.mx<br />
www.ziegler.com.mx<br />
www.agribr<strong>and</strong>s.com.ve
66<br />
<strong>Study</strong> <strong>and</strong> <strong>analysis</strong> <strong>of</strong> <strong>feeds</strong> <strong>and</strong> <strong>fertilizers</strong> <strong>for</strong> <strong>sustainable</strong> aquaculture development<br />
5.2 Ingredients<br />
Fishmeal continues to be the core protein source employed by aquafeed manufacturers<br />
in Latin America. Other major protein sources include commodities such as soybean<br />
meal <strong>and</strong> wheat meal, prices <strong>of</strong> which are a function <strong>of</strong> global availability <strong>and</strong> exchange<br />
rates. These key st<strong>and</strong>ard ingredients are common to practically all commercially<br />
available aqua<strong>feeds</strong> throughout the region <strong>and</strong> are traded within the region.<br />
Other ingredients commonly used in aquafeed <strong>for</strong>mulations include maize,<br />
sorghum, wheat bran, maize gluten, cottonseed meal, groundnut meal, sesame<br />
meal, meat meal, feather meal <strong>and</strong> alfalfa meal. For example, a Venezuelan aquafeed<br />
manufacturer (Protinal, Zulia, Venezuela) reports the following ingredients in some<br />
<strong>of</strong> their <strong>for</strong>mulations: fish, soybean <strong>and</strong> meat meals; wheat bran, stabilized fat, fish<br />
oil, calcium carbonate <strong>and</strong> calcium phosphate, trace minerals (Co, Zn, Mn, Cu, Se, I);<br />
vitamins A, B1, B2, B6, B12, C, D, E, K, folic acid, biotin, pantothenic acid, choline,<br />
niacin <strong>and</strong> inositol.<br />
Table 19 summarizes the most common protein sources employed by aquaculture<br />
feed manufacturers in Latin America, their country <strong>of</strong> origin, as well as some market<br />
related factors likely to affect their availability <strong>and</strong> prices.<br />
Generally speaking, the core protein sources employed by the Latin American<br />
aquafeed industry are global commodities <strong>for</strong> which there is a high international<br />
dem<strong>and</strong>. World prices <strong>for</strong> fishmeal, corn, wheat <strong>and</strong> soybeans show an increasing trend<br />
because <strong>of</strong> increasing dem<strong>and</strong> <strong>and</strong> declining supplies caused by climatic events.<br />
TABLE 19<br />
Most important protein sources used by aquafeed manufacturers in Latin America <strong>and</strong> factors likely to affect<br />
their <strong>sustainable</strong> use<br />
Source <strong>of</strong><br />
protein<br />
Degree <strong>of</strong><br />
availability<br />
Countries that produce it in<br />
the region<br />
Fishmeal High Chile, Peru, Ecuador, Brazil<br />
<strong>and</strong> Mexico. (only relatively<br />
small volumes produced in<br />
Brazil <strong>and</strong> Mexico)<br />
Soybean<br />
meal<br />
High Brazil, Argentina, Uruguay,<br />
Mexico<br />
Corn High Argentina, Brazil, Mexico,<br />
Colombia<br />
Blood meal,<br />
bone <strong>and</strong><br />
meat meals<br />
Medium Argentina, Uruguay,<br />
Paraguay, Colombia,<br />
Mexico, Bolivarian Republic<br />
<strong>of</strong> Venezuela<br />
Wheat bran High Argentina, Brazil,<br />
Colombia, Mexico<br />
Market/price-related constraints to the aquaculture<br />
industry<br />
Prices have steadily increased as a direct function<br />
<strong>of</strong> global dem<strong>and</strong>. Climatic changes have had an<br />
impact on catches<br />
Regardless <strong>of</strong> local availability, prices are<br />
determined by global supply/dem<strong>and</strong>. Price <strong>of</strong> this<br />
commodity has increased from US$92/tonne in 2000,<br />
to US$221/tonne in 2003.<br />
High dem<strong>and</strong> <strong>for</strong> direct human consumption (Staple<br />
diet in many countries <strong>of</strong> the region) puts pressure<br />
on prices, which combined with local crop failures<br />
have increased prices by 100% in Brazil, or between<br />
25 <strong>and</strong> 35% in Mexico<br />
By-products <strong>of</strong> the cattle farming industry. Mostly<br />
consumed locally, due to sanitary regulations.<br />
Production in some countries like Mexico <strong>and</strong><br />
Paraguay, impacted indirectly by imports <strong>of</strong> low-cost<br />
meat, which results in local herd reduction.<br />
Argentina is one <strong>of</strong> the top world producers <strong>and</strong><br />
has experienced a reduction in production due to<br />
adverse climatic conditions. Prices are also a function<br />
<strong>of</strong> world supply <strong>and</strong> dem<strong>and</strong>, <strong>and</strong> increased 100%<br />
between 2000 <strong>and</strong> 2002.<br />
Lupin seed High Chile, Argentina Most <strong>of</strong> the production devoted to salmonid<br />
aquaculture. Culture areas expected to exp<strong>and</strong> to<br />
meet aquaculture needs.<br />
Source: Waldige <strong>and</strong> Casseiro (2003); Panorama Acuícola (2004a); Ministerio de Agricultura de Ecuador (2004); J. Cordeiro, ANFAL,<br />
Brazil (2005, pers. comm.); J. Zendejas, Cargill-Purina, Mexico (2005, pers. comm.); Infante (2003)<br />
5.3 The case <strong>of</strong> Chilean salmon <strong>feeds</strong><br />
If aquaculture is to be <strong>sustainable</strong> in Latin America then a good example <strong>of</strong> the<br />
challenges facing the industry is the case <strong>of</strong> the salmon feed industry in Chile. In 2003,<br />
the salmon industry dem<strong>and</strong>ed 750 000 tonnes <strong>of</strong> feed, which included some 272 000<br />
tonnes <strong>of</strong> fishmeal (this accounted <strong>for</strong> 78 percent <strong>of</strong> Chilean fishmeal usage in that year).
Feeds <strong>and</strong> <strong>fertilizers</strong> <strong>for</strong> <strong>sustainable</strong> aquaculture development: a regional review <strong>for</strong> Latin America 67<br />
The industry also consumed 211 000 tonnes <strong>of</strong><br />
fish oil, <strong>and</strong> a high proportion <strong>of</strong> grains produced<br />
both in <strong>and</strong> out <strong>of</strong> the country (Figure 8).<br />
Chilean production <strong>of</strong> salmon is expected to<br />
grow at an average rate <strong>of</strong> 10 percent per annum<br />
<strong>for</strong> the <strong>for</strong>eseeable future (Infante, 2003). At this<br />
pace, within the next ten years, an additional<br />
110 000 ha <strong>of</strong> wheat <strong>and</strong> lupin as well as 780 000<br />
tonnes <strong>of</strong> fishmeal will be needed exclusively to<br />
meet the core dem<strong>and</strong>s <strong>for</strong> salmon <strong>feeds</strong>.<br />
5.4 Alternative protein sources<br />
Following a global tendency, several research<br />
groups particularly in Chile, Ecuador, Mexico<br />
<strong>and</strong> Brazil have been working to identify <strong>and</strong> test<br />
a range <strong>of</strong> protein sources to replace fishmeal.<br />
However, despite the high biodiversity in<br />
countries like Brazil, Ecuador <strong>and</strong> Mexico,<br />
research <strong>and</strong> financial resources devoted to<br />
aquaculture nutrition <strong>and</strong> more specifically to<br />
finding fishmeal replacements in the region are<br />
still very modest. Hence the Latin American<br />
aqua<strong>feeds</strong> industry is still almost exclusively dependent on the core protein sources<br />
mentioned above. Table 20 lists a number <strong>of</strong> alternative protein sources that have been<br />
tested experimentally or commercially in some countries in the region.<br />
Lipid sources include mostly fish oil, sunflower oil, corn oil, soybean oil <strong>and</strong><br />
cottonseed oil. The main regional producer <strong>and</strong> exporter <strong>of</strong> fish oil, which is by far the<br />
most common lipid source used in aqua<strong>feeds</strong>, is Chile followed by Peru. Lower quality<br />
fish oil is produced in smaller quantities in Mexico, Brazil <strong>and</strong> Ecuador, although<br />
mostly <strong>for</strong> domestic consumption. Vegetable oils are mainly produced in Mexico,<br />
TABLE 20<br />
Summary <strong>of</strong> non-conventional protein sources that have been tested <strong>and</strong> or used in some Latin American<br />
countries<br />
Common name Scientific name Species cultured Purpose Source<br />
C<strong>of</strong>fee pulp C<strong>of</strong>fea arabica Tilapia Experimental Bayne, Dunseth <strong>and</strong> Ramiros<br />
(1976)<br />
Rum distillation<br />
wastes<br />
Tilapia Experimental Kohler <strong>and</strong> Pagan-Font (1978)<br />
Yeast Hanola anomala Rainbow trout Experimental De la Higuera et al. (1981)<br />
Azolla Azolla mexicana Tilapia, carp Experimental Arrivillaga <strong>and</strong> Arredondo<br />
(1987)<br />
Lupin seed Lupinus spp Rainbow trout Experimental De la Higuera et al. (1988)<br />
Jack bean seed Canavalia ensi<strong>for</strong>mis Tilapia Experimental Martínez et al. (1988)<br />
Huaxim seed Sesbania gr<strong>and</strong>iflora Tilapia Experimental Olvera et al. (1988)<br />
Alfalfa leaves Medicago sativa Tilapia Experimental Hernández, Hernández <strong>and</strong><br />
Martinez (1991)<br />
Dendrocéfalo Dendrocephalus<br />
geayi<br />
Tambaquí Experimental Torres et al. (2003)<br />
Daphnia/fly<br />
larvae<br />
Daphnia spp<br />
Culex<br />
quinquefasciatus<br />
Langostilla Pleuroncodes<br />
planipes<br />
Fish silage<br />
-<br />
Cichlasoma<br />
istlanum<br />
Experimental Luna <strong>and</strong> Figueroa (2003)<br />
Shrimp Experimental Galicia (2003)<br />
Tilapia, carp,<br />
Catfish (Clarias<br />
spp.)<br />
FIGURE 8<br />
Schematic representation <strong>of</strong> the ingredient<br />
dem<strong>and</strong> by the Chilean salmon industry in 2003<br />
750 000 tonnes<br />
Salmon feed<br />
272 000 tonnes<br />
Fishmeal<br />
211 000 tonnes<br />
Fish oil<br />
117 000 tonnes<br />
Soybean meal<br />
94 000 tonnes<br />
Wheat meal<br />
47 000 tonnes<br />
Lupin<br />
Source: Modified from Infante (2003)<br />
Experimental <strong>and</strong><br />
commercial Toledo (2004)<br />
Kelp Macrocystis pirifera Commercial Panorama Acuícola (2004b)
68<br />
<strong>Study</strong> <strong>and</strong> <strong>analysis</strong> <strong>of</strong> <strong>feeds</strong> <strong>and</strong> <strong>fertilizers</strong> <strong>for</strong> <strong>sustainable</strong> aquaculture development<br />
Brazil, Argentina, Chile <strong>and</strong> Colombia <strong>and</strong> to a lesser extent in Uruguay <strong>and</strong> Venezuela.<br />
Nonetheless, feed manufacturers import large quantities <strong>of</strong> high quality vegetable oils<br />
from the United States <strong>of</strong> America <strong>and</strong> Canada. Prices <strong>of</strong> fish <strong>and</strong> vegetable oils have<br />
increased substantially with increasing dem<strong>and</strong> <strong>and</strong> reduced availability because <strong>of</strong><br />
periodic crop failures.<br />
5.5 Feeding strategies<br />
Shrimp farming<br />
Feeding regimes <strong>and</strong> strategies are similar throughout Latin American aquaculture. In<br />
general, farmers follow the recommendations <strong>and</strong> advice provided by technical staff <strong>of</strong><br />
large feed manufacturing companies.<br />
The great majority <strong>of</strong> shrimp farms (more than 90 percent) produce Pacific white<br />
shrimp, Litopenaeus vannamei, there<strong>for</strong>e practically 100 percent <strong>of</strong> the commercially<br />
available <strong>feeds</strong> are designed to meet the nutritional requirements <strong>of</strong> this species. The<br />
most common practice is to follow feeding tables recommended by feed manufacturers.<br />
These normally take into account st<strong>and</strong>ard stocking densities <strong>and</strong> climatic conditions<br />
<strong>of</strong> the region. Table 21 presents st<strong>and</strong>ard feeding regimes followed by farmers in Brazil,<br />
Ecuador, Mexico, Panama <strong>and</strong> Peru.<br />
TABLE 21<br />
Feeding regime employed by Pacific white shrimp (Litopenaeus vannamei) farmers in Latin<br />
America<br />
Shrimp weight<br />
% body weight/day<br />
(g)<br />
Brazil1 Ecuador2 Mexico3 Panama4 Peru5 1 13 - 16 12 14<br />
2 11 5.5 11.7 10 8.2<br />
3 10.5 4.7 8.6 9.0 6.2<br />
4 10 4.2 7.2 9.0 5.2<br />
5 9.3 3.9 6.2 8.0 4.5<br />
6 9.0 3.6 4.8 8.0 3.9<br />
7 8.4 3.3 4.4 7.0 3.6<br />
8 8.0 3.0 4.0 7.0 3.3<br />
9 7.2 2.9 3.9 6.5 3.0<br />
10 6.3 2.8 3.6 6.0 2.8<br />
11 5.7 2.6 3.5 5.5 2.6<br />
12 5.0 2.6 3.3 5.3 2.5<br />
13 4.2 2.5 3.1 5.1 2.3<br />
14 3.4 2.4 3.0 4.8 2.2<br />
15 3.0 2.3 2.9 4.8 2.1<br />
16 2.5 2.3 2.7 4.5 2.0<br />
17 2.4 2.2 2.5 4.0 2.0<br />
18 2.4 2.1 2.4 3.5 1.9<br />
19 2.4 2.0 2.4 3.0 1.8<br />
20 2.4 2.0 2.4 2.5 1.8<br />
21 2.4 1.9 2.4 2.5 1.8<br />
22 2.4 1.8 2.4 2.5 1.8<br />
Sources: 2 Villalón (1991); 1,5 Nunes (2000); 4 CODECA (2004); 3 Zendejas (2005)<br />
5.6 Feeding schedules <strong>and</strong> practices<br />
Farmers normally feed their fish or shrimp between noon <strong>and</strong> sunset to avoid low<br />
DO periods. Throughout Latin America shrimp farmers feed a minimum <strong>of</strong> 2 <strong>and</strong><br />
a maximum <strong>of</strong> 4 times a day, depending on the number <strong>and</strong> size <strong>of</strong> ponds <strong>and</strong> the<br />
available work<strong>for</strong>ce. A recommended feeding schedule <strong>for</strong> white shrimp, Litopenaeus<br />
setiferus in Yucatan, southeast Mexico is presented in Table 22.<br />
Over the past 10 years, Latin American shrimp farmers have increasingly adopted<br />
the use <strong>of</strong> feeding trays, as opposed to feeding manually with the aid <strong>of</strong> a boat. Feeding
Feeds <strong>and</strong> <strong>fertilizers</strong> <strong>for</strong> <strong>sustainable</strong> aquaculture development: a regional review <strong>for</strong> Latin America 69<br />
trays are circular in shape, between 0.60 <strong>and</strong> 1.20m<br />
in diameter <strong>and</strong> usually made <strong>of</strong> galvanized wire <strong>and</strong><br />
plastic mosquito mesh. Such trays are evenly distributed<br />
throughout the pond, at between 20 <strong>and</strong> 30 trays/ha.<br />
Farmers place the corresponding sub-ration <strong>of</strong> feed into<br />
each tray at pre-specified periods. The use <strong>of</strong> feeding<br />
trays is becoming very popular due to their usefulness<br />
in monitoring the feeding activity <strong>of</strong> shrimp as well<br />
as reducing the accumulation <strong>of</strong> wastes on the pond<br />
bottom.<br />
Finfish<br />
Given the level <strong>of</strong> intensification <strong>of</strong> salmon <strong>and</strong> trout<br />
culture, automatic feeding is employed in most farms,<br />
on a continuous intermittent basis. Feeding efficiency<br />
is high with average feed conversion ratios <strong>of</strong> 1.3:1<br />
(Villarroel, 2003).<br />
TABLE 22<br />
Recommended feeding<br />
schedule <strong>for</strong> white shrimp,<br />
Litopenaeus setiferus in semiintensive<br />
ponds in Yucatan,<br />
southeast Mexico<br />
Shrimp<br />
size (g)<br />
Feeding<br />
schedule<br />
% <strong>of</strong><br />
daily<br />
ration<br />
1.0–3.0 11:00 50<br />
17:00 50<br />
3.1–6.5 11:00 40<br />
17:00 30<br />
22:00 30<br />
>6.5 11:00 40<br />
14:00 10<br />
17:00 10<br />
21:00 40<br />
Source: Flores-Nava (1994)<br />
TABLE 23<br />
Feeding schedules <strong>for</strong> catfish, common carp <strong>and</strong> tilapia, employed by pond farmers in Mexico<br />
Mean fish<br />
weight (g)<br />
Catfish<br />
% body Times/day<br />
weight/day<br />
Common carp<br />
% body Times/day<br />
weight/day<br />
Tilapia<br />
% body Times/day<br />
weight/day<br />
25 4.0 2 4.5 3 4.5 3<br />
50 3.5 2 4.0 3 3.7 3<br />
75 3.2 2 3.6 3 3.4 3<br />
100 3.0 2 3.3 3 3.2 3<br />
150 2.8 1 3.1 2 3.0 2<br />
200 2.5 1 3.0 2 2.8 2<br />
250 2.2 1 2.6 2 2.5 2<br />
300 2.0 1 2.4 2 2.3 2<br />
400 1.6 1 2.1 2 2.0 2<br />
500 1.4 1 1.7 2 1.7 2<br />
600 1.2 1 1.4 2 1.4 2<br />
Source: Zendejas (2005)<br />
Most <strong>of</strong> the tilapia, catfish <strong>and</strong> trout farms in Latin American are semi-intensive<br />
<strong>and</strong> intensive, while carp <strong>and</strong> indigenous species are generally farmed extensively <strong>and</strong><br />
semi-intensively. Tilapia are normally fed during the warmest hours <strong>of</strong> the day between<br />
noon <strong>and</strong> 16:00 hours, irrespective <strong>of</strong> the culture system (floating cages or ponds).<br />
Farmers usually feed once or a maximum <strong>of</strong> twice a day, using a variety <strong>of</strong> methods that<br />
include delivery by h<strong>and</strong>, feed blowers, automatic <strong>and</strong> dem<strong>and</strong> feeders.<br />
Channel catfish Ictalurus punctatus farms are intensive <strong>and</strong> 100 percent dependent on<br />
commercial <strong>feeds</strong>, which are usually provided twice a day during the juvenile stages <strong>and</strong><br />
once a day during the grow-out stages between 11:00 <strong>and</strong> 15:00 hours. Sinking pellets are<br />
fed using either feed blowers or are manually distributed. Rainbow trout Oncorhynchus<br />
mykiss are fed floating extruded pellets, either manually (2–4 four times a day) or using<br />
automatic feeders (4–6 times a day). Table 23 presents recommended feeding schedules<br />
<strong>for</strong> catfish, common carp <strong>and</strong> tilapia, as employed by farmers in Mexico.<br />
5.7 Supplementary <strong>and</strong> other <strong>feeds</strong><br />
Farm-made <strong>feeds</strong><br />
Farm-made <strong>feeds</strong> are practically non-existent in the region. A limited number <strong>of</strong> smallscale<br />
farmers in Cuba <strong>and</strong> Brazil use agricultural by-products including c<strong>of</strong>fee pulp, rice<br />
<strong>and</strong> wheat bran as well as fishmeal, when available, to replace or complement <strong>for</strong>mulated<br />
complete diets when these are in short supply or when farm cash flow is problematic.
70<br />
<strong>Study</strong> <strong>and</strong> <strong>analysis</strong> <strong>of</strong> <strong>feeds</strong> <strong>and</strong> <strong>fertilizers</strong> <strong>for</strong> <strong>sustainable</strong> aquaculture development<br />
Farm-made <strong>feeds</strong> are more common in the ornamental fish industry, regardless <strong>of</strong><br />
the production scale. A range <strong>of</strong> nutrient sources are used, ranging from ground, dried<br />
shrimp heads to cereals <strong>and</strong> boiled eggs.<br />
Given the wide range <strong>of</strong> agricultural <strong>and</strong> industrial by-products <strong>and</strong> other potential<br />
nutrient sources that are readily available, capacity should be developed <strong>and</strong> built<br />
to <strong>for</strong>mulate <strong>and</strong> manufacture inexpensive, farm-made <strong>feeds</strong> using agricultural byproducts.<br />
This would stimulate rural aquaculture throughout the region <strong>and</strong> rural<br />
development is desperately needed throughout the region.<br />
Use <strong>of</strong> trash fish<br />
Trash fish is only used as feed in the emerging tuna cage culture industry in Mexico.<br />
More than 100 tonnes <strong>of</strong> tuna is currently produced <strong>and</strong> the industry is growing fast.<br />
Given the exclusive dependence on trash fish <strong>and</strong> considering an FCR <strong>of</strong> at least 3:1,<br />
then at least 300 tonnes <strong>of</strong> trash fish is used at current capacity.<br />
6. THE POSSIBLE IMPACT OF FEEDS ON THE SUSTAINABLE<br />
DEVELOPMENT OF AQUACULTURE IN LATIN AMERICA<br />
The pattern <strong>of</strong> growth <strong>of</strong> the aquaculture industry in Latin America is similar to many<br />
parts <strong>of</strong> the world <strong>and</strong> is characterized by intensification, increasing number <strong>and</strong><br />
size <strong>of</strong> farms <strong>and</strong> a growing number <strong>of</strong> cultured species. Consequently, the aquafeed<br />
industry in the region has experienced dramatic growth over the past 20 years. On the<br />
other h<strong>and</strong>, the collapse <strong>of</strong> shrimp production because <strong>of</strong> diseases in several countries<br />
(Ecuador, Mexico <strong>and</strong> other Central American countries) during the 1980s <strong>and</strong> 1990s<br />
had a hugely negative impact on the aqua<strong>feeds</strong> industry in the region.<br />
The inter-dependence <strong>of</strong> feed manufacturers <strong>and</strong> farmers is the Achilles heel <strong>of</strong><br />
<strong>sustainable</strong> aquaculture development in Latin America. Given that the contribution<br />
<strong>of</strong> feed to total production costs has reached levels <strong>of</strong> 65 percent (Panorama Acuícola,<br />
2007) highlights a number <strong>of</strong> factors that will impact on the future development <strong>of</strong> a<br />
<strong>sustainable</strong> aquaculture industry in Latin America. The most important <strong>of</strong> these are:<br />
6.1 Food safety<br />
Increasing trade <strong>of</strong> aquaculture inputs <strong>and</strong> farmed products is prompting governments,<br />
farmers <strong>and</strong> feed manufacturers to adopt quality control measures <strong>and</strong> traceability<br />
programmes to comply with international food safety requirements. This will<br />
certainly induce a feedback system <strong>of</strong> practices that will improve product quality <strong>and</strong><br />
competitiveness within the sector.<br />
6.2 Price-related factors<br />
Large international corporations have been buying smaller feed manufacturers<br />
throughout the region. This has resulted in a regionalisation <strong>of</strong> markets, reducing local<br />
competition, fewer types <strong>of</strong> <strong>feeds</strong> <strong>and</strong> in some instances has resulted in reduced feed<br />
quality <strong>and</strong> higher prices.<br />
6.3 Availability <strong>of</strong> raw materials<br />
The main protein <strong>and</strong> lipid ingredients are world trade commodities, the availability<br />
<strong>of</strong> which is dependent upon a series <strong>of</strong> stochastic factors such as crop success or<br />
failure <strong>and</strong> climatic conditions. These, together with local exchange rates determine<br />
the pricing <strong>of</strong> such ingredients. Prices <strong>of</strong> raw materials have increased several times in<br />
some cases over the past 10 years <strong>and</strong> are likely to continue increasing, due to recent<br />
adverse climatic conditions in major producing countries (e.g. El Niño events in Peru<br />
<strong>and</strong> Ecuador have impacted on fishmeal production). Moreover, global warming <strong>and</strong><br />
climate change will in future also affect the availability <strong>of</strong> agricultural commodities.<br />
The pressure on fishery resources to produce fishmeal <strong>and</strong> l<strong>and</strong> surface area to grow
Feeds <strong>and</strong> <strong>fertilizers</strong> <strong>for</strong> <strong>sustainable</strong> aquaculture development: a regional review <strong>for</strong> Latin America 71<br />
increasing volumes <strong>of</strong> grains to meet a highly dem<strong>and</strong>ing industry will certainly<br />
compromise the sustainability <strong>of</strong> the aquaculture sector within the next decade.<br />
6.4 Research on alternative sources <strong>of</strong> protein<br />
Despite the great biodiversity <strong>of</strong> the Latin American region research results on<br />
potential sources <strong>of</strong> alternative protein <strong>and</strong> lipids to replace fishmeal <strong>and</strong> fish oil are<br />
still very modest. This highlights the short sightedness <strong>of</strong> those large aquaculture<br />
corporations that do not invest in research <strong>and</strong> development. The academic sector<br />
lacks the necessary resources to accelerate investigations on the wide spectrum <strong>of</strong><br />
possible (plant <strong>and</strong> animal) feed resources to partially or completely replace fishmeal,<br />
as well as <strong>for</strong> example research on improving the nutrient utilization <strong>of</strong> agricultural <strong>and</strong><br />
industrial by-products.<br />
6.5 Responsible feeding practices<br />
Although there is a growing tendency <strong>for</strong> farmers <strong>and</strong> technical advisors to implement<br />
internationally accepted <strong>and</strong> responsible aquaculture practices, many large farms<br />
throughout the region still practise feeding strategies that contribute little to<br />
sustainability. Examples <strong>of</strong> this are the absence <strong>of</strong> a monitoring scheme <strong>of</strong> water<br />
quality in relation to feeding <strong>and</strong> the absence <strong>of</strong> indicators <strong>of</strong> feed utilization <strong>and</strong><br />
efficiency. This is a reflection <strong>of</strong> the lack <strong>of</strong> structured national responsible aquaculture<br />
programmes. Consequently <strong>and</strong> in many instances, farmer training <strong>and</strong> adoption <strong>of</strong><br />
<strong>sustainable</strong> practices depends exclusively on the technical assistance provided by feed<br />
manufacturers <strong>and</strong>, to a lesser extent, the academic sector <strong>of</strong> each country. The use <strong>of</strong><br />
feeding trays in the shrimp industry has become a popular way <strong>of</strong> reducing feed waste<br />
<strong>and</strong> reducing organic matter <strong>and</strong> nutrients discharges into the environment. However,<br />
it is highly questionable whether the reliance <strong>of</strong> farmers on feed manufacturers is a<br />
healthy situation with respect to the <strong>sustainable</strong> development <strong>of</strong> the sector.<br />
6.6 Environmental regulations<br />
The legislative frameworks in relation to <strong>sustainable</strong> aquaculture development in Latin<br />
America are still very weak. Although important advances have been made in relation<br />
to habitat modification, organic discharges <strong>and</strong> movement <strong>of</strong> exotic aquaculture<br />
species, regulations regarding <strong>feeds</strong> <strong>and</strong> <strong>fertilizers</strong> are almost non-existent. Physical<br />
properties <strong>of</strong> feed particles or levels <strong>of</strong> potentially leaching nutrients are not regulated.<br />
However, the pace at which regulations are changing with respect to aquaculture inputs<br />
is accelerating in some countries (e.g. Mexico, Brazil <strong>and</strong> Chile) <strong>and</strong> this is mainly<br />
because <strong>of</strong> increasing international trade relations, requirements <strong>and</strong> agreements.<br />
The use <strong>of</strong> trash fish, although still limited in volume, might escalate as tuna<br />
aquaculture exp<strong>and</strong>s, especially in Mexico. This could raise several questions regarding<br />
quality <strong>and</strong> competition with human consumption.<br />
6.7 Use <strong>of</strong> <strong>fertilizers</strong><br />
Fertilizers used in aquaculture are in most instances identical to those used in<br />
agriculture. This creates a dependency on the local agriculture sectors. Moreover,<br />
chemical fertilization is a st<strong>and</strong>ard practice in semi-intensive shrimp or fish farms <strong>of</strong> the<br />
region <strong>and</strong> large quantities <strong>of</strong> unused nutrients are discharged into the environment.<br />
The use <strong>of</strong> organic <strong>fertilizers</strong> is gradually decreasing, as the dem<strong>and</strong> <strong>for</strong> manure in other<br />
agricultural sectors increases <strong>and</strong> consequently prices have reached non-competitive<br />
levels.<br />
6.8 Sustainable aquaculture technologies<br />
Use <strong>of</strong> environmentally sound technologies <strong>for</strong> aquaculture in Latin America is still<br />
incipient, although it is growing. Their use is stimulated by international acceptance
72<br />
<strong>Study</strong> <strong>and</strong> <strong>analysis</strong> <strong>of</strong> <strong>feeds</strong> <strong>and</strong> <strong>fertilizers</strong> <strong>for</strong> <strong>sustainable</strong> aquaculture development<br />
<strong>and</strong> import tax reduction <strong>for</strong> “organic aquaculture products”. Although limited in<br />
number, a few commercial farms in Belize, Brazil, Peru <strong>and</strong> Mexico have adopted zerowater<br />
exchange practices, high aeration culture systems. Polyculture <strong>and</strong> integrated<br />
aquaculture have slowly been adopted by farmers in Brazil, Mexico, Peru, Panama <strong>and</strong><br />
Honduras. Aquaponics is also becoming a popular alternative in small-scale aquaculture<br />
in southeast Mexico. Such systems ensure maximum resource utilization <strong>and</strong> more<br />
farmers should be encouraged to adopt a more organic approach to aquaculture in the<br />
future.<br />
The use <strong>of</strong> probiotics, enzymes <strong>and</strong> immuno-stimulants, as feed additives, or<br />
prebiotics applied directly into the water is also still incipient but growing. Some<br />
leading farmers have reported encouraging results, particularly in Ecuador (Garriques<br />
<strong>and</strong> Arevalo, 1995).<br />
6.9 Feed manufacturing technologies<br />
Extruded, coated, highly stable feed particles are becoming more common in the<br />
aquaculture industry. This directly contributes to lower levels <strong>of</strong> pollution <strong>and</strong> higher<br />
production rates through improved feed utilization. The use <strong>of</strong> such <strong>feeds</strong> must be<br />
promoted throughout the region.<br />
7. RECOMMENDATIONS<br />
• Governments should introduce national quality st<strong>and</strong>ards <strong>for</strong> raw materials <strong>and</strong><br />
<strong>feeds</strong> as well as <strong>for</strong> farmed products to strengthen the international competitiveness<br />
<strong>of</strong> national aquaculture sectors, <strong>and</strong> to provide better quality food <strong>for</strong> human<br />
consumption. This should be done taking into account the present range <strong>of</strong><br />
culture systems <strong>and</strong> intensification.<br />
• Research on alternative sources <strong>of</strong> protein <strong>and</strong> energy to replace fishmeal <strong>and</strong><br />
fish oil at least partially, should be encouraged, particularly taking into account<br />
the availability <strong>of</strong> regional resources, including agricultural <strong>and</strong> industrial byproducts.<br />
Tax incentives should be granted to feed manufacturers <strong>and</strong> aquaculture<br />
farmers that invest in research <strong>and</strong> development.<br />
• Levels <strong>of</strong> phosphorus <strong>and</strong> other potentially leaching nutrients, as well as<br />
digestibility levels <strong>of</strong> <strong>feeds</strong> should be regulated to reduce organic pollution in<br />
aquaculture discharges or cage sites.<br />
• Aquaculture <strong>and</strong> agriculture farmers that wish to integrate aquaculture to their<br />
traditional agricultural systems are constrained by the high cost <strong>of</strong> <strong>for</strong>mulated<br />
<strong>feeds</strong> <strong>and</strong> the lack <strong>of</strong> basic knowledge on the use <strong>of</strong> locally available ingredients <strong>for</strong><br />
the production <strong>of</strong> low cost, farm-made <strong>feeds</strong>, which could substantially increase<br />
the economic sustainability <strong>of</strong> rural aquaculture, thus benefiting large sectors <strong>of</strong><br />
the population. Governments should take cognisance <strong>of</strong> the opportunities <strong>of</strong>fered<br />
by aquaculture <strong>for</strong> rural development.<br />
• Capacity building <strong>of</strong> small-scale farmers, particularly with respect to farmmade<br />
<strong>feeds</strong> should be prioritized in aquaculture development plans. A review<br />
<strong>of</strong> locally available potential ingredients is essential, followed by training <strong>of</strong><br />
extension <strong>of</strong>ficers <strong>and</strong> farmers on basic aquaculture nutrition <strong>and</strong> farm-made feed<br />
preparation. In many cases this will be the only alternative <strong>for</strong> rural aquaculture<br />
to be <strong>sustainable</strong>.<br />
• Governments should facilitate dialogue between researchers, farmers <strong>and</strong> feed<br />
manufacturers to collectively tackle existing <strong>and</strong> emerging problems, focus<br />
research <strong>and</strong> to strengthen the competitiveness <strong>of</strong> the aquaculture sector.<br />
• Improved management <strong>of</strong> ponds including “ecological management” (i.e.<br />
heterotrophic systems) should be promoted to increase system productivity,<br />
reduce water use <strong>and</strong> lower the dependence on high protein, fishmeal-based<br />
<strong>feeds</strong>.
Feeds <strong>and</strong> <strong>fertilizers</strong> <strong>for</strong> <strong>sustainable</strong> aquaculture development: a regional review <strong>for</strong> Latin America 73<br />
ACKNOWLEDGEMENTS<br />
The author wishes to thank the following persons <strong>for</strong> providing important in<strong>for</strong>mation<br />
included in this contribution: Dr Marcio Hipólito, Instituto Biológico de Sao Paulo,<br />
Brazil, provided in<strong>for</strong>mation on feedmills <strong>and</strong> aquaculture <strong>feeds</strong> in Brazil. Mr. Jesus<br />
Zendejas, Cargill-Mexico, also provided in<strong>for</strong>mation on aqua<strong>feeds</strong>, feedmills <strong>and</strong><br />
feeding in Latin America. Dr Miguel Olvera, CINVESTAV-Mexico, <strong>for</strong> providing<br />
useful in<strong>for</strong>mation on alternative sources <strong>of</strong> protein in the region. Mr. M. Dewind,<br />
National Chamber <strong>of</strong> Aquaculturists <strong>of</strong> Ecuador, provided production data from<br />
Ecuador; Dr. Sergio Toledo, Centro de Preparación Acuícola Mampostón, Cuba,<br />
provided in<strong>for</strong>mation on aqua<strong>feeds</strong> <strong>and</strong> feed research in Cuba, Biol. Jorge Velazco,<br />
INAPESCA, Venezuela, <strong>for</strong> providing aqua<strong>feeds</strong> <strong>and</strong> aquaculture production data<br />
<strong>for</strong> Venezuela, <strong>and</strong> Mr Marcelo Araneda, Universidad Marista, Mexico, <strong>for</strong> providing<br />
in<strong>for</strong>mation on aquaculture production, systems <strong>and</strong> aqua<strong>feeds</strong> in Chile.<br />
REFERENCES<br />
Aqua.cl, March, 2005. (available at www.aqua.cl. Chile).<br />
Arrivillaga, A. & Arredondo, J.L. 1987. Una revision sobre el potencial de las macr<strong>of</strong>itas<br />
acuáticas en la acuacultura. Universidad y Ciencia, 4: 55–67.<br />
Bayne, D.R., Dunseth, D. & Ramiros C.G. 1976. Supplemental <strong>feeds</strong> containing c<strong>of</strong>fee<br />
pulp <strong>for</strong> rearing tilapia in Central America. Aquaculture, 7: 133–146.<br />
CODECA. 2004. Manual de operación de granjas camaroneras. Corporación de Camarón,<br />
S.A. Agua Dulce, Panamá, 123 pp. (mimeo)<br />
Cook, I. & Clif<strong>for</strong>d, I. 1998. Fertilization <strong>of</strong> shrimp ponds <strong>and</strong> nursery tanks. Aquaculture<br />
Magazine, 24: 52–62.<br />
De la Higuera, M., García.Gallego, M., Sanz, A., Cardenet, G., Suárez, M.D. & Moyano,<br />
F.J. 1988. Evaluation <strong>of</strong> lupin seed as an alternative protein source in feeding <strong>of</strong> rainbow<br />
trout (Salmo gairdneri). Aquaculture, 71: 37–50.<br />
De la Higuera, M., Sánchez.Muñíz, F.J., Mataix, F.J. & Varela, G. 1981. Nitrogen<br />
utilization by rainbow trout fed on the yeast Hansenula anomala Comp. Biochem.<br />
Physiol., 69A: 583–586.<br />
De Silva, S.S. <strong>and</strong> Hasan, M.R. 2007. Feeds <strong>and</strong> <strong>fertilizers</strong>: the key to long term<br />
sustainability <strong>of</strong> Asian aquaculture (this volume).<br />
Espinosa-Carmona, J. 2002. Evolución de la Industria de los fertilizantes y su impacto<br />
en la agricultura. Secretaría de Agricultura, Ganadería, Desarrollo Rural, Pesca y<br />
Alimentación, México. (available at http//www.sagarpa.gov.mx).<br />
FAO Fisheries Global In<strong>for</strong>mation System. 2006. National Aquaculture Sector Overview<br />
<strong>of</strong> Brazil. (available at http://www.fao.org/figis/servlet/static?dom=countrysector&xml<br />
=naso_brazil.xml).<br />
FAO. 2006a. FAO Fisheries Department, Fishery In<strong>for</strong>mation, Data <strong>and</strong> Statistics<br />
Unit. Fishstat Plus: Universal s<strong>of</strong>tware <strong>for</strong> fishery statistical time series. Aquaculture<br />
production: quantities 1950-2004, Aquaculture production: values 1984-2004; Capture<br />
production: 1950-2004; Commodities production <strong>and</strong> trade: 1950-2004; Total production:<br />
1970-2004, Vers. 2.30 (available at www.fao.org/fi/statist/FISOFT/FISHPLUS.asp).<br />
FAO. 2006b. State <strong>of</strong> world aquaculture 2006. FAO Fisheries Technical Paper. No. 500.<br />
Rome, FAO. 134 pp.<br />
Flores-Nava, A. 1994. Manual práctico para el cultivo del camarón blanco del Golfo<br />
Litopenaeus setiferus en tanques circulares. Mexico City, Dir. Gral. Acuac. SEPESCA-<br />
México. 45 pp.<br />
Galicia, G.A. 2003. Utilización de hidrolizado de langostilla Pleuronectes planipes como<br />
aditivo en alimentos para juveniles del camarón Litopenaeus vannamei. Centro de<br />
Investigaciones Biológicas del Noroeste, La Paz, BC. México. (MSc Thesis)<br />
Hecht, T. 2007. A review <strong>of</strong> <strong>feeds</strong> <strong>and</strong> <strong>fertilizers</strong> <strong>for</strong> <strong>sustainable</strong> aquaculture development<br />
in sub-Saharan Africa (this volume).
74<br />
<strong>Study</strong> <strong>and</strong> <strong>analysis</strong> <strong>of</strong> <strong>feeds</strong> <strong>and</strong> <strong>fertilizers</strong> <strong>for</strong> <strong>sustainable</strong> aquaculture development<br />
Hernández, T., Hernández, A., & Martínez, C. 1991. Polyphenols in alfalfa leaves<br />
concentrates. Journal <strong>of</strong> Agricultural <strong>and</strong> Food Chemistry, 39: 1120–1122.<br />
Infante, R. 2003. Alimentos para salmón: una torta de 700 milliones de dólares en la mira<br />
de los agricultores. Diario Estrategia, 14 de junio, 2004.<br />
Kohler, C.C. & Pagan-Font, P.A. 1978. Evaluation <strong>of</strong> rum distillation wastes, pharmaceutical<br />
wastes <strong>and</strong> chicken <strong>feeds</strong> <strong>for</strong> rearing tilapia in Puerto Rico. Aquaculture, 14: 339–347.<br />
Luna, F.J. <strong>and</strong> Figueroa, J. 2003. Crecimiento de la mojarra criolla Cichlasoma istlanum<br />
(Pisces: Cichlidae): alimento vivo vs alimento comercial. CIVA 2003. pp. 48–54. (available<br />
at http//www.civa.2003.org).<br />
Martínez, P.C., Galván, C.R., Oliera, M.A. & Chávez, M.C. 1988. The use <strong>of</strong> jackbean<br />
(Canavalia ensi<strong>for</strong>mis Leguminosae) meal as a partial substitute <strong>of</strong> fishmeal in diets <strong>for</strong><br />
tilapia (Oreochromis mossambicus Cichlidae). Aquaculture, 68: 165–175.<br />
MIDA, 1998. Manual de cría de los camarones pendidos en estanques de ises salobres.<br />
Ministerio de Agricultura. Centro de In<strong>for</strong>mación y Documentación en Acuicultura,<br />
Panamá. 55 pp.<br />
National Agriculture In<strong>for</strong>mation Service, Ministry <strong>of</strong> Agriculture <strong>of</strong> Ecuador, 2004.<br />
Ecuador: Producción de Alimentos Balanceados. Proyecto SICA-BIRF/MAG-Ecuador<br />
(available at http//www.sica.gov.ec).<br />
Nicovita, 1999. Los nutrientes y fertilización de estanques de acuicultura. Boletín Nicovita<br />
(available at http//www.nicovita.com.pe).<br />
Nunes, J.P.A. 2000. Manual Purina de alimentação de camarões marinhos. Agribr<strong>and</strong>s do<br />
Brasil, LTDA. Sta. Catarina, Brasil, 40 pp.<br />
Nunes. J.P.A. 2004. Fundamentos da engorda de camarões marinhos. Purina do Brasil, São<br />
Lorenço da Mata, PE, Brasil. 42 pp.<br />
Olvera, N.M., Martínez, C.A., Galván, R. & Chávez, M.C. 1988 The use <strong>of</strong> seed <strong>of</strong> the<br />
leguminose plant Sesbania grindiflora as a partial replacement <strong>for</strong> fishmeal in diets <strong>for</strong><br />
tilapia (Oreochromis mossambicus). Aquaculture, 1: 51–60.<br />
Olvera, N.M.A. 1994. Utilización de proteínas vegetales en la alimentación de tilapia<br />
Oreochromis mossambicus; O. niloticus y Tilapia rendalli. Mérida, Centro de Investigación<br />
y de Estudios Avanzados, Unidad Mérida. 198 pp. (PhD Thesis)<br />
Palomo, M.G.P. <strong>and</strong> Arringa, R. 1993. Atlas de ubicación de productos agropecuarios<br />
utilizables en la planificación y desarrollo de la acuicultura en México. FAO/AQUILA,<br />
GCP/RLA/075/ITA. Rome, FAO, 103 pp.<br />
Panorama Acuícola Magazine. 2004a. Alimentos Balanceados en México: Un Mercado<br />
en Constante Crecimiento. Revista Panorama Acuícola: Julio-Agosto, 2004 (available at<br />
http//www.panoramaacuicola.com.mx).<br />
Panorama Acuícola Magazine. 2004b. Alga Kelp: soluciones para nutrición y salud en<br />
acuacultura. Revista Panorama Acuícola: Julio-Agosto, 2004 (available at http//www.<br />
panoramaacuicola.com.mx).<br />
Panorama Acuícola Magazine. 2007. Skretting. Feeding your passion <strong>for</strong> fish. Revista<br />
Panorama Acuícola: Enero-Febrero, 2007 (available at http//www.panoramaacuicola.<br />
com.mx).<br />
Scorvo, D. 2003. Panorama da Aqüicultura Nacional. (available at http/www.acaq.org.br/<br />
arquivos/Panorama_Aqüicultura_Nacional).<br />
SAGARPA. 2002. Anuario Estadístico de Pesca 2001. Secretaría de Agricultura, Ganadería,,<br />
Desarrollo Rural, Pesca y Alimentación, México (available at http://www.sagarpa.gob.<br />
mx/pesca/Anuario2001.zip).<br />
Toledo, J. 2004. Producción de Ensilados de Pescado para Peces de Aguas Templadas en<br />
Cuba. Habana, Centro de Preparación Acuícola Mampostón. 9 p. (mimeo)<br />
Torres, S.J., García, J., Heredia, B <strong>and</strong> Pereira, G. 2003. Evaluación preliminar del uso de<br />
Dendrocephalus geayi (Anostraca: Thamnocephalidae) en la alimentación de larvas de<br />
Colossoma macropomum (Pises: Characidae). CIVA 2003. pp. 1030–1035 (also available<br />
at http//www.civa.2003.org).
Feeds <strong>and</strong> <strong>fertilizers</strong> <strong>for</strong> <strong>sustainable</strong> aquaculture development: a regional review <strong>for</strong> Latin America 75<br />
Villalón, J.R. 1991.Practical manual <strong>for</strong> semi-intensive production <strong>of</strong> marine shrimp.<br />
TAMU-SG-91-501. College Station, Texas, Texas A&M University Sea Grant College<br />
Program. 104 pp.<br />
Villarroel, A.J.E. 2003. Análisis de la competitividad de la industria del salmón en Chile.<br />
Santiago, Facultad de Agronomía e Ingeniería Forestal, Pontificia Universidad Católica de<br />
Chile. 70 pp. (BSc Thesis)<br />
Waldige, V. <strong>and</strong> Caseiro, A. 2003. A industria de rações: a situação atual e perspectivas.<br />
Panorama de Aqüicultura, Brasil, Março-Abril: pp. 37–45.<br />
Zendejas, H.J. 2005. Técnicas de alimentación en piscicultura. Agribr<strong>and</strong>s-Purina, México.<br />
26 pp. (mimeo)
Review <strong>of</strong> <strong>feeds</strong> <strong>and</strong> <strong>fertilizers</strong><br />
<strong>for</strong> <strong>sustainable</strong> aquaculture<br />
development in sub-Saharan Africa<br />
Thomas Hecht<br />
Department <strong>of</strong> Ichthyology <strong>and</strong> Fisheries Science<br />
Rhodes University, Grahamstown 6140<br />
South Africa<br />
Summary 78<br />
1. Introduction 80<br />
2. General overview <strong>of</strong> aquaculture, farming practices <strong>and</strong> systems 81<br />
3. The species 84<br />
4. Aquaculture practices <strong>and</strong> the farming systems 85<br />
5. Review <strong>and</strong> <strong>analysis</strong> <strong>of</strong> fertilizer use in pond aquaculture 89<br />
6. Review <strong>and</strong> <strong>analysis</strong> <strong>of</strong> <strong>feeds</strong> <strong>and</strong> feeding 92<br />
7. The animal feed industry 95<br />
8. Aqua<strong>feeds</strong> 96<br />
9. Farm-made feed <strong>for</strong>mulations <strong>and</strong> manufacturing technology 97<br />
10. Feeding practices 100<br />
11. Problems <strong>and</strong> constraints 101<br />
12. Labour cost 102<br />
13. Comments on resource availability <strong>and</strong> expansion <strong>of</strong> the<br />
aquaculture industry 103<br />
14. Recommendations 106<br />
Acknowledgements 108<br />
References 108<br />
Hecht, T. 2007. Review <strong>of</strong> <strong>feeds</strong> <strong>and</strong> <strong>fertilizers</strong> <strong>for</strong> <strong>sustainable</strong> aquaculture development<br />
in sub-Saharan Africa. In M.R. Hasan, T. Hecht, S.S. De Silva <strong>and</strong> A.G.J. Tacon (eds).<br />
<strong>Study</strong> <strong>and</strong> <strong>analysis</strong> <strong>of</strong> <strong>feeds</strong> <strong>and</strong> <strong>fertilizers</strong> <strong>for</strong> <strong>sustainable</strong> aquaculture development.<br />
FAO Fisheries Technical Paper. No. 497. Rome, FAO. pp. 77–109.<br />
77
78<br />
<strong>Study</strong> <strong>and</strong> <strong>analysis</strong> <strong>of</strong> <strong>feeds</strong> <strong>and</strong> <strong>fertilizers</strong> <strong>for</strong> <strong>sustainable</strong> aquaculture development<br />
SUMMARY<br />
Recent observed changes in production, technological developments <strong>and</strong> culture<br />
practices in sub-Saharan Africa (SSA) have largely been driven by increasing fish prices<br />
throughout the region <strong>and</strong> aquaculture in the region is now poised to increase rapidly.<br />
In 2004, Africa as a whole contributed 1.8 percent to world aquaculture fish production,<br />
while the SSA region contributed 0.26 percent. Egypt was the largest contributor to<br />
African aquaculture (84.5 percent) followed by Nigeria (7.9 percent) <strong>and</strong> as a whole the<br />
SSA region contributed 14.6 percent to African aquaculture output. During the period<br />
2000 to 2004 aquaculture production in SSA increased by 50.8 percent from 54 109<br />
tonnes to 81 598 tonnes. The highest increases in production were recorded in Ug<strong>and</strong>a<br />
(575 percent), Cameroon (560 percent) <strong>and</strong> Kenya (102 percent). Nigeria is the largest<br />
producer in the region (43 950 tonnes in 2004), followed by Ug<strong>and</strong>a <strong>and</strong> Zambia with<br />
around 5 000 tonnes each.<br />
This review focuses on seven target countries, namely Cameroon, Ghana, Kenya,<br />
Malawi, Nigeria, Ug<strong>and</strong>a <strong>and</strong> Zambia, <strong>and</strong> comparative in<strong>for</strong>mation is provided <strong>for</strong><br />
other countries in the region. Over 80 percent <strong>of</strong> fish farmers in the region are smallscale<br />
farmers who practise extensive aquaculture on a non-commercial basis to improve<br />
household food security. However the bulk <strong>of</strong> production (~70 percent) is produced by<br />
the commercial sector, ranging from small-scale semi-intensive enterprises to industrial<br />
scale farming <strong>of</strong> high value products such as catfish (Nigeria), shrimp (Madagascar <strong>and</strong><br />
Mozambique) <strong>and</strong> abalone (South Africa). The most notable developments in the target<br />
countries include high density catfish farming in Nigeria, medium <strong>and</strong> industrial scale<br />
cage culture, a switch to commercial aquaculture by previously “non-commercial”<br />
farmers (28 percent <strong>of</strong> farmers in Ug<strong>and</strong>a switched to commercial aquaculture in the last<br />
five years), establishment <strong>of</strong> intensive African catfish hatcheries in Kenya <strong>and</strong> Ug<strong>and</strong>a,<br />
a major expansion <strong>of</strong> peri-urban aquaculture <strong>and</strong> dynamic growth in African catfish<br />
production.<br />
Between 2000 <strong>and</strong> 2004 production <strong>of</strong> clariid catfish had increased by 452% from<br />
5 739 to 31 681 tonnes, contributing 38.8 percent to total SSA production. Over the same<br />
period Nile tilapia (Oreochromis niloticus) production has increased by 37.2 percent <strong>and</strong><br />
contributes 25.9 percent to total SSA production. The contribution by common carp<br />
(Cyprinus carpio) has declined by 11 percent <strong>and</strong> in 2004 contributed 3.4 percent. The<br />
contribution by all other cichlid <strong>and</strong> non-cichlid species has also declined.<br />
Aquaculture practices are diverse, ranging from single pond subsistence farming to<br />
highly intensive pump-ashore abalone farms. The non-commercial sector is characterised<br />
largely by the use <strong>of</strong> “green compost” cribs to enhance pond productivity, irregular<br />
application <strong>of</strong> inadequate quantities <strong>of</strong> manure <strong>and</strong> the use <strong>of</strong> cereal bran, kitchen waste<br />
<strong>and</strong> vegetable matter as feed inputs. Production levels are low (mean = 1.03 tonnes/ha/<br />
year) <strong>and</strong> species choice depends largely on the availability <strong>of</strong> fingerlings. Commercial,<br />
semi-intensive pond culture <strong>and</strong> intensive cage <strong>and</strong> tank culture is gaining momentum.<br />
Production levels in semi-intensive pond systems are comparable to global averages,<br />
ranging from 2.5 to 15 tonnes/ha/year. Polyculture <strong>of</strong> Nile tilapia <strong>and</strong> African catfish<br />
commonly practised throughout the region, though monoculture is preferred in intensive<br />
cage or tank systems. Ornamental fish culture is emerging in several countries.<br />
Except <strong>for</strong> Ug<strong>and</strong>a <strong>and</strong> Kenya, the legislative <strong>and</strong> regulatory environment <strong>for</strong><br />
aquaculture in the region is weak. It is best developed in Namibia.<br />
There is a clear dichotomy in pond fertilization methods. All non-commercial farmers<br />
in the region are constrained either by on-farm availability <strong>of</strong> manure, price, access, cash<br />
resources <strong>and</strong> transport costs <strong>and</strong> there<strong>for</strong>e mainly use compost cribs <strong>and</strong> some animal<br />
manure when available. On the other h<strong>and</strong>, all commercial farmers, irrespective <strong>of</strong> scale,<br />
use animal manure at appropriate levels <strong>and</strong> chemical <strong>fertilizers</strong> where <strong>and</strong> if necessary,<br />
though rarely. Chicken manure is most <strong>of</strong>ten used <strong>and</strong> ranges in price from US$17 to<br />
around US$30 per tonne. Animal manure requirement <strong>for</strong> optimum fish production in
Review <strong>of</strong> <strong>feeds</strong> <strong>and</strong> <strong>fertilizers</strong> <strong>for</strong> <strong>sustainable</strong> aquaculture development in sub-Saharan Africa 79<br />
the target countries was estimated based on six possible scenarios. By 2020 total animal<br />
manure requirements will be between 257 896 <strong>and</strong> 754 889 tonnes per annum.<br />
Total animal feed production in the target countries, including South Africa, in<br />
2005 amounted to some 9.0 million tonnes per annum, dominated by South Africa<br />
<strong>and</strong> Nigeria (4.4 <strong>and</strong> 3.8 million tonnes per annum, respectively). Industrial aqua<strong>feeds</strong>,<br />
manufactured by medium <strong>and</strong> large scale feed mills, are produced in Cameroon, Kenya,<br />
Malawi, Nigeria, South Africa <strong>and</strong> Zambia, while other countries are on the threshold <strong>of</strong><br />
commercial aquafeed production. Some 17 000 tonnes <strong>of</strong> fish pellets <strong>and</strong> aquafeed mixes<br />
were produced in 2005, <strong>of</strong> which Nigeria produced around 66 percent. The total feed<br />
requirement by 2020 was projected based on three growth scenarios <strong>of</strong> fish production<br />
<strong>and</strong> ranges between 139 000 tonnes <strong>and</strong> 545 000 tonnes. Only 50–65 percent <strong>of</strong> the feed<br />
milling capacity is utilized <strong>and</strong> the industry has adequate capacity to provide the needs<br />
<strong>of</strong> the commercial aquaculture sector until 2020.<br />
The general paucity <strong>of</strong> good quality aqua<strong>feeds</strong> in the region is generally a factor <strong>of</strong><br />
scale. In most countries local dem<strong>and</strong> has not reached a critical mass <strong>for</strong> appropriate<br />
attention <strong>and</strong> investment, though the threshold has now been reached in Nigeria where<br />
substantial investments are planned. Only 22 percent <strong>of</strong> commercial fish production<br />
is attributable to industrial aqua<strong>feeds</strong>. This highlights the pivotal importance <strong>of</strong> farmmade<br />
<strong>feeds</strong> in the region. Most countries in the region have adequate resources to<br />
manufacture appropriate <strong>feeds</strong>, though the availability <strong>and</strong> cost <strong>of</strong> fishmeal <strong>and</strong> soybean<br />
meal or oilseed cake is a major constraint in most countries. The price <strong>of</strong> feed ingredients,<br />
particularly fishmeal, oil seed cakes, soybean meal <strong>and</strong> maize, is highly variable among<br />
countries <strong>and</strong> varies seasonally within countries. Farm-made feed <strong>for</strong>mulations vary<br />
by season, depending on availability <strong>and</strong> price <strong>of</strong> ingredients. Some 98 500 tonnes <strong>of</strong><br />
farm-made <strong>feeds</strong> are currently produced annually, with reported FCRs ranging from<br />
1.1 to 3.2. In Nigeria some 69.8 percent <strong>of</strong> fish production is attributable to in<strong>for</strong>mal<br />
feed manufacturers. There is a good body <strong>of</strong> knowledge with respect to the proximate<br />
composition <strong>of</strong> locally available feed ingredients <strong>and</strong> much work has been undertaken<br />
on optimal inclusion levels <strong>of</strong> these ingredients with particular emphasis on fishmeal<br />
replacement. The importance <strong>of</strong> farm-made <strong>feeds</strong> in the region highlights the urgent <strong>and</strong><br />
desperate need <strong>for</strong> further nutritional research in the region.<br />
The principle recommendations emanating from the synthesis include: training <strong>of</strong><br />
nutritionists <strong>and</strong> fish feed technologists, developing appropriate manufacturing machinery<br />
<strong>and</strong> bulk storage facilities, evaluating <strong>and</strong> testing non-conventional feed ingredients,<br />
developing databases <strong>of</strong> available feed <strong>and</strong> fertilizer resources, developing country<br />
specific farm-made feed <strong>for</strong>mulations, effective dissemination <strong>of</strong> in<strong>for</strong>mation (availability<br />
<strong>of</strong> ingredients, <strong>for</strong>mulations, manufacturing technologies, feeding schedules), developing<br />
country specific animal feed st<strong>and</strong>ards <strong>and</strong> reviewing pertinent legislation to ensure<br />
stability, quality <strong>and</strong> food safety <strong>and</strong> establishing enabling business environments.
80<br />
<strong>Study</strong> <strong>and</strong> <strong>analysis</strong> <strong>of</strong> <strong>feeds</strong> <strong>and</strong> <strong>fertilizers</strong> <strong>for</strong> <strong>sustainable</strong> aquaculture development<br />
1. INTRODUCTION<br />
In a recent synopsis <strong>of</strong> sub-Saharan aquaculture the availability, quality, food conversion<br />
ratio (FCR) <strong>and</strong> the high distribution costs <strong>of</strong> <strong>feeds</strong> <strong>and</strong> <strong>fertilizers</strong>, together with poor<br />
quality fingerlings <strong>and</strong> the general absence <strong>of</strong> investor friendly regulatory frameworks<br />
were singled out as some <strong>of</strong> the most important issues that constrain the development<br />
<strong>of</strong> commercial <strong>and</strong> non-commercial aquaculture in the region. It was further concluded<br />
that most non-commercial farmers use protein limiting diets, though the use <strong>of</strong> farmmade<br />
<strong>feeds</strong> is increasing, while locally manufactured <strong>feeds</strong>, except <strong>for</strong> isolated cases,<br />
are generally <strong>of</strong> poor quality (Hecht, 2006). This highlights the need <strong>for</strong> feed quality<br />
assurance programmes.<br />
This review focuses, in particular, on the use <strong>and</strong> availability <strong>of</strong> <strong>feeds</strong> <strong>and</strong> <strong>fertilizers</strong><br />
<strong>for</strong> <strong>sustainable</strong> aquaculture in a select group <strong>of</strong> sub-Saharan countries <strong>and</strong> is a sequel<br />
to a review undertaken in 2001 (Shipton <strong>and</strong> Hecht, 2005). The target countries in this<br />
instance were Cameroon, Ghana, Kenya, Malawi, Nigeria, Ug<strong>and</strong>a <strong>and</strong> Zambia. As<br />
will be shown later, Cameroon, Ug<strong>and</strong>a <strong>and</strong> Zambia have recorded the most significant<br />
increases in national production while Nigeria remains the giant in the region, though<br />
interesting <strong>and</strong> noteworthy changes have taken place in the other target countries. The<br />
most notable changes that have taken place in the last five years are summarized in Table<br />
1. The rapidly escalating price <strong>of</strong> fish throughout most SSA countries is considered to<br />
be the most important driving <strong>for</strong>ce <strong>of</strong> the rapid growth in the sector. For example in<br />
Cameroon many previously ab<strong>and</strong>oned ponds have recently been rehabilitated as a<br />
consequence <strong>of</strong> the increasing fish price <strong>and</strong> this has <strong>of</strong>ten been done without technical<br />
input from extension services. It was <strong>for</strong> these reasons that the countries were singled<br />
out <strong>for</strong> this review. For comparison <strong>and</strong> where appropriate, in<strong>for</strong>mation on <strong>fertilizers</strong><br />
<strong>and</strong> <strong>feeds</strong> is also presented from elsewhere on the sub continent <strong>and</strong> from Egypt.<br />
It is currently in vogue to define aquaculture in SSA as being either commercial or<br />
non-commercial (Moehl, Halwart <strong>and</strong> Brummett, 2005). While there is indeed great<br />
merit <strong>for</strong> this distinction these categories are limiting when undertaking a review <strong>of</strong><br />
<strong>feeds</strong> <strong>and</strong> <strong>fertilizers</strong> <strong>for</strong> the <strong>sustainable</strong> development <strong>of</strong> the sector in the region. In a<br />
recent review <strong>of</strong> SSA aquaculture it was shown that the face <strong>of</strong> aquaculture throughout<br />
the region has <strong>and</strong> is changing rapidly towards a more commercially orientated activity<br />
(Hecht, 2006). “Traditional” low-input/low-output small-holder fish farmers still<br />
dominate the scene. However the greater proportion <strong>of</strong> SSA production is now produced<br />
by commercial enterprises that range from small-scale semi-intensive to large industrial<br />
scale operations. There<strong>for</strong>e, <strong>for</strong> the purposes <strong>of</strong> this review, aquaculture in all target<br />
countries is categorised by the level <strong>of</strong> intensity (extensive, semi-intensive, intensive)<br />
with respect to culture systems, species cultured, the intensity <strong>of</strong> management inputs,<br />
labour requirements, capital <strong>and</strong> operational costs, the level <strong>of</strong> business orientation,<br />
the level <strong>of</strong> integration with other economic on-farm activities such as horticulture or<br />
animal husb<strong>and</strong>ry, feeding <strong>and</strong> fertilization levels. It is not the intention here to define<br />
TABLE 1<br />
Significant developments in sub-Saharan aquaculture since 2000<br />
Ug<strong>and</strong>a Over 28% <strong>of</strong> farmers switched to commercial aquaculture in last 5 years. Over 10<br />
intensive African catfish (Clarias gariepinus) hatcheries established in last 5 years, now<br />
producing around 0.5 million fingerlings per month. Major expansion <strong>of</strong> African catfish<br />
farming.<br />
Kenya Establishment <strong>of</strong> six C. gariepinus hatcheries, each producing between 10 000 <strong>and</strong><br />
50 000 fingerlings per month. Major expansion <strong>of</strong> catfish farming.<br />
Malawi Development <strong>of</strong> a 3 000 tonne cage culture operation in Lake Malawi <strong>for</strong><br />
production <strong>of</strong> indigenous chambo Oreochromis species (O. karongae <strong>and</strong> O. shiranus)<br />
Cameroon Significant expansion <strong>of</strong> peri-urban commercial aquaculture<br />
Nigeria Development <strong>of</strong> high density clariid catfish culture, rapid expansion <strong>of</strong> urban<br />
aquaculture.<br />
Ghana Developments in Nile tilapia (O. niloticus) cage culture.<br />
Source: Hecht (2006)
Review <strong>of</strong> <strong>feeds</strong> <strong>and</strong> <strong>fertilizers</strong> <strong>for</strong> <strong>sustainable</strong> aquaculture development in sub-Saharan Africa 81<br />
TABLE 2<br />
Characteristics <strong>of</strong> the aquaculture sector in sub-Saharan Africa<br />
CATEGORIES <strong>and</strong><br />
CHARACTERISTICS<br />
Extensive Semi-intensive Intensive<br />
Culture systems Earthen ponds Earthen ponds <strong>and</strong><br />
cages<br />
Species Polyculture (various<br />
tilapiine species, catfish<br />
<strong>and</strong> carp)<br />
Mainly polyculture<br />
(Nile tilapia <strong>and</strong><br />
African catfish), some<br />
monoculture (tilapia)<br />
Management input Low to medium Medium to high High<br />
Labour needs Family labour to<br />
low requirement <strong>for</strong><br />
external labour<br />
Cages, raceways,<br />
tanks <strong>and</strong> earthen ponds<br />
Mainly monoculture<br />
Medium Low to high<br />
(more capital intensive)<br />
Capital costs Low to medium Medium Medium to high<br />
Operational costs Zero to low Medium High<br />
Business orientation Low to medium Medium to high High<br />
Integration with other<br />
farm activities<br />
Medium to high Low to high Low<br />
Feeding Zero to supplementary Scheduled to<br />
Scheduled intensive<br />
unscheduled using feeding using pellets or<br />
mainly farm-made <strong>feeds</strong> farm-made <strong>feeds</strong><br />
Fertilisation Zero to medium level Medium to high level Zero to high level<br />
Source: Author’s data <strong>and</strong> country reviews<br />
the various categories, but simply to highlight the diverse nature <strong>of</strong> the sector <strong>and</strong> to<br />
make the point that these categories better facilitate a review <strong>of</strong> the current situation<br />
with respect to <strong>feeds</strong> <strong>and</strong> <strong>fertilizers</strong>. These categories <strong>and</strong> their general characteristics<br />
are summarized in Table 2. Non-commercial farmers as per the definition <strong>of</strong> Moehl,<br />
Halwart <strong>and</strong> Brummett (2005) would normally, but not exclusively, practice extensive<br />
fish farming.<br />
Except <strong>for</strong> experimental shrimp (Penaeus species) culture in Kenya, mariculture<br />
is not practiced in any <strong>of</strong> the maritime countries considered here. Brackish-water<br />
aquaculture is practiced only in Nigeria <strong>and</strong> at a low level. Mariculture in SSA is<br />
restricted mainly to shrimp culture in Madagascar, Mozambique <strong>and</strong> Seychelles <strong>and</strong><br />
abalone aquaculture in South Africa. There<strong>for</strong>e the review focuses mainly on inl<strong>and</strong><br />
freshwater aquaculture. The <strong>analysis</strong> is based mainly on country reviews <strong>for</strong> Cameroon<br />
(Pouomogne, 2007), Ghana (unpublished reports by Abban, 2005 <strong>and</strong> Hasan, 2005),<br />
Kenya (Ny<strong>and</strong>at, 2007), Malawi (Chimatiro <strong>and</strong> Chirwa, 2007), Nigeria (Ayinla, 2007),<br />
Ug<strong>and</strong>a (Rutaisire, 2007) <strong>and</strong> Zambia (author’s data) <strong>and</strong> a review <strong>of</strong> the primary <strong>and</strong><br />
grey literature <strong>and</strong> government reports. For the purposes <strong>of</strong> this review sub-Saharan<br />
Africa includes all continental sub-Saharan countries <strong>and</strong> Madagascar. Production<br />
statistics extracted from Fishstat (FAO, 2006) <strong>for</strong> comparative purposes <strong>and</strong> with<br />
which to put SSA aquaculture into perspective includes only data <strong>for</strong> species that<br />
depend on <strong>feeds</strong> <strong>and</strong> <strong>fertilizers</strong>.<br />
2. GENERAL OVERVIEW OF AQUACULTURE, FARMING PRACTICES AND<br />
SYSTEMS<br />
Aquaculture in sub-Saharan Africa contributes 0.26 percent <strong>and</strong> 14.6 percent to total<br />
World <strong>and</strong> African aquaculture production, respectively (FAO, 2006). Nigeria with a<br />
production <strong>of</strong> over 43 950 tonnes per annum in 2004 is by far the largest producer in<br />
SSA, though this figure still falls far short <strong>of</strong> the 471 535 tonnes produced by Egypt in<br />
2004. Nevertheless, since 1990 there have been substantial increases in production in<br />
many <strong>of</strong> the SSA countries (Figure 1). For the SSA region as a whole total production<br />
had increased by 434 percent between 1990 <strong>and</strong> 2004, while in the target countries<br />
production had increased by 436 percent. During the last 5 years (2000–2004)<br />
production in SSA has increased by 50.8 percent from 54 109 to 81 598 tonnes <strong>and</strong><br />
in the target countries by 56.4 percent from 36 870 to 57 662 tonnes. In 2994 Nigeria
82<br />
<strong>Study</strong> <strong>and</strong> <strong>analysis</strong> <strong>of</strong> <strong>feeds</strong> <strong>and</strong> <strong>fertilizers</strong> <strong>for</strong> <strong>sustainable</strong> aquaculture development<br />
TABLE 3<br />
Total aquaculture production (tonnes) by country<br />
Country 2000 2001 2002 2003 2004 2005<br />
Percent<br />
increase<br />
Cameroon 50 150 330 320 330 820 560<br />
Ghana * * * 938 950<br />
Kenya 512 1 009 798 1 012 1 035 102<br />
Malawi 530 568 642 666 733 800 38<br />
Nigeria 25 718 24 398 30 663 30 677 43 950 71<br />
Ug<strong>and</strong>a 820 2 360 4 915 5 500 5 539 575<br />
Zambia 4 240 4 520 4 630 4 501 5 125 21<br />
Target countries 36 870 39 005 47 978 43 614 57 662 56<br />
SSA 54 109 57 562 71 802 68 121 81 598 51<br />
*Excluded because <strong>of</strong> questionable data<br />
Source: FAO (2006) <strong>and</strong> country reviews<br />
FIGURE 1<br />
Aquaculture production by volume (left) <strong>and</strong> value (right) in SSA <strong>and</strong> target countries<br />
<strong>for</strong> the period 1990 – 2004<br />
Source: FAO (2006)<br />
produced approximately 53.9 percent <strong>of</strong> the SSA total, while Ug<strong>and</strong>a <strong>and</strong> Zambia<br />
each contributed ca. 6.5 percent. Other target countries contributed between 0.4 <strong>and</strong><br />
1.2 percent to the 2004 SSA total (Figure 2). In terms <strong>of</strong> value Nigeria is the only SSA<br />
country <strong>for</strong> which the percent value approximates the value <strong>for</strong> volume <strong>and</strong> this is most<br />
likely because <strong>of</strong> the high price <strong>of</strong> fish in Nigeria<br />
FIGURE 2<br />
Percent contribution by target countries to total<br />
SSA production, volume <strong>and</strong> value<br />
Source: FAO (2006)<br />
(up to US$4.50/kg in urban areas – Hecht,<br />
2006). While Nigeria is clearly the giant in the<br />
region, production over the last 5 years had<br />
only increased by 71 percent, in comparison to<br />
increases <strong>of</strong> 575 percent, 560 <strong>and</strong> 102 percent<br />
recorded <strong>for</strong> Ug<strong>and</strong>a, Cameroon <strong>and</strong> Kenya,<br />
respectively (FAO, 2006). However, between<br />
2003 <strong>and</strong> 2004 production in Nigeria has<br />
jumped from 30 677 tonnes to 43 950 tonnes.<br />
This clearly illustrates the pace <strong>of</strong> development<br />
<strong>of</strong> the sector in Nigeria in relation other SSA<br />
countries. Despite these impressive increases<br />
aquaculture in 2004 only made a measurable<br />
contribution to national fish supply (sum <strong>of</strong><br />
capture fisheries, aquaculture <strong>and</strong> imports) in<br />
Malawi (1.25 percent), Ug<strong>and</strong>a (1.5 percent),<br />
Nigeria (4.5 percent) <strong>and</strong> Zambia (6.7 percent),<br />
while in the remainder <strong>of</strong> the target countries
Review <strong>of</strong> <strong>feeds</strong> <strong>and</strong> <strong>fertilizers</strong> <strong>for</strong> <strong>sustainable</strong> aquaculture development in sub-Saharan Africa 83<br />
the contribution was less than 1 percent (Figure 3).<br />
The contribution made by aquaculture to GDP in the<br />
target countries is insignificant, ranging from 0.005<br />
percent <strong>for</strong> Cameroon to 0.154 in Nigeria (Hecht,<br />
2006). However, aquaculture where practiced,<br />
makes a significant contribution to food security<br />
in rural areas. Table 3 summarizes the most recent<br />
production figures <strong>for</strong> the target countries.<br />
Small-scale non-commercial fish farmers vastly<br />
outnumber commercial farming enterprises. Using<br />
in<strong>for</strong>mation provided in the NASOs (National<br />
Aquaculture Sector Overviews) (FAO Fisheries<br />
Global In<strong>for</strong>mation System, 2006) <strong>of</strong> the target<br />
countries, which <strong>for</strong>med the basis <strong>of</strong> the review <strong>of</strong><br />
aquaculture in SSA (Hecht, 2006) <strong>and</strong> the country<br />
reviews on <strong>feeds</strong> <strong>and</strong> <strong>fertilizers</strong> it was possible to<br />
obtain a rough estimate <strong>of</strong> the number <strong>of</strong> non-<br />
FIGURE 3<br />
Aquaculture production as percent <strong>of</strong> total<br />
fish supply in 2004<br />
Source: FAO (2006) <strong>and</strong> www.earthtrends.com<br />
commercial <strong>and</strong> commercial farmers <strong>and</strong> the size <strong>of</strong> the operations (Table 4). Noncommercial<br />
farmers account <strong>for</strong> around 80 percent <strong>of</strong> the total number <strong>of</strong> fish farmers.<br />
However, the bulk <strong>of</strong> production is produced by the commercial sector (Table 5).<br />
The data suggest that 70.5 percent <strong>of</strong> fish in the target countries was produced by the<br />
commercial sector. Of course this estimate is highly skewed by the size <strong>and</strong> output <strong>of</strong><br />
the commercial sector in Nigeria. Nevertheless, it shows that commercial aquaculture<br />
in SSA, despite the constraints with respect to the availability <strong>of</strong> commercially produced<br />
<strong>for</strong>mulated pellets, is gaining momentum.<br />
TABLE 4<br />
Number <strong>of</strong> fish farming operations in target countries<br />
Country Number <strong>of</strong><br />
Non-commercial<br />
farmers<br />
Number <strong>and</strong> type <strong>of</strong><br />
commercial<br />
enterprises<br />
Cameroon ca. 3 200 2 large earthen pond<br />
farms<br />
400–800 peri-urban<br />
earth pond farms<br />
Ghana* ca. 800 1 cage culture<br />
operation<br />
4 earthen pond farms<br />
Kenya 5 890 1 tilapia tank farm<br />
3 rainbow trout<br />
raceway/tank farms<br />
Cage farms<br />
6 catfish hatcheries<br />
Malawi 4 050 1 rainbow trout tank<br />
farm<br />
1 cage operation<br />
Size <strong>of</strong> commercia<br />
enterprises<br />
Unspecified<br />
Approx. 0.5 ha<br />
10 cages (15 m dia x 6 m)<br />
Pond farms (3.1 to 10 ha)<br />
Unspecified<br />
Unspecified<br />
Unspecified<br />
0.5 ha<br />
Total area (ha) under<br />
culture (commercial<br />
<strong>and</strong> non-commercial)<br />
270<br />
32 x16 m diameter cages<br />
under development<br />
12 ha<br />
Nigeria 50 000<br />
1 pond farm<br />
>2600 earthen pond<br />
<strong>and</strong> tank farms<br />
Unspecified 60 000<br />
Ug<strong>and</strong>a 8 000 11 catfish hatcheries<br />
1 200<br />
Several pond farms Unspecified<br />
Zambia 6 000 4 cage farms<br />
44 cages (6x6x3 m) <strong>and</strong><br />
10 pens<br />
260<br />
10 pond farms<br />
Total pond area = 195 ha<br />
*Two <strong>of</strong> these farms (one cage culture <strong>and</strong> one earthen pond) produce >50% <strong>of</strong> Ghana’s aquaculture output<br />
(Hasan, 2005)<br />
Source: Country reviews<br />
154<br />
419<br />
269
84<br />
<strong>Study</strong> <strong>and</strong> <strong>analysis</strong> <strong>of</strong> <strong>feeds</strong> <strong>and</strong> <strong>fertilizers</strong> <strong>for</strong> <strong>sustainable</strong> aquaculture development<br />
TABLE 5<br />
Estimates <strong>of</strong> commercial production (tonnes) in target countries<br />
COUNTRY Year % <strong>of</strong> fish from commercial farms Total production Commercial production<br />
Cameroon 2004 8% 650 52<br />
Ghana 2004 32% 950 304<br />
Kenya 2003 100% <strong>of</strong> trout,<br />
15% <strong>of</strong> tilapia<br />
85% <strong>of</strong> catfish<br />
Malawi 2003 100% <strong>of</strong> trout<br />
11% <strong>of</strong> other fish<br />
3. THE SPECIES<br />
Approximately 27 species are farmed in the seven target countries (Table 6). Table 7<br />
provides a summary overview <strong>of</strong> the most import species groups, with particular reference<br />
to Nile tilapia (Oreochromis niloticus), African catfish (Clarias gariepinus) <strong>and</strong> common<br />
TABLE 6<br />
Aquaculture species in target countries<br />
SPECIES<br />
Cichlidae<br />
Cameroon Ghana Kenya Malawi Nigeria Ug<strong>and</strong>a Zambia<br />
Nile tilapia (Oreochromis niloticus) x x x x x x<br />
Mozambique tilapia (O. mossambicus) x<br />
Three spotted tilapia (O. <strong>and</strong>ersonii) x<br />
Longfin tilapia (O. macrochir) x<br />
Chambo (O. shiranus shiranus) x<br />
Chambo (O. karongae) x<br />
B<strong>and</strong>ed jewel fish (Hemichromis<br />
fasciatus)<br />
x<br />
Redbelly tilapia (Tilapia zillii) x<br />
Redbreast tilapia (T. rendalli) x x<br />
T. guineensis x<br />
Blackchin tilapia (Sarotherodon<br />
melanotheron melanotheron)<br />
x<br />
Mango tilapia (Sarotherodon galilaeus<br />
galilaeus)<br />
Clariidae<br />
x x x<br />
North African catfish (Clarias gariepinus)<br />
Vundu (Heterobranchus longifilis)<br />
Hybrid catfish*<br />
Cyprinidae<br />
x x x x x x<br />
Common carp (Cyprinus carpio) x x x x x x x<br />
Silver carp (Hypophthalmychthys<br />
molitrix)<br />
x x<br />
Grass carp (Ctenopharyngodon idella)<br />
Others<br />
x x<br />
African bonytongue (Heterotis niloticus) x x x<br />
Snake-head (Parachanna obscura) x x<br />
Kafue pike (Hepsetus odoe) x<br />
Rainbow trout (Oncorhynchus mykiss) x x<br />
Squeaker (Synodontis sp.) x<br />
Nile perch (Lates niloticus) x<br />
Aba (Gymnarchus niloticus) x<br />
Distichodus (Distichodus sp.) x<br />
Moon fish (Citharinus sp.) x<br />
*Clarias gariepinus x Heterobranchus longifilis (or H. bidorsalis)<br />
Source: Country reviews, FAO Fisheries Global In<strong>for</strong>mation System (2006) <strong>and</strong> FAO (2006)<br />
29<br />
600<br />
319<br />
15<br />
651<br />
29<br />
90<br />
271<br />
15<br />
72<br />
Nigeria 2004 80% 43 950 35 160<br />
Ug<strong>and</strong>a 2003 40% (projected 60% in 2005) 5 500 2 200<br />
Zambia 2003 75% 4 501 3 376<br />
TOTAL 53 951 40 736<br />
Source: FAO (2005), Hecht (2006) <strong>and</strong> modified using data provided in country reviews
Review <strong>of</strong> <strong>feeds</strong> <strong>and</strong> <strong>fertilizers</strong> <strong>for</strong> <strong>sustainable</strong> aquaculture development in sub-Saharan Africa 85<br />
TABLE 7<br />
Production in 2004 by species groups in tonnes <strong>and</strong> percent contribution<br />
Country Nile tilapia Other tilapia Clariid catfish Common carp Others Total<br />
Cameroon 210 114 6 330<br />
Ghana 760 190 950<br />
Kenya 614 320 67 34 1 035<br />
Malawi 697 17 4 15 733<br />
Nigeria 3 000 1 176 26 750 44 12 980 43 950<br />
Ug<strong>and</strong>a 1 660 3 827 50 2 5 539<br />
Zambia 2 900 2 180 45 5 125<br />
Total 9 144 4 053 31 028 216 13 221 57 662<br />
Percent <strong>of</strong> total 15.9 7.0 53.8 0.4 22.9<br />
Source: FAO (2006)<br />
carp (Cyprinus carpio). In most<br />
countries except Malawi <strong>and</strong> Zambia,<br />
O. niloticus is the dominant cichlid<br />
produced in aquaculture. Malawi has<br />
managed to exclude O. niloticus from<br />
its waters <strong>and</strong> in Zambia greenhead<br />
tilapia (O. machrochir) accounts <strong>for</strong><br />
over 41 percent <strong>of</strong> production, while<br />
O. niloticus accounts <strong>for</strong> 35 percent<br />
<strong>of</strong> total production. The farming<br />
<strong>and</strong> production <strong>of</strong> Cyprinus carpio<br />
<strong>and</strong> indigenous cichlids has declined<br />
throughout the SSA region during the<br />
last decade, while the production <strong>of</strong><br />
C. gariepinus, in particular, as well as<br />
O. niloticus has increased significantly<br />
(Figure 4). Between 1999 <strong>and</strong> 2004<br />
common carp production throughout<br />
SSA has declined by 11 percent. The reasons <strong>for</strong> the decline are unclear but may be<br />
related to consumer preferences <strong>and</strong> fish price.<br />
4. AQUACULTURE PRACTICES AND THE FARMING SYSTEMS<br />
The diversity <strong>of</strong> farming systems in the region varies according to the motivation <strong>and</strong><br />
circumstances <strong>of</strong> the farmers. Non-commercial fish farmers in all target countries<br />
practise extensive aquaculture <strong>and</strong> normally own between 1 <strong>and</strong> 5 small ponds (average =<br />
2 ponds), ranging from 100 to 350m 2 . Ponds are either situated on the farmers own l<strong>and</strong><br />
or are clustered in fish farming “clubs” (Figure 5).<br />
Diversion ponds are most commonly used, though in some instances (Malawi,<br />
Cameroon, Ghana) ground water seepage ponds are also <strong>of</strong>ten used by small-holder<br />
fish farmers. Production<br />
technologies are characterised<br />
typically by the low level <strong>of</strong><br />
inputs resulting in low yield.<br />
Annual production by non<br />
commercial farmers in the<br />
target countries ranges from<br />
0.5 to 2.5 tonnes/ha/year <strong>and</strong><br />
averages around 1.2 tonnes/<br />
ha/year. Most <strong>of</strong> the fish<br />
produced on non-commercial<br />
farms is internalised, used <strong>for</strong><br />
FIGURE 4<br />
The change in percent contribution to total<br />
production by species groups in the target<br />
countries between 1994 <strong>and</strong> 2004<br />
FIGURE 5<br />
Typical small-holder farm pond (left) <strong>and</strong> club ponds (right)
86<br />
<strong>Study</strong> <strong>and</strong> <strong>analysis</strong> <strong>of</strong> <strong>feeds</strong> <strong>and</strong> <strong>fertilizers</strong> <strong>for</strong> <strong>sustainable</strong> aquaculture development<br />
barter <strong>and</strong> cash income <strong>and</strong> plays a significant role in food security at the household<br />
level. Most farmers in this category use “green compost” cribs <strong>and</strong> occasionally use<br />
animal manure when available (chicken, goat, rabbit <strong>and</strong> cattle manure) to enhance<br />
natural pond productivity <strong>and</strong> use cereal bran (maize, rice <strong>and</strong> wheat), kitchen waste,<br />
green leaves <strong>and</strong> non-conventional animal protein products as feed, when available.<br />
Substantial proportions <strong>of</strong> farmers in all target countries do not provide any pond<br />
inputs <strong>and</strong> rely only on natural pond productivity. In Cameroon the cribs comprise<br />
around 10 percent <strong>of</strong> pond surface area, though in other countries may comprise less<br />
than 1 percent <strong>of</strong> the pond surface. Most farmers practise some <strong>for</strong>m <strong>of</strong> arbitrary<br />
polyculture, which is largely dependent on the availability <strong>of</strong> fingerlings. Because <strong>of</strong><br />
higher yields, polyculture <strong>of</strong> O.niloticus (or other Tilapia species (e.g. O.shiranus <strong>and</strong><br />
O.mossambicus in Malawi <strong>and</strong> O.<strong>and</strong>ersonii in Zambia) with C.gariepinus or other<br />
clariid species, such as Heterobranchus spp. is becoming the most preferred practice<br />
even by non-commercial farmers, particularly in Nigeria as well as in Cameroon,<br />
Ghana, <strong>and</strong> Ug<strong>and</strong>a.<br />
Stocking densities remain low, at an average <strong>of</strong> 1–4 fingerlings/m 2 . Fishponds are<br />
usually stocked using fingerlings left over at harvest or purchased from neighbours.<br />
More <strong>of</strong>ten than not, this means that small mature fish (stunted) that have no or very<br />
little scope <strong>for</strong> growth are stocked as fingerlings. Some farmers stock their ponds<br />
with fingerlings captured from rivers, lakes or wetl<strong>and</strong>s <strong>and</strong> this leads to higher yields<br />
(ADiM, 2005).<br />
Management practices by the majority <strong>of</strong> non-commercial farmers in all target<br />
countries, with respect to scheduled stocking, fertilization, feeding <strong>and</strong> harvesting is<br />
rudimentary, except where farmers work in collaboration with development projects.<br />
Labour on most non-commercial fish farms is provided by the family, though hired<br />
labour is used where this is af<strong>for</strong>dable. Many small-scale farmers do not have the cash<br />
or other resources to hire labour <strong>and</strong> this is a major constraint on small-holder farms.<br />
In Cameroon, Kenya, Malawi, Ug<strong>and</strong>a <strong>and</strong> Zambia most small-scale fish farmers have<br />
integrated their fish farming activities with agriculture in one or several ways. Though<br />
not mentioned in the country reports it is assumed that the same holds true <strong>for</strong> Ghana<br />
<strong>and</strong> Nigeria.<br />
Semi-intensive <strong>and</strong> intensive commercial aquaculture except in Nigeria <strong>and</strong> Zambia,<br />
where it is relatively well established, is a rapidly emerging activity in all target<br />
countries. The sub-sector has gained particular momentum in the last five years. As<br />
mentioned previously these developments are principally ascribed to the rapidly<br />
escalating fish price in peri-urban <strong>and</strong> urban areas as well as to progressive changes<br />
in government policy <strong>and</strong> support <strong>for</strong> the private sector, particularly in Kenya <strong>and</strong><br />
Ug<strong>and</strong>a (Hecht, 2006 <strong>and</strong> see SSA country reports). In 2004 the average price <strong>of</strong> fish<br />
in peri-urban <strong>and</strong> urban markets was US$2.5/kg (US$1.6 in Kenya to US$4.5/kg in<br />
Nigeria). The adoption <strong>and</strong> implementation <strong>of</strong> strategic aquaculture development plans<br />
also act as enabling tools <strong>for</strong> the development <strong>of</strong> the sector (Hecht, 2006). Strategic<br />
plans have now been adopted in Cameroon, Zambia <strong>and</strong> Malawi, awaiting adoption in<br />
Nigeria <strong>and</strong> in a preparatory phase in Ghana. Most importantly, these developments<br />
have improved investor confidence in the sector in all target countries. Nevertheless, as<br />
suggested by Hecht (2006), there is an urgent need to educate financial institutions in<br />
all SSA countries as to the potential, risks <strong>and</strong> benefits <strong>of</strong> commercial aquaculture, such<br />
that they are better equipped to assist the development <strong>of</strong> the sector.<br />
There is a wide spectrum <strong>of</strong> commercial fish farms in SSA that range from small<br />
to medium scale operations in peri-urban areas, to large pond <strong>and</strong> or cage farming<br />
operations. The level <strong>of</strong> intensification in each <strong>of</strong> these categories ranges widely from<br />
semi-intensive pond culture, to small <strong>and</strong> large cage culture operations to high density<br />
tank culture <strong>of</strong> African catfish, using water recirculation technology (Figures 6–10). It<br />
is clear from the country reviews that each system has evolved <strong>and</strong> is driven by market
Review <strong>of</strong> <strong>feeds</strong> <strong>and</strong> <strong>fertilizers</strong> <strong>for</strong> <strong>sustainable</strong> aquaculture development in sub-Saharan Africa 87<br />
needs. For instance, limited<br />
by space, urban <strong>and</strong> periurban<br />
farmers in Nigeria are<br />
using recirculation technology<br />
(Figures 9 <strong>and</strong> 10), while<br />
farmers in Ug<strong>and</strong>a <strong>and</strong><br />
Kenya have recognized the<br />
opportunities provided by the<br />
Nile perch longline fishery in<br />
Lake Victoria <strong>for</strong> the supply <strong>of</strong><br />
live African catfish fingerlings<br />
as livebait <strong>and</strong> have there<strong>for</strong>e<br />
become full-time fingerling<br />
producers (Figure 11).<br />
Except <strong>for</strong> Ug<strong>and</strong>a <strong>and</strong><br />
Kenya, the legislative <strong>and</strong><br />
regulatory environment in the<br />
other countries remains weak<br />
<strong>and</strong> does not actively promote<br />
investment in the sector. Where<br />
these shortcomings exist<br />
(Cameroon, Ghana, Malawi,<br />
Nigeria <strong>and</strong> Zambia) the<br />
problem has been recognized<br />
<strong>and</strong> is being addressed through<br />
the development <strong>of</strong> strategic<br />
sector development plans<br />
(Hecht, 2006).<br />
Production by commercial<br />
enterprises is variable <strong>and</strong><br />
depends on the systems<br />
employed <strong>and</strong> the level <strong>of</strong><br />
intensification. Cage culture<br />
production levels in Ghana,<br />
Zimbabwe <strong>and</strong> Zambia with<br />
O.niloticus range from 2 to 4<br />
tonnes/100 m 3 . Cages range<br />
from small locally made cages<br />
to medium size square cages<br />
(6x6x3m), to 796 m 3 in Ghana<br />
to 1 200 m 3 circular cages<br />
(Malawi). The largest cage<br />
culture operation in SSA is Lake<br />
Harvest (Pty) Ltd (Lake Kariba,<br />
Zimbabwe), producing around<br />
2 500 to 3 000 tonnes per annum,<br />
most <strong>of</strong> which is exported to<br />
the European Union (EU). A<br />
similar operation is now being<br />
established in Malawi. The<br />
Malawian operation intends<br />
to produce 3 000 tonnes <strong>of</strong><br />
chambo, O. karongae or<br />
FIGURE 6<br />
Emerging small-scale commercial farmers specialising in fingerling<br />
production (left) <strong>and</strong> table fish production (right)<br />
FIGURE 7<br />
Large scale polyculture pond farming <strong>of</strong> C. carpio, C. gariepinus <strong>and</strong><br />
O. mossambicus<br />
FIGURE 8<br />
Small Nile tilapia cages in Lake Kanyaboli in Kenya (left) <strong>and</strong> large<br />
chambo cages in Lake Malawi (right)<br />
FIGURE 9<br />
Trickle filter tower (left) <strong>and</strong> high density indoor rearing tank (right)<br />
at an African catfish farm in Nigeria<br />
COURTESY OF M. MBUGUA<br />
COURTESY OF MOHAMMAD R.HASAN
COURTESY OF K.J. RANA<br />
COURTESY OF J. RUTAISIRE<br />
88<br />
<strong>Study</strong> <strong>and</strong> <strong>analysis</strong> <strong>of</strong> <strong>feeds</strong> <strong>and</strong> <strong>fertilizers</strong> <strong>for</strong> <strong>sustainable</strong> aquaculture development<br />
FIGURE 10<br />
African catfish broodstock <strong>and</strong> recirculating hatchery in Nigeria<br />
FIGURE 11<br />
Clarias gariepinus hatchery in Ug<strong>and</strong>a<br />
FIGURE 12<br />
Circular <strong>and</strong> D-ended O. niloticus tank<br />
farm in Kenya<br />
O. shiranus in 32 cages in Lake<br />
Malawi. Initial stocking density<br />
ranges from 65 to 75 fingerlings<br />
(30g average weight) per m 3 . Final<br />
biomass at harvest ranges from 21<br />
to 40 kg/m 3 after growth cycles <strong>of</strong><br />
6 to 9 months.<br />
Commercial aquaculture in<br />
earthen ponds is well developed<br />
in Nigeria <strong>and</strong> Zambia. In many<br />
<strong>of</strong> the target countries polyculture<br />
<strong>of</strong> O. niloticus <strong>and</strong> C. gariepinus<br />
is currently the most popular<br />
practice, though some farmers<br />
use other combinations. While<br />
polyculture is practised in all<br />
countries commercial farmers in<br />
several countries also produce<br />
O. niloticus (Zambia <strong>and</strong> Kenya)<br />
<strong>and</strong> C. gariepinus (Nigeria) under<br />
monoculture farming conditions.<br />
Production levels range from 2.5 to<br />
15 tonnes/ha/year <strong>for</strong> O. niloticus<br />
(monoculture) <strong>and</strong> O. niloticus/<br />
C. gariepinus polyculture <strong>and</strong><br />
up to 10–30 tonnes/ha/year <strong>for</strong><br />
C. gariepinus monoculture in Nigeria. The<br />
size <strong>of</strong> production ponds ranges from 500 m 2<br />
to 1.5 ha. Stocking densities in earthen<br />
ponds average around 5 to 8 fingerlings per<br />
square meter.<br />
High density mono-culture <strong>of</strong><br />
C. gariepinus in tanks (using water<br />
recirculation) is exp<strong>and</strong>ing rapidly in<br />
Nigeria, particularly in urban <strong>and</strong> periurban<br />
areas. Final densities as high as<br />
100 kg/m 3 have been reported <strong>and</strong> initial<br />
stocking densities may be as high as<br />
50 fingerlings/m 2 . Some <strong>of</strong> the high density<br />
farms in Nigeria now produce in the region<br />
<strong>of</strong> 3 tonnes <strong>of</strong> catfish per week. In response<br />
to the dem<strong>and</strong> by the Nile perch long line<br />
fishery in Lake Victoria, farmers in Ug<strong>and</strong>a<br />
<strong>and</strong> Kenya have developed intensive hatchery <strong>and</strong> fingerling rearing technologies.<br />
In Kenya there are six <strong>and</strong> in Ug<strong>and</strong>a there are eleven commercial catfish hatcheries.<br />
These hatcheries supply the Nile perch fishery with live fingerlings <strong>of</strong> around 10 g<br />
<strong>and</strong> also supply other farmers with catfish fingerlings <strong>for</strong> grow-out. The capacity <strong>of</strong><br />
the Ug<strong>and</strong>an <strong>and</strong> Kenyan catfish hatchery operators ranges from 10 000 to 30 000<br />
fingerlings per month. It is not known how many catfish hatcheries there are in<br />
Nigeria, nor is there an accurate figure <strong>for</strong> the number <strong>of</strong> high density catfish farms.<br />
Concrete raceways are the preferred mode <strong>of</strong> rainbow trout production in Malawi<br />
<strong>and</strong> Kenya. Circular <strong>and</strong> D-ended concrete tanks are also used <strong>for</strong> the production <strong>of</strong><br />
O. niloticus in Kenya (Figure 12) <strong>and</strong> Zambia.
Review <strong>of</strong> <strong>feeds</strong> <strong>and</strong> <strong>fertilizers</strong> <strong>for</strong> <strong>sustainable</strong> aquaculture development in sub-Saharan Africa 89<br />
Cameroon, Ug<strong>and</strong>a, Kenya, Malawi <strong>and</strong> Zambia also boast an emerging ornamental<br />
fish farming sector, which produces fish <strong>for</strong> the local as well as the export market.<br />
Ornamentals are produced in concrete tanks <strong>and</strong> earthen ponds. The volumes <strong>and</strong> or<br />
numbers produced are not known.<br />
5. REVIEW AND ANALYSIS OF FERTILIZER USE IN POND AQUACULTURE<br />
Pond fertilization practices <strong>and</strong> the use <strong>of</strong> different commodities to enhance pond<br />
productivity in the region are very diverse <strong>and</strong> depend to a large extent on the scale<br />
<strong>of</strong> operation. Table 8 summarizes the types <strong>of</strong> <strong>fertilizers</strong> used by commercial <strong>and</strong> noncommercial<br />
farmers in the target countries. Compost cribs are not used by commercial<br />
farmers <strong>and</strong> chemical <strong>fertilizers</strong> are only used by commercial farmers <strong>and</strong> then only<br />
when these are available. Similarly, manure is only used intermittently by noncommercial<br />
farmers, when available.<br />
The vast majority <strong>of</strong> small-scale, non-commercial farmers use “green compost cribs”<br />
to fertilize their ponds. In many instances this is supplemented by animal manure,<br />
though there is no evidence to suggest that farmers adhere to any fixed fertilization<br />
regimen. Depending on the resource base <strong>of</strong> the farmer some only fertilize their ponds<br />
at irregular intervals <strong>and</strong> do not provide supplementary <strong>feeds</strong>. This practice has been<br />
recorded in Kenya, Zambia, Malawi <strong>and</strong> Ug<strong>and</strong>a <strong>and</strong> no doubt also occurs in the other<br />
target countries. The size <strong>of</strong> the compost crib varies substantially. In Cameroon the<br />
cribs comprise an average <strong>of</strong> 10 percent <strong>of</strong> pond surface area to less than 1 percent<br />
(personal observations in Malawi <strong>and</strong> Zambia). Kitchen wastes <strong>and</strong> other agricultural<br />
by-products are also <strong>of</strong>ten dumped into the cribs. The general recommendation<br />
throughout the region is that the contents <strong>of</strong> the crib should be turned once every one<br />
to two weeks (Figure13). It is however not known to what extent this is practiced.<br />
Emerging commercial farmers in Cameroon, Ghana, Nigeria <strong>and</strong> Ug<strong>and</strong>a <strong>of</strong>ten still<br />
use a combination <strong>of</strong> crib <strong>and</strong> animal manure fertilization. However, as soon as they can<br />
af<strong>for</strong>d adequate quantities <strong>of</strong> animal manure they no longer use the crib technique.<br />
The most commonly used manures are chicken, pig (depending on the religious<br />
persuasion <strong>of</strong> the region <strong>and</strong> <strong>of</strong> the market) <strong>and</strong> cattle manure, though the prevalence<br />
<strong>of</strong> use varies among countries. For example in Ug<strong>and</strong>a most farmers (58 percent) use<br />
cattle manure, while chicken manure was least used. In Malawi, Nigeria, Ghana <strong>and</strong><br />
Cameroon chicken manure is most commonly used. Other less <strong>of</strong>ten used manures<br />
include goat, sheep, duck <strong>and</strong> rabbit manure. Chicken manure appears to be readily<br />
available in all countries. In Cameroon, Ghana, Malawi <strong>and</strong> Ug<strong>and</strong>a it is either available<br />
free <strong>of</strong> charge or at a minimum cost from industrial broiler farms. However, the cost<br />
<strong>of</strong> bagging <strong>and</strong> transport is <strong>of</strong>ten such that non-commercial farmers cannot af<strong>for</strong>d<br />
TABLE 8<br />
Use <strong>of</strong> compost, manure <strong>and</strong> inorganic <strong>fertilizers</strong> by non-commercial (NC) <strong>and</strong> commercial (C)<br />
fish farmers in target countries<br />
Country Compost Manure Fertilizers<br />
NC C NC C NC C<br />
Cameroon Yes No Yes Yes No NPK (20:10:10), though rarely used<br />
Ghana Yes No Yes Yes No NPK though rarely used<br />
Kenya Yes No Yes Yes No NPK, under semi-intensive conditions<br />
Malawi Yes No Yes Yes No TSP, NPK, urea (used only occasionally <strong>and</strong> in<br />
combination with animal manure)<br />
Nigeria Yes No Yes Yes No SP, TSP, NPK used only occasionally <strong>and</strong> in combination<br />
with manure.<br />
Ug<strong>and</strong>a Yes No Yes Yes No DAP, NPK, urea <strong>and</strong> phosphoric acid used mainly to<br />
start plankton blooms in catfish fingerling ponds.<br />
Zambia Yes No Yes Yes No TSP, NPK<br />
NPK = nitrogen, phosphorus <strong>and</strong> potassium; TSP = triple super phosphate; SSP = single super phosphate;<br />
DAP = di-ammonium phosphate.<br />
Source: country reviews
90<br />
<strong>Study</strong> <strong>and</strong> <strong>analysis</strong> <strong>of</strong> <strong>feeds</strong> <strong>and</strong> <strong>fertilizers</strong> <strong>for</strong> <strong>sustainable</strong> aquaculture development<br />
the commodity. Moreover, in most countries there is considerable competition from<br />
vegetable farmers <strong>for</strong> chicken manure. Pig <strong>and</strong> cattle manure is apparently only used in<br />
instances where the animals are kept in a kraal (enclosure) during the night to facilitate<br />
collection. The practice <strong>of</strong> holding animals in pens above the ponds or in enclosures<br />
adjacent to the pond is also increasing. The average density at which chickens <strong>and</strong><br />
pigs are kept <strong>for</strong> fish pond fertilization is 1 to 2 pigs (>25 kg) or 50 mature birds per<br />
100 m 2 . It is well known that semi-intensive duck cum fish farming has been promoted<br />
by development partners <strong>and</strong> is practiced in several countries in SSA. It was however<br />
not mentioned in any <strong>of</strong> the country reports. This may indicate that the practice is not<br />
popular, practical or pr<strong>of</strong>itable.<br />
There is no doubt that adequate quantities <strong>of</strong> manure are produced in each country<br />
to satisfy the requirements <strong>of</strong> agriculture <strong>and</strong> aquaculture. For instance, total manure<br />
production in Cameroon <strong>and</strong> Kenya amounts to 30 000 <strong>and</strong> 18 788 tonnes per annum,<br />
respectively (Pouomogne, 2007 <strong>and</strong> Ny<strong>and</strong>at (2007). Similar calculations using<br />
livestock production figures from the various target countries would undoubtedly also<br />
show that manure is available in adequate quantities. However, the costs involved in<br />
collecting, bagging <strong>and</strong> transport prohibits its ready use by fish farmers. In summary,<br />
it can be concluded that on a national basis adequate quantities <strong>of</strong> manure are available<br />
in all countries. However, the low livestock holdings <strong>of</strong> small-holder farmers, or<br />
alternatively the high cost <strong>of</strong> acquisition limits its use in non-commercial aquaculture<br />
throughout the region.<br />
The use <strong>of</strong> animal manure in small-holder aquaculture is further constrained by<br />
free range farming practices <strong>and</strong> the limited number <strong>of</strong> livestock kept by farmers.<br />
For example, in Malawi the average number <strong>of</strong> livestock per fish farming household<br />
is around 4 chickens <strong>and</strong> 1 goat. Using on-farm livestock population estimates it was<br />
calculated that small-holder farmers in Malawi have access to about 2.6 tonnes <strong>of</strong> wet<br />
manure or 1.62 tonne <strong>of</strong> dry manure per annum. This quantity is not sufficient <strong>for</strong> the<br />
production <strong>of</strong> the main food crop (maize), which requires about 12.5 tonnes/ha, hence<br />
very little if any is left <strong>for</strong> fish production. In Ug<strong>and</strong>a it was estimated that more than<br />
80 percent <strong>of</strong> fish farmers have access to <strong>fertilizers</strong> (all types) all year round but not in<br />
sufficient quantities. No doubt the same holds true <strong>for</strong> small-holder, non-commercial<br />
farmers in other target countries.<br />
Manure is either spread directly over the water or is incorporated into the crib or<br />
is allowed to leach from grain bags that are tied to a stake in the centre or the side <strong>of</strong><br />
the pond. All <strong>of</strong> the target countries have aquaculture extension services <strong>of</strong> one kind or<br />
another (Hecht, 2006), which <strong>for</strong> many years have been promoting basic aquaculture<br />
<strong>and</strong> pond management techniques to small-holder farmers. Hence, while farmers<br />
may underst<strong>and</strong> the need <strong>for</strong> drying out their ponds after harvest <strong>and</strong> fertilization<br />
with animal manure prior to filling <strong>and</strong> stocking, very few farmers actually practice<br />
these basic techniques. The reasons <strong>for</strong> this are manifold but are also clearly related<br />
to on-farm labour requirements <strong>for</strong> other economic activities <strong>and</strong> the need to adhere<br />
to the agricultural calendar. Many small scale fish farmers in Malawi, Ug<strong>and</strong>a, Kenya,<br />
Cameroon <strong>and</strong> Ghana consider fish as a “free extra” <strong>and</strong> many farmers rely solely<br />
on natural productivity to obtain a small but welcome intermittent harvest. In other<br />
words, aquaculture is <strong>of</strong> a lower priority than staple food production.<br />
Recommended initial manure application rates in the target countries are similar <strong>and</strong><br />
range from an initial start up fertilization regimen <strong>of</strong> 50–60 kg <strong>for</strong> chicken manure, 50–<br />
65 kg <strong>for</strong> pig manure <strong>and</strong> 70–150 kg/100m 2 <strong>for</strong> cattle manure, with follow up rates <strong>of</strong> 6, 7<br />
<strong>and</strong> 8–9 kg <strong>for</strong> chicken, pig <strong>and</strong> cattle manure respectively per 100 m 2 every 10–14 days.<br />
However, in Cameroon (Pouomogne, 2007) <strong>and</strong> Ghana (Abban, 2005), <strong>and</strong> no doubt<br />
elsewhere actual application rates are far below (
Review <strong>of</strong> <strong>feeds</strong> <strong>and</strong> <strong>fertilizers</strong> <strong>for</strong> <strong>sustainable</strong> aquaculture development in sub-Saharan Africa 91<br />
It is clear from the country<br />
reviews <strong>and</strong> Hecht (2006) that<br />
commercial fish farmers follow<br />
more rigid pond management<br />
regimens, with respect to drying,<br />
liming <strong>and</strong> adequate fertilization<br />
throughout the production<br />
cycle. Crude Secchi disks are<br />
now quite commonly used by<br />
emerging commercial farmers to<br />
gauge the need <strong>for</strong> fertilization in<br />
Cameroon, Ghana, Ug<strong>and</strong>a <strong>and</strong><br />
Malawi. The most commonly<br />
FIGURE 13<br />
Mixing <strong>of</strong> compost crib in Cameroon (left) <strong>and</strong> mechanical<br />
application <strong>of</strong> cattle manure in Zambia (right)<br />
used manures by commercial farmers are chicken, cattle <strong>and</strong> pig manure (depending<br />
on availability <strong>and</strong> cost). Many <strong>of</strong> the larger commercial fish farms have integrated<br />
fish production with other <strong>for</strong>ms <strong>of</strong> animal husb<strong>and</strong>ry. For example, one <strong>of</strong> the larger<br />
fish farms in Zambia relies on manure from the farms cattle herd (Figure 13) <strong>and</strong> some<br />
larger chicken farmers in Ug<strong>and</strong>a, Zambia <strong>and</strong> Nigeria have exp<strong>and</strong>ed their activities<br />
to include fish farming.<br />
Inorganic fertilizer is used only by some commercial farmers <strong>and</strong> then mostly<br />
to “kick start” pond productivity, which is thereafter maintained by the application<br />
<strong>of</strong> animal manure. Several catfish fingerling producers in Ug<strong>and</strong>a use only chemical<br />
fertilizer (phosphoric acid <strong>and</strong> urea) with which to enhance pond productivity. The<br />
price <strong>of</strong> inorganic <strong>and</strong> organic <strong>fertilizers</strong> in the target countries in 2004/5 is illustrated<br />
in Table 9.<br />
The data show that the average farm gate price <strong>of</strong> animal manure is substantially<br />
lower than the average price <strong>of</strong> chemical <strong>fertilizers</strong>. However, while animal manure is<br />
significantly cheaper per tonne than inorganic fertilizer, the quantities required <strong>and</strong> the<br />
cost <strong>of</strong> transport makes it unaf<strong>for</strong>dable to most small-holder farmers. In Malawi <strong>and</strong><br />
Ug<strong>and</strong>a (<strong>for</strong> which data were available) the cost <strong>of</strong> transport ranges from US$0.5 to<br />
1.11 km/tonne. If a farmer is located 50 km <strong>for</strong>m the nearest chicken farm effectively<br />
trebles the cost, unless purchased <strong>and</strong> transported in bulk (7 to 10 tonnes per trip).<br />
Using the price <strong>of</strong> chicken manure <strong>and</strong> the average price <strong>of</strong> chemical <strong>fertilizers</strong> in<br />
Ug<strong>and</strong>a <strong>and</strong> Malawi <strong>and</strong> the theoretical quantities <strong>of</strong> manure required to 1 ha <strong>of</strong> fish<br />
ponds on a yearly basis in relation to super phosphate makes the <strong>for</strong>mer three times<br />
more expensive than the latter. The Malawi report revealed that 75 percent <strong>of</strong> smallholder<br />
farmers cannot af<strong>for</strong>d to purchase adequate quantities <strong>of</strong> fertilizer <strong>for</strong> their<br />
annual maize crop. It st<strong>and</strong>s to reason there<strong>for</strong>e that they would be even less able to<br />
TABLE 9<br />
Price <strong>of</strong> <strong>fertilizers</strong> <strong>and</strong> manure in target countries in 2004/5 (US$ per tonne)<br />
Chemical <strong>fertilizers</strong> Cameroon Ghana Kenya Malawi Nigeria Ug<strong>and</strong>a Zambia<br />
Triple super phosphate 470<br />
NPK 402 340 600<br />
Urea 468 440<br />
Di-ammonium phosphate 500<br />
CAN 400<br />
Average chemical fertilizer<br />
price<br />
Manure<br />
272–400 435 452.5 368.7 - 430–500 383<br />
Chicken manure 74 11*–22 54 26.9 29 16.6 22<br />
Cattle manure 45 130 4 18 10<br />
Pig manure 45 60<br />
* Poultry farm gate price<br />
Source: Country reviews, Hasan (2005) <strong>and</strong> B. Thiga, Sagana Aquaculture Centre, Kenya, (pers. comm.)<br />
COURTESY OF V. POUOMOGNE
92<br />
<strong>Study</strong> <strong>and</strong> <strong>analysis</strong> <strong>of</strong> <strong>feeds</strong> <strong>and</strong> <strong>fertilizers</strong> <strong>for</strong> <strong>sustainable</strong> aquaculture development<br />
af<strong>for</strong>d the cost <strong>of</strong> adequate manure (if they have to purchase it) <strong>for</strong> the fertilization <strong>of</strong><br />
fish ponds. In a survey conducted in 2004 it was found that only 9 percent <strong>of</strong> farmers<br />
applied adequate amounts <strong>of</strong> fertilizer to their ponds <strong>and</strong> over 63 percent did not apply<br />
any fertilizer at all. The picture with respect to manuring <strong>of</strong> crops was very similar,<br />
with only 9 percent <strong>of</strong> farmers applying adequate quantities, 56 percent under applying<br />
<strong>and</strong> 21 percent not applying any fertilizer at all (Singa, 2004). Similarly, in Ug<strong>and</strong>a<br />
farmers are all aware <strong>of</strong> the value <strong>of</strong> animal manure <strong>and</strong> many purchase some quantities<br />
but cannot af<strong>for</strong>d adequate amounts.<br />
From this we may conclude that the cost <strong>of</strong> adequate quantities <strong>of</strong> manure to<br />
effectively boost fish production is too high <strong>for</strong> the average non-commercial fish<br />
farmer in the region. This conclusion is corroborated by the fact that the majority <strong>of</strong><br />
small-holder, non-commercial fish farmers use green compost cribs as the primary<br />
method <strong>of</strong> fertilization. Unless there is a change in this dynamic it will not be possible<br />
<strong>for</strong> small-holder farmers to make meaningful contributions to national fish supply.<br />
However, the important contribution by fish ponds to household protein supply<br />
should not be underestimated in rural areas.<br />
6. REVIEW AND ANALYSIS OF FEEDS AND FEEDING<br />
Analysis <strong>of</strong> the country reports revealed that commercial aqua<strong>feeds</strong> in 2005 were only<br />
manufactured in Cameroon, Kenya, Malawi (non pelleted feed mix), Nigeria <strong>and</strong><br />
Zambia, though initiatives are now also underway to produce fish pellets in Ghana<br />
<strong>and</strong> Ug<strong>and</strong>a. Approximately 12 000 tonnes <strong>of</strong> commercial fish feed was manufactured<br />
in the five target countries, <strong>of</strong> which the bulk (88 percent) was produced in Nigeria.<br />
The types <strong>of</strong> <strong>feeds</strong> produced are shown in Table 10. Perhaps most importantly the<br />
summarized in<strong>for</strong>mation in Table 9 illustrates the pivotal role <strong>of</strong> farm-made <strong>feeds</strong> 1 .<br />
Given the total volume <strong>of</strong> fish produced <strong>and</strong> the proportion produced by commercial<br />
farmers (see Table 4) it is fair to conclude that the aquaculture sector relies almost<br />
entirely on farm-made <strong>feeds</strong>. On the assumption that country production statistics<br />
are realistic crude calculations using a food conversion ratio <strong>of</strong> 1.8:1, suggests that the<br />
commercial aquafeed produced by the <strong>for</strong>mal industry accounts <strong>for</strong> a maximum <strong>of</strong> 15.6<br />
percent <strong>of</strong> total fish production in the target countries or 22 percent <strong>of</strong> fish produced<br />
by the commercial aquaculture sector.<br />
A wide range <strong>of</strong> ingredients are available <strong>for</strong> feeding fish <strong>and</strong> or <strong>for</strong> the manufacture<br />
<strong>of</strong> fish <strong>feeds</strong> in the region. Table 11 lists some <strong>of</strong> the ingredients commonly used by<br />
feed manufacturers (<strong>for</strong>mal <strong>and</strong> in<strong>for</strong>mal) <strong>and</strong> based on in<strong>for</strong>mation provided in the<br />
TABLE 10<br />
Species <strong>and</strong> use <strong>of</strong> commercial <strong>and</strong> or farm-made <strong>feeds</strong> in sub-Saharan Africa<br />
FEEDS Cameroon Ghana Kenya Malawi Nigeria Ug<strong>and</strong>a * Zambia<br />
Trout<br />
Commercial<br />
Farm-made<br />
Tilapia<br />
Commercial<br />
Farm-made<br />
√<br />
√ √<br />
√<br />
√ √<br />
√<br />
√ √<br />
Catfish<br />
Commercial<br />
Farm-made √ √ √ √<br />
√<br />
√ √<br />
√ <strong>and</strong>**<br />
√<br />
√<br />
√<br />
**<br />
√ √<br />
Common carp<br />
Commercial<br />
Farm-made √ √ √ √ √ √ √<br />
Ornamental<br />
Commercial<br />
Farm-made √<br />
√<br />
√ √ √ √<br />
*Two firms are currently undertaking fish feed manufacturing trials; **Imports from Aquanutro (Pty) Ltd, South<br />
Africa <strong>and</strong> elsewhere<br />
1 Farm-made <strong>feeds</strong> collectively describes fish <strong>feeds</strong> made by farmers as well as by in<strong>for</strong>mal small-scale feed<br />
manufacturers.
Review <strong>of</strong> <strong>feeds</strong> <strong>and</strong> <strong>fertilizers</strong> <strong>for</strong> <strong>sustainable</strong> aquaculture development in sub-Saharan Africa 93<br />
TABLE 11<br />
Availability <strong>of</strong> the most common ingredients <strong>for</strong> the manufacture <strong>of</strong> animal <strong>feeds</strong> in sub-Saharan Africa<br />
Commodity<br />
PLANT ORIGIN<br />
Cameroon Ghana Kenya Malawi Nigeria Ug<strong>and</strong>a Zambia<br />
C<strong>of</strong>fee pulp ++ ++ + + ++<br />
Cacao husks +++ - - ++ -<br />
Rice ban + ++ ++ ++ +++ +++ ++<br />
Wheat bran ++ + ++ + ++ ++ ++<br />
Maize bran +++ ++ ++ +++ +++ +++ +++<br />
Groundnut bran ? ++ ? ? ? ? ?<br />
Wheat pollard ? ? ++ ? ? ? ?<br />
Maize ++ + + ++ ++ ++ ++<br />
Millet + + + + +<br />
Soybean ? + + + + + +<br />
Wheat<br />
Oil seed cakes<br />
+ + + ++ + +<br />
Cotton ++ ++ + +++ ++ +<br />
Groundnut + ++ ++ + ++ +<br />
Sunflower ? ++ ++ + ++ ++<br />
Palm kernel ++ - - ++ -<br />
Soybean +++ + + + + +<br />
Copra ? ++ + - ? -<br />
Sesame ? + - + -<br />
Other seed cakes ++ ++<br />
Brewery waste ++ ++ ++ ++ ++ ++ ++<br />
Vegetable oils<br />
ANIMAL ORIGIN<br />
+++ ++ + ++ +++ ++ +++<br />
Fishmeal (local) + + + + + +<br />
Fishmeal (imported) + ++ + ++ ++<br />
Blood meal + + +++ ++ -<br />
Hydrolyzed feather meal ? ++ -<br />
Carcass & bone meal + ++ +++ -<br />
Crayfish meal + ? ? -<br />
Shrimp waste ? + ++ -<br />
Chicken layer dropping<br />
meal<br />
++<br />
Fish oil + ? + -<br />
Rendered poultry oil ? ? + -<br />
Vitamin <strong>and</strong> mineral<br />
premix*<br />
++ ++ ++ ++ ++ ++ ++<br />
* = Imported; + = limited supply, ++ = readily available, +++ = abundant supply<br />
Source: Bentley <strong>and</strong> Bentley (2005), Fagbenro <strong>and</strong> Adebayo (2005), Hasan (2005); Radull, (2005), C. Mudenda, Dept. Fisheries,<br />
Zambia (pers. comm.),<br />
country reviews <strong>and</strong> Hasan (2005), provides a qualitative indication <strong>of</strong> availability.<br />
From the in<strong>for</strong>mation provided in the country reviews it would appear that the<br />
animal feed industry in Kenya in particularly is severely constrained by shortages <strong>of</strong><br />
suitable ingredients. Table 12 provides an insight into the availability <strong>and</strong> use <strong>of</strong> nonconventional<br />
ingredients as fish <strong>feeds</strong> by small-holder non-commercial fish farmers in<br />
the region. The proximate composition <strong>of</strong> the various ingredients (crude protein, lipid,<br />
fibre <strong>and</strong> ash) is provided in the country reviews.<br />
The price <strong>of</strong> ingredients in the target countries is shown in Table 13. Prices<br />
vary significantly between countries <strong>and</strong> this affects the <strong>for</strong>mulations used by feed<br />
manufacturers <strong>and</strong> farmers. For example, the price <strong>of</strong> fishmeal ranges from US$1 500<br />
per tonne in Nigeria to US$370 per tonne in Kenya. Both Kenya <strong>and</strong> Ug<strong>and</strong>a produce<br />
substantial quantities <strong>of</strong> fishmeal from the Rastrineabola argentea fishery in Lake<br />
Victoria, while the other target countries produce limited quantities <strong>of</strong> fishmeal (e.g.<br />
9 000 tonnes in Nigeria in 2004). Ug<strong>and</strong>a currently does not permit the import <strong>of</strong><br />
fishmeal <strong>and</strong> until recently Nigeria also imposed restrictions on the importation <strong>of</strong><br />
fishmeal. While some fishmeal is made by small-scale producers in several target
94<br />
<strong>Study</strong> <strong>and</strong> <strong>analysis</strong> <strong>of</strong> <strong>feeds</strong> <strong>and</strong> <strong>fertilizers</strong> <strong>for</strong> <strong>sustainable</strong> aquaculture development<br />
TABLE 12<br />
Non-conventional commodities used by small-scale, non-commercial farmers<br />
Commodity Cameroon Ghana Kenya Malawi Nigeria Ug<strong>and</strong>a Zambia<br />
Napier & other grasses Common Common Common Common Common Common Common<br />
Cacao husks Common Common No No ? No No<br />
Cassava leaves Common Common Common Common Common Common Common<br />
Cassava peels Common Common ? Common ? ? ?<br />
Other vegetable peels Common Common Common Common Common Common Common<br />
Vegetable leaves Common Common Common Common Common Common Common<br />
Banana & other fruit<br />
leaves<br />
Common Common Common Common Common Common Common<br />
Over ripe fruit Common Common ? Common ? Common Common<br />
Dead farm animals Rarely Rarely ? No ? ? ?<br />
Animal viscera Rarely ? ? No Rarely ? ?<br />
Termites Common Common Common Common Common Common Common<br />
Maggots Rarely Rarely ? Rarely Rarely ? ?<br />
Rice bran Common Common Common Common Common Common Common<br />
Wheat bran If available ? If available Rarely ? If available If available<br />
Maize bran Common Common Common Common Common Common Common<br />
Kitchen waste Common Common Common Common Common Common Common<br />
Trash fish Rarely No Rarely No Rarely Rarely No<br />
? = No in<strong>for</strong>mation.<br />
Source: Country reviews<br />
TABLE 13<br />
A comparison <strong>of</strong> prices (US $ per tonne) <strong>of</strong> common feed ingredients used in the manufacture <strong>of</strong> animal <strong>and</strong><br />
aqua<strong>feeds</strong> in sub-Saharan Africa<br />
Commodity Cameroon Ghana Kenya Malawi Nigeria Ug<strong>and</strong>a Zambia<br />
Year 2005 2005 2005 2006 2005/6 2005 2006<br />
Fishmeal 1 132 453–1 031 360–990 750 870–1 500 470–670 750<br />
Carcass meal 1 132 450<br />
Blood meal 1 320 320 420<br />
Bone meal 190<br />
Lake shrimp meal 200–400<br />
Crayfish meal 1 320<br />
Soya seedcake 679 483 500 694<br />
Sunflower seedcake 160<br />
Cotton seedcake 301 260 192 305 140 442<br />
Groundnut seedcake 471 544 300 330 170<br />
Palm kernel oilcake 75 125<br />
Dry layer droppings 94<br />
Rice bran 91 90 27<br />
Maize bran 68 90 30 80 70<br />
Wheat bran 109 68 90 91<br />
Brewery waste 28 2.3 30 150 11 **<br />
Maize 264 191 210–230 345 280 205–240<br />
Millet 283<br />
Soybean 544 350 460<br />
Vegetable oils 1 600 1 100<br />
Fish oil 3 800<br />
Chicken mash 240 305 800 568<br />
Dairy mash 220<br />
Pig finisher mash 190 500 470<br />
Mineral mix*/kg 2.8<br />
Vitamin & mineral premix /kg 8.5 7 6.6 20<br />
* Made in some countries <strong>and</strong> consists mainly <strong>of</strong> cattle horns, freshwater snail shells <strong>and</strong> oyster shells<br />
** Brewery waste is normally obtained free <strong>of</strong> charge at the factory gate<br />
Source: Country reviews<br />
countries it is not known what quantities are produced. Given the high price <strong>of</strong><br />
fishmeal it is fair to conclude that the use <strong>of</strong> alternative protein sources <strong>for</strong> fish feed<br />
in the region is a priority. The price <strong>of</strong> oilseed cakes, though readily available, is high<br />
<strong>and</strong> also varies significantly among countries. Soya oil seedcake is the most expensive<br />
throughout the region, while cotton oil seedcake is generally available at a lower price.
Review <strong>of</strong> <strong>feeds</strong> <strong>and</strong> <strong>fertilizers</strong> <strong>for</strong> <strong>sustainable</strong> aquaculture development in sub-Saharan Africa 95<br />
Moreover, the price <strong>of</strong> feed commodities also varies seasonally <strong>and</strong> this also determines<br />
the composition <strong>of</strong> <strong>feeds</strong>. Many <strong>of</strong> the smaller commercial farmers in Nigeria (<strong>and</strong><br />
probably elsewhere) purchase the cheapest feed ingredients on the market irrespective<br />
<strong>of</strong> the nutritional value <strong>of</strong> the commodity. The majority <strong>of</strong> small-holder, noncommercial<br />
farmers rely largely on enhanced pond productivity (green compost cribs)<br />
<strong>and</strong> supplementary feeding using cereal bran, as <strong>and</strong> when available. For example, in<br />
Kenya over 99 percent <strong>of</strong> farmers are reliant on this practice.<br />
Trash fish <strong>and</strong> factory <strong>of</strong>fal is recognised as a possible fish feed in Nigeria, Ghana<br />
<strong>and</strong> Cameroon. However, very little if any, is used as most <strong>of</strong> it is sold as food <strong>for</strong><br />
human consumption.<br />
A comparison <strong>of</strong> prices <strong>of</strong> some common feed ingredients used in the manufacture<br />
<strong>of</strong> animal <strong>and</strong> aqua<strong>feeds</strong> is provided in Table 13.<br />
7. THE ANIMAL FEED INDUSTRY<br />
The animal feed industry in SSA consists <strong>of</strong> a <strong>for</strong>mal <strong>and</strong> an in<strong>for</strong>mal sector. The <strong>for</strong>mal<br />
sector is embedded within the industrial sectors <strong>of</strong> the countries, while the in<strong>for</strong>mal<br />
sector consists <strong>of</strong> small-scale feed manufacturers using less sophisticated machinery<br />
<strong>and</strong> farm-based feed mills that may produce anything from a few kilogram’s to several<br />
tonnes <strong>of</strong> feed per day. On the whole the animal feed industry is focused primarily<br />
on the production <strong>of</strong> chicken feed <strong>and</strong> the <strong>for</strong>mal or commercial feed industry in the<br />
group <strong>of</strong> target countries is best developed in Nigeria.<br />
The total production <strong>of</strong> animal <strong>feeds</strong> in the target countries is shown in Table 14.<br />
Nigeria, after South Africa (which produced over 4.4 million tonnes in 2005), is the<br />
biggest producer <strong>of</strong> animal <strong>feeds</strong> in SSA (Shipton <strong>and</strong> Hecht, 2005). Nigeria produces<br />
around 3.8 million tonnes per annum. Kenya with 450 000 tonnes is the third largest<br />
producer <strong>of</strong> animal <strong>feeds</strong>. Production by the other countries in 2005 ranged from 80 000<br />
to 148 000 tonnes. It should be noted that the data <strong>for</strong> all countries is not <strong>for</strong> 2005. The<br />
most recent available in<strong>for</strong>mation <strong>for</strong> Nigeria <strong>for</strong> example was <strong>for</strong> 2000/1. In 2000/1<br />
Fagbenro <strong>and</strong> Adebayo (2005) estimated that there were some 620 feed manufacturers<br />
in Nigeria <strong>of</strong> which 59 percent were small operators with a capacity <strong>of</strong> between 0.5 <strong>and</strong><br />
5 tonnes/hour. They also calculated that only 51 percent <strong>of</strong> the production capacity<br />
<strong>of</strong> the <strong>for</strong>mal feed mills was being used. Currently there are 32 industrial scale feed<br />
manufacturers in Nigeria (see Table 14 <strong>for</strong> more details).<br />
TABLE 14<br />
Commercial animal feed* production (tonnes) in target countries<br />
Cameroon Ghana Kenya Malawi Nigeria ** Ug<strong>and</strong>a Zambia<br />
Year 2004 2004/5 2005 2001 2005 2001<br />
Poultry 52 910 >28 000 256 440 2 591 732 68 000<br />
Pig 15 120 32 630 1 084 214<br />
Aquafeed 65 000 3 799 925 80 000 >120 000<br />
Production capacity 150 000 ? 7 000 000 ?<br />
Number <strong>of</strong> feed mills:<br />
<strong>for</strong>mal <strong>and</strong> (in<strong>for</strong>mal)<br />
8 17 (63) 12 (2) 32 (500+) 27 2 (?)<br />
* Produced by the <strong>for</strong>mal animal feed industry<br />
** Of the 54 large feed mills operating in 2001, only 32 industrial scale feed mills were functional in late 2005.<br />
Since early 2006 bird flu has had a serious impact on animal feed production (O. Fagbenro, pers. comm.,<br />
2005). The other 500+ feed producers are small-scale private operators <strong>and</strong> medium scale cooperatives. Over<br />
78 percent <strong>of</strong> Nigeria’s animal feed is made by the in<strong>for</strong>mal sector <strong>and</strong> 81.4 percent <strong>of</strong> aqua<strong>feeds</strong> is made by<br />
the in<strong>for</strong>mal sector. On a total combined basis aquafeed production by the <strong>for</strong>mal <strong>and</strong> in<strong>for</strong>mal sectors only<br />
account <strong>for</strong> about 30 percent <strong>of</strong> the total estimated annual use. The rest is farm-made<br />
Source: Shipton <strong>and</strong> Hecht (2005), country reviews <strong>and</strong> C. Mudenda, Dept. <strong>of</strong> Fisheries, Zambia (pers. comm.)
96<br />
<strong>Study</strong> <strong>and</strong> <strong>analysis</strong> <strong>of</strong> <strong>feeds</strong> <strong>and</strong> <strong>fertilizers</strong> <strong>for</strong> <strong>sustainable</strong> aquaculture development<br />
8. AQUAFEEDS<br />
Formulated aqua<strong>feeds</strong> are produced commercially only in Nigeria, Cameroon, Kenya,<br />
Zambia, Malawi <strong>and</strong> Ug<strong>and</strong>a. However, the country reviews reveal that the bulk <strong>of</strong> the<br />
aqua<strong>feeds</strong> are made on farm or by in<strong>for</strong>mal small-scale feed manufacturers (Table 15).<br />
In Nigeria it has been estimated that approximately 70 percent <strong>of</strong> fish <strong>feeds</strong> are farmmade<br />
(Fagbenro <strong>and</strong> Adebayo 2005). Similarly, while some aqua<strong>feeds</strong> are made by the<br />
<strong>for</strong>mal sector in Cameroon, Ghana, Ug<strong>and</strong>a <strong>and</strong> Malawi, most <strong>of</strong> the <strong>feeds</strong> used are<br />
compounded <strong>and</strong> manufactured on farms <strong>and</strong> made by small-scale producers. Formal<br />
<strong>and</strong> in<strong>for</strong>mal feed manufacturers in all countries have the capacity to make pellets <strong>of</strong><br />
some sort, although extruded floating pellets are only manufactured in South Africa<br />
<strong>and</strong> Nigeria.<br />
Formulated <strong>feeds</strong> <strong>for</strong> O. niloticus <strong>and</strong>/or C. gariepinus are manufactured in<br />
Cameroon, Nigeria, Kenya <strong>and</strong> Ug<strong>and</strong>a, <strong>and</strong> Zambia produces a <strong>for</strong>mulated pellet <strong>for</strong><br />
O. niloticus. No specific <strong>feeds</strong> <strong>for</strong> C. carpio are compounded. Given the general decline<br />
in the popularity <strong>and</strong> production <strong>of</strong> common carp throughout the region this is not<br />
surprising. Cameroon, Ug<strong>and</strong>a <strong>and</strong> Kenya also produce small quantities <strong>of</strong> flake <strong>feeds</strong><br />
<strong>for</strong> ornamental fish, which is used by hobbyists. Ornamental fish farmers all use farmmade<br />
<strong>feeds</strong>. Despite better FCR’s commercial <strong>for</strong>mulated pellets in most instances are<br />
uneconomical to most small-holder fish farmers because <strong>of</strong> the high unit cost, transport<br />
costs <strong>and</strong> the small-scale nature <strong>of</strong> their enterprises, hence are used only by medium<br />
<strong>and</strong> large scale operations.<br />
The <strong>for</strong>mulations in most countries vary according to seasonal availability <strong>and</strong><br />
price <strong>of</strong> ingredients. The cost <strong>of</strong> tilapia <strong>feeds</strong> (20–25 percent crude protein) range from<br />
US$225 to 599 per tonne (Table 16).<br />
Both Nigeria <strong>and</strong> Ug<strong>and</strong>a import <strong>feeds</strong> <strong>for</strong> rearing <strong>of</strong> juvenile clariid catfish from<br />
South Africa, the Netherl<strong>and</strong>s <strong>and</strong> the United States <strong>of</strong> America. However, it was not<br />
possible to obtain sufficiently accurate estimates <strong>of</strong> imported volumes.<br />
The country reports <strong>and</strong> the data above suggest that the status <strong>of</strong> the <strong>for</strong>mal animal<br />
feed industry in the target countries ranges from “just established” to “well established”.<br />
In Nigeria it is comparatively well established, though unregulated, while in Ug<strong>and</strong>a it is<br />
in a nascent phase. Fish <strong>feeds</strong> have only been made since around 1999–2000 in the target<br />
countries <strong>and</strong> the <strong>for</strong>mal aqua<strong>feeds</strong> industry is currently still in a <strong>for</strong>mative phase <strong>and</strong><br />
only reasonably well developed in Nigeria <strong>and</strong> to some extent in Zambia. Except <strong>for</strong><br />
Nigeria <strong>and</strong> South Africa, fish <strong>feeds</strong> in other countries are manufactured by the <strong>for</strong>mal<br />
animal feed industry on request. The reports however revealed that the in<strong>for</strong>mal aquafeed<br />
TABLE 15<br />
Production <strong>of</strong> aqua<strong>feeds</strong> (tonnes) used by the commercial aquaculture sector in target countries<br />
Year Formal In<strong>for</strong>mal <strong>and</strong><br />
farm-made <strong>feeds</strong>*<br />
Cameroon 2004 300 tonnes)<br />
Ghana 2005 Small pilot scale quantity produced<br />
by one company (2 tonnes /month)<br />
547<br />
Kenya<br />
Tilapia<br />
Trout<br />
2004<br />
59<br />
45<br />
Malawi 2005 620 156<br />
Nigeria<br />
2000/1<br />
Tilapia<br />
6 554<br />
14 258<br />
Catfish<br />
4 206 (plus 4 000 tonnes <strong>of</strong> imported feed)<br />
10 552<br />
Ug<strong>and</strong>a 2005
Review <strong>of</strong> <strong>feeds</strong> <strong>and</strong> <strong>fertilizers</strong> <strong>for</strong> <strong>sustainable</strong> aquaculture development in sub-Saharan Africa 97<br />
TABLE 16<br />
Retail price <strong>of</strong> fish pellets in target countries in US$ per tonne<br />
COUNTRY Year Trout Nile tilapia African catfish<br />
Cameroon 2006 381–424 943 (starter diet <strong>for</strong> catfish<br />
<strong>and</strong> tilapia)<br />
Ghana 520<br />
Kenya 2005 542 225<br />
Malawi NA NA NA<br />
Nigeria 2005 1 100* to 3 500 <strong>for</strong><br />
imported catfish starter<br />
feed<br />
Ug<strong>and</strong>a 2006 250 300 (35% crude protein,<br />
CP) to 6 100 <strong>for</strong> imported<br />
catfish starter feed<br />
Zambia 2006 599<br />
South<br />
Africa**<br />
2006 Pre-starter crumble 48%<br />
CP = 2 016<br />
Pre-starter 2mm 48%<br />
CP = 1 532<br />
Starter 45% CP = 1 035<br />
Grower 38% CP = 877<br />
Finisher 38% CP = 1 012<br />
Starter 41% CP = 879<br />
Grower 32% CP = 771<br />
Semi-intensive 25%<br />
CP = 645<br />
* = local grow out sinking pellet, ** = Aquanutro (Pty) Ltd. pricelist Feb 2006, NA=Not Applicable<br />
Source: country reviews<br />
Pre-starter 52% CP = 2016<br />
Starter 41% CP = 879<br />
Grower 35% CP = 715<br />
sector, consisting <strong>of</strong> small-scale feed manufacturers as well as on-farm facilities, provides<br />
the bulk (60 percent <strong>and</strong> above) <strong>of</strong> the requirements <strong>of</strong> commercial farms. This situation<br />
is simply a reflection <strong>of</strong> economies <strong>of</strong> scale. The dem<strong>and</strong> <strong>for</strong> <strong>for</strong>mulated aqua<strong>feeds</strong> in<br />
the target countries (except Nigeria) is relatively small <strong>and</strong> hence it is not economically<br />
viable <strong>for</strong> the <strong>for</strong>mal sector to invest in dedicated aquafeed lines. The presently available<br />
in<strong>for</strong>mation <strong>for</strong> Cameroon, Nigeria <strong>and</strong> Zambia suggests that only between 50 <strong>and</strong> 65<br />
percent <strong>of</strong> the <strong>for</strong>mal industry’s total capacity is being utilized, which means that the<br />
industry could <strong>and</strong> probably would be able to provide <strong>for</strong> the needs <strong>of</strong> the industry<br />
if <strong>and</strong> when the dem<strong>and</strong> reaches critical mass. For example, within the South African<br />
economic realm a feed mill would only invest in a dedicated feed line <strong>and</strong> associated<br />
costs (quality control, personnel etc) if the dem<strong>and</strong> <strong>for</strong> a specific feed exceeds 5 000<br />
tonnes per annum (L. de Wet, Aquanutro (Pty) Ltd, 2006, pers. comm.).<br />
It is clear from the country reports that the <strong>for</strong>mal aquafeed industry, in general, is<br />
still in a developing phase. In Nigeria the aquafeed industry only emerged in 1999/2000<br />
as a consequence <strong>of</strong> the upsurge <strong>of</strong> African catfish production <strong>and</strong> the resulting<br />
dem<strong>and</strong> <strong>for</strong> feed. In all countries were aqua<strong>feeds</strong> are produced there are problems with<br />
consistency <strong>of</strong> supply <strong>and</strong> quality. The percentage <strong>of</strong> fines may be as high as 50 percent<br />
(personal observation). In the absence <strong>of</strong> in<strong>for</strong>mation on capacity within the industry it<br />
is probably correct to assume, given the low dem<strong>and</strong> <strong>for</strong> aqua<strong>feeds</strong>, that manufacturers<br />
do not pay much attention to aquafeed quality control. It is perhaps <strong>for</strong> this reason that<br />
farmers in Nigeria, <strong>and</strong> elsewhere, still prefer to deal with small-scale feed producers,<br />
with whom they have established a feedback system with respect to fish per<strong>for</strong>mance<br />
<strong>and</strong> food conversion ratios. For example, in Nigeria 69.75 percent <strong>of</strong> the 35 570 tonnes<br />
<strong>of</strong> fish feed produced in 2001 was “farm-made” feed. Catfish farmers in Nigeria <strong>and</strong><br />
Ug<strong>and</strong>a now also import a starter diet <strong>for</strong> African catfish from South Africa, the<br />
Netherl<strong>and</strong>s <strong>and</strong> the United States <strong>of</strong> America. Nigeria imported just over 4 000 tonnes<br />
<strong>of</strong> catfish feed in 2004. It would appear that rapid steps, inclusive <strong>of</strong> <strong>for</strong>eign investment,<br />
are being taken in Nigeria to supply the 27 000 tonne dem<strong>and</strong> <strong>for</strong> catfish <strong>feeds</strong>.<br />
9. FARM-MADE FEED FORMULATIONS AND MANUFACTURING<br />
TECHNOLOGY<br />
The emergence <strong>of</strong> in<strong>for</strong>mal small-scale fish feed manufacturers in most target countries<br />
is extremely encouraging <strong>and</strong> suggests that commercial aquaculture in the region is<br />
exp<strong>and</strong>ing. Several farm-made feed <strong>for</strong>mulations as used in the region are shown in
98<br />
<strong>Study</strong> <strong>and</strong> <strong>analysis</strong> <strong>of</strong> <strong>feeds</strong> <strong>and</strong> <strong>fertilizers</strong> <strong>for</strong> <strong>sustainable</strong> aquaculture development<br />
Table 17. It was not possible to obtain specific feed <strong>for</strong>mulations from the <strong>for</strong>mal<br />
sector. Three basic <strong>feeds</strong> are manufactured, namely a starter diet <strong>for</strong> African catfish <strong>and</strong><br />
tilapia with a protein content <strong>of</strong> between 40 <strong>and</strong> 45 percent, grower <strong>for</strong>mulations <strong>for</strong><br />
tilapia (also used <strong>for</strong> carp <strong>and</strong> other species) with a protein content ranging from 20 to<br />
28 percent <strong>and</strong> a grower <strong>for</strong>mulation <strong>for</strong> African catfish with 32–40 percent CP. Several<br />
<strong>of</strong> the <strong>for</strong>mulations are based on research undertaken at local universities or research<br />
institutes or have been <strong>for</strong>mulated by farmers based on the nutritional requirements <strong>of</strong><br />
the dominant species.<br />
TABLE 17<br />
Some typical <strong>for</strong>mulations (percent), proximate composition <strong>and</strong> price <strong>of</strong> <strong>feeds</strong> made by smallscale<br />
feed producers <strong>and</strong>/or manufactured on-farm<br />
Diet<br />
Ingredient composition<br />
1 2 3 4 5 6 7 8 9 10 11 12 13<br />
Fishmeal 20 55 50 25 15 16 30 2 11 30<br />
Blood meal 10 48 13.5 5<br />
Carcass meal 15<br />
Bone meal 1 4<br />
Lake shrimp meal 34<br />
Soya meal 35 45 15<br />
Soya oilcake 13 15 5 3<br />
Cotton oilcake 15 15 5 9 2 4<br />
Groundnut oilcake 12 5 4 17<br />
Sunflower oilcake 30<br />
Copra cake 17<br />
Brewery waste 10 15 10<br />
Rice or wheat bran 20 15 2 66 8<br />
Wheat bran 25 50 22<br />
Maize bran 50 70 48 7 10.5<br />
Cocoa husk / C<strong>of</strong>fee pulp 10<br />
Layer dropping meal 15<br />
Maize 8 3 15 25 49<br />
Maize germ 15<br />
Pigeon pea meal 20<br />
Cassava flour 4<br />
Palm oil 2 2 5<br />
Vegetable oil 4 6<br />
Fish oil 6 4<br />
Starch/binder 2 2<br />
Vitamin & mineral<br />
premix<br />
Proximate <strong>analysis</strong><br />
2 5 5 1 3 3 0.5 2.5<br />
Crude protein (%) 28.5 34.5 43.3 20 40 38 25 37<br />
Crude lipid (%) 8 9 11 9 5 9.4<br />
Energy (kJ/g) ? 19.2 20.4<br />
Cost per tonne (US$) 381 943 148 547 227 153 176 270 425 600<br />
Retail price (US$/ tonnes) 519<br />
1 = Grower <strong>for</strong>mulation (CP 31%) <strong>for</strong> O. niloticus farming in fertilised ponds (Cameroon).<br />
2 = Grower <strong>for</strong>mulation <strong>for</strong> intensive O. niloticus farming (Cameroon).<br />
3 = Starter <strong>for</strong>mulation (CP 45%) <strong>for</strong> C. gariepinus <strong>and</strong> O. niloticus (Cameroon).<br />
4 = Grower <strong>for</strong>mulation <strong>for</strong> C.carpio <strong>and</strong> O. mossambicus in fertilised ponds (Malawi).<br />
5 = Grower pellet <strong>for</strong> C. gariepinus (Kenya).<br />
6 = Grower pellet <strong>for</strong> C. gariepinus (Nigeria).<br />
7 = Grower pellet <strong>for</strong> O. niloticus (Nigeria).<br />
8 = Tilapia grower pellets (Kenya).<br />
9 = Grower pellet <strong>for</strong> C. gariepinus (Kenya).<br />
10 = Farm-made grower <strong>for</strong>mulation 1 (Ug<strong>and</strong>a).<br />
11 = Farmer made C. gariepinus grower <strong>for</strong>mulation (Ug<strong>and</strong>a)<br />
12 = Industrial pellet <strong>for</strong>mulation <strong>for</strong> O. niloticus <strong>and</strong> C. gariepinus polyculture (Cameroon)<br />
13 = Catfish, carp <strong>and</strong> tilapia fingerling <strong>and</strong> broodstock <strong>for</strong>mulation (Malawi)<br />
Source: country reviews
Review <strong>of</strong> <strong>feeds</strong> <strong>and</strong> <strong>fertilizers</strong> <strong>for</strong> <strong>sustainable</strong> aquaculture development in sub-Saharan Africa 99<br />
Several different kinds <strong>of</strong> farm-made <strong>feeds</strong> are produced, ranging from <strong>for</strong>mulated<br />
mixes fed to the fish in punctured bags (adapted from India) as practised in Malawi,<br />
to moist feed cakes <strong>and</strong> dry pellets. Preparation <strong>and</strong> manufacturing technologies<br />
are simple. The raw materials<br />
are milled <strong>and</strong> mixed at predetermined<br />
ratios. Ingredients<br />
are mixed by h<strong>and</strong> or mechanical<br />
devices such as cement mixers.<br />
Some <strong>of</strong> the ingredients such as<br />
soybean meal <strong>and</strong> maize meal<br />
are precooked (to eliminate antinutritional<br />
factors where these<br />
exist, to improve digestibility<br />
<strong>and</strong> to improve binding<br />
capacity). Warm or hot water<br />
is added to the final mixture<br />
to make a firm dough. Pellets<br />
are h<strong>and</strong> made by extruding the<br />
dough through a meat-mincer or<br />
pasta maker (h<strong>and</strong> or electrically<br />
operated). The “spaghetti’s” are<br />
then sun dried or dried in locally<br />
manufactured driers <strong>and</strong> cut or<br />
crumbled into appropriate sizes.<br />
In some instances farmers order<br />
their preferred <strong>for</strong>mulation in<br />
milled <strong>for</strong>m <strong>and</strong> extrude their<br />
own pellets on-farm. Figures<br />
14 to 17 illustrate some <strong>of</strong> the<br />
on-farm feed manufacturing<br />
technologies <strong>and</strong> products.<br />
There are several common<br />
problems in the production <strong>of</strong><br />
farm-made <strong>feeds</strong>. Many smallscale<br />
manufacturers throughout<br />
the region do not use an antioxidant,<br />
except in Nigeria<br />
were producers add Sodium<br />
propionate at an inclusion level<br />
<strong>of</strong> 0.1 percent as an anti-mould<br />
agent. Storage time is there<strong>for</strong>e<br />
reduced <strong>and</strong> the incidence <strong>of</strong><br />
spoilage is high. However, the<br />
main problem associated with<br />
pellets produced by smallscale<br />
producers, is the high<br />
percentage <strong>of</strong> fines resulting in<br />
a high degree <strong>of</strong> wastage <strong>and</strong><br />
poor FCRs. Catfish farmers in<br />
Nigeria report FCRs between 2<br />
<strong>and</strong> 3:1 <strong>and</strong> above in comparison<br />
to 0.95 using imported floating<br />
pellets. However, the cost <strong>of</strong> the<br />
FIGURE 14<br />
Cooking feed ingredients in Malawi (left) <strong>and</strong> locally made feed<br />
in mixer in Kenya (right)<br />
FIGURE 15<br />
On farm pelleting in Nigeria (left) <strong>and</strong> pellet plunger <strong>and</strong> h<strong>and</strong>ful<br />
<strong>of</strong> dried pellets (right)<br />
FIGURE 16<br />
Sun drying fish pellets (left) <strong>and</strong> (right) wind tunnel feed dryer<br />
FIGURE 17<br />
Home made aquarium fish flakes in Cameroon (left) <strong>and</strong> (right)<br />
farm-made pellets in Nigeria<br />
COURTESY OF M. UOMIZO AND M. MBUGUA<br />
COURTESY OF O.A. AYINLA<br />
COURTESY OF V. POUOMOGNE AND R. BRUMMETT<br />
COURTESY OF T. MBONGO AND OF O.A. AYINLA
100<br />
<strong>Study</strong> <strong>and</strong> <strong>analysis</strong> <strong>of</strong> <strong>feeds</strong> <strong>and</strong> <strong>fertilizers</strong> <strong>for</strong> <strong>sustainable</strong> aquaculture development<br />
TABLE 18<br />
Maximum recommended inclusion rates <strong>of</strong> unconventional feed ingredients<br />
Ingredient Maximum<br />
inclusion rate (%)<br />
Replacement Species<br />
Groundnut cake 25<br />
Palm kernel cake 10–15<br />
Cottonseed cake 20–30<br />
Jackbean 10–30 Soybean meal C. gariepinus<br />
Winged bean 50 Fishmeal C. gariepinus<br />
Poultry <strong>of</strong>fal 10<br />
Sorghum 50<br />
Cassava 40<br />
Sweet potato 20<br />
Fish silage 40 Fishmeal C. gariepinus<br />
Shrimp head meal 10 Fishmeal C. gariepinus<br />
Macadamia presscake 50 Protein source O. niloticus<br />
Poultry by-product silage 15–30 Protein source C. gariepinus<br />
Duckweed 15 Any carbohydrate source Tilapia<br />
Corn oil 10<br />
Soybean 10<br />
Palm oil 10<br />
Periwinkle shell 7.5<br />
Limestone 5<br />
Malt dust 2<br />
C<strong>of</strong>fee bean pulp 20<br />
Cacao husk 20<br />
Source: see Ayinla (2007) <strong>and</strong> Pouomogne (2007) <strong>for</strong> detail <strong>and</strong> data sources<br />
imported floating pellets <strong>for</strong> grow-out is uneconomical <strong>and</strong> farmers now only use the<br />
imported starter pellets <strong>for</strong> a short period be<strong>for</strong>e switching to farm-made <strong>feeds</strong>.<br />
Moreover, small-scale feed producers <strong>and</strong> commercial fish farms most <strong>of</strong>ten do not<br />
have adequately sized <strong>and</strong> pest pro<strong>of</strong> storage facility. This prohibits bulk purchase <strong>of</strong><br />
raw material when prices are low.<br />
The price <strong>of</strong> farm-made <strong>feeds</strong> is generally lower than the products from the <strong>for</strong>mal<br />
sector (e.g. US$154 to 750 per tonne <strong>for</strong> farm-made <strong>feeds</strong> vs. US$227 to 1 110 per<br />
tonne <strong>for</strong> industrially made pellets (excluding imported pellets) (see Tables 16 <strong>and</strong> 17).<br />
Depending on feeding practices FCRs <strong>of</strong> 1.1:1 have been reported <strong>for</strong> some farm-made<br />
<strong>feeds</strong> in Ug<strong>and</strong>a <strong>and</strong> Kenya. Moreover, as mentioned above, farmers who make their<br />
own <strong>feeds</strong> are normally also in a position to purchase raw materials directly from<br />
producers, so that the middleman is cut out, which results in significant savings. The<br />
reported average FCR <strong>for</strong> farm-made <strong>feeds</strong> is around 2:1 (range 0.95 to 3.8:1), although<br />
upper level estimates by the author are in the region <strong>of</strong> 8:1.<br />
There has been an intense research focus on the use <strong>of</strong> alternative ingredients <strong>and</strong><br />
agricultural by-products to replace fishmeal in fish <strong>feeds</strong>, optimal inclusion rates<br />
<strong>and</strong> feed <strong>for</strong>mulation, particularly in Nigeria, <strong>and</strong> to some extent in Cameroon <strong>and</strong><br />
Malawi (see country reports). Moreover, there is an excellent body <strong>of</strong> knowledge with<br />
respect to the proximate composition <strong>of</strong> most non-conventional ingredients that may<br />
be used in fish <strong>feeds</strong> (see country reports). Table 18 summarizes the recommended<br />
maximum inclusion rates <strong>for</strong> some <strong>of</strong> these ingredients. For many years this research<br />
was considered to have little impact on the development <strong>of</strong> commercial aquaculture in<br />
the region. However, with a growing need <strong>for</strong> fish <strong>and</strong> a rapidly developing commercial<br />
aquaculture sector this has changed <strong>and</strong> many non-conventional ingredients, depending<br />
on price, are now used by small <strong>and</strong> medium scale in<strong>for</strong>mal feed producers.<br />
10. FEEDING PRACTICES<br />
Feeding practices are as diverse as the <strong>feeds</strong> used in the region. The most commonly<br />
used feed by non-commercial farmers is maize or rice bran, which is spread over<br />
the water surface. This practise is wasteful as any breeze will blow the feed into the
Review <strong>of</strong> <strong>feeds</strong> <strong>and</strong> <strong>fertilizers</strong> <strong>for</strong> <strong>sustainable</strong> aquaculture development in sub-Saharan Africa 101<br />
grassy verges <strong>of</strong> the ponds, where it is unavailable.<br />
Some farmers have realised this <strong>and</strong> use floating rings<br />
made <strong>of</strong> grass that are attached to a stake. The bran is<br />
placed into the rings to contain it <strong>and</strong> to ensure that<br />
feeding is optimised. Some farmers also place grass<br />
ropes over the water surface area in a square pattern<br />
<strong>and</strong> depending on wind direction will place the feed<br />
(bran or vegetable leaves) into a pre-selected square<br />
(Figure 18). Vegetable matter (where reported in the<br />
country reviews) is generally not chopped prior to<br />
feeding.<br />
Though farmers are aware <strong>of</strong> the importance <strong>of</strong><br />
feeding their fish (Hecht, 2006), it would appear that<br />
non-commercial farmers feed their fish less than once<br />
a day <strong>and</strong> with an inadequate ration <strong>and</strong> many rely<br />
FIGURE 18<br />
Floating grass pond divisions <strong>for</strong> improved<br />
feeding with leaves or bran<br />
entirely on natural pond productivity. To a great extent this is a consequence <strong>of</strong> the<br />
financial circumstances <strong>of</strong> the farmer.<br />
In all instances fish on commercial farms are fed regularly at fixed rations <strong>and</strong><br />
schedules that are adjusted according to average fish weight. Feeding frequencies range<br />
from 2 times per day in earthen ponds to 6 times per day <strong>for</strong> juvenile African catfish<br />
under high density tank culture conditions, to 1 or 2 times daily during grow-out.<br />
Feeding is done mainly by h<strong>and</strong>, except <strong>for</strong> some experimental trials using automatic<br />
feeders or dem<strong>and</strong> feeders in high density catfish culture in tanks (Nigeria) <strong>and</strong> tilapia<br />
cage culture (Ghana <strong>and</strong> Malawi).<br />
Most farmers feed dry pellets or a <strong>for</strong>mulated mash to juvenile tilapia. However,<br />
several farmers use <strong>for</strong>mulated wet dough, in some instances bound with sugar<br />
cane molasses. The dough is <strong>of</strong>fered to the juvenile fish in baseball size portions on<br />
submerged feeding trays. According to one <strong>of</strong> these farmers this method allows <strong>for</strong><br />
better visual inspection <strong>and</strong> observation <strong>of</strong> feeding intensity <strong>and</strong> fish health <strong>and</strong> reduces<br />
feed wastage (S. Pala, Aquafarms, Malawi, pers. comm.). The feed balls are made every<br />
second day.<br />
11. PROBLEMS AND CONSTRAINTS<br />
Some <strong>of</strong> the problems <strong>and</strong> constraints facing feed manufacturers in general <strong>and</strong> the<br />
farmers in particular have already been mentioned briefly in the preceding sections.<br />
The following bullets summarize the general constraints as expressed in the country<br />
reviews:<br />
• variable ingredient quality <strong>and</strong> proximate composition;<br />
• general shortage <strong>of</strong> fishmeal <strong>and</strong> within country variability in supply;<br />
• inter-annual variability in supply <strong>of</strong> raw materials;<br />
• competition <strong>for</strong> raw materials <strong>for</strong> human nutrition (e.g. Rastrineobola argentea<br />
fishmeal in Ug<strong>and</strong>a <strong>and</strong> Kenya) <strong>and</strong> the chicken feed industry (e.g. maize, brans,<br />
fishmeal, oilseed cake);<br />
• farmers in rural areas have poor access to <strong>feeds</strong> <strong>and</strong> <strong>fertilizers</strong> (cost <strong>of</strong> transport<br />
increases price beyond their means);<br />
• small scale feed manufacturers are limited by their ability to store raw materials<br />
(pest control <strong>and</strong> warehouse space);<br />
• poor <strong>and</strong> careless packaging <strong>of</strong> manufactured <strong>feeds</strong>;<br />
• seasonal fluctuations in commodity prices (related to agricultural calendar);<br />
• high level <strong>of</strong> fines in dry pellets;<br />
• poor feed conversion ratios <strong>of</strong> some farm-made <strong>feeds</strong> (>4:1);<br />
• high rate <strong>of</strong> spoilage <strong>of</strong> raw materials <strong>and</strong> <strong>feeds</strong> (mould, insects <strong>and</strong> rodent<br />
faeces);
102<br />
<strong>Study</strong> <strong>and</strong> <strong>analysis</strong> <strong>of</strong> <strong>feeds</strong> <strong>and</strong> <strong>fertilizers</strong> <strong>for</strong> <strong>sustainable</strong> aquaculture development<br />
• high transport costs (US$0.35 to US$1.00 per km <strong>for</strong> small loads less than<br />
1 tonne) (e.g. transport adds minimum <strong>of</strong> 25–30 percent to cost <strong>of</strong> all imported<br />
goods in l<strong>and</strong>locked countries);<br />
• high duty on imported <strong>feeds</strong> <strong>and</strong> raw materials;<br />
• lengthy customs clearance <strong>of</strong> raw material;<br />
• lack <strong>of</strong> af<strong>for</strong>dable industrially manufactured <strong>feeds</strong>;<br />
• poor quality <strong>of</strong> industrially manufactured <strong>feeds</strong> <strong>and</strong> lack <strong>of</strong> quality control;<br />
• lack <strong>of</strong> adequate feed manufacturing equipment (symptom <strong>of</strong> low dem<strong>and</strong> <strong>and</strong><br />
investor hesitancy);<br />
• limited <strong>and</strong> inadequate funding <strong>for</strong> research;<br />
• operating within poor governance structures; <strong>and</strong><br />
• lack <strong>of</strong> expertise in feed manufacturing technologies.<br />
While several <strong>of</strong> the constraints are uncontrollable factors (e.g. inter annual variability<br />
in supply <strong>and</strong> price <strong>of</strong> raw materials) many <strong>of</strong> them are typical <strong>of</strong> poor quality control<br />
in an unregulated industry, where the end user is to a large extent at the mercy <strong>of</strong> the<br />
supplier. The upswing in the number <strong>of</strong> small-scale feed producers in Nigeria <strong>and</strong><br />
Cameroon is there<strong>for</strong>e not entirely surprising since it allows <strong>for</strong> better quality control<br />
<strong>and</strong> feedback. In most countries, except perhaps in Nigeria, the commercial aquaculture<br />
sector will <strong>for</strong> the <strong>for</strong>eseeable future be dependent on small-scale feed producers <strong>and</strong><br />
farm-made <strong>feeds</strong>. The situation will only change if <strong>and</strong> when there is a critical mass<br />
<strong>of</strong> dem<strong>and</strong> <strong>for</strong> high quality industrially manufactured <strong>feeds</strong> such that industry would<br />
risk the initially high investment costs. The situation however provides competitive<br />
advantages to small-scale operators to gear up <strong>and</strong> grow with the aquaculture sector.<br />
Given the growth <strong>of</strong> the aquaculture sector in many SSA countries governments must<br />
be sensitised as to the potential <strong>of</strong> aquaculture <strong>and</strong> the need <strong>for</strong> incentives to stimulate<br />
the aquafeed industry <strong>and</strong> <strong>of</strong> the need <strong>for</strong> quality control measures. Moreover, the high<br />
cost <strong>of</strong> imported <strong>feeds</strong> may in fact be inhibiting the growth <strong>and</strong> development <strong>of</strong> the<br />
catfish farming sector.<br />
Many <strong>of</strong> the constraints listed above are issues related to economies <strong>of</strong> scale. For<br />
example, small-scale feed producers will only invest in improved <strong>and</strong> larger storage<br />
facility if <strong>and</strong> when the dem<strong>and</strong> <strong>for</strong> feed exceeds a certain threshold. Governments<br />
in all countries should <strong>and</strong> must play a more facilitating role, such as reducing or<br />
abolishing import duty on raw materials <strong>and</strong> improving the efficiency <strong>of</strong> customs <strong>and</strong><br />
excise <strong>for</strong> speedy release <strong>of</strong> perishable goods. Policy on these issues is being revised in<br />
Cameroon, Nigeria, Malawi, Kenya <strong>and</strong> Ug<strong>and</strong>a.<br />
There is no doubt that there is lack <strong>of</strong> capacity in feed technology throughout<br />
the region. Many, if not most, donor funded projects in the past have focused on<br />
fish nutrition in some or other way. However, to our knowledge there has not been<br />
one project that has focused specifically on feed technology. There is a serious need<br />
to address this shortcoming by the provision <strong>of</strong> training opportunities <strong>and</strong> most<br />
importantly by the inclusion <strong>of</strong> feed technologists in donor funded aquaculture<br />
development programmes. In essence, aquaculture in SSA has now developed to stage<br />
where it is no longer appropriate <strong>for</strong> donor countries to send general aquaculture<br />
practitioners to partner countries. The time has arrived <strong>for</strong> deploying specialists to<br />
foster the growth <strong>of</strong> the sector.<br />
12. LABOUR COST<br />
Labour requirements are dictated by the size <strong>of</strong> the farm, intensity <strong>of</strong> production <strong>and</strong><br />
the level <strong>of</strong> management employed. The average daily wage in the target countries is<br />
US$1.10 per day (Range US$0.75 to US$2.70). From the data presented in Table 19<br />
it can be concluded that the cost <strong>of</strong> labour in all countries is low in comparison to<br />
the rest <strong>of</strong> the world. It was un<strong>for</strong>tunately not possible to calculate a realistic figure<br />
<strong>for</strong> labour cost as a proportion <strong>of</strong> total production cost per tonne <strong>of</strong> fish produced.
Review <strong>of</strong> <strong>feeds</strong> <strong>and</strong> <strong>fertilizers</strong> <strong>for</strong> <strong>sustainable</strong> aquaculture development in sub-Saharan Africa 103<br />
However, as mentioned elsewhere the<br />
cost <strong>of</strong> labour, despite the low daily<br />
wage structure, is prohibitive to most<br />
small-holder farmers <strong>and</strong> restricts<br />
their on-farm activities.<br />
TABLE 19<br />
Labour requirements<br />
Farm size/number <strong>of</strong> ponds<br />
(Max. pond surface area)<br />
Scale <strong>of</strong> intensity Labour units<br />
required<br />
1–4 ponds (0.1ha) Extensive 1<br />
1–2 ponds (0.2ha) Semi-intensive 2<br />
3–10 ponds (1ha) Semi-intensive 4–8<br />
Tank or raceway (25 tonnes/year) Intensive 8<br />
Tank or raceway (50 tonnes/year) Intensive 12<br />
13. COMMENTS ON RESOURCE<br />
AVAILABILITY AND EXPANSION Source: Country reviews <strong>and</strong> interviews with farmers<br />
OF THE AQUACULTURE<br />
INDUSTRY<br />
In a reassessment <strong>of</strong> Kapetsky’s (1994) strategic assessment <strong>of</strong> warm water fish farming<br />
in Africa, Aguilar Manjarrez <strong>and</strong> Nath (1998) showed that 50–76 percent <strong>of</strong> Africa’s<br />
l<strong>and</strong>, despite several constraints, has the highest pond culture yield range potential <strong>for</strong><br />
Nile tilapia, African catfish <strong>and</strong> common carp. Because <strong>of</strong> environmental tolerances<br />
the spatial distribution <strong>of</strong> carp culture potential was found to be greater than <strong>for</strong> Nile<br />
tilapia <strong>and</strong> African catfish. However, carp culture throughout the region is declining,<br />
probably as a consequence <strong>of</strong> consumer preference <strong>and</strong> higher returns with the other<br />
two species. All countries, except Malawi, Ug<strong>and</strong>a <strong>and</strong> Zambia were shown to have<br />
adequate resources <strong>for</strong> the expansion <strong>of</strong> pond based aquaculture. The potential in<br />
Zambia is theoretically constrained by the high proportion <strong>of</strong> l<strong>and</strong> incorporated as<br />
protected areas (>30 percent <strong>of</strong> surface area), while the potential <strong>for</strong> pond aquaculture<br />
in Malawi <strong>and</strong> Ug<strong>and</strong>a is constrained by lacustrine environments <strong>and</strong> in the case <strong>of</strong><br />
Malawi the high population density in the most suitable areas. The potential <strong>of</strong> cage<br />
culture was however not explored by Aguilar Manjarrez <strong>and</strong> Nath (1998). Given<br />
the success <strong>of</strong> Nile tilapia cage culture in Lake Kariba highlights the opportunities<br />
presented by the African Great Lakes in Ug<strong>and</strong>a, Kenya, Zambia <strong>and</strong> Malawi, as well<br />
as in other lakes <strong>and</strong> large man-made impoundments. Aguilar Manjarrez <strong>and</strong> Nath (op<br />
cit.) also considered urban areas as a constraint <strong>for</strong> aquaculture development. However,<br />
the notion that urban areas constrain aquaculture development has recently been<br />
challenged by Costa-Pierce et al. (2005) <strong>and</strong> indeed urban <strong>and</strong> peri-urban aquaculture<br />
is perhaps the most rapidly exp<strong>and</strong>ing sector in Cameroon, Ghana, Nigeria <strong>and</strong><br />
Ug<strong>and</strong>a (Rana et al., 2005). Moreover, Aguilar Manjarrez <strong>and</strong> Nath (1998) suggest that<br />
all the countries considered in this review (see country reviews <strong>for</strong> details) have the<br />
required environmental conditions, livestock waste <strong>and</strong> agricultural by-products <strong>for</strong><br />
the expansion <strong>of</strong> the sector. Aguilar Manjarrez <strong>and</strong> Nath’s (1998) general conclusions<br />
are discussed below in relation to current observations <strong>and</strong> the projected expansion <strong>of</strong><br />
the sector.<br />
It is clear from the country reviews that there are sufficient gross quantities <strong>of</strong> animal<br />
manure in each <strong>of</strong> the target countries to satisfy the needs <strong>of</strong> aquaculture. However, as<br />
mentioned previously, an increase in production by small-scale farmers will continue<br />
to be constrained in most instances by the small number <strong>of</strong> farm animals <strong>and</strong> the cost<br />
<strong>of</strong> transporting manure from source to farm. The problem <strong>of</strong> manure availability facing<br />
small-holder fish farmers cannot <strong>and</strong> should not be considered on a country basis.<br />
The problem can only be addressed at the district level, where the requirements can<br />
be realistically quantified by the responsible lead agency or by NGOs <strong>and</strong> <strong>for</strong> them<br />
to then devise the most appropriate <strong>and</strong> cost effective manner <strong>of</strong> delivering manure to<br />
communities in conjunction with farmers.<br />
The commercial sector in all target countries appears to be split, in various<br />
proportions, between st<strong>and</strong> alone fish farms <strong>and</strong> those in which aquaculture is<br />
integrated with other animal husb<strong>and</strong>ry or agricultural activities, e.g. cattle, chicken,<br />
pig or grain farming. Under such conditions the availability <strong>of</strong> manure is obviously not<br />
a problem. However, commercial st<strong>and</strong>-alone pond fish farms <strong>of</strong> whatever scale that<br />
have to source manure from chicken producers or cattle farms may face competition
104<br />
<strong>Study</strong> <strong>and</strong> <strong>analysis</strong> <strong>of</strong> <strong>feeds</strong> <strong>and</strong> <strong>fertilizers</strong> <strong>for</strong> <strong>sustainable</strong> aquaculture development<br />
from other users <strong>of</strong> manure. However, the current average price <strong>of</strong> chicken <strong>and</strong> cattle<br />
manure is low particularly in Malawi, Nigeria, Ug<strong>and</strong>a <strong>and</strong> Zambia, suggesting that<br />
access to the resource should not be problematic in the short to medium term.<br />
Inorganic <strong>fertilizers</strong> are rarely used to enhance pond productivity in the target<br />
countries. This may be related to the high price <strong>and</strong> the general scarcity <strong>of</strong> <strong>fertilizers</strong><br />
in all countries.<br />
During the last five years (see Table 3) aquaculture production has increased<br />
significantly in most target countries <strong>and</strong> as mentioned previously approximately<br />
70 percent is produced by the commercial sector. Because the vast majority <strong>of</strong><br />
“non-commercial” fish farmers use farm by-products <strong>and</strong> / or rely on natural pond<br />
productivity <strong>for</strong> fish production, the projected future requirements <strong>for</strong> fish <strong>feeds</strong> has<br />
been calculated <strong>for</strong> the commercial sector only. The projections are illustrated in Table<br />
20 <strong>and</strong> are discussed on a per country basis below. The estimation procedures did not<br />
consider the impacts <strong>of</strong> future commodity prices (particularly fishmeal <strong>and</strong> oil seed<br />
cakes) as well as factors that could have a negatively impact on production cost (e.g.<br />
international oil prices, inflation <strong>and</strong> cost <strong>of</strong> electricity) on the dem<strong>and</strong> <strong>for</strong> <strong>feeds</strong>.<br />
According to FAO statistics the aquaculture sector in Cameroon over the last five<br />
years has grown by over 112 percent per annum. Clearly, the sector is making rapid<br />
advances <strong>and</strong> examples set by some commercial farmers are being copied in increasing<br />
numbers by others, particularly in peri-urban areas. The manufacture <strong>of</strong> aqua<strong>feeds</strong> is<br />
a recent initiative in Cameroon <strong>and</strong> only 80–90 tonnes were produced in 2005. The<br />
current animal feed production capacity is around 150 000 tonnes <strong>and</strong> only 50 percent<br />
<strong>of</strong> this capacity is presently utilized. At the moment most commercial farmers use<br />
farm-made <strong>feeds</strong>. Agricultural products <strong>and</strong> by-products used <strong>for</strong> the manufacture <strong>of</strong><br />
animal <strong>feeds</strong>, except fishmeal, are readily available <strong>and</strong> the <strong>for</strong>mal feed industry has the<br />
capacity to provide <strong>feeds</strong> under any one <strong>of</strong> the three growth scenarios.<br />
In Ghana the sector has not shown the same high growth rate as in Cameroon.<br />
Commercial aquaculture has only emerged during the last five years but is already<br />
contributing between 30 <strong>and</strong> 35 percent <strong>of</strong> total production. Only small quantities<br />
<strong>of</strong> fish <strong>feeds</strong> are made on a pilot scale level. (ca. 2 tonnes per month). The country<br />
has a seemingly well established animal feed industry (though no quantitative data<br />
were provided). Fishmeal is mainly imported. The report by Abban (2005) suggests<br />
that Ghana has adequate oilseed cake resources to supply <strong>and</strong> future dem<strong>and</strong> by<br />
aquaculture. As in other countries most commercial farmers at this stage use farmmade<br />
<strong>feeds</strong> <strong>and</strong> their feed production capacity exceeds their requirements.<br />
In 2005, Kenya produced just over 100 tonnes <strong>of</strong> compounded fish feed <strong>for</strong> trout<br />
<strong>and</strong> tilapia. The country’s feed industry is, within the group <strong>of</strong> countries examined,<br />
the second largest after Nigeria, producing over 450 000 tonnes. The animal feed<br />
industry in Kenya is relatively new, having been developed during the past 10 years. As<br />
elsewhere, most commercial farmers use farm-made <strong>feeds</strong> or <strong>feeds</strong> produced by smallscale<br />
feed producers. Kenya has adequate agricultural by-product resources though<br />
the competition <strong>for</strong> locally produced fishmeal is intense, as it is also used <strong>for</strong> human<br />
consumption <strong>and</strong> other animal <strong>feeds</strong>. Fishmeal supply, currently st<strong>and</strong>ing at around<br />
30 000 tonnes per annum, is considered to be the major constraint facing the animal<br />
feed industry as a whole. Even if aquaculture grows from its current base at 15 percent<br />
per annum until 2020 the industry would require just under 2 percent <strong>of</strong> the current<br />
animal feed production capacity. The Association <strong>of</strong> Kenya Feed Manufacturers was<br />
<strong>for</strong>med in 2003 <strong>and</strong> functions as the industry’s voice to government.<br />
After many false starts, commercial aquaculture in Malawi emerged in 2003. The<br />
largest cage culture operation in the SSA region is currently being developed in Lake<br />
Malawi, using indigenous tilapia, O. karongae <strong>and</strong> O.shiranus The company will<br />
probably reach its production target <strong>of</strong> 3 000 tonnes in 3–5 years. At a conservative<br />
FCR <strong>of</strong> 1.5:1 this single operation (excluding the requirements <strong>for</strong> broodstock
Review <strong>of</strong> <strong>feeds</strong> <strong>and</strong> <strong>fertilizers</strong> <strong>for</strong> <strong>sustainable</strong> aquaculture development in sub-Saharan Africa 105<br />
maintenance <strong>and</strong> fingerling production) will require some 4 500 tonnes <strong>of</strong> feed per<br />
annum. If this venture is successful then others will most certainly follow, which will<br />
increase the dem<strong>and</strong> <strong>for</strong> pelleted <strong>feeds</strong> substantially. The farm has installed a feed mill<br />
<strong>and</strong> pelletizer but will probably not be able to, or want to, manufacture its own <strong>feeds</strong><br />
at full production. The Malawian scenario is different from that in other countries in<br />
that the establishment <strong>of</strong> a single operation within a short time will create a dem<strong>and</strong><br />
<strong>for</strong> a substantial quantity <strong>of</strong> <strong>for</strong>mulated pellets. Though there are about 12 animal feed<br />
producers the animal feed industry in Malawi is small, though fairly well established. As<br />
elsewhere it is heavily reliant on imports (maize, oilseed cake <strong>and</strong> all fishmeal) <strong>and</strong> as in<br />
the other target countries produces mainly poultry feed. In 2005 the industry produced<br />
approximately 600 tonnes <strong>of</strong> <strong>for</strong>mulated milled product <strong>for</strong> fish pellets. Amongst other<br />
variables, the success <strong>of</strong> the cage culture operation in Malawi there<strong>for</strong>e also hinges<br />
on co-operation with the <strong>for</strong>mal feed industry. There is no animal feed association in<br />
Malawi <strong>and</strong> all companies operate independently <strong>of</strong> each other, however the Malawi<br />
Bureau <strong>of</strong> St<strong>and</strong>ards regulates feed quality in the country. A call has recently been made<br />
to improve the regulatory environment <strong>of</strong> the animal feed industry in Malawi.<br />
Nigeria has shown the most dramatic increase in fish production, from 30 677<br />
tonnes in 2003 to 43 950 tonnes in 2004, mainly as a result <strong>of</strong> significant increases in<br />
African catfish <strong>and</strong> Nile tilapia production. Nigeria has the largest animal feed industry<br />
in SSA after South Africa, producing around 4 million tonnes per annum. Currently<br />
there are 32 functional commercial scale animal feed mills (O. Fagbenro, pers. comm.<br />
2006). Over 35 000 tonnes <strong>of</strong> aquafeed was produced in 2003, <strong>of</strong> which approximately<br />
60–80 percent was farm-made or produced by small-scale feed producers. Oilseed cake<br />
<strong>and</strong> other primary agricultural products <strong>and</strong> by-products <strong>for</strong> animal <strong>feeds</strong> in Nigeria<br />
are in short supply <strong>and</strong> the country is reliant on imports <strong>of</strong> oilseed cake, soybean <strong>and</strong><br />
fishmeal. An adequate supply <strong>of</strong> fishmeal is recognised as the major current <strong>and</strong> future<br />
constraint, unless the country’s unexploited lanternfish resources are utilized. Only<br />
13 percent <strong>of</strong> its annual fishmeal consumption was produced locally in 2004, while the<br />
bulk <strong>of</strong> the 2004 dem<strong>and</strong> (67 500 tonnes) was imported. All feed additives in Nigeria<br />
(as well as in other countries) are imported. However, Nigeria has the capacity <strong>and</strong><br />
expertise to produce the required quantity <strong>of</strong> feed under any <strong>of</strong> the projected growth<br />
scenarios. Several <strong>for</strong>eign companies are currently investing in aquafeed mills. Nigeria<br />
<strong>and</strong> Ug<strong>and</strong>a are currently the only countries that import fish <strong>feeds</strong>, mainly from South<br />
Africa <strong>and</strong> specifically <strong>for</strong> early juvenile rearing <strong>of</strong> African catfish under intensive<br />
farming conditions. There is no animal feed manufacturing association in Nigeria<br />
<strong>and</strong> the industry is unregulated <strong>and</strong> not controlled by any organ <strong>of</strong> state with respect<br />
to quality <strong>and</strong> bio-safety. Given that the animal feed industry is only operating at<br />
56 percent efficiency (Fagbenro <strong>and</strong> Adebayo 2005) it is well placed to provide the<br />
needs <strong>of</strong> the aquaculture sector in future, though its participation in meeting the<br />
aquafeed requirements, as in other countries, depends entirely on the quality <strong>of</strong> the<br />
product it can produce.<br />
Aquaculture in Ug<strong>and</strong>a is growing at a rapid rate. The animal feed industry in<br />
Ug<strong>and</strong>a was started around 1994 <strong>and</strong> currently produces around 80 000 tonnes. The<br />
country is well endowed with natural resources <strong>and</strong> except <strong>for</strong> soybean produces<br />
adequate quantities <strong>of</strong> produce <strong>and</strong> by-products that are readily available to the feed<br />
industry. It has a reduction fishery <strong>of</strong> some 50 000 tonnes <strong>and</strong> fishmeal is also made<br />
from the <strong>of</strong>fal <strong>of</strong> the Nile perch fishery in Lake Victoria. However, because no fishmeal<br />
is imported the competition <strong>for</strong> this commodity is intense <strong>and</strong> has serious negative<br />
social implications in that the fish previously used <strong>for</strong> human consumption is now used<br />
mainly <strong>for</strong> fishmeal. Aquafeed production is sporadic <strong>and</strong> is only produced on request<br />
<strong>and</strong> the quality is poor. Most commercial farmers make their own <strong>feeds</strong> or purchase it<br />
from in<strong>for</strong>mal feed producers. Ug<strong>and</strong>a has developed a policy <strong>for</strong> animal <strong>feeds</strong> as well<br />
as a draft bill to safeguard consumers <strong>and</strong> to ensure feed quality.
106<br />
<strong>Study</strong> <strong>and</strong> <strong>analysis</strong> <strong>of</strong> <strong>feeds</strong> <strong>and</strong> <strong>fertilizers</strong> <strong>for</strong> <strong>sustainable</strong> aquaculture development<br />
Total fish production in Zambia is around 5 000 tonnes <strong>of</strong> which around 75 percent<br />
is produced by the commercial sector. The animal feed industry is well established<br />
<strong>and</strong> produces over 120 000 tonnes per annum. In 2005 some 450 tonnes <strong>of</strong> fish feed<br />
was produced <strong>and</strong> until 2004 an unknown quantity <strong>of</strong> fish feed was imported from<br />
Zimbabwe. Most <strong>of</strong> the commercial farmers produce their own <strong>feeds</strong>. Agricultural byproducts<br />
<strong>and</strong> other feed ingredients are readily available in Zambia though fishmeal is<br />
scarce <strong>and</strong> is imported, mainly from Namibia. The <strong>for</strong>mal feed sector has the capacity<br />
to increase fish feed production<br />
A common denominator throughout the region is that many, if not most,<br />
commercial farmers rely more on farm-made <strong>feeds</strong> <strong>and</strong> <strong>feeds</strong> produced by the in<strong>for</strong>mal<br />
sector than on the <strong>for</strong>mal animal feed sector. This scenario will probably continue<br />
until such time as the dem<strong>and</strong> in the various countries reaches a critical mass. All<br />
countries have established animal feed industries, which are capable <strong>of</strong> accommodating<br />
the dem<strong>and</strong> <strong>of</strong> the commercial aquaculture sector. However, at this stage the common<br />
complaint is poor feed quality, particularly with respect to the high percent <strong>of</strong> fines,<br />
water stability <strong>and</strong> poor FCRs. Unless there is a certain minimum dem<strong>and</strong> it is highly<br />
unlikely that the <strong>for</strong>mal feed industry, with its focus on poultry <strong>feeds</strong>, would gear<br />
up in any <strong>of</strong> the countries to manufacture high quality, competitively priced fish<br />
<strong>feeds</strong>. Hence the small-scale aquafeed producers have a competitive advantage. The<br />
synergistic growth <strong>of</strong> the commercial aquaculture <strong>and</strong> small-scale feed producing<br />
sectors should there<strong>for</strong>e be strongly encouraged <strong>and</strong> supported. The projected dem<strong>and</strong><br />
<strong>for</strong> aquafeed under three different growth scenarios <strong>of</strong> 5, 10 <strong>and</strong> 15 percent per annum<br />
(Table 20) is substantial <strong>and</strong> certainly provides opportunity <strong>for</strong> some <strong>of</strong> the current<br />
cadre <strong>of</strong> small-scale feed producers to carve a pr<strong>of</strong>itable niche <strong>for</strong> themselves. Overall,<br />
commodities <strong>for</strong> inclusion into fish <strong>feeds</strong> in the target countries are readily available,<br />
though seasonal price fluctuations can be significant. This has a serious impact on<br />
small-scale producers who generally do not have adequate storage facility to purchase<br />
product when prices are low (usually immediately after harvest). Fishmeal throughout<br />
the region is a constraint, with respect to quality <strong>and</strong> quantity <strong>and</strong> most countries are<br />
largely dependent on imports.<br />
14. RECOMMENDATIONS<br />
Recommendations <strong>for</strong> improved utilization <strong>of</strong> fertilizer <strong>and</strong> feed resources including<br />
suggested policy guidelines emanating from the country reports can be grouped into<br />
four major categories, viz. (i) Technological; (ii) Research <strong>and</strong> Development; (iii)<br />
Outreach; (iv) Policy <strong>and</strong> legal.<br />
i) Technology<br />
The country reviews reveal that there is a serious lack <strong>of</strong> capacity <strong>and</strong> knowledge with<br />
respect to feed technology. It is there<strong>for</strong>e necessary to;<br />
• train private <strong>and</strong> public sector nutritionists <strong>and</strong> fish feed technologists<br />
(<strong>for</strong>mulation, pelleting, on-farm feed <strong>for</strong>mulation <strong>and</strong> manufacture, small-scale<br />
feed manufacturing);<br />
• design, adapt <strong>and</strong> develop appropriate low-cost machinery <strong>for</strong> milling, mixing <strong>and</strong><br />
feed manufacture;<br />
• adapt <strong>and</strong> improve low cost feed drying technologies; <strong>and</strong><br />
• design, develop <strong>and</strong> test appropriate bulk storage facilities to prevent spoilage as a<br />
mitigating measure against seasonal price fluctuations.<br />
ii) Research <strong>and</strong> development<br />
It is necessary to:<br />
• evaluate alternate feed ingredients <strong>and</strong> determine optimum inclusion rates;<br />
• quantify the dem<strong>and</strong> <strong>for</strong> animal manure in aquaculture at district level <strong>and</strong> devise<br />
low-cost distribution plans;
Review <strong>of</strong> <strong>feeds</strong> <strong>and</strong> <strong>fertilizers</strong> <strong>for</strong> <strong>sustainable</strong> aquaculture development in sub-Saharan Africa 107<br />
TABLE 20<br />
Projections <strong>of</strong> aquaculture production <strong>and</strong> aquafeed requirements in target countries <strong>for</strong> 2010 <strong>and</strong> 2015*<br />
Periods Cameroon Ghana Kenya Malawi Nigeria Ug<strong>and</strong>a Zambia<br />
2003/04/05 2005 2004 2004 2005 2004 2003 2003<br />
Aquaculture production<br />
820 950 1035 800 43 950 5500 4490<br />
(tonnes)<br />
Contribution <strong>of</strong><br />
8 30 41 12 80 40 75<br />
commercial aquaculture<br />
(%)<br />
Aquafeed production<br />
90 35 570 750<br />
(tonnes)<br />
Growth rate (% per<br />
5 10 15 5 10 15 5 10 15 5 10 15 5 10 15 5 10 15 5 10 15<br />
annum)<br />
2010<br />
Projected aquaculture 1 046 1 320 1 649 1 212 1 529 1 687 1 320 1 666 2 081 1 021 1 288 1 609 56 092 70 781 88 399 6 752 8 857 11 062 5 730 7 231 9 030<br />
production (tonnes)<br />
Projected contribution <strong>of</strong> 15 15 15 35 35 35 45 45 45 55 55 55 80 80 80 40 40 40 75 75 75<br />
commercial aquaculture<br />
(%)<br />
Projected commercial 156 198 247 424 535 590 594 749 936 561 708 884 44 873 56 624 70 719 2 700 3 542 4 424 4 297 5 423 6 772<br />
aquaculture (tonnes)<br />
Aquafeed dem<strong>and</strong><br />
234 297 371 636 802 885 891 1 124 1 404 842 1 062 1 327 67 310 84 937 106 078 4 051 5 314 6 637 6 446 8 134 10 158<br />
(tonnes)<br />
2015<br />
Projected aquaculture 1 335 2 126 3 317 1 547 2 464 3 395 1 685 2 684 4 187 1 303 2 074 3 236 71 589 113 994 177 802 8 617 14 265 22 250 7 313 11 645 18 164<br />
production (tonnes)<br />
Projected contribution <strong>of</strong> 30 30 30 45 45 45 55 55 55 65 65 65 80 80 80 55 55 55 75 75 75<br />
commercial aquaculture<br />
(%)<br />
Projected commercial 400 637 995 696 1 108 1 527 926 1 476 2 302 846 1 348 2 103 57 271 91 195 142 241 4 739 7 845 12 237 5 484 87 337 13 623<br />
aquaculture (tonnes)<br />
Aquafeed dem<strong>and</strong><br />
600 955 1 492 1 044 1 663 2 291 1 390 2 214 3 454 1 270 2 022 3 155 85 906 136 793 213 361 7 109 11 768 18 356 8 227 13 100 20 434<br />
(tonnes)<br />
2020<br />
Projected aquaculture 1 704 3 428 6 672 1 974 3 968 6 828 2 151 4 323 8 421 1 663 3 341 6 509 91 368 183 590 357 623 10 998 22 974 44 753 9 334 18 755 36 535<br />
production (tonnes)<br />
Projected contribution <strong>of</strong> 60 60 60 60 60 60 70 70 70 70 70 70 80 80 80 70 70 70 75 75 75<br />
commercial aquaculture<br />
(%)<br />
Projected commercial 1 022 2 056 4 003 1 184 2 380 4 096 1 505 3 026 5 894 1 164 2 338 4 556 73 094 146 872 286 098 7 698 16 081 31 274 7 000 14 066 27 401<br />
aquaculture (tonnes)<br />
Aquafeed dem<strong>and</strong> 1 533 3 084 6 004 1 776 3 571 6 145 2 258 4 539 8 842 1 746 3 508 6 834 109 641 220 308 429 147 11 547 24 122 46 990 10500 21 099 41 101<br />
(tonnes)<br />
*Data <strong>and</strong> assumptions: Baseline fish production data obtained from country reviews, except <strong>for</strong> Ug<strong>and</strong>a <strong>and</strong> Zambia <strong>for</strong> which the FAO Fishstat estimates <strong>for</strong> 2003 were used. Estimates <strong>of</strong> current commercial<br />
production as a percent <strong>of</strong> total production obtained from Hecht (2006). Increase in commercial aquaculture contributions estimated from percent increases in total production over last 5 years. Estimates <strong>of</strong><br />
aquafeed requirements calculated on basis <strong>of</strong> commercial production at an FCR <strong>of</strong> 1.5, which is below the current average FCR <strong>of</strong> 2.0 obtained by commercial fish farmers in the region. The projections are<br />
based on three growth scenario’s <strong>of</strong> 5, 10 <strong>and</strong> 15 % per annum.<br />
Source: Shipton <strong>and</strong> Hecht (2005), FAO (2006) <strong>and</strong> author’s calculations
108<br />
<strong>Study</strong> <strong>and</strong> <strong>analysis</strong> <strong>of</strong> <strong>feeds</strong> <strong>and</strong> <strong>fertilizers</strong> <strong>for</strong> <strong>sustainable</strong> aquaculture development<br />
• develop appropriate agro-ecological fertilization regimens;<br />
• undertake surveys <strong>and</strong> develop databases <strong>of</strong> available feed resources at district or<br />
provincial basis;<br />
• develop <strong>and</strong> test country specific “farm-made” feed <strong>for</strong>mulations;<br />
• develop <strong>and</strong> test appropriate feeding table; <strong>and</strong><br />
• develop <strong>and</strong> test appropriate feeding methods to reduce waste <strong>and</strong> improve<br />
FCR.<br />
iii) Outreach<br />
For maximum impact the outreach listed below should focus specifically on districts or<br />
regions with high aquaculture potential; mainly to:<br />
• train farmers, NGOs <strong>and</strong> extension staff in food storage methods;<br />
• disseminate in<strong>for</strong>mation on availability <strong>of</strong> ingredients suitable <strong>for</strong> fish <strong>feeds</strong>;<br />
• disseminate in<strong>for</strong>mation on “farm-made” feed <strong>for</strong>mulations to fish farmer<br />
associations, farmers, NGOs <strong>and</strong> extension staff;<br />
• disseminate in<strong>for</strong>mation on manufacturing technology <strong>for</strong> “farm-made” <strong>feeds</strong> to<br />
fish farmer associations, farmers, NGOs <strong>and</strong> extension staff;<br />
• disseminate in<strong>for</strong>mation on feeding schedules <strong>and</strong> improved feeding practices to<br />
fish farmer associations, farmers, NGOs <strong>and</strong> extension staff; <strong>and</strong><br />
• provide support services to small-scale feed producers to fine tune their production<br />
processes <strong>and</strong> technologies to achieve optimum results.<br />
iv) Policy <strong>and</strong> legal<br />
It would appear from the country reviews that the animal feed industry in most<br />
countries is inadequately regulated. Hence the relevant legislation, where this exists,<br />
should be reviewed <strong>and</strong> amended to support the development <strong>of</strong> the industry.<br />
Cameroon <strong>and</strong> Kenya are in the process <strong>of</strong> reviewing their legislation with respect to<br />
the feed industry. The most pertinent recommendations are listed below:<br />
• governments <strong>and</strong> financial institutions must be sensitized with respect to business<br />
opportunities <strong>of</strong>fered by the aquaculture sector;<br />
• governments in all countries should provide incentives <strong>for</strong> the development <strong>of</strong> the<br />
animal feed industry (including aqua<strong>feeds</strong>);<br />
• the feed industry must be encouraged <strong>and</strong> assisted in lobbying governments to<br />
change the legislation on import duty <strong>of</strong> raw materials <strong>and</strong> <strong>feeds</strong> (e.g. Ug<strong>and</strong>an<br />
farmers have to pay holding tax at 6 percent, value added tax at 18 percent <strong>and</strong><br />
import duty at 10 percent <strong>for</strong> catfish feed from South Africa). <strong>and</strong><br />
• governments must be made aware <strong>of</strong> the need to regulate the <strong>for</strong>mal <strong>and</strong> in<strong>for</strong>mal<br />
animal feed industry, particularly in terms <strong>of</strong> quality assurance <strong>and</strong> certification.<br />
ACKNOWLEDGEMENTS<br />
My sincere thanks to all the country review authors <strong>for</strong> their assistance <strong>and</strong> cooperation.<br />
In addition I would like to thank Pr<strong>of</strong>essor A. Fagbenro (Nigeria), C. Mudenda (Zambia)<br />
<strong>and</strong> B. Thiga (Kenya) <strong>for</strong> providing additional in<strong>for</strong>mation <strong>and</strong> data <strong>and</strong> Dr Mohammad<br />
R. Hasan (FAO) <strong>for</strong> his critical <strong>and</strong> valuable comments on the draft manuscript.<br />
REFERENCES<br />
Abban, E.K. 2005. <strong>Study</strong> <strong>and</strong> <strong>analysis</strong> <strong>of</strong> feed <strong>and</strong> nutrients including <strong>fertilizers</strong> <strong>for</strong><br />
<strong>sustainable</strong> aquaculture development in Ghana (unpublished report <strong>of</strong> Water Research<br />
Institute, Council <strong>for</strong> Scientific & Industrial Research). 24 pp.<br />
ADiM. 2005. National Aquaculture Strategic Plan. Department <strong>of</strong> Fisheries, Lilongwe,<br />
Malawi. 152 pp.<br />
Aguilar-Manjarrez, J. & Nath, S.S. 1998. A strategic reassessment <strong>of</strong> fish farming potential<br />
in Africa. CIFA Technical Paper No. 32. Rome, FAO. 170 pp.<br />
Ayinla, O.A. 2007. Analysis <strong>of</strong> <strong>feeds</strong> <strong>and</strong> nutrients <strong>for</strong> <strong>sustainable</strong> aquaculture development<br />
in Nigeria (this volume).
Review <strong>of</strong> <strong>feeds</strong> <strong>and</strong> <strong>fertilizers</strong> <strong>for</strong> <strong>sustainable</strong> aquaculture development in sub-Saharan Africa 109<br />
Bentley, G. & Bentley, M. 2005. A review <strong>of</strong> the animal <strong>and</strong> aquafeed industries in Zambia.<br />
pp. 50-56. In J. Moehl & M. Halwart, (eds.) A synthesis <strong>of</strong> the <strong>for</strong>mulated animal <strong>and</strong><br />
aqua<strong>feeds</strong> industry in sub-Saharan Africa. CIFA Occasional Paper. No. 26. Rome, FAO.<br />
61 pp.<br />
Brummett, R.E. 1994. The context <strong>of</strong> smallholding integrated aquaculture in Malawi.<br />
ICLARM Conf. Proc. No. 46, Manila, ICLARM. pp. 3-5.<br />
Chimatiro, S.K. & Chirwa, B.B. 2007.Analysis <strong>of</strong> <strong>feeds</strong> <strong>and</strong> nutrients <strong>for</strong> <strong>sustainable</strong><br />
aquaculture development in Malawi (this volume).<br />
Costa Pierce, B, Desbonnet, A., Edwards, P & Baker, D. 2005. Urban aquaculture. CABI<br />
Publ. Ox<strong>for</strong>dshire. 285 pp.<br />
Fagbenro, O.A. & Adebayo, O.T. 2005. A review <strong>of</strong> the animal <strong>and</strong> aquafeed industries<br />
in Nigeria. pp. 25-36. In J. Moehl & M. Halwart, (eds.) A synthesis <strong>of</strong> the <strong>for</strong>mulated<br />
animal <strong>and</strong> aqua<strong>feeds</strong> industry in sub-Saharan Africa. CIFA Occasional Paper. No. 26.<br />
Rome, FAO. 61 pp.<br />
FAO Fisheries Global In<strong>for</strong>mation System. 2006. National Aquaculture Sector Overview<br />
(NASO). Food <strong>and</strong> Agriculture Organization <strong>of</strong> the United Nations. (available at http://<br />
www.fao.org/fi/website/FISearch.do?dom=countrysector).<br />
FAO. 2006. FAO Fisheries Department, Fishery In<strong>for</strong>mation, Data <strong>and</strong> Statistics Unit.<br />
Fishstat Plus: Universal s<strong>of</strong>tware <strong>for</strong> fishery statistical time series. Aquaculture production:<br />
quantities 1950-2004, Aquaculture production: values 1984-2004; Capture production:<br />
1950-2004; Commodities production <strong>and</strong> trade: 1950-2004; Total production: 1970-2004,<br />
Vers. 2.30 (available at www.fao.org/fi/statist/FISOFT/FISHPLUS.asp).<br />
Hasan, M.R. 2005. Unpublished travel report to Nigeria <strong>and</strong> Ghana. Internal FIRI, Rome,<br />
FAO. 35 pp.<br />
Hecht, T. 2006. Regional review <strong>of</strong> aquaculture development. 4. Sub-Saharan Africa. FAO<br />
Fisheries Circular. No. 1017/4. Rome, FAO. 96 pp.<br />
Kapetsky, J. 1994. A strategic assessment <strong>of</strong> warm-water fish farming potential in Africa.<br />
CIFA Technical Paper 27. Rome, FAO. 67 pp<br />
Moehl, J., Halwart, M. & Brummett, R. 2005. Report <strong>of</strong> the FAO-WorldFish Center<br />
Workshop on Small-scale Aquaculture in sub-Saharan Africa: Revisiting the Aquaculture<br />
Target Group Paradigm. Limbé, Cameroon, 23–26 March 2004. CIFA Occasional Paper.<br />
No. 25. Rome, FAO. 54 pp.<br />
Ny<strong>and</strong>at, B. 2007. Analysis <strong>of</strong> <strong>feeds</strong> <strong>and</strong> nutrients <strong>for</strong> <strong>sustainable</strong> aquaculture development<br />
in Kenya (this volume).<br />
Pouomogne, V. 2007. Analysis <strong>of</strong> <strong>feeds</strong> <strong>and</strong> nutrients <strong>for</strong> <strong>sustainable</strong> aquaculture<br />
development in Cameroon (this volume).<br />
Radull, J. 2005. A review <strong>of</strong> the animal <strong>and</strong> aquafeed industries in Kenya. pp. 43-49. In J.<br />
Moehl & M. Halwart, (eds.) A synthesis <strong>of</strong> the <strong>for</strong>mulated animal <strong>and</strong> aqua<strong>feeds</strong> industry<br />
in sub-Saharan Africa. CIFA Occasional Paper. No. 26. Rome, FAO. 61 pp.<br />
Rana, K., Anyila, J., Salie, K., Mahika, C., Heck,S., Young, J., & Monti, G. 2005.<br />
Aquafarming in Urban <strong>and</strong> peri-urban zones in sub-Saharan Africa. Presentation<br />
at the 7 th Bi-annual Conference <strong>of</strong> the Aquaculture Association <strong>of</strong> southern Africa,<br />
Grahamstown 12-14 September 2005.<br />
Rutaisire, J. 2007. Analysis <strong>of</strong> <strong>feeds</strong> <strong>and</strong> nutrients <strong>for</strong> <strong>sustainable</strong> aquaculture development<br />
in Ug<strong>and</strong>a (this volume).<br />
Shipton, T. & Hecht, T. 2005. A synthesis <strong>of</strong> the <strong>for</strong>mulated animal <strong>and</strong> aquafeed industry<br />
in sub-Saharan Africa. pp. 1-13. In J. Moehl & M. Halwart, (eds.) A synthesis <strong>of</strong> the<br />
<strong>for</strong>mulated animal <strong>and</strong> aqua<strong>feeds</strong> industry in sub-Saharan Africa. CIFA Occasional<br />
Paper. No. 26. Rome, FAO. 61 pp.<br />
Singa, D. 2004 Quantitative <strong>and</strong> qualitative field baseline survey report. In Aquaculture<br />
Development in Malawi - Master Plan <strong>Study</strong> Outputs. Department <strong>of</strong> Fisheries,<br />
Lilongwe, Malawi.
COUNTRY REVIEWS AND<br />
CASE STUDY: ASIA<br />
111
Analysis <strong>of</strong> <strong>feeds</strong> <strong>and</strong> <strong>fertilizers</strong><br />
<strong>for</strong> <strong>sustainable</strong> aquaculture<br />
development in Bangladesh<br />
Benoy K. Barman <strong>and</strong> Manjurul Karim<br />
WorldFish Center, Bangladesh <strong>and</strong> South Asia Office<br />
House 22B, Road 7, Block F, Banani, Dhaka 1213<br />
Bangladesh<br />
Summary 114<br />
1. Introduction 115<br />
2. Methods 117<br />
3. Aquaculture practices <strong>and</strong> farming systems 118<br />
4. Feeds <strong>and</strong> <strong>fertilizers</strong> use in aquaculture 120<br />
5. Feed ingredients <strong>and</strong> <strong>feeds</strong> 123<br />
6. Feeding practices in relation to farming systems <strong>and</strong> species, farm-made<br />
<strong>feeds</strong> <strong>and</strong> nutrient management strategies 125<br />
7. Development <strong>of</strong> the aquafeed industry 133<br />
8. Problems <strong>and</strong> constraints <strong>of</strong> feed <strong>and</strong> fertilizer use in aquaculture 135<br />
9. Resource availability <strong>and</strong> the expansion <strong>of</strong> the aquaculture industry 135<br />
10. Recommendations 136<br />
Acknowledgements 136<br />
References 136<br />
Appendix 139<br />
Barman, B.K. <strong>and</strong> Karim, M. 2007. Analysis <strong>of</strong> <strong>feeds</strong> <strong>and</strong> <strong>fertilizers</strong> <strong>for</strong> <strong>sustainable</strong><br />
aquaculture development in Bangladesh. In M.R. Hasan, T. Hecht, S.S. De Silva <strong>and</strong><br />
A.G.J. Tacon (eds). <strong>Study</strong> <strong>and</strong> <strong>analysis</strong> <strong>of</strong> <strong>feeds</strong> <strong>and</strong> <strong>fertilizers</strong> <strong>for</strong> <strong>sustainable</strong> aquaculture<br />
development. FAO Fisheries Technical Paper. No. 497. Rome, FAO. pp. 113–140.<br />
113
114<br />
<strong>Study</strong> <strong>and</strong> <strong>analysis</strong> <strong>of</strong> <strong>feeds</strong> <strong>and</strong> <strong>fertilizers</strong> <strong>for</strong> <strong>sustainable</strong> aquaculture development<br />
SUMMARY<br />
This study focuses on <strong>feeds</strong> <strong>and</strong> nutrients used under different aquaculture farming<br />
systems <strong>and</strong> practices in Bangladesh, which include:<br />
• extensive <strong>and</strong> semi-intensive systems <strong>for</strong> the production <strong>of</strong> carp species (Indian <strong>and</strong><br />
Chinese major carps, common carp, Java barb) <strong>and</strong> to a lesser extent tilapia <strong>and</strong> catfish.<br />
Over 89 percent <strong>of</strong> aquaculture production in Bangladesh is derived from these<br />
systems. An overview <strong>of</strong> feed <strong>and</strong> nutrient utilisation in these systems as well as their<br />
diversity, complexity <strong>and</strong> production potential are presented;<br />
• intensive culture systems <strong>for</strong> sutchi catfish (Pangasius hypophthalmus) (local name:<br />
Thai pangas). These have typically developed in clusters in several regions <strong>and</strong> depend<br />
largely on the use <strong>of</strong> farm-made <strong>feeds</strong>, pelleted <strong>feeds</strong> supplied either by the industrial<br />
aquafeed industry or by small-scale aquafeed mills. The increase in the number <strong>of</strong><br />
small-scale feed manufacturers is a direct response to the growth in dem<strong>and</strong> <strong>for</strong><br />
pelleted <strong>feeds</strong>; <strong>and</strong><br />
• systems <strong>for</strong> the production <strong>of</strong> black tiger shrimp <strong>and</strong> giant freshwater prawn. These<br />
include hatcheries, nurseries <strong>and</strong> grow-out facilities. Black tiger shrimp (Penaeus<br />
monodon) <strong>and</strong> giant freshwater prawn (Macrobrachium rosenberergii) production<br />
is exp<strong>and</strong>ing rapidly <strong>and</strong> now contributes to the export earning <strong>of</strong> Bangladesh.<br />
Developments in feed manufacturing technology <strong>and</strong> improved fertilization are<br />
critically important <strong>for</strong> the expansion <strong>of</strong> the industry. The use <strong>of</strong> <strong>feeds</strong> <strong>and</strong> nutrients<br />
in crustacean culture has been analysed based on existing farming practices.<br />
The increase in aquaculture production in many Asian countries is mainly a<br />
consequence <strong>of</strong> the expansion <strong>of</strong> semi-intensive, small-scale farming systems <strong>and</strong> the<br />
more appropriate use <strong>of</strong> <strong>feeds</strong> <strong>and</strong> nutrients (Hasan, 2001). In Bangladesh, the average<br />
yield from fishponds has increased from 0.85 tonnes/ha/year in 1986 to 2.48 tonnes/ha<br />
in 2005. Potential exists to further increase production through improved use <strong>of</strong> <strong>feeds</strong><br />
<strong>and</strong> <strong>fertilizers</strong>. Even minor increases in production levels in the extensive <strong>and</strong> semiintensive<br />
farming systems would make significant contributions to total fish production<br />
in Bangladesh. To achieve this goal there is a need <strong>for</strong> a better underst<strong>and</strong>ing <strong>of</strong> the<br />
production systems, the quality, quantity <strong>and</strong> frequency <strong>of</strong> feed <strong>and</strong> fertilizer application<br />
<strong>and</strong> the use <strong>of</strong> different species.<br />
Different types <strong>of</strong> <strong>fertilizers</strong> <strong>and</strong> <strong>feeds</strong> (single ingredient or compounded) are used in<br />
the diverse array <strong>of</strong> systems. The <strong>for</strong>mal <strong>and</strong> in<strong>for</strong>mal aquafeed industries in Bangladesh<br />
are developing rapidly, collectively contribute to job creation <strong>and</strong> improved aquaculture<br />
production. This study analyses the potential <strong>for</strong> development <strong>and</strong> the constraints facing<br />
the aquaculture sector in Bangladesh, with particular reference to <strong>feeds</strong> <strong>and</strong> <strong>fertilizers</strong>.<br />
Recommendations are made to facilitate the <strong>sustainable</strong> development <strong>of</strong> the sector in the<br />
country.
Analysis <strong>of</strong> <strong>feeds</strong> <strong>and</strong> <strong>fertilizers</strong> <strong>for</strong> <strong>sustainable</strong> aquaculture development in Bangladesh 115<br />
1. INTRODUCTION<br />
The fisheries sector in Bangladesh plays a vital role in the supply <strong>of</strong> animal<br />
protein, creating employment, earning <strong>for</strong>eign currency <strong>and</strong> alleviating poverty. The<br />
contribution <strong>of</strong> the sector accounts <strong>for</strong> 4.92 percent <strong>of</strong> GDP, 5.7 percent <strong>of</strong> total export<br />
earnings <strong>and</strong> directly <strong>and</strong> indirectly employs approximately 12 million people (BBS,<br />
2004). During the period 1995–96 to 2004–05 fish production in Bangladesh increased<br />
by 75.3 percent from 1.264 million tonnes to 2.216 million tonnes <strong>and</strong> the contribution<br />
by aquaculture to total domestic fish supply increased from 31 to 40 percent (Figure 1).<br />
Similarly, export volumes <strong>and</strong> earnings <strong>of</strong> fish <strong>and</strong> fish-products increased from 39 391<br />
tonnes (US$263 million) in 1999–2000 to 63 377 tonnes (US$373 million in 2004–05<br />
(DoF, 2006). Export earnings are largely contributed by black tiger shrimp, Penaeus<br />
monodon <strong>and</strong> giant freshwater prawn, Macrobrachium rosenbergii.<br />
FIGURE 1<br />
Trends in fish production from inl<strong>and</strong> aquaculture <strong>and</strong> capture fisheries in Bangladesh from<br />
1994–95 to 2004–05<br />
Fish production (thous<strong>and</strong> tonnes)<br />
Source: DoF (2006).<br />
1 000<br />
900<br />
800<br />
700<br />
600<br />
500<br />
400<br />
300<br />
200<br />
100<br />
0<br />
1994 1995 1996 1997 1998 1999 2000 2001 2002 2003 2004<br />
In 2004–5, pond fish production contributed to 85.8 percent <strong>of</strong> the total aquaculture<br />
production, whilst the remainder was produced in coastal shrimp ponds (13.7 percent)<br />
<strong>and</strong> oxbow lakes (0.5 percent). Overall, aquaculture contributed 39.8 percent to the<br />
total national fish production (Table 1). Major species-group aquaculture production<br />
<strong>and</strong> species-wise pond fish production during 2004–2005 are shown in Tables 3 <strong>and</strong><br />
respectively.<br />
In many Asian countries, the increase in aquaculture production is a direct<br />
consequence <strong>of</strong> the expansion <strong>of</strong> semi-intensive, small-scale pond aquaculture <strong>and</strong><br />
more appropriate use <strong>of</strong> <strong>feeds</strong> <strong>and</strong> nutrients (Hasan, 2001). This is particularly true<br />
<strong>for</strong> Bangladesh, where the average yield from fish pond aquaculture increased from<br />
0.85 tonnes/ha in 1986 to 2.48 tonnes/ha in 2005 (DoF, 2006). With the exception<br />
<strong>of</strong> a small proportion <strong>of</strong> aquaculture production from rapidly growing intensive<br />
aquaculture systems, the bulk (87 percent) comes from improved-extensive <strong>and</strong> semiintensive<br />
culture systems. There is great potential to increase the productivity <strong>of</strong><br />
these systems even further through better use <strong>of</strong> <strong>feeds</strong> <strong>and</strong> <strong>fertilizers</strong> <strong>and</strong> even minor<br />
increases in production in these systems would significantly raise total fish production.<br />
In order to achieve this goal an improved underst<strong>and</strong>ing <strong>of</strong> the production systems, the<br />
use <strong>of</strong> <strong>feeds</strong> <strong>and</strong> nutrients <strong>and</strong> the various aquaculture species is required.<br />
Year<br />
Inl<strong>and</strong> culture Inl<strong>and</strong> capture Marine
116<br />
<strong>Study</strong> <strong>and</strong> <strong>analysis</strong> <strong>of</strong> <strong>feeds</strong> <strong>and</strong> <strong>fertilizers</strong> <strong>for</strong> <strong>sustainable</strong> aquaculture development<br />
TABLE 1<br />
Aquaculture production from different water resources in Bangladesh, 2004–05<br />
Sources<br />
Area<br />
(ha)<br />
Total aquaculture<br />
production<br />
(tonnes)<br />
Yield<br />
(tonnes/ha)<br />
Percent <strong>of</strong> total<br />
aquaculture<br />
production<br />
Percent <strong>of</strong> total<br />
fisheries production<br />
Inl<strong>and</strong> fish ponds 305 025 756 993 2 482 85.8 34.2<br />
Coastal shrimp<br />
farms<br />
217 877 120 710 554 13.7 5.4<br />
Oxbow lakes2 5 488 4 388 800 0.5 0.2<br />
Total 513 584 882 091 100 39.8<br />
Source: DoF (2006)<br />
TABLE 2<br />
Major species-group aquaculture production (tonnes) in Bangladesh, 2004–2005<br />
Major groups Freshwater Ponds Brackish-water shrimp farms Oxbow lakes Total % <strong>of</strong> total<br />
Major carps 413 137 - 1 922 415 059 47.05<br />
Exotic carps 236 088 - 1 779 237 867 26.97<br />
Other carps 6 469 - - 6 469 0.73<br />
Snakeheads 10 738 - 2 10 740 1.22<br />
Catfishes 8 509 - 4 8 513 0.97<br />
Live fishes 6 552 - 1 6 553 0.74<br />
Other fishes 72 940 38 049 669 111 658 12.66<br />
Shrimps <strong>and</strong> prawns 2 560 82 661 11 85232 9.67<br />
Total 756 993 120 710 4 388 882 091 100.0<br />
Source: DoF (2006)<br />
TABLE 3<br />
Species-wise pond fish production in Bangladesh, 2004–2005<br />
Major groups Species Tonnes %<br />
Rohu (Labeo rohita) 163 190 21.56<br />
Major carps Catla (Catla catla) 137 685 18.19<br />
Mrigal (Cirrhinus cirrhosus) 112 262 14.83<br />
Sub-total 413 137 54.58<br />
Silver carp (Hypophthalmichthys molotrix) 158 741 20.97<br />
Grass carp (Ctenopharyngodon idellus) 15 897 2.10<br />
Exotic carps<br />
Common/mirror carp (Cyprinus carpio)<br />
Java barb (Barbonymus gonionotus)<br />
16 502<br />
4 693<br />
2.18<br />
0.62<br />
Mixed carps 34 897 4.61<br />
Others 5 357 0.71<br />
Sub-total 236 088 31.19<br />
Other carps<br />
Orange-fin labeo (Labeo calbasu) <strong>and</strong><br />
kuria labeo (Labeo gonius)<br />
6 469 0.85<br />
Snakeheads Snakeheads (Channa spp.) 10 738 1.42<br />
Catfishes<br />
Long-whiskered catfish (Sperata aor) <strong>and</strong><br />
giant river-catfish (S. seenghala)<br />
681 0.09<br />
Wallago (Wallago attu) <strong>and</strong> other catfishes 7 828 1.03<br />
Sub-total 8 509 1.12<br />
Live fishes Climbing perch (Anabas testudineus) 1 892 0.25<br />
Catfishes (Heteropneustes fossilis <strong>and</strong> Clarias batrachus) 4 660 0.62<br />
Sub-total 6 552 0.87<br />
Feather backs (Notopterus chitala <strong>and</strong> N. notopterus) 908 0.12<br />
Olive barb (Puntius sarana) 3 179 0.42<br />
Other fishes Tilapias (Oreochromis niloticus <strong>and</strong> O. mossambicus) 9 992 1.32<br />
Punti (Puntius spp.) 9 008 1.19<br />
Others* 49 852 6.7<br />
Sub-total 72 940 9.75<br />
Giant freshwater prawn (Macrobrachium resenbergii),<br />
2 560 0.34<br />
Prawns<br />
monsoon river prawn (M. malcolmsoni) <strong>and</strong> other<br />
freshwater prawn species<br />
Gr<strong>and</strong> total 756 993 100<br />
*All other freshwater fish species not included above. See Annex A1 <strong>for</strong> details <strong>of</strong> major groups <strong>of</strong> aquaculture<br />
species in Bangladesh.<br />
Source: Modified from DoF (2006)<br />
2 Oxbow lakes (local name: baors) are semi-closed water-bodies, cut <strong>of</strong>f from old river channels in the<br />
delta <strong>of</strong> the Ganges.
Analysis <strong>of</strong> <strong>feeds</strong> <strong>and</strong> <strong>fertilizers</strong> <strong>for</strong> <strong>sustainable</strong> aquaculture development in Bangladesh 117<br />
2. METHODS<br />
This review was undertaken using<br />
secondary in<strong>for</strong>mation from different<br />
sources <strong>and</strong> supplemented, wherever<br />
possible, with primary in<strong>for</strong>mation<br />
obtained through farm visits <strong>and</strong><br />
interviewing <strong>of</strong> appropriate stakeholders.<br />
The primary stakeholders that were<br />
interviewed included operators <strong>of</strong><br />
finfish hatcheries <strong>and</strong> nurseries, growout<br />
farmers, operators <strong>of</strong> shrimp 3 <strong>and</strong><br />
prawn hatcheries, nurseries <strong>and</strong> growout<br />
farmers, fish feed millers, aquafeed<br />
companies <strong>and</strong> feed dealers.<br />
A brief overview <strong>of</strong> the areas from<br />
which the data was collected is presented<br />
below <strong>and</strong> the location <strong>of</strong> the areas is<br />
shown in Figure 2. Geographically, the<br />
country is divided into four regions,<br />
viz. Northeast, Northwest, Southeast<br />
<strong>and</strong> Southwest <strong>and</strong> administratively it<br />
is divided into 64 districts. The survey<br />
covered all four regions.<br />
FIGURE 2<br />
Map <strong>of</strong> Bangladesh showing the location (red dots) <strong>of</strong> the<br />
areas surveyed <strong>for</strong> the review<br />
Source: HTTP://WWW.LIB.UTEXAS.EDU/MAPS/MIDDLE_EAST_AND_ASIA/BANGLADESH_POL96.JPG<br />
Rangpur <strong>and</strong> Dinajpur – these two districts are located in the northwest region <strong>of</strong><br />
Bangladesh. Aquaculture in these two districts is generally poorly developed, mainly<br />
due to the seasonal nature <strong>of</strong> the ponds. However, semi-intensive carp polyculture is<br />
rapidly developing in the area.<br />
Bogra – is located in the northwest region <strong>of</strong> Bangladesh. This district is particularly<br />
well known <strong>for</strong> the pangas hatcheries that supply juveniles <strong>for</strong> grow-out to farmers<br />
throughout the country.<br />
Mymensingh, Narshingdi <strong>and</strong> Comilla – located in the northeast region <strong>of</strong><br />
Bangladesh, these districts have well-developed semi-intensive carp polyculture <strong>and</strong><br />
rapidly growing intensive pond based pangas nursery <strong>and</strong> grow-out. Substantial<br />
quantities <strong>of</strong> industrial <strong>and</strong> farm-made <strong>feeds</strong> are used in these districts <strong>and</strong> there are<br />
several fish feed mills.<br />
Noakhali <strong>and</strong> Laxmipur – located in the southeast region <strong>of</strong> Bangladesh. Semiintensive<br />
carp polyculture is well developed here <strong>and</strong> there are several new prawn<br />
hatcheries <strong>and</strong> a number <strong>of</strong> feed mills. Prawn based semi-intensive carp polyculture in<br />
ponds <strong>and</strong> in seasonal lowl<strong>and</strong> rice fields is developing rapidly in these districts. The<br />
potential <strong>for</strong> aquaculture expansion in these districts is high <strong>and</strong> prawns from where<br />
are now being exported.<br />
Cox’s bazaar – coastal district located in southeast Bangladesh. It has well developed<br />
shrimp hatcheries that supply post larval shrimp to other areas in the country <strong>for</strong><br />
3 Shrimp primarily refers to the black tiger shrimp, Penaeus monodon <strong>and</strong> includes other marine or<br />
brackish-water shrimp species. Prawn primarily refers to giant freshwater prawn, Macrobrachium<br />
rosenbergii <strong>and</strong> other freshwater prawn species.
118<br />
<strong>Study</strong> <strong>and</strong> <strong>analysis</strong> <strong>of</strong> <strong>feeds</strong> <strong>and</strong> <strong>fertilizers</strong> <strong>for</strong> <strong>sustainable</strong> aquaculture development<br />
grow-out. Shrimp farming is practised using extensive technologies in large ponds <strong>and</strong><br />
‘ghers 4 ’. There are several aquafeed mills in the district.<br />
Sathkhira District – coastal district located in northwest Bangladesh with welldeveloped<br />
shrimp grow-out farms. Improved-extensive <strong>and</strong> semi-intensive technologies<br />
using industrial <strong>and</strong> farm-made <strong>feeds</strong> are employed. The culture <strong>of</strong> shrimp is carried<br />
out in ‘<strong>and</strong> fish feed mills ghers’ as an alternate to crop production.<br />
3. AQUACULTURE PRACTICES AND FARMING SYSTEMS<br />
Aquaculture in Bangladesh developed primarily with Indian major carps (Labeo<br />
rohita, Catla catla <strong>and</strong> Cirrhinus cirrhosus) using seed collected from the wild. The<br />
sector exp<strong>and</strong>ed rapidly with the development <strong>of</strong> hatchery technologies <strong>for</strong> Indian<br />
major carps <strong>and</strong> the introduction <strong>of</strong> exotic carps from China <strong>and</strong> Europe. Production<br />
systems were largely extensive, with limited use <strong>of</strong> pond inputs. Significant advances in<br />
pond management have been made in the last few decades, such that the current array<br />
<strong>of</strong> systems can be classified into three distinct categories, viz. improved-extensive,<br />
semi-intensive <strong>and</strong> intensive systems based on increasing pond inputs, levels <strong>of</strong><br />
intensification <strong>and</strong> management (Table 4).<br />
3.1 Semi-intensive polyculture <strong>of</strong> carps 5<br />
Semi-intensive systems are the most commonly used aquaculture production systems<br />
in the country. The improved availability <strong>of</strong> seed <strong>of</strong> various species as well as improved<br />
trading networks have enabled these systems to become successful over the last<br />
decade.<br />
Overall, the use <strong>of</strong> <strong>feeds</strong> <strong>and</strong> <strong>fertilizers</strong> in ponds have increased. However, there is<br />
considerable variation among farmers with respect to the quantities used <strong>and</strong> the mode<br />
<strong>of</strong> application. One <strong>of</strong> the principal objectives <strong>of</strong> this review was to obtain a better<br />
underst<strong>and</strong>ing <strong>of</strong> these variations to develop appropriate strategies <strong>for</strong> the development<br />
<strong>of</strong> the sector. In particular, cognisance was taken <strong>of</strong> the high local dem<strong>and</strong> <strong>for</strong> lower<br />
priced fish by poor rural communities. Both poor <strong>and</strong> marginal farmers practice semiintensive<br />
aquaculture using small ponds or seasonal water bodies. Carp polyculture<br />
systems are largely dependent on primary <strong>and</strong> secondary production through the<br />
application <strong>of</strong> organic <strong>and</strong> inorganic <strong>fertilizers</strong>, though fish production can be improved<br />
through the application <strong>of</strong> effective fertilization strategies <strong>and</strong> supplementary feeding.<br />
3.2 Semi-intensive prawn based carp polyculture<br />
Prawn/carp polyculture has developed rapidly in different areas <strong>of</strong> the country.<br />
In particular this has been facilitated by the improved supply <strong>of</strong> post-larvae (PL)<br />
from newly established hatcheries. Until recently, the major source <strong>of</strong> prawn seed<br />
was from natural waters (Muir, 2003). Hatchery produced PLs fed with <strong>for</strong>mulated<br />
industrial <strong>feeds</strong> in ponds provide healthy juveniles with higher survival rates, improved<br />
production <strong>and</strong> higher pr<strong>of</strong>it margins. Recently many low-lying areas have been<br />
converted into ponds <strong>for</strong> prawn <strong>and</strong> fish culture, particularly in Jessore, Noakhali <strong>and</strong><br />
Laxmipur Districts. Due to the high price <strong>of</strong> prawns, their introduction into the carp<br />
pond production systems acts as an incentive to use supplementary feed as well as<br />
4 Ghers are specially designed ponds used mainly <strong>for</strong> the culture <strong>of</strong> shrimp <strong>and</strong> prawns. These have largely<br />
developed in the coastal areas <strong>of</strong> southwestern Bangladesh.<br />
5 ‘Carps’ as used in this review includes the Indian major carps (rohu, Labeo rohita; catla, Catla catla; mrigal<br />
Cirrhinus cirrhosus; orange-fin labeo, Labeo calbasu) <strong>and</strong> Chinese carps (silver carp, Hypophthalmichtys<br />
molitrix; grass carp, Ctenopharyngodon idella; bighead carp, Aristichthys nobilis). Carp polyculutre also<br />
includes species such as Java barb (Barbonymus gonionotus), common carp (Cyprinus carpio), mirror<br />
carp (Cyprinus carpio var. specularis), Nile tilapia (Oreochromis niloticus) <strong>and</strong> sutchi catfish (Pangasius<br />
hypophthalmus).
Analysis <strong>of</strong> <strong>feeds</strong> <strong>and</strong> <strong>fertilizers</strong> <strong>for</strong> <strong>sustainable</strong> aquaculture development in Bangladesh 119<br />
inorganic <strong>and</strong> organic <strong>fertilizers</strong> on a regular basis (DoF, 2005; Muir, 2003; Demaine,<br />
2005; Field Survey, 2005).<br />
3.3 Intensive culture <strong>of</strong> sutchi catfish (local name: Thai pangas), mono-sex<br />
Nile tilapia <strong>and</strong> Thai strain <strong>of</strong> climbing perch in ponds<br />
The intensive culture <strong>of</strong> sutchi catfish (Pangasius hypophthalmus) (local name: Thai<br />
pangas) <strong>and</strong> more recently, the production <strong>of</strong> monosex Nile tilapia (Oreochromis<br />
niloticus) <strong>and</strong> the Thai strain <strong>of</strong> climbing perch (Anabas testudineus) have developed<br />
rapidly, particularly in peri-urban areas in Mymensigh, Narshindi District close<br />
to the capital city Dhaka <strong>and</strong> in the Bogra District. As elsewhere, intensive finfish<br />
farming is dependent on a reliable <strong>and</strong> adequate source <strong>of</strong> appropriate <strong>feeds</strong>. Farmers<br />
use <strong>for</strong>mulated pellets, manufactured in their own or local cooperative feed mills or<br />
purchased from the commercial aquafeed industry. The market price <strong>of</strong> Thai pangas<br />
is lower than Nile tilapia or climbing perch <strong>and</strong> hence is an af<strong>for</strong>dable protein source<br />
<strong>for</strong> marginal <strong>and</strong> poor urban people. However, as large amounts <strong>of</strong> relatively expensive<br />
<strong>feeds</strong> are used the pr<strong>of</strong>it margins are lower. This has resulted in a shift towards the<br />
production <strong>of</strong> high-value fish such as mono-sex Nile tilapia, Thai strain <strong>of</strong> climbing<br />
perch <strong>and</strong> walking catfish (Clarias batrachus) (Muir, 2003, Field Survey, 2005).<br />
3.4 Extensive <strong>and</strong> improved-extensive shrimp culture<br />
The major shrimp culture activities are located in the southeast <strong>and</strong> northwest regions<br />
<strong>of</strong> Bangladesh (Cox’s bazaar, Sathkhira, Bagerhat, <strong>and</strong> Khulna) <strong>and</strong> PLs are obtained<br />
mainly from hatcheries. Shrimp farming systems in Bangladesh can be generally<br />
classified as extensive, in which the shrimp are reared under low-level input conditions<br />
<strong>and</strong> farmers rely mainly on natural pond productivity. The level <strong>of</strong> production is<br />
consequently very low. In recent years there has been a shift towards the greater use <strong>of</strong><br />
<strong>fertilizers</strong> <strong>and</strong> industrial <strong>feeds</strong> in smaller ghers <strong>and</strong> these systems are now described as<br />
“improved-extensive systems” (Table 5).<br />
The reliable production <strong>of</strong> PLs in hatcheries now ensures a consistent <strong>and</strong> adequate<br />
supply <strong>of</strong> seed <strong>for</strong> the entire production period <strong>of</strong> around 8 to 9 months. Farmers use<br />
TABLE 4<br />
Characteristics <strong>of</strong> the different farming systems <strong>for</strong> carp, prawn <strong>and</strong> pangas, 2005<br />
Descriptions Carp polyculture Prawn culture Pangas culture<br />
System Improved-extensive <strong>and</strong> semi-intensive Semi-intensive Intensive<br />
Species Indian major carps,<br />
Chinese carps <strong>and</strong><br />
common carp<br />
Indian major carps,<br />
Chinese carps, common<br />
carp, Java barb, tilapia<br />
<strong>and</strong> Thai pangas<br />
Indian major carps,<br />
Chinese carps <strong>and</strong><br />
prawn<br />
Thai pangas,<br />
carps <strong>and</strong> Nile<br />
tilapia<br />
Average farm size (ha) 0.05–2.0 0.05–2.0 0.12–0.58 0.97–2.02<br />
Culture period<br />
(months)<br />
5–12 5–12 5–8 6–10<br />
Yield (tonnes/ha) 2.0–2.5 2.0–3.0 2.8–3.0 12.0–15.0<br />
Stocking density (per ha) 12 000–15 000 15 000–20 000 10 000–12 000 25 000–30 000<br />
Species ratio Major carps - 40%<br />
Chinese <strong>and</strong> common<br />
carp - 60%<br />
Types <strong>of</strong> feed used with<br />
major ingredients<br />
Mixed feed (RB,<br />
MOC, WB)<br />
Types <strong>of</strong> <strong>fertilizers</strong> used Cow dung, urea, TSP<br />
<strong>and</strong> lime<br />
Major carps - 30%<br />
Chinese carp, common<br />
carp, Java barb - 40%<br />
tilapia - 10%<br />
pangas - 20%<br />
Mixed <strong>and</strong> pellet <strong>feeds</strong><br />
(RB, MOC, WB)<br />
Cow dung, urea, TSP<br />
<strong>and</strong> lime<br />
Major carps - 30%<br />
Chinese carps - 40%<br />
prawn - 30%<br />
Mixed <strong>and</strong> pellet<br />
<strong>feeds</strong> (RB, MOC,<br />
WB, FM, BM)<br />
Cow dung, urea,<br />
TSP <strong>and</strong> lime<br />
Note: RB – rice bran, MOC – mustard oilcake, WB – wheat bran, FM – fishmeal <strong>and</strong> BM – bone meal<br />
Source: Field Survey (2005)<br />
Pangas - 90%<br />
tilapia - 10%<br />
Pellet feed<br />
(RB, MOC,<br />
WB, FM, BM<br />
vitamins,<br />
minerals)<br />
Lime
120<br />
<strong>Study</strong> <strong>and</strong> <strong>analysis</strong> <strong>of</strong> <strong>feeds</strong> <strong>and</strong> <strong>fertilizers</strong> <strong>for</strong> <strong>sustainable</strong> aquaculture development<br />
TABLE 5<br />
Characteristics <strong>of</strong> the different types <strong>of</strong> shrimp culture systems, 2002<br />
Description Extensive Improved-extensive Semi Intensive<br />
Potential area (ha) 100 000 55 000 15 000<br />
Shrimp yield (kg/ha/year) 200–400 400–800 1500–3000<br />
Farm size (ha) >5.0 1.0–5.0 0.5–1.0<br />
Stocking density (PL/m2 ) 2–4 5–8 8–15<br />
Culture period (days) 100–120 100–120 100–120<br />
Survival rate (percent) 40–50 50–60 60–70<br />
Average harvest size (g) 35 30 25<br />
Average price (BDT/kg) 350 350 300<br />
Water exchange (time/year)<br />
Expenses (BDT/ha/year)<br />
1 2 3<br />
L<strong>and</strong> rent 15 000 20 000 30 000<br />
Pond preparation 5 000 8 000 20 000<br />
Fry 15 000 32 500 57 500<br />
Lime 3 000 5 000 10 000<br />
Fertilizer 100 200 400<br />
US$1.00 = BDT 57.00 6 (2003 average exchange rate)<br />
Source: Muir (2003)<br />
multiple stocking strategies, under which PLs are stocked at 15–30 day intervals. A<br />
recent study by Muir (2003) suggests that improved organic <strong>and</strong> inorganic fertilization<br />
strategies in these smaller systems can lead to a reduction in the use <strong>of</strong> pelleted <strong>feeds</strong>.<br />
Farmers have developed several strategies to reduce risk. The most important <strong>of</strong><br />
these include the practices <strong>of</strong> multiple stocking <strong>and</strong> harvesting, stocking <strong>of</strong> larger<br />
juveniles after extensive nursing <strong>of</strong> PLs <strong>and</strong> the combined production <strong>of</strong> shrimp with<br />
prawns <strong>and</strong> carp at low salinity levels. The reduction in risk exposure has encouraged<br />
intensification using <strong>feeds</strong> <strong>and</strong> <strong>fertilizers</strong> <strong>and</strong> has led to an improvement in overall<br />
production.<br />
4. FEEDS AND FERTILIZERS USE IN AQUACULTURE<br />
4.1 Organic <strong>fertilizers</strong><br />
Cattle <strong>and</strong> buffalo manure is commonly used as a source <strong>of</strong> nutrients <strong>for</strong> fishponds in<br />
rural areas <strong>of</strong> Bangladesh, though the bulk is used <strong>for</strong> crop farming. The 8.44 million<br />
households in the country have a combined total <strong>of</strong> some 22.29 million cattle <strong>and</strong> buffalo<br />
(BCA, 1996 cited in BBS, 2004). Rural households also rear goats, sheep, chickens <strong>and</strong><br />
ducks, though the collection <strong>of</strong> manure from these animals <strong>for</strong> use as fertilizer is not<br />
a viable proposition. On a limited scale, the recent establishment <strong>of</strong> industrial scale<br />
chicken farming provides an opportunity <strong>for</strong> commercial farmers to purchase <strong>and</strong> use<br />
chicken manure in ponds. The use <strong>of</strong> biogas as a source <strong>of</strong> household energy by better<strong>of</strong>f<br />
households with relatively large numbers <strong>of</strong> livestock is also increasing. The slurry<br />
from these biogas plants may also be a good nutrient source <strong>for</strong> fishponds. A limited<br />
number <strong>of</strong> farmers use compost in fishponds, which is made using crop by-products<br />
such as water hyacinth, rice straw, urea (5–10 percent <strong>of</strong> total compost amount) <strong>and</strong><br />
lime (2–5 percent). There is considerable potential to increase the production <strong>and</strong> use<br />
<strong>of</strong> compost in fishponds, though this would require training <strong>and</strong> raising the level <strong>of</strong><br />
awareness <strong>of</strong> the value <strong>of</strong> compost <strong>for</strong> pond fertilization.<br />
A recent survey in Mymensingh District revealed that 63 percent <strong>of</strong> farmers use<br />
cow dung, <strong>and</strong> only 20 percent use compost as pond nutrient inputs. The average<br />
application rate was 6.7±6.5 tonnes per ha per year (Karim, 2006). It is well known<br />
that the nutrient content <strong>of</strong> cow <strong>and</strong> buffalo dung is lower than that <strong>of</strong> poultry manure<br />
<strong>and</strong> compost (Table 6). However, bovine manure is cheaper <strong>and</strong> more readily available<br />
6 Conversion rate <strong>of</strong> US$ <strong>and</strong> BDT was <strong>for</strong> the time when the data were collected. The present conversion<br />
rate is US$1.00 = BDT 68.00)
Analysis <strong>of</strong> <strong>feeds</strong> <strong>and</strong> <strong>fertilizers</strong> <strong>for</strong> <strong>sustainable</strong> aquaculture development in Bangladesh 121<br />
TABLE 6<br />
Nutrient content <strong>of</strong> different organic manures <strong>and</strong> their price (BDT/kg, 2005)<br />
Manure<br />
Moisture Nitrogen<br />
Nutrient content (%)<br />
Phosphorus Potassium Sulphur<br />
Price<br />
Cow dung (fresh) 60.0 0.50 0.15 0.50 - 0.50<br />
Cow dung (decomposed) 35.0 1.20 1.00 1.60 0.13 0.60<br />
Poultry manure 55.0 1.90 0.56 0.75 1.10 2.00<br />
Compost 40.0 0.75 0.60 1.00 - 2.50<br />
US$1.00 = BDT 65.00<br />
Source: BARC (2005) <strong>and</strong> Field Survey (2005)<br />
to farmers than chicken litter or compost. For this reason, the promotion <strong>of</strong> the use<br />
<strong>of</strong> cow <strong>and</strong> buffalo dung <strong>for</strong> semi-intensive aquaculture throughout the country has a<br />
greater prospect <strong>for</strong> adoption.<br />
Several different techniques are used to enhance natural productivity in nursery<br />
ponds. Farmers who do not have access to adequate quantities <strong>of</strong> animal manure rely<br />
on the decomposition <strong>of</strong> natural <strong>and</strong> / or supplementary vegetation in newly inundated<br />
ponds to provide organic nutrients <strong>for</strong> plankton production. Some nursery owners<br />
apply mustard oilseed cake to the ponds a few days be<strong>for</strong>e stocking to achieve the<br />
same effect. The application <strong>of</strong> manure <strong>and</strong> slaughterhouse waste to enhance natural<br />
productivity <strong>of</strong> nursery ponds (Field Survey, 2005) is strongly promoted. Mustard<br />
oilseed cake <strong>and</strong> rice or wheat bran are commonly used <strong>feeds</strong> <strong>for</strong> fish fry. The noningested<br />
proportion <strong>of</strong> the feed also serves as a nutrient source <strong>for</strong> primary <strong>and</strong><br />
secondary production.<br />
4.2 Non-conventional organic nutrient sources<br />
a) Solid biodegradable organic waste from urban areas<br />
This includes unused parts <strong>of</strong> vegetables, fruits, fish, meat, kitchen waste from<br />
households, markets, hospitals, restaurants, canteens, food processing plants (both<br />
in small towns <strong>and</strong> in large cities). In most instances this valuable <strong>and</strong> nutrient rich<br />
material is dumped, hence creates unhygienic conditions. Some <strong>of</strong> this waste could be<br />
used effectively <strong>and</strong> pr<strong>of</strong>itably <strong>for</strong> fish production in peri-urban areas as a source <strong>of</strong><br />
nutrients as well as supplementary feed. Regular collection <strong>and</strong> “disposal” <strong>of</strong> waste<br />
in fish ponds would contribute towards maintaining sanitary conditions in urban<br />
areas. In order <strong>for</strong> this to be effectively implemented the awareness would need to be<br />
raised among fish farmers, local authorities <strong>and</strong> the appropriate central government<br />
departments.<br />
b) Sewerage waste from urban areas<br />
Urban <strong>and</strong> peri-urban aquaculture is rapidly developing in many countries <strong>and</strong> has<br />
been stimulated principally by the proximity to markets, access to in<strong>for</strong>mation <strong>and</strong><br />
the availability <strong>of</strong> wastes (Little <strong>and</strong> Bunting, 2005). Large volumes <strong>of</strong> sewerage are<br />
disposed via drainage canals or accumulate in low l<strong>and</strong> ditches, creating substantial<br />
health problems <strong>for</strong> urban dwellers during the monsoon season when it mixes with<br />
run-<strong>of</strong>f water <strong>and</strong> enters into urban dwellings with floodwater. The problem is severe<br />
in large cities <strong>and</strong> is becoming more <strong>and</strong> more <strong>of</strong> a crisis in smaller cities throughout<br />
the country. Human waste from urban areas is disposed mainly into rivers <strong>and</strong> canals<br />
via sewerage canals, resulting in the pollution <strong>of</strong> natural waterways. This neither is a<br />
solution to the problem nor is it an acceptable environmental practise. The potential<br />
exists to ‘harvest’ this rich nutrient source <strong>for</strong> use in crop production <strong>and</strong> after initial<br />
treatment, <strong>for</strong> fish production (Bunting, Kundu <strong>and</strong> Mukherjee, 2005; Costa-Pierce et<br />
al., 2005). There are some examples <strong>of</strong> sewerage fed water bodies in urban areas used<br />
<strong>for</strong> the culture <strong>of</strong> tilapia in Bangladesh. However, these are unplanned <strong>and</strong> may pose<br />
health hazards to workers <strong>and</strong> consumers (Barman, Little <strong>and</strong> Janssen, 2003). There
122<br />
<strong>Study</strong> <strong>and</strong> <strong>analysis</strong> <strong>of</strong> <strong>feeds</strong> <strong>and</strong> <strong>fertilizers</strong> <strong>for</strong> <strong>sustainable</strong> aquaculture development<br />
is a need <strong>for</strong> scientific bodies <strong>and</strong> appropriate government departments to assess the<br />
potential <strong>of</strong> sewerage fed aquaculture <strong>and</strong>, if feasible, to draw up guidelines <strong>for</strong> the safe<br />
use <strong>of</strong> human waste in aquaculture.<br />
4.3 Inorganic <strong>fertilizers</strong><br />
Nitrogen <strong>and</strong> phosphorous in the <strong>for</strong>m <strong>of</strong> inorganic fertilizer are applied to fishponds<br />
to stimulate algal growth to increase zooplankton production. Farmers are aware <strong>of</strong> the<br />
benefits <strong>of</strong> using inorganic <strong>fertilizers</strong> such as urea, TSP <strong>and</strong> others. However, despite<br />
government subsidies, the use <strong>of</strong> inorganic <strong>fertilizers</strong> in aquaculture is limited by its<br />
price (Barman, Little <strong>and</strong> Edwards, 2002; Thompson, Sultana <strong>and</strong> Firoz Khan, 2005).<br />
The national dem<strong>and</strong> <strong>for</strong> inorganic <strong>fertilizers</strong> is estimated by the requirements <strong>for</strong><br />
crop production. The estimated amount <strong>of</strong> urea <strong>and</strong> TSP used by aquaculture is less<br />
than 5 percent <strong>of</strong> national use <strong>and</strong> hence the requirement <strong>of</strong> the sector is not considered<br />
(Table 7).<br />
Farmers who are intensifying their aquaculture operations are encouraged to use<br />
inorganic <strong>fertilizers</strong> in combination with organic manures <strong>and</strong> supplementary <strong>feeds</strong><br />
regularly. However, with experience, further intensification does not necessarily<br />
require additional inorganic fertilization. Instead, production can be increased through<br />
the application <strong>of</strong> pig manure as in Viet Nam (Barman, 2005) or through integration<br />
with ducks <strong>and</strong> pigs as in NE Thail<strong>and</strong> (Edwards <strong>and</strong> Alan, 2001).<br />
Lime is used to improve water quality <strong>and</strong> to increase productivity. The present<br />
field survey showed that farmers use lime during pond preparation <strong>and</strong> as a disinfectant<br />
prior to the winter months to prevent disease. Farmers who practise intensive pangas<br />
aquaculture apply small quantities <strong>of</strong> lime to their ponds on a monthly basis to improve<br />
water quality. Similarly, prawn farmers lime ponds prior to stocking, <strong>and</strong> at regular<br />
intervals thereafter, to facilitate moulting (DoF, 2005, Field Survey, 2005). Several types <strong>of</strong><br />
lime are available in the market <strong>for</strong> use in aquaculture <strong>and</strong> are af<strong>for</strong>dable to the farmers.<br />
Despite the excellent nutrient composition <strong>of</strong> poultry manure, Banerjee et al. (1979)<br />
<strong>and</strong> Knud-Hansen (1998) showed that 1 kg <strong>of</strong> urea <strong>and</strong> 1 kg <strong>of</strong> TSP together contain<br />
an amount <strong>of</strong> available nitrogen <strong>and</strong> phosphorus equivalent to about 100 kg <strong>of</strong> chicken<br />
manure. In addition, it is a more cost effective source <strong>of</strong> nutrients (Knud-Hansen <strong>and</strong><br />
Pautong, 1993). Nevertheless, it remains extremely difficult to convince farmers <strong>of</strong> the<br />
benefits <strong>of</strong> using inorganic <strong>fertilizers</strong>.<br />
The increased <strong>and</strong> improved use <strong>of</strong> different nutrient inputs in semi-intensive<br />
aquaculture systems has almost doubled fish production compared with conventional<br />
(improved-extensive) carp polyculture systems (Table 8).<br />
Fish production under semi-intensive culture practices can be improved further by<br />
(a) increasing awareness <strong>of</strong> the effective<br />
use <strong>of</strong> on-farm organic nutrients instead<br />
TABLE 7<br />
Current use, domestic production <strong>and</strong> inorganic <strong>fertilizers</strong><br />
imports in 2005–06 (thous<strong>and</strong> tonnes)<br />
Fertilizer Use Domestic production Imports<br />
Urea 2 875 2 000 875<br />
Triple super phosphate 585 200 385<br />
Single super phosphate 125 125<br />
Di-ammonium phosphate 550 250 300<br />
Gypsum 150 150<br />
NPKS* 117 117<br />
Zinc 30 30<br />
*Mixed fertilizer containing nitrogen, phosphorus, potassium <strong>and</strong> sulfur<br />
Source: T<strong>of</strong>azzal Mia, Deputy Director, pers. comm., DAE7 , Dhaka,<br />
Bangladesh<br />
<strong>of</strong> more expensive <strong>of</strong>f-farm nutrients<br />
<strong>and</strong> <strong>feeds</strong>; (b) improving the methods<br />
<strong>of</strong> manure <strong>and</strong> inorganic fertilizer<br />
application; (c) increasing the efficiency<br />
<strong>of</strong> the nutrients through improvements<br />
<strong>of</strong> the culture environment <strong>and</strong> (d)<br />
developing strategies <strong>and</strong> systems to<br />
harvest <strong>and</strong> use nutrients from nonconventional<br />
sources such as ‘urban<br />
organic solid waste’ <strong>and</strong> ‘sewerage waste’,<br />
in a planned manner, <strong>for</strong> <strong>sustainable</strong><br />
development <strong>of</strong> aquaculture.<br />
7 Department <strong>of</strong> Agricultural Extension, Ministry <strong>of</strong> Agriculture, Government <strong>of</strong> Bangladesh
Analysis <strong>of</strong> <strong>feeds</strong> <strong>and</strong> <strong>fertilizers</strong> <strong>for</strong> <strong>sustainable</strong> aquaculture development in Bangladesh 123<br />
TABLE 8<br />
Use <strong>of</strong> inputs (tonnes/ha/year) <strong>and</strong> comparative fish production data in two different culture systems in<br />
Mymensigh district, 2005<br />
Production<br />
systems<br />
Improvedextensive<br />
(n=24)<br />
Semiintensive<br />
(n=23)<br />
Rice<br />
bran<br />
6.83<br />
(5.41)<br />
9.36<br />
(5.29)<br />
Feed Organic fertilizer Inorganic fertilizer<br />
Wheat<br />
bran<br />
0.12<br />
(0.37)<br />
0.30<br />
(0.73)<br />
Mustard<br />
oil cake<br />
0.99<br />
(1.41)<br />
3.2<br />
(1.86)<br />
Cow dung<br />
6.55<br />
(5.94)<br />
6.37<br />
(6.58)<br />
n= number <strong>of</strong> farmers; figures in parentheses are st<strong>and</strong>ard deviations<br />
Source: Karim (2006)<br />
Poultry<br />
litter<br />
0.64<br />
(1.21)<br />
1.26<br />
(2.35)<br />
Lime TSP Urea<br />
0.08<br />
(0.12)<br />
0.14<br />
(0.16)<br />
0.04<br />
(0.09)<br />
0.27<br />
(0.25)<br />
0.03<br />
(0.03)<br />
0.62<br />
(0.30)<br />
In the context <strong>of</strong> the limited availability <strong>of</strong> <strong>feeds</strong>, the use <strong>of</strong> inorganic <strong>and</strong> organic<br />
<strong>fertilizers</strong> together with supplementary feeding <strong>of</strong>fers the best opportunity to increase<br />
total fish production by the large number <strong>of</strong> small-scale farmers practising semiintensive<br />
carp polyculture. It is, there<strong>for</strong>e, important <strong>for</strong> institutions to focus on the<br />
improvement <strong>of</strong> semi-intensive fish culture systems in Bangladesh.<br />
5. FEED INGREDIENTS AND FEEDS<br />
5.1 Cereal products <strong>and</strong> by-products<br />
A variety <strong>of</strong> cereals <strong>and</strong> cereal by-products are either used, singly or mixed, <strong>for</strong> the<br />
feeding <strong>of</strong> fish in ponds. The most commonly used feed in Bangladesh is rice bran, a<br />
by-product <strong>of</strong> the principal cereal crop <strong>of</strong> the country. Three common types <strong>of</strong> rice are<br />
grown in Bangladesh, viz. “Boro”, “Aus” <strong>and</strong> “Amon”. Boro-irrigated rice is grown<br />
in the dry season <strong>and</strong> harvested be<strong>for</strong>e the monsoon (February to April). Aus is grown<br />
in the dry season from May to August, while Amon rice is grown during the monsoon<br />
season from September to January. Production <strong>of</strong> Aus is limited compared to other<br />
two types. The three types <strong>of</strong> rice provide a year round supply <strong>of</strong> bran. National rice<br />
production figures from 1997 <strong>and</strong> 2001 are given in Table 9.<br />
Rice bran comprises five percent <strong>of</strong> the total rice yield. It is used mainly as feed <strong>for</strong><br />
cattle <strong>and</strong> buffalo <strong>and</strong> is an important ingredient in fish <strong>feeds</strong>. The nutrient quality <strong>and</strong><br />
price <strong>of</strong> rice bran varies depending on its fineness. The bran produced in automated<br />
rice mills is finer <strong>and</strong> has a higher available nutrient content in comparison with bran<br />
produced in rural husking mills. Coarse brans are about a quarter <strong>of</strong> the price <strong>of</strong><br />
the finer bran. The quality <strong>of</strong> the bran depends on freshness, storage conditions <strong>and</strong><br />
duration <strong>of</strong> storage <strong>and</strong> because it is a by-product millers normally take less care during<br />
collection <strong>and</strong> storage.<br />
The proximal composition <strong>of</strong> rice bran varies greatly <strong>and</strong> depends on the milling<br />
process <strong>and</strong> original quality. Crude protein levels range from 9.8 to 17.2 percent,<br />
crude lipid (7.7–22.4 percent), crude fibre (5.7–20.9 percent), ash (7.1–20.6 percent)<br />
<strong>and</strong> nitrogen free extract (40–41 percent). Rice bran is a good supplementary feed <strong>and</strong><br />
its high calorific value has a protein sparing effect (Xin, 1989). Fish fed on rice bran<br />
usually have a high fat content, which is desirable from a human nutrition perspective,<br />
as rural, rice-based diets in Asia are typically low in fat (Xin, 1989).<br />
TABLE 9<br />
Production <strong>of</strong> different types <strong>of</strong> rice by year in Bangladesh (thous<strong>and</strong> tonnes), 1997–2001<br />
Year Amon rice Aus rice Boro rice Total production<br />
1997–1998 8 850 1 875 8 137 18 861<br />
1998–1999 7 736 1 617 10 552 19 905<br />
1999–2000 10 306 1 734 11 027 23 067<br />
2000–2001<br />
Source: BBS (2004)<br />
11 249 1 916 11 921 25 086<br />
Fish production<br />
(tonnes/ha/year)<br />
2.99<br />
(1.47)<br />
5.83<br />
(1.91)
124<br />
<strong>Study</strong> <strong>and</strong> <strong>analysis</strong> <strong>of</strong> <strong>feeds</strong> <strong>and</strong> <strong>fertilizers</strong> <strong>for</strong> <strong>sustainable</strong> aquaculture development<br />
Considering the importance <strong>of</strong> rice bran in animal <strong>feeds</strong>, or as a single feed, it<br />
is important to maintain its quality during production, transportation <strong>and</strong> storage.<br />
Broken rice is also produced as a by-product in rice mills <strong>and</strong> is used mainly as feed<br />
<strong>for</strong> poultry but also as an ingredient in fish feed.<br />
In recent years the production <strong>of</strong> maize has increased several fold from 3 000<br />
tonnes in 1997–98 to 64 000 tonnes in 2001–2002 (BBS, 2004). In comparison to rice<br />
<strong>and</strong> wheat, the dem<strong>and</strong> <strong>for</strong> maize <strong>for</strong> direct human consumption is low. As a result,<br />
there is more scope to use maize <strong>for</strong> animal <strong>feeds</strong>, particularly <strong>for</strong> poultry. The use<br />
<strong>of</strong> maize as an ingredient in fish feed has increased in recent times especially <strong>for</strong><br />
feeding carp broodfish <strong>and</strong> during grow-out. It is also used as an ingredient <strong>for</strong> the<br />
manufacture <strong>of</strong> pelleted <strong>feeds</strong> <strong>for</strong> pangas, at inclusion rate varying between 10 to 15<br />
percent by weight. To reduce the cost <strong>of</strong> fish <strong>feeds</strong> farmers are inclined to mill their<br />
own maize flour <strong>for</strong> inclusion into <strong>feeds</strong> rather than purchasing it (Field Survey,<br />
2005).<br />
The production <strong>of</strong> wheat in 2000–2001 was 1.673 million tonnes. Wheat flour is used<br />
mainly <strong>for</strong> human consumption, though some portion (normally <strong>of</strong> inferior quality) is<br />
used as an ingredient in pelleted fish feed. Wheat flour in small proportions is also used<br />
as a feed <strong>for</strong> fish fry shortly after they are stocked into nursery ponds. The granular<br />
<strong>for</strong>m <strong>of</strong> wheat flour (suzi) is used as a feed <strong>for</strong> prawn PLs a few days after stocking into<br />
nursery ponds. Wheat bran is also used a fish feed ingredient.<br />
5.2 Oilseed by-products<br />
Oilseed cakes are important ingredients in fish <strong>feeds</strong>. Some 376 000 tonnes <strong>of</strong> various<br />
oilseed cakes were produced in 2001–02. The most important seed cakes used in fish<br />
<strong>feeds</strong> are rape <strong>and</strong> mustard oilseed cake, while groundnut, sesame <strong>and</strong> coconut seedcake<br />
are less commonly used. Rape <strong>and</strong> mustard accounted <strong>for</strong> 62 percent, while coconut<br />
comprised 23 percent, groundnut 8 percent, sesame sux percent <strong>and</strong> linseed less than<br />
one percent to total fish feed production in Bangladesh. The nutritive composition <strong>of</strong><br />
the different types <strong>of</strong> oilseed cake is presented in Table 10.<br />
The results <strong>of</strong> the field survey suggest that there is a reduction in the use <strong>of</strong> oilseed<br />
cake as a single feed by fish farmers. More <strong>of</strong>ten, farmers are now using a combination<br />
<strong>of</strong> ingredients (mustard oilcake, rice bran, wheat bran, maize bran <strong>and</strong> powder, bone<br />
meal, fishmeal, minerals, snail shell powder, vitamins). Pangas <strong>and</strong> prawn farmers are<br />
achieving higher yields using mixed <strong>feeds</strong> (Field Survey, 2005; Muir, 2003). However,<br />
with the expansion <strong>of</strong> aquaculture activities <strong>and</strong> the rapid development <strong>of</strong> intensive<br />
culture systems <strong>for</strong> pangas, tilapia <strong>and</strong> climbing perch, the overall dem<strong>and</strong> <strong>for</strong> oilseed<br />
cake in Bangladesh is increasing. Maintenance <strong>of</strong> oilseed cake quality during production<br />
<strong>and</strong> storage is also important <strong>for</strong> its effective use.<br />
5.3 Pulse powder <strong>and</strong> by-products as fish feed<br />
Other than <strong>for</strong> direct use in human nutrition, powdered pulses <strong>and</strong> by-products (bran)<br />
are largely used as livestock feed. Use <strong>of</strong> pulse powder (basan) in small proportions<br />
in <strong>for</strong>mulated pellets <strong>for</strong> Pangas has been reported. However, the scope <strong>for</strong> the use <strong>of</strong><br />
pulses is limited as the traditional production areas are now used <strong>for</strong> the cultivation <strong>of</strong><br />
rice <strong>and</strong> other crops.<br />
5.4 Weeds/grasses <strong>and</strong> plant by-products as fish feed<br />
Duckweed is commonly used as feed <strong>for</strong> Java barb <strong>and</strong> grass carp, which grows<br />
prolifically in low l<strong>and</strong> rice fields, mainly during the monsoon season, coinciding with<br />
the fish production period. The collection <strong>of</strong> duckweed is labour-intensive. In Jessore,<br />
poor people collect duckweed <strong>for</strong> sale to fish farmers (Field Survey, 2005). Generally, it<br />
grows faster in ditches or small derelict water bodies that are connected to household<br />
drainage systems where there is a good supply <strong>of</strong> nutrients.
Analysis <strong>of</strong> <strong>feeds</strong> <strong>and</strong> <strong>fertilizers</strong> <strong>for</strong> <strong>sustainable</strong> aquaculture development in Bangladesh 125<br />
Grasses in wetl<strong>and</strong> areas are used as a source <strong>of</strong> feed <strong>for</strong> grass carp, as are banana<br />
leaves (BBS, 2004). Water hyacinth is a common aquatic weed but its use as a fish feed<br />
is limited, due to its poor palatability. By-products <strong>of</strong> vegetables such as unused leaves<br />
<strong>of</strong> cabbage <strong>and</strong> radish could be used as fish feed but the production <strong>of</strong> these vegetables<br />
largely takes place during winter months when fish require less feed. However, the<br />
development <strong>of</strong> early variety <strong>of</strong> cabbage has the potential to be used as an input in fish<br />
feed due to its high production volumes, extended seasonal availability <strong>and</strong> low price.<br />
5.5 Fish feed from animal sources<br />
5.5.1 Fishmeal<br />
Fishmeal in Bangladesh is made from trash fish <strong>and</strong> other marine aquatic animals.<br />
However, it is important <strong>for</strong> the authorities to recognise the importance <strong>of</strong> this fish <strong>for</strong><br />
direct human consumption, instead <strong>of</strong> reducing it <strong>for</strong> the production <strong>of</strong> animal <strong>feeds</strong>.<br />
Fish feed millers generally use industrial fishmeal, though some purchase trash fish<br />
<strong>and</strong> other by-catch species <strong>for</strong> the manufacture <strong>of</strong> their own fishmeal. The Bangladesh<br />
Fisheries Development Corporation (BFDC) has four fishmeal production plants with<br />
a capacity to produce eight tonnes/day (Murtuza, 1998). Industrial fishmeal contains<br />
around 56 percent protein, 20 percent lipid <strong>and</strong> 2 percent crude fibre (Table 8). The<br />
amount <strong>of</strong> trash fish used in aquaculture in Bangladesh ranges between 5 000 <strong>and</strong><br />
70 000 tonnes/year (NACA/FAO, 2004).<br />
Dried fish is more readily available at the coast than in inl<strong>and</strong> areas. A more<br />
equitable distribution <strong>of</strong> fishmeal to facilitate the manufacture <strong>of</strong> animal <strong>and</strong> fish <strong>feeds</strong><br />
was addressed by a Danida (Danish International Development Assistance) supported<br />
project. The project provided transportation facilities <strong>for</strong> the movement <strong>of</strong> dried fish,<br />
which due to its smell is normally not permitted on public transport. This created a<br />
win-win situation whereby the feed producers had access to good quality dried fish,<br />
while the producer received a better price by selling their dried product directly to the<br />
users instead <strong>of</strong> an intermediary. By linking the local feed factories directly with the<br />
producers <strong>of</strong> dry fish enabled the factory to provide quality <strong>feeds</strong> at a competitive <strong>and</strong><br />
af<strong>for</strong>dable price <strong>for</strong> the farmers (Harvey, 2005).<br />
5.5.2 Bone <strong>and</strong> meat meal<br />
The use <strong>of</strong> bone <strong>and</strong> meat meals in fish feed has recently increased as an alternative<br />
to fishmeal. Large, though unspecified, quantities <strong>of</strong> bone <strong>and</strong> meat meal are now<br />
imported from several countries such as Croatia, Denmark <strong>and</strong> Belgium. The protein<br />
content <strong>of</strong> meat meal <strong>and</strong> bone meal ranged from 40–55 percent (Field Survey, 2006).<br />
5.5.3 Other sources <strong>of</strong> animal protein as feed ingredients<br />
Alternative animal sources include shrimp meal, blood meal <strong>and</strong> silkworm pupae.<br />
However, the availability <strong>of</strong> these resources is limited such that their possible use in<br />
fish <strong>feeds</strong> is at best marginal. For example, shrimp heads are used directly <strong>for</strong> human<br />
consumption.<br />
6. FEEDING PRACTICES IN RELATION TO FARMING SYSTEMS AND SPECIES,<br />
FARM-MADE FEEDS AND NUTRIENT MANAGEMENT STRATEGIES<br />
6.1 Carps<br />
Broodstock <strong>feeds</strong><br />
Two to three months prior to breeding, carp broodstock are fed a mixed, high protein<br />
feed. The composition <strong>of</strong> the feed is variable but normally consists <strong>of</strong> mustard oilcake<br />
(40 percent), rice bran/rice polish (20 percent), wheat bran (30 percent), fishmeal<br />
(9 percent) <strong>and</strong> vitamin premix 1 percent at 2 percent body weight per day. Other<br />
ingredients that may be incorporated into the broodstock maturation diet include<br />
molasses, corn flour, meat <strong>and</strong> bone meal, <strong>and</strong> fishmeal (Field Survey, 2005). Feed is
126<br />
<strong>Study</strong> <strong>and</strong> <strong>analysis</strong> <strong>of</strong> <strong>feeds</strong> <strong>and</strong> <strong>fertilizers</strong> <strong>for</strong> <strong>sustainable</strong> aquaculture development<br />
delivered as ‘wet balls’ placed in one or two specific places within the pond. To increase<br />
the availability <strong>of</strong> natural feed cow dung at 250 kg/ha, urea at 50 kg/ha <strong>and</strong> TSP at<br />
25 kg/ha are applied after mixing with water.<br />
Larval <strong>feeds</strong><br />
Feeding <strong>of</strong> carp larvae starts after yolk sac absorption (32–48 hours after hatching<br />
depending on temperature). The larvae are commonly fed on hardboiled chicken<br />
or duck egg yolk. Two egg yolks suffice <strong>for</strong> 0.4–0.5 million larvae. The egg yolk is<br />
mixed with water, spread over the rearing tanks, <strong>and</strong> applied four times daily at six<br />
hourly intervals until 4–5 days after hatching, after which they are <strong>of</strong>fered <strong>for</strong> sale.<br />
Zooplankton (rotifers <strong>and</strong> cladocerans) are the main natural food items <strong>of</strong> the larvae<br />
in nursery ponds. To enhance zooplankton production farmers fertilise their ponds<br />
in various ways. The most commonly applied <strong>fertilizers</strong> are cow dung, urea <strong>and</strong> TSP<br />
at variable rates (Saha et al., 1989, Miah et al., 1996), depending on availability. Goat<br />
litter <strong>and</strong> fermented / decomposed mustard oilseed cake can also be applied prior to<br />
stocking. It is generally recommended that the litter <strong>of</strong> one goat is adequate <strong>for</strong> 40m 2<br />
pond surface area or 85 kg/ha <strong>of</strong> decomposed oilseed cake.<br />
TABLE 10<br />
Chemical composition (percent dry matter) <strong>of</strong> major feed ingredients in Bangladesh<br />
Ingredients<br />
Dry<br />
matter<br />
Crude<br />
protein<br />
Crude<br />
lipid<br />
Ash<br />
Crude<br />
fibre<br />
NFE 1<br />
Gross energy<br />
(kcal/kg)<br />
Feed ingredients <strong>of</strong> animal origin<br />
Fishmeal 91.8 56.4 19.7 19.5 2.2 2.2 4 365<br />
Fish silage 90.1 56.8 7.5 12.2 6.5 17.0 5 432<br />
Blood meal 90.8 92.9 0.3 6.3 0.5 - 4 250<br />
Silkworm pupae meal 91.2 61.1 24.8 6.7 4.3 3.2 5 939<br />
Poultry <strong>of</strong>fal meal 89.8 75.5 16.3 7.3 1.0 -<br />
Bone meal 92.5 17.5 5.2 65.7 3.5 8.1 1 988<br />
Meat <strong>and</strong> bone meal2 90.9 55.6 12.34 29.7 NA3 -<br />
Protein concentrate4 Feed ingredients <strong>of</strong> plant origin<br />
91.6 61.0 11.5 18.1 NA -<br />
Soybean meal 91.4 45.2 20.5 6.2 5.0 23.1<br />
Sesame meal 92.0 33.3 8.4 14.9 24.0 19.5 4 743<br />
Mustard oil cake 93.0 36.5 11.2 9.2 11.6 31.5 4 978<br />
Linseed meal 90.9 39.0 6.7 12.8 9.1 32.5 4 386<br />
Coconut oil cake 95.5 18.2 10.2 6.5 11.7 53.5 4 723<br />
Cotton seed meal 87.6 35.7 17.1 6.1 18.3 22.8<br />
Cotton seed oil cake 90.9 22.7 6.2 11.7 29.9 29.5<br />
Rice 87.4 8.4 2.1 1.0 1.6 86.9<br />
Rejected broken rice 86.6 10.6 2.1 2.2 3.1 82.1<br />
Rice bran 90.0 12.6 16.5 13.6 16.3 40.9 4 235<br />
Wheat bran 88.5 18.2 4.4 4.8 14.0 58.6 4 488<br />
Wheat flour 93.2 12.5 1.3 2.1 2.1 75.6 4 488<br />
Broken maize 87.9 11.3 5.0 2.5 2.8 78.4<br />
Lentil bran 84.3 19.5 0.5 7.3 25.9 46.9 4 286<br />
Black gram bean meal 12.9 18.8 0.6 7.5 22.8 50.5 4 252<br />
Mung bean bran (green gram) 87.9 8.1 2.9 10.6 37.5 41.0<br />
Grass pea bran 87.5 11.0 1.8 8.1 38.8 40.4<br />
Black gram bran 87.5 17.9 2.4 7.4 24.3 48.0<br />
Field pea bran 89.2 11.4 1.0 5.8 39.6 42.3<br />
Leucaena meal (unsoaked) 90.0 27.2 6.3 6.6 19.4 40.5<br />
Leucaena meal (soaked) 5 90.2 29.6 5.3 4.4 18.8 41.9<br />
Water hyacinth leaf meal 94.3 25.6 1.1 11.7 17.2 44.4 4 031<br />
Duck weed meal 94.9 17.6 1.4 38.1 8.1 34.8 3 969<br />
Molasses 31.7 4.5 0 11.9 0 83.6 3 624<br />
1 NFE = Nitrogen free extract; 2imported, country <strong>of</strong> origin Australia; 3NA = not analyzed; 4imported, country <strong>of</strong> orgin USA;<br />
5 0 leucaena leaves were soaked in water at ambient temperature (25–28 C) <strong>for</strong> 48 hours to reduce the mimosine content <strong>of</strong> the leaf<br />
Source: Hasan, Alam <strong>and</strong> Islam (1989); Zaher <strong>and</strong> Mazid (1994); Hasan, Roy <strong>and</strong> Ak<strong>and</strong> (1994); Hossain (1996); Faruque (2006)
Analysis <strong>of</strong> <strong>feeds</strong> <strong>and</strong> <strong>fertilizers</strong> <strong>for</strong> <strong>sustainable</strong> aquaculture development in Bangladesh 127<br />
TABLE 11<br />
Feeds used in carp nursery ponds, 2005<br />
Duration<br />
Type <strong>of</strong> feed<br />
(days)<br />
Amount <strong>of</strong> feed<br />
(x weight <strong>of</strong> hatchlings stocked )<br />
Frequency <strong>of</strong> feed use<br />
(no./day)<br />
Wheat flour 3 3* 3<br />
Wheat flour <strong>and</strong> mustard<br />
oilcake**<br />
4 4 2<br />
Mustard oilcake <strong>and</strong> rice bran 7 5–7 2<br />
Mustard oilcake, rice<br />
bran/wheat bran<br />
7 8–10 2<br />
*Amount <strong>of</strong> feed used = 3 times the weight <strong>of</strong> the hatchlings stocked, **Ratio <strong>of</strong> ingredients in all feed mixtures<br />
are usually 1:1.<br />
Source: Field Survey (2005)<br />
Nursery management<br />
To improve survival <strong>and</strong> growth, carp nursery ponds are limed (250 kg/ha) <strong>and</strong> fertilised<br />
(cow dung 5 – 7 tonnes/ha, urea 50 kg/ha <strong>and</strong> TSP 25 kg/ha) prior to the introduction<br />
<strong>of</strong> early juvenile fish. An insecticide (sumithion or dipterex) is also applied 16–24 hours<br />
be<strong>for</strong>e stocking to remove insects <strong>and</strong> larger zooplankton that may predate on the<br />
larvae. After stocking, the larvae are fed at regular intervals <strong>for</strong> 3 weeks until the late<br />
juvenile stage (Field Survey, 2005) (Table 11).<br />
At the end <strong>of</strong> the three-week nursery period, the fry are transferred to separate<br />
ponds at a lower density (thinning out) <strong>and</strong> grown to fingerlings <strong>for</strong> sale. During this<br />
period, they are normally fed a diet consisting <strong>of</strong> mustard oilcake (50 percent) <strong>and</strong> rice<br />
bran/wheat bran (50 percent) at a rate <strong>of</strong> 10–12 percent <strong>of</strong> body weight per day <strong>and</strong><br />
fed twice daily. In addition, inorganic <strong>and</strong> organic <strong>fertilizers</strong> such as cow dung 275–<br />
500 kg/ha, urea 8.5 kg/ha <strong>and</strong> TSP 5.0–6.2 kg/ha are applied at weekly intervals. Be<strong>for</strong>e<br />
application, cow dung <strong>and</strong> TSP are soaked in water overnight. Urea is then added <strong>and</strong><br />
the mixture is applied to the pond be<strong>for</strong>e noon.<br />
Carp grow-out systems<br />
Carp grow-out is practised either under “improved-extensive” (in flooded rice fields or<br />
oxbow lakes) or under semi-intensive culture conditions in ponds. In the semi-intensive<br />
systems, <strong>feeds</strong> are used to supplement natural food to achieve higher yields. Generally,<br />
several carp species are farmed under polyculture conditions <strong>and</strong> this has been strongly<br />
promoted throughout the country. Semi-intensive polyculture <strong>of</strong> carp has yielded good<br />
results in communal ponds where the water is used <strong>for</strong> various purposes, particularly in<br />
rural areas <strong>of</strong> Bangladesh (ADB, 2005). Studies in the districts <strong>of</strong> Kapasia <strong>and</strong> Sreepur<br />
revealed that the average level <strong>of</strong> pond inputs were similar to those recommended by<br />
the extension services with the exception <strong>of</strong> lime, which many did not apply be<strong>for</strong>e<br />
stocking. The majority <strong>of</strong> pond owners use cow dung from their own sources <strong>and</strong><br />
about 50 percent <strong>of</strong> farmers used urea. Rice bran is used as a supplementary feed by<br />
most farmers <strong>and</strong> is purchased from the local market. Where af<strong>for</strong>dable, farmers also<br />
use mustard oilseed cake (Thompson, Sultana <strong>and</strong> Firoz Khan 2005).<br />
Several feeding methods are used by farmers in rural areas. Farmers will either<br />
feed their fish on a daily basis by spreading the feed over the surface, while others<br />
fill per<strong>for</strong>ated bags with a mixture <strong>of</strong> mustard oilseed cake, wheat bran <strong>and</strong> auto rice<br />
bran 8 . These are suspended in the water using bamboo poles <strong>for</strong> 7–10 days rather than<br />
applying feed on a daily basis. Alternatively, ingredients such as mustard oilseed cake<br />
(50 percent) <strong>and</strong> rice/wheat bran (50 percent) are mixed <strong>and</strong> kneaded into wet dough<br />
<strong>and</strong> fed to the fish every 3 to 4 days at a rate <strong>of</strong> 2–3 percent <strong>of</strong> body mass twice per<br />
day, in the morning <strong>and</strong> evening. Most <strong>of</strong> the more entrepreneurial farmers use semi-<br />
8 Rice bran produced from automatic rice mill. These rice brans are finely milled <strong>and</strong> have a better nutrient<br />
content.
128<br />
<strong>Study</strong> <strong>and</strong> <strong>analysis</strong> <strong>of</strong> <strong>feeds</strong> <strong>and</strong> <strong>fertilizers</strong> <strong>for</strong> <strong>sustainable</strong> aquaculture development<br />
TABLE 12<br />
Feed <strong>and</strong> fertilizer use, production <strong>and</strong> income <strong>of</strong> entrepreneurial carp polyculture farmers in<br />
different areas in Bangladesh, 2005<br />
Categories/types Specifications<br />
Pond area (ha) (mean± SD) 2.1±2.0<br />
Species (polyculture) Indian major carps, Chinese carps, Java barb, common<br />
carp <strong>and</strong> pangas.<br />
Fertilizers Lime, cow dung, urea, TSP<br />
Feed ingredients (proportion in the feed ) Rice bran 20–50%, oilcake 25–70%, maize 10–50% <strong>and</strong><br />
wheat bran 10–50%<br />
Feed ingredients used (% <strong>of</strong> respondent) Rice bran 60%, oilcake 100%, maize 65%, wheat bran<br />
20%<br />
Feeding frequency (times per day) Once (most common)<br />
Once every alternative day (rarely)<br />
Amount <strong>of</strong> feed used per farmer (kg/day) 10–35<br />
Culture period (months) 5–12<br />
Total feed use (tonnes) (mean ± SD) 3.2±2.1<br />
Total expenditure <strong>for</strong> feed (BDT) (mean ± SD) 35 000±17 000<br />
Price <strong>of</strong> feed (BDT/kg) 7.00–10.00<br />
Total fish production (tonnes) (mean ± SD) 6.2±5.8<br />
Yield <strong>of</strong> fish (tonnes/ha) (mean ± SD) 3.6±1.1<br />
Price <strong>of</strong> fish (BDT/kg) 38.00–55.00<br />
Total income per farmer (BDT/year) 90 000–1 200 000<br />
SD = st<strong>and</strong>ard deviation; US$1.00 = BDT 65.00<br />
Source: Field Survey (2005).<br />
intensive systems <strong>of</strong> production with higher levels <strong>of</strong> organic <strong>and</strong> inorganic fertilization<br />
<strong>and</strong> supplementary feeding. Their yield <strong>and</strong> income is significantly higher than that <strong>of</strong><br />
the average farmer (cf. Tables 4 <strong>and</strong> 12).<br />
6.2 Pangas<br />
Hatchery <strong>and</strong> nursery<br />
Pangas hatcheries are located mainly in the Bogra District in northern Bangladesh.<br />
Pangas fry <strong>and</strong> fingerling production has developed into a major activity in this area<br />
at the expense <strong>of</strong> carp hatcheries. This change has been brought about mainly by the<br />
higher price <strong>for</strong> pangas seed <strong>and</strong> improved transport <strong>and</strong> communication infrastructure.<br />
Pond area <strong>of</strong> pangas hatcheries ranges from 0.2–6.2 ha, while the total amount <strong>of</strong> <strong>feeds</strong><br />
used <strong>for</strong> the management <strong>of</strong> broodfish varies from 5–40 tonnes per annum per farm.<br />
Feed expenditure amounts to between 60 <strong>and</strong> 70 percent <strong>of</strong> total hatchery expenditure.<br />
The hatcheries produce up to 20 million pangas hatchlings per season. Some <strong>of</strong> the<br />
hatcheries also produce hybrid catfish seed. There have also been substantial advances<br />
in pangas broodstock management. Instead <strong>of</strong> only using mustard oilseed cake <strong>and</strong><br />
bran, farmers now use mixed <strong>feeds</strong> containing up to 11 different ingredients (Table 13).<br />
This has resulted in improved seed quality <strong>and</strong> survival (Field Survey, 2005).<br />
TABLE 13<br />
Composition <strong>of</strong> pangas broodstock feed in Bogra District, 2005<br />
Ingredients<br />
Proportion in feed mixture (%)<br />
Minimum Maximum<br />
Rice bran<br />
30<br />
91<br />
Mustard oilcake<br />
1<br />
10<br />
Corn flour<br />
3<br />
10<br />
Broken rice<br />
0<br />
10<br />
Pulse flour<br />
0<br />
5<br />
Wheat bran<br />
4<br />
10<br />
Fishmeal<br />
2<br />
10<br />
Bone meal<br />
2<br />
5<br />
Salt<br />
0<br />
3<br />
US$1.00=BDT 65.00<br />
Source: Field Survey (2005)<br />
Price (BDT/kg)<br />
11.0<br />
12.0<br />
11.0<br />
7.5<br />
40.0<br />
12.0<br />
32.0<br />
10.0<br />
10.0
Analysis <strong>of</strong> <strong>feeds</strong> <strong>and</strong> <strong>fertilizers</strong> <strong>for</strong> <strong>sustainable</strong> aquaculture development in Bangladesh 129<br />
Pangas larvae <strong>and</strong> early juveniles are reared in aluminium trays on mixed <strong>feeds</strong><br />
using ingredients such as egg yolk, wheat flour, pulse powder, refined dried fish<br />
powder <strong>and</strong> vitamin premix. Some hatcheries also feed the larvae on a paste consisting<br />
<strong>of</strong> rotifers, egg yolk <strong>and</strong> fresh fish, at two hour intervals (Field Survey, 2005). For<br />
the first 15 days after stocking the early juveniles are fed on wheat flour mixed with<br />
eggs <strong>and</strong> then on mixed <strong>feeds</strong> (rice bran, boiled broken rice, corn flour, wheat flour,<br />
mustard oilcake <strong>and</strong> vitamin premix). Only some farmers use commercial pelleted<br />
<strong>feeds</strong> <strong>for</strong> fry nursing. Pangas fingerlings in the Bogra district are sold when they are<br />
2 to 3 cm in length. Farmers purchase seed directly from the hatcheries, generally in<br />
large numbers <strong>of</strong> at least 0.2–0.3 million at a time <strong>and</strong> stock them in their own nursery<br />
ponds be<strong>for</strong>e transferring them to grow-out ponds. Purchasing seed <strong>of</strong> this size reduces<br />
transport stress <strong>and</strong> mortality. In the (secondary) nursery ponds they are fed either on<br />
commercial pelleted <strong>feeds</strong> or farm-made, mixed, non-pelleted feed.<br />
Pangas grow-out systems<br />
The grow-out <strong>of</strong> pangas is mainly pond based. Fingerlings are stocked at between<br />
25 000 <strong>and</strong> 75 000 fingerlings/ha. Grow-out periods range from 5–6 months to 8–10<br />
months. For optimum feed utilization the fish are grown in polyculture with several<br />
carp species <strong>and</strong> Nile tilapia. This practise also increases production <strong>and</strong> income.<br />
Pangas production largely depends on the use <strong>of</strong> <strong>for</strong>mulated pelleted <strong>feeds</strong>, though<br />
farm-made <strong>feeds</strong> are also used. Consequently, there are numerous local feed mills in the<br />
pangas farming areas. The reported annual yield in Mymensingh <strong>and</strong> Comilla districts<br />
is in the region <strong>of</strong> 27 tonnes <strong>of</strong> pangas, four tonnes <strong>of</strong> tilapia <strong>and</strong> one tonne <strong>of</strong> carps per<br />
ha/year. The ingredients used <strong>for</strong> pangas pelleted <strong>feeds</strong> vary widely between farmers<br />
<strong>and</strong> amongst industrial pellet manufacturers. Normally 7– 8 types <strong>of</strong> ingredients are<br />
used. Fine rice bran from industrial rice mills, mustard oilseed cake, wheat bran, fish,<br />
squid or crustacean meal <strong>and</strong> wheat flour are the major ingredients. In addition, maize<br />
flour, snail or mussels shell powder, bone or meat meal, vitamin <strong>and</strong> mineral premix are<br />
also used (Field Survey, 2005). Ration size, the types <strong>of</strong> feed, price, feeding frequency<br />
<strong>and</strong> food conversion ratio’s are illustrated in Tables 14 <strong>and</strong> 15.<br />
The market has responded positively in supplying the increasing dem<strong>and</strong> <strong>for</strong> fish<br />
feed ingredients <strong>and</strong> compound <strong>feeds</strong>. Farmers are able to obtain several different<br />
ingredients directly from local markets or<br />
from feed millers. Some farmers use their<br />
own pellet making machines, while others,<br />
who do not own the necessary machinery,<br />
supply the ingredients to millers who prepare<br />
the <strong>feeds</strong> to their specifications (Figure 3).<br />
Farm-made <strong>feeds</strong> <strong>and</strong> <strong>feeds</strong> produced by<br />
local millers are cheaper than the industrially<br />
available <strong>feeds</strong> (Figure 4). However, many<br />
TABLE 14<br />
Pangas rations during the grow-out cycle in<br />
ponds in Trishal, Mymensingh, 2002<br />
Size <strong>of</strong> fish (g/fish) Ration (% body weight)<br />
500 3<br />
Source: Muir (2003)<br />
TABLE 15<br />
Feeds used in pangas grow-out in Mymensingh, Narshindi, Comilla <strong>and</strong> Dinajpur districts, 2005<br />
Type <strong>of</strong> feed Source<br />
Price<br />
(BDT/kg)<br />
Feeding frequency<br />
(no./day)<br />
Commercial pellet<br />
feed<br />
Commercial aquafeed industry 16–22 2 1.8–2.0<br />
Commercial Pellet<br />
feed<br />
Small local feed manufacturers 14.00 2 2.0–2.2<br />
Pellet feed Farm-made or made in rice mill<br />
facilities<br />
12.00 2 2.0–2.5<br />
Mixed non-pelleted<br />
<strong>feeds</strong><br />
Farm-made 5–10 2 -<br />
US$1.00 = BDT 65.00<br />
Source: Field Survey (2005)<br />
FCR
COURTESY OF BIBHU BHUSAN MOJUMDAR<br />
130<br />
FIGURE 3<br />
Ground mixed feed ingredients ready <strong>for</strong><br />
pelleting in a small pellet machine<br />
<strong>Study</strong> <strong>and</strong> <strong>analysis</strong> <strong>of</strong> <strong>feeds</strong> <strong>and</strong> <strong>fertilizers</strong> <strong>for</strong> <strong>sustainable</strong> aquaculture development<br />
FIGURE 4<br />
On-farm pelleted <strong>feeds</strong> ready to be applied to<br />
pangas ponds<br />
farmers are aware <strong>of</strong> the nutritional requirements <strong>of</strong> the fish such that fish production<br />
using farm-made <strong>feeds</strong> is <strong>of</strong>ten inferior to that achieved using industrial pellets. Semiintensive<br />
pangas culture has also developed in areas outside <strong>of</strong> the traditional clustered<br />
pangas farming areas as in Mymensingh, Narshingdi, Tangail, Kishorgonj <strong>and</strong> Bogra<br />
districts. Farmers in these areas, e.g. Dinajpur <strong>and</strong> Comilla Districts use mainly farmmade<br />
<strong>feeds</strong> composed <strong>of</strong> various combinations <strong>of</strong> rice bran, maize powder, oilcake,<br />
boiled broken rice, biogas slurry <strong>and</strong> occasionally dry fish powder, vitamins <strong>and</strong><br />
mineral premix. The price <strong>of</strong> feed varies between BDT 5.00–8.00/kg. Similar to their<br />
counterparts elsewhere, farmers in the more isolated pangas growing regions also use<br />
lime during pond preparation as well as urea <strong>and</strong> TSP at regular intervals. Production<br />
costs are lower in the more isolated areas than in the clustered areas, though production<br />
per unit area is lower at approximately 5 to 8 tonnes/ha/year.<br />
6.3 Shrimp<br />
Shrimp hatcheries <strong>and</strong> nurseries<br />
The production <strong>of</strong> shrimp post-larvae (PL) in hatcheries is very successful <strong>and</strong> supply<br />
reportedly exceeds dem<strong>and</strong>. It is important to note that most <strong>of</strong> the high cost <strong>feeds</strong><br />
used <strong>for</strong> larval rearing is imported. Almost all hatcheries purchase brood shrimp from<br />
trawlers, varying in size from 60–150g <strong>and</strong> price from BDT 1500 to 2500 per piece.<br />
After capture, they are kept in broodstock rearing tanks <strong>for</strong> 5–7 days until the gonad<br />
maturation process is completed. During this period they are fed on mixed <strong>feeds</strong><br />
consisting <strong>of</strong> crab muscle, cow liver, squid muscle <strong>and</strong> mussel meat as well as <strong>for</strong>mulated<br />
<strong>feeds</strong>. Most <strong>of</strong> the hatcheries use algae, produced in their own facilities, to feed the<br />
larvae as well as other types <strong>of</strong> plankton purchased on the market. Various imported<br />
<strong>feeds</strong>, including Artemia, (Table 16) are used <strong>for</strong> PL rearing. Annual production <strong>of</strong> PLs<br />
varies from 100–300 million per hatchery.<br />
TABLE 16<br />
Feed used <strong>for</strong> final maturation <strong>of</strong> shrimp broodstock, larval <strong>and</strong> post-larval rearing in hatcheries at Cox’s<br />
bazaar, 2005<br />
Amount <strong>and</strong> feeding<br />
Shrimp Type <strong>of</strong> <strong>feeds</strong> Price <strong>of</strong> feed (BDT/kg)<br />
frequency<br />
Broodstock Crab muscle, cow liver,<br />
squid muscle, mussel meat<br />
Larvae Algae (diatom) <strong>and</strong> other<br />
commercial <strong>feeds</strong><br />
Post-larvae Artemia nauplii 40%,<br />
brine shrimp flake <strong>and</strong><br />
mixed feed 60 %<br />
Source: Field Survey (2005)<br />
Crab 40–45, Cow liver 120, squid 70–90<br />
<strong>and</strong> mussel meat 40–45<br />
Algae from own source <strong>and</strong> Spirulina<br />
powder 3 000<br />
Artemia 3 500, brine shrimp flake 1 500<br />
<strong>and</strong> mixed feed 400<br />
10% <strong>of</strong> body weight <strong>of</strong><br />
shrimp, applied 4 times/day<br />
6 times/day until post-larval<br />
stage<br />
15–16 days after reaching<br />
post-larval stage in nursing<br />
tanks<br />
COURTESY OF BIBHU BHUSAN MOJUMDAR
Analysis <strong>of</strong> <strong>feeds</strong> <strong>and</strong> <strong>fertilizers</strong> <strong>for</strong> <strong>sustainable</strong> aquaculture development in Bangladesh 131<br />
There are no facilities dedicated solely to PL nursing. Nursing is carried out in<br />
small sections <strong>of</strong> the gher <strong>for</strong> a short period (PL 11–15). These are called pocket nurseries.<br />
PLs are stocked in the pocket nurseries <strong>for</strong> 4–7 days whereafter the outlet is opened<br />
<strong>and</strong> PLs are allowed to enter into the gher. The process <strong>of</strong> stocking PLs in the pocket<br />
nurseries <strong>and</strong> then transferring them to grow-out facilities is normally repeated at<br />
15 day intervals <strong>and</strong> continued throughout the production season from February to<br />
September. Be<strong>for</strong>e stocking PLs into the pocket nurseries (≈ 0.04 ha), 500g bleaching<br />
powder, 4 kg lime, 2 kg urea <strong>and</strong> 1.5 kg TSP are applied. Within 5–6 days <strong>of</strong> urea<br />
<strong>and</strong> TSP application, the colour <strong>of</strong> the water becomes light green <strong>and</strong> is then ready<br />
<strong>for</strong> stocking <strong>of</strong> PLs. In the pocket nurseries <strong>for</strong>mulated granular powdered <strong>feeds</strong> are<br />
used (e.g. Tiger br<strong>and</strong> feed <strong>of</strong> CP Feed Ltd.). The feed contains 42 percent protein,<br />
8 percent lipid <strong>and</strong> 10 percent moisture. The amount <strong>of</strong> feed used is 200g <strong>for</strong> every<br />
0.1 million PLs twice per day at 07.00 <strong>and</strong> 19.00 hours. The price <strong>of</strong> granular feed is<br />
around BDT 75.00/kg. The feed is moistened be<strong>for</strong>e use <strong>and</strong> applied by spreading it<br />
along the shallow ends <strong>of</strong> the nursery pond. Wheat flour was used previously even<br />
though mortalities <strong>of</strong>ten reached 50 percent. The use <strong>of</strong> <strong>for</strong>mulated granular feed has<br />
significantly increased the survival rate <strong>of</strong> PLs.<br />
Shrimp grow-out systems<br />
Shrimp grow-out in large gher systems in both Cox’s bazaar <strong>and</strong> Sathkira is an extensive<br />
operation <strong>and</strong> production depends almost entirely on fertilization <strong>and</strong> natural food, with<br />
a limited measure <strong>of</strong> supplementary feeding. Shrimp production in large gher’s rarely<br />
exceeds 150 kg/ha. Previous studies on shrimp grow-out (Muir, 2003) also reported<br />
low levels <strong>of</strong> pond inputs. Sixty four percent <strong>of</strong> farmers applied small quantities <strong>of</strong><br />
pre-stocking inputs <strong>and</strong> only 41 percent applied some <strong>for</strong>m <strong>of</strong> post-stocking inputs,<br />
such as lime, urea, cow dung, rice/wheat bran, fishmeal <strong>and</strong> oil cake (Muir, 2003). The<br />
recent field survey confirmed these findings. Farmers who use small to medium size<br />
ghers have adapted their technologies to a semi-intensive scale <strong>of</strong> operation. The size <strong>of</strong><br />
large ghers located in Cox’s Bazaar <strong>and</strong> Sathkhira Districts vary between 32 <strong>and</strong> 138 ha.<br />
In this area shrimp culture is alternated with salt production <strong>and</strong> the culture period is<br />
6–7 months. In Sathkhira, the ghers are used only <strong>for</strong> shrimp production. PL stocking<br />
densities vary from 0.7–3.1/m 2 . The first harvest occurs 3 months after stocking, when<br />
the shrimp range in size <strong>for</strong>m 100 to 65g (10–15 shrimp/kg). At such a size the price<br />
varies from BDT 400–600/kg <strong>and</strong> production varies from 63–150 kg/ha. Large ghers<br />
are generally prepared using lime at 31 kg/ha <strong>and</strong> cow dung at 250 kg/ha. Inorganic<br />
<strong>fertilizers</strong> such as urea (@ 2.5–5.0 kg/ha) <strong>and</strong> TSP (2.5 kg/ha) are diluted <strong>and</strong> spread<br />
throughout the gher area by boat <strong>and</strong> applied at one month intervals. Rice bran or<br />
wheat bran at 5–6 kg/ha is used as supplementary feed. The bran is soaked in water <strong>for</strong><br />
12 hours be<strong>for</strong>e it is applied in the evenings at 8 – 15 day intervals.<br />
Small <strong>and</strong> medium ghers vary in size between 0.67 <strong>and</strong> 2.67 ha. They are used<br />
<strong>for</strong> monoculture <strong>of</strong> P. monodon or polyculture <strong>of</strong> shrimp in combination with M.<br />
rosenbergii <strong>and</strong> several carp species. Production is higher than in the large ghers<br />
<strong>and</strong> ranges from 500 to 1000 kg/ha under monoculture <strong>and</strong> polyculture conditions,<br />
respectively. Rice <strong>and</strong> wheat bran, mustard<br />
oilseed cake <strong>and</strong> commercial pellets are used<br />
as feed, though the amount <strong>and</strong> frequency <strong>of</strong><br />
feeding varies greatly amongst farmers. All<br />
farmers with small <strong>and</strong> medium size ghers use<br />
organic <strong>and</strong> inorganic <strong>fertilizers</strong>, including<br />
cow dung, poultry droppings, urea <strong>and</strong> TSP to<br />
increase natural productivity. Lime, urea <strong>and</strong><br />
TSP are used as pre- <strong>and</strong> post-stocking inputs<br />
(Table 17).<br />
TABLE 17<br />
Use <strong>of</strong> organic <strong>and</strong> inorganic <strong>fertilizers</strong> in small <strong>and</strong><br />
medium size ghers per grow-out cycle, 2005<br />
Input<br />
Pre-stocking<br />
(kg/ha)<br />
Post-stocking<br />
(kg/ha)<br />
Lime 63–250 15–62<br />
Urea 6–42 6–125<br />
TSP 0–15 30–37<br />
Cow dung 4 000<br />
Poultry dropping 1 250<br />
Source: Field Survey (2005)
132<br />
<strong>Study</strong> <strong>and</strong> <strong>analysis</strong> <strong>of</strong> <strong>feeds</strong> <strong>and</strong> <strong>fertilizers</strong> <strong>for</strong> <strong>sustainable</strong> aquaculture development<br />
6.4 Prawns<br />
Hatcheries<br />
Prawn hatchery operators use <strong>for</strong>mulated granular <strong>feeds</strong> produced by local feed<br />
manufacturers <strong>for</strong> the production <strong>of</strong> post-larval M. rosenbergii. The prawn broodstock<br />
is stocked in separate ponds four months be<strong>for</strong>e use in the hatchery <strong>and</strong> are fed<br />
regularly with granular <strong>feeds</strong> at a rate <strong>of</strong> 6 percent body weight, twice a day. Feeding<br />
trays are used to check <strong>and</strong> adjust the amount <strong>of</strong> feed required. A proportion <strong>of</strong> feed<br />
is also applied outside the trays to ensure feeding <strong>of</strong> all prawns in the pond. To induce<br />
the broodstock to feed more, the granular feed is alternated with farm-made <strong>feeds</strong><br />
<strong>for</strong> 1–2 days at 15–20 day intervals. These farm-made feed generally include auto rice<br />
bran (30 percent), wheat bran (10 percent), mustard oilseed cake (25 percent), fishmeal<br />
(30 percent) <strong>and</strong> molasses (5 percent).<br />
Twelve hours after hatching the larvae are fed Artemia nauplii, at a rate <strong>of</strong> 25g<br />
Artemia per 200 000 larvae <strong>for</strong> the first 10 days, whereafter the feeding rate is doubled<br />
until day 30. The Artemia is supplemented with farm-made chicken or duck egg<br />
custard. After 30 days the PLs are ready <strong>for</strong> sale. The greater proportion <strong>of</strong> prawn PLs<br />
used in Bangladesh are however still collected from the wild, so there is great potential<br />
<strong>for</strong> the development <strong>of</strong> additional prawn hatcheries. However feed costs are high <strong>and</strong><br />
this calls <strong>for</strong> the development <strong>of</strong> alternative cheaper <strong>feeds</strong>.<br />
Nursing <strong>of</strong> post-larvae<br />
Laxmipur <strong>and</strong> Noakhali Districts are the major prawn nursery areas. The duration<br />
<strong>of</strong> the nursery period ranges from 1–3 months <strong>and</strong> farmers normally use small (0.02<br />
to 0.07 ha), shallow (90 – 100cm) ponds as nurseries, which are integrated with crop<br />
farming in one way or another. PLs are stocked at a density <strong>of</strong> 25–35 PLs/m 2 . All<br />
nursery operators apply lime to their ponds as a pre- <strong>and</strong> post-stocking management<br />
strategy at 150–250 kg/ha <strong>and</strong> 13–150 kg/ha, respectively. Some also use cow dung at<br />
250–800 kg/ha, urea at 13 kg/ha <strong>and</strong> TSP 13.0 kg/ha but only as pre-stocking inputs.<br />
During the nursery period the juvenile prawns are fed on a variety <strong>of</strong> <strong>feeds</strong>, such as<br />
wheat flour (local name: suzi), broken rice or mixed <strong>feeds</strong> (mustard oilcake, wheat bran,<br />
wheat flour <strong>and</strong> fishmeal) as well as farm-made pelleted or commercial <strong>feeds</strong>. Higher<br />
survival rates are obtained with the use <strong>of</strong> <strong>for</strong>mulated pelleted <strong>feeds</strong>.<br />
TABLE 18<br />
Formulation (%) <strong>and</strong> price (BDT/kg) <strong>of</strong> low cost prawn diets<br />
Diet 1 Diet 2 Diet 3<br />
Ingredient Inclusion<br />
(%)<br />
Fishmeal<br />
(local)<br />
Meat <strong>and</strong><br />
bone meal<br />
Full-fat<br />
soybean<br />
Mustard<br />
oilcake<br />
% protein Price<br />
(BDT/kg)<br />
Inclusion<br />
( %)<br />
% protein Price<br />
(BDT/kg)<br />
Inclusion<br />
(%)<br />
%<br />
protein<br />
Price<br />
(BDT/kg)<br />
15 9.34 3.75 15 9.34 3.75 10 6.23 2.50<br />
- - - 8 4.09 1.52 5 2.55 0.95<br />
10 4.29 1.70 - - - 10 4.29 1.70<br />
15 5.65 2.10 15 5.65 2.10 14 5.27 1.96<br />
Maize 15 1.45 1.65 15 1.45 1.65 20 1.93 2.20<br />
Rice bran 25 1.98 2.13 27 2.14 2.30 12 0.95 1.02<br />
Wheat bran 10 1.72 1.10 10 1.72 1.10 19 3.28 2.09<br />
Wheat flour 5 0.64 0.75 5 0.64 0.75 5 0.64 0.75<br />
Molasses 4 - 0.40 4 - 0.40 4 - 0.40<br />
Salt/shell<br />
powder<br />
1 - 0.10 1 - 0.10 1 - 0.10<br />
Total 100 25.06 13.68 100 25.02 13.67 100 25.13 13.67<br />
US$1.00 = BDT 65.00<br />
Source: Hossain (2006)
Analysis <strong>of</strong> <strong>feeds</strong> <strong>and</strong> <strong>fertilizers</strong> <strong>for</strong> <strong>sustainable</strong> aquaculture development in Bangladesh 133<br />
TABLE 19<br />
Calculated proximate composition <strong>and</strong> gross energy (kcal/100g) content <strong>of</strong> the three low-cost<br />
prawn diets (percent dry matter basis)<br />
Components Diet 1 Diet 2 Diet 3<br />
Crude protein 25.1 25.0 25.1<br />
Crude lipid 10.8 9.8 9.6<br />
Carbohydrate 39.2 37.9 40.2<br />
Gross energy (kcal/100g) 396 383 390<br />
Price (BDT/kg) 13.7 13.7 13.7<br />
Source: Hossain (2006)<br />
Prawn grow-out<br />
Prawn grow-out is generally undertaken in polyculture with several carp species (rohu,<br />
catla, mrigal, grass carp <strong>and</strong> Java barb) under improved-extensive <strong>and</strong> semi-intensive<br />
conditions. Farm-made pellets are normally used <strong>and</strong> these are made using mustard<br />
oilseed cake (20 percent), fine rice bran (20 percent), wheat flour (8 percent), dry fish<br />
powder (20 percent) <strong>and</strong> molasses (2 percent). The cost <strong>of</strong> on-farm pelleted feed is<br />
cheaper than commercially produced pelleted feed. The mixed non-pelletized <strong>feeds</strong><br />
include rice bran, wheat <strong>and</strong> mustard oilseed cake in various proportions. Farmers are<br />
<strong>of</strong> the view that it is beneficial to use both pelleted <strong>and</strong> non-pelleted <strong>feeds</strong>. Only a small<br />
proportion <strong>of</strong> farmers use factory made pelleted <strong>feeds</strong>. The Danida supported project<br />
at Noakhali <strong>and</strong> Potuakhali in northern Bangladesh suggested that farmers use one <strong>of</strong><br />
three <strong>for</strong>mulations <strong>for</strong> the preparation <strong>of</strong> farm-made <strong>feeds</strong> (Table 18). The nutrient<br />
content <strong>of</strong> these <strong>feeds</strong> are tested at the Bangladesh Agricultural University Laboratory<br />
(Table 19). This is a good example <strong>of</strong> extending the practical role <strong>of</strong> an academic<br />
institution to meet farmer needs (Masum, 2005). Average production figures range<br />
between 575 <strong>and</strong> 1050 kg/ha <strong>for</strong> prawns <strong>and</strong> from 500 to 1 760 kg/ha <strong>for</strong> mixed fish.<br />
Some farmers also use non-conventional <strong>feeds</strong> such as snail meat. However, the<br />
rapid expansion <strong>of</strong> prawn farming makes this practise un<strong>sustainable</strong>. For example, in<br />
Bagerhat the improved farm-made <strong>feeds</strong> has resulted in a significant decrease in the<br />
use <strong>of</strong> snail meat by 34 percent from 164 192 tonnes in 1998 to 22 774 tonnes in 2000<br />
(Islam, 2001). There is a definite move towards the intensification <strong>of</strong> prawn grow-out<br />
systems. Most <strong>of</strong> the recently established farms are smaller (0.1 to 0.6 ha <strong>of</strong> pond area)<br />
<strong>and</strong> these are used on a seasonal basis (5–6 months <strong>of</strong> the year) <strong>and</strong> alternated with<br />
crop production. Farmers with perennial ponds generally extend the grow-out period<br />
<strong>for</strong> up to 10 months.<br />
As a pre-stocking management strategy farmers apply lime at 125–250 kg/ha, cow<br />
dung <strong>and</strong> / or compost at 2–5 tonnes/ha. Lime is also applied two to three times during<br />
the production season at 50–100 kg/ha. Lime is applied by diluting it in water <strong>and</strong><br />
spreading the liquid mixture over the water surface <strong>of</strong> the gher. Urea at 25 kg/ha <strong>and</strong><br />
TSP 20 kg/ha are occasionally also applied at certain intervals as post-stocking inputs.<br />
As mentioned above, prawn farmers who previously practised carp polyculture<br />
have increasingly adopted mixed prawn <strong>and</strong> fish culture. The underlying reason <strong>for</strong> this<br />
is the added benefit <strong>of</strong> prawns, which are exported. Overall, this has resulted in better<br />
managed systems, improved production <strong>and</strong> higher pr<strong>of</strong>it margins.<br />
7. DEVELOPMENT OF THE AQUAFEED INDUSTRY<br />
The increasing dem<strong>and</strong> <strong>for</strong> <strong>for</strong>mulated aqua<strong>feeds</strong> has resulted in the establishment <strong>of</strong><br />
dedicated feed companies. This development is largely linked to the intensification <strong>of</strong><br />
aquaculture in some areas <strong>of</strong> the country. Imported <strong>feeds</strong> from Europe, the United<br />
States <strong>of</strong> America, Japan <strong>and</strong> Taiwan Province <strong>of</strong> China are mainly those used in<br />
shrimp <strong>and</strong> prawn hatcheries. Mineral <strong>and</strong> vitamin premixes are also imported.<br />
The aquafeed industry in Bangladesh has its origins in the poultry feed industry.<br />
Presently there are some 14 aquafeed manufacturers in the country (Kader, Hossain
COURTESY OF BIBHU BHUSAN MOJUMDAR<br />
COURTESY OF BIBHU BHUSAN MOJUMDAR<br />
134<br />
FIGURE 5<br />
Workers involved in making pellets in a<br />
small-scale fish feed mill at Narshindi Sadar,<br />
Narshindi, Bangladesh<br />
FIGURE 6<br />
Common feed ingredients used <strong>for</strong> making<br />
pellet feed<br />
<strong>Study</strong> <strong>and</strong> <strong>analysis</strong> <strong>of</strong> <strong>feeds</strong> <strong>and</strong> <strong>fertilizers</strong> <strong>for</strong> <strong>sustainable</strong> aquaculture development<br />
<strong>and</strong> Hasan, 2005); Field Survey, 2005). Most <strong>of</strong> the<br />
manufacturers are involved in the production <strong>and</strong><br />
supply <strong>of</strong> <strong>feeds</strong> <strong>for</strong> finfish culture <strong>and</strong> principally<br />
<strong>for</strong> pangas farming, though some are now also<br />
producing <strong>feeds</strong> <strong>for</strong> shrimp <strong>and</strong> prawns. Six types<br />
<strong>of</strong> <strong>feeds</strong> are produced <strong>for</strong> shrimp (Nursery, Starter<br />
1, Starter 2, Starter 3, Grower <strong>and</strong> Finisher) <strong>and</strong><br />
seven different <strong>for</strong>mulations are produced <strong>for</strong><br />
pangas farming (Pre-nursery, Nursery, Starter 1,<br />
Starter 2, Starter 3, Grower 1 <strong>and</strong> Grower 2) (Field<br />
Survey, 2005).<br />
The industry is currently unregulated with<br />
respect to quality assurance. However, policy<br />
guidelines are presently being developed by MOFL<br />
to regulate the industry so that feed quality can be<br />
assured (DoF, 2005). The significant differences<br />
between the factory quoted proximate composition<br />
<strong>of</strong> <strong>feeds</strong> <strong>and</strong> independent laboratory tests (Kader,<br />
Hossain <strong>and</strong> Hasan, 2005) emphasises the urgent<br />
need to develop a system <strong>for</strong> quality assurance <strong>for</strong><br />
the greater benefit <strong>of</strong> farmers.<br />
Coupled with the development <strong>of</strong> the commercial<br />
aquafeed industry there has been a marked increase<br />
in the production <strong>of</strong> compound farm-made <strong>feeds</strong><br />
<strong>and</strong> a proliferation <strong>of</strong> small-scale feed mills in<br />
aquaculture intensive districts throughout the<br />
country (Figure 5).<br />
Many <strong>of</strong> the small-scale feed millers simply<br />
provide a service by making pellets with ingredients<br />
supplied by the farmer. Dry fish, oilseed cake<br />
(mainly mustard but also sesame <strong>and</strong> soybean), fine<br />
rice bran, wheat flour maize, molasses, bone meal,<br />
mussel shell powder <strong>and</strong> vitamin premix are the<br />
main ingredients (Figure 6) <strong>of</strong> locally produced aqua<strong>feeds</strong> in the small-scale, microenterprise<br />
mills. The most common <strong>for</strong>mulation is dry fish (30 percent), oilseed cake<br />
(23 percent), fine rice bran 25 percent), wheat flour (7 percent) <strong>and</strong> others (15 percent).<br />
The current manufacturing cost (milling, mixing, pellet making <strong>and</strong> drying) is BDT<br />
800/tonne.<br />
7.1 Aquafeed use in Bangladesh<br />
Although based on limited in<strong>for</strong>mation some 50 000 tonnes <strong>of</strong> feed are produced per<br />
annum by the industrial aquafeed industry, mainly <strong>for</strong> intensive culture (hatchery,<br />
nursery <strong>and</strong> grow-out) <strong>of</strong> pangas, mono-sex Nile tilapia <strong>and</strong> Thai strain <strong>of</strong> climbing<br />
perch. Shrimp <strong>and</strong> prawn feed production amounts to around 10 000 tonnes per annum<br />
(Table 20). Other than the industrially produced aqua<strong>feeds</strong>, a substantial quantity <strong>of</strong><br />
pelleted feed <strong>for</strong> pangas <strong>and</strong> shrimp <strong>and</strong> prawn are either farm-made or produced<br />
by small-scale feed manufacturers. Estimates <strong>of</strong> total aquafeed use <strong>and</strong> its origin are<br />
presented in Table 20. Overall, some 230 000 tonnes <strong>of</strong> aqua<strong>feeds</strong> are used per annum.<br />
Of interest are the relative proportions <strong>of</strong> feed use by the relatively small number <strong>of</strong><br />
intensive fish farmers in comparison with the farmers who employ improved-extensive<br />
<strong>and</strong> semi-intensive technologies. In the improved-extensive <strong>and</strong> semi-intensive farming<br />
systems (see above) production is largely reliant on fertilization <strong>and</strong> natural pond<br />
productivity, with limited supplementary feeding. It is estimated that approximately
Analysis <strong>of</strong> <strong>feeds</strong> <strong>and</strong> <strong>fertilizers</strong> <strong>for</strong> <strong>sustainable</strong> aquaculture development in Bangladesh 135<br />
TABLE 20<br />
Estimated amounts <strong>of</strong> feed use <strong>for</strong> aquaculture production in Bangladesh, 2004<br />
Production systems/species<br />
Industrial pellets<br />
(tonnes)<br />
On-farm pellets & mixes<br />
(tonnes)<br />
On-farm mixed feed<br />
(tonnes)<br />
89 percent <strong>of</strong> the total annual aquaculture production <strong>of</strong> >900 000 tonnes in Bangladesh<br />
is produced by the latter group <strong>of</strong> farmers. Assuming that 100kg <strong>of</strong> supplementary<br />
feed is used to produce 1 tonne <strong>of</strong> fish in the improved-extensive <strong>and</strong> semi-intensive<br />
systems equates to a total use <strong>of</strong> around <strong>of</strong> 80 000 tonnes <strong>of</strong> supplementary <strong>feeds</strong>, the<br />
bulk <strong>of</strong> which consists <strong>of</strong> bran <strong>and</strong> mustard oilseed cake. It is estimated that a further<br />
20 000 tonnes <strong>of</strong> supplementary <strong>feeds</strong> are used <strong>for</strong> the production <strong>of</strong> seed, such that<br />
the total feed use by extensive <strong>and</strong> semi-intensive farmers is around 100 000 tonnes or<br />
44 percent <strong>of</strong> the total aquafeed use in the country. By comparison, the semi-intensive<br />
<strong>and</strong> intensive farmers who produce mainly pangas <strong>and</strong> other high value products use<br />
56 <strong>of</strong> the feed to produce 11 percent <strong>of</strong> total aquaculture production.<br />
8. PROBLEMS AND CONSTRAINTS OF FEED AND FERTILIZER USE IN<br />
AQUACULTURE<br />
• Many <strong>of</strong> the poor <strong>and</strong> marginal farmers have a limited underst<strong>and</strong>ing <strong>of</strong> the feed<br />
<strong>and</strong> nutrient requirements <strong>of</strong> the animals they are producing. They mainly practice<br />
extensive aquaculture with limited <strong>and</strong> irregular use <strong>of</strong> <strong>feeds</strong> <strong>and</strong> <strong>fertilizers</strong> <strong>and</strong><br />
production levels are low.<br />
• Semi-intensive <strong>and</strong> intensive farmers are reliant on poor quality <strong>feeds</strong> irrespective<br />
<strong>of</strong> whether the feed is made by the <strong>for</strong>mal aquafeed industry or by small-scale feed<br />
mills. Similarly, this is also largely a consequence <strong>of</strong> their limited knowledge about<br />
the nutritional requirements <strong>of</strong> the culture species, the proximate composition <strong>of</strong><br />
the ingredients <strong>and</strong> price. Manufacturers <strong>of</strong>ten use cheaper ingredients <strong>of</strong> inferior<br />
quality, resulting in poor feed quality <strong>and</strong> lower than expected yields. Facilities<br />
to test the composition <strong>of</strong> ingredients <strong>and</strong> composite mixed <strong>feeds</strong> are not readily<br />
available to farmers, who have to bear the consequences <strong>and</strong> the costs.<br />
• The aquafeed industry is unregulated <strong>and</strong> feed quality is not guaranteed. Hence<br />
there is an urgent need to finalise <strong>and</strong> implement policy <strong>for</strong> aquafeed regulation<br />
<strong>and</strong> a need to build the requisite capacity <strong>and</strong> facilities to manufacture high quality<br />
aqua<strong>feeds</strong>.<br />
• The seasonally limited availability <strong>and</strong> supply <strong>of</strong> aquafeed ingredients is<br />
problematic. Competition <strong>for</strong> these commodities by other users, e.g. the poultry<br />
feed industry is high, which result in higher prices. Many storage facilities are<br />
antiquated <strong>and</strong> inadequately resourced to store the ingredients in an appropriate<br />
<strong>and</strong> safe manner such that they are readily available throughout the year.<br />
9. RESOURCE AVAILABILITY AND THE EXPANSION OF THE AQUACULTURE<br />
INDUSTRY<br />
Fish production in Bangladesh can be increased through further improvements in the<br />
improved-extensive <strong>and</strong> semi-intensive culture systems <strong>for</strong> carps, prawn <strong>and</strong> shrimp,<br />
in particular by increasing farmer awareness in the use <strong>of</strong> <strong>feeds</strong> <strong>and</strong> <strong>fertilizers</strong>. Access<br />
to farm inputs by poor <strong>and</strong> marginal farmers has to be improved in order to increae<br />
rural fish production.<br />
Total (tonnes)<br />
Pangas, tilapia <strong>and</strong> climbing<br />
perch<br />
50 000 40 000 10 000 100 000<br />
Shrimp <strong>and</strong> prawn 10 000 20 000 30 000<br />
Carp polyculture <strong>for</strong> food fish - 80 000 80 000<br />
Carp seed production - 20 000 20 000<br />
Total 60 000 50 000 100 000 230 000<br />
Source: Field Survey (2005)
136<br />
<strong>Study</strong> <strong>and</strong> <strong>analysis</strong> <strong>of</strong> <strong>feeds</strong> <strong>and</strong> <strong>fertilizers</strong> <strong>for</strong> <strong>sustainable</strong> aquaculture development<br />
The rapidly growing feed manufacturing sector must be regulated with respect to<br />
feed quality, such that famers are in a position to purchase quality <strong>feeds</strong>. This would<br />
result overall in higher production levels. Moreover, there is a need <strong>for</strong> the <strong>for</strong>mal<br />
aquafeed industry to become more pro-active with respect to the supply <strong>of</strong> <strong>and</strong> quality<br />
<strong>of</strong> ingredients. The dem<strong>and</strong> <strong>for</strong> feed has to be estimated by the industry on a regular<br />
basis so that the dem<strong>and</strong> can be met at a reasonable cost.<br />
10. RECOMMENDATIONS<br />
The recent advances in aquaculture production have given rise to several new constraints.<br />
These must now be addressed in order <strong>for</strong> the industry to exp<strong>and</strong> in Bangladesh. The<br />
following recommendations may be useful <strong>for</strong> the <strong>sustainable</strong> development <strong>of</strong> the<br />
aquaculture sector:<br />
• The degree <strong>of</strong> cooperation between government <strong>and</strong> university laboratories to<br />
provide support to the aquafeed industry to manufacture high quality <strong>feeds</strong><br />
<strong>and</strong> to provide in<strong>for</strong>mation on the nutritional requirements <strong>of</strong> fish must be<br />
improved.<br />
• In<strong>for</strong>mation on appropriate storage methods <strong>and</strong> modern fishmeal manufacturing<br />
technology needs to be disseminated.<br />
• Extension services must provide a greater degree <strong>of</strong> support to farmers such that<br />
they are able to manufacture better farm-made <strong>feeds</strong>.<br />
• Extension services must provide appropriate in<strong>for</strong>mation to farmers <strong>for</strong><br />
improved fertilization schedules to enhance natural pond productivity.<br />
• Extension services must promote the effective use <strong>of</strong> inorganic <strong>fertilizers</strong> in fish<br />
culture to increase natural pond productivity.<br />
• Intensive producers must be educated in the judicious use <strong>of</strong> aqua<strong>feeds</strong> <strong>and</strong><br />
expansion <strong>of</strong> their activities in a controlled manner.<br />
• Extension services must educate poor <strong>and</strong> marginal farmers (carp farmers)<br />
throughout the country to improve their production through regular use <strong>of</strong><br />
nutrients <strong>and</strong> <strong>feeds</strong>.<br />
ACKNOWLEDGEMENTS<br />
The authors acknowledge Dr Mohammad R. Hasan <strong>of</strong> the Aquaculture Management<br />
<strong>and</strong> Conservation Service <strong>of</strong> the Food <strong>and</strong> Agricultural Organization <strong>of</strong> the United<br />
Nations, Dr A.G. Ponniah, <strong>for</strong>mer Director, Aquaculture <strong>and</strong> Genetic Improvement<br />
Discipline <strong>of</strong> the WorldFish Center, Dr Cori Crithchlow-Watton <strong>of</strong> the University <strong>of</strong><br />
Stirling, Dr David Little <strong>of</strong> the Institute <strong>of</strong> Aquaculture, University <strong>of</strong> Stirling <strong>for</strong> their<br />
support <strong>and</strong> encouragement, Bibhu Bhusan Mojumdar <strong>and</strong> his team <strong>of</strong> field researchers<br />
<strong>for</strong> undertaking the field survey <strong>and</strong> many stakeholders throughout the country who<br />
hope to see the future benefits <strong>of</strong> the study <strong>and</strong> its recommendations. Finally we thank<br />
the WorldFish Center, Bangladesh <strong>and</strong> South Asia Office <strong>for</strong> permission to carry out<br />
the study.<br />
REFERENCES<br />
ADB (Asian Development Bank). 2005. An evaluation <strong>of</strong> small-scale freshwater rural<br />
aquaculture development <strong>for</strong> poverty reduction. Manila, Asian Development Bank. 164 pp.<br />
Banerjee, R.K., Roy, P., Singit, C.S. & Dutta, B.R. 1979. Poultry dropping - its manorial<br />
potentiality in aquaculture. Journal <strong>of</strong> Inl<strong>and</strong> Fisheries Society India, 2: 94–108.<br />
BARC (Bangladesh Agricultural Research Council). 2005. Fertilizer recommendation<br />
guide 2005. Dhaka, Bangladesh Agricultural Research Council. 260 pp.<br />
Barman, B.K., Little, D.C. & Edwards, P. 2002. Small-scale fish culture in northwest<br />
Bangladesh - a participatory appraisal focussing on the role <strong>of</strong> tilapias. pp 227–244. In<br />
P. Edwards, D.C. Little & H. Demaine, (eds.) Rural Aquaculture. Bangkok, AIT <strong>and</strong><br />
Walling<strong>for</strong>d, Engl<strong>and</strong>, CABI Publishing.
Analysis <strong>of</strong> <strong>feeds</strong> <strong>and</strong> <strong>fertilizers</strong> <strong>for</strong> <strong>sustainable</strong> aquaculture development in Bangladesh 137<br />
Barman, B.K. 2005. Impacts <strong>of</strong> Indian major carps in aquaculture <strong>and</strong> livelihoods <strong>of</strong><br />
people in northern Vietnam. Paper presented at the Meeting at the WorldFish Center,<br />
Bangladesh <strong>and</strong> South Asia Office, Dhaka 12 pp.<br />
Barman, B.K., Little, D.C. & Janssen, J. 2003. Tilapia culture systems in Bangladesh.<br />
Global Aquaculture Advocate, 6 (4): 31–33.<br />
BBS (Bangladesh Bureau <strong>of</strong> Statistics). 2004. Statistical yearbook <strong>of</strong> Bangladesh.<br />
Bangladesh Bureau <strong>of</strong> Statistics, 23 rd Edition, Dhaka, Ministry <strong>of</strong> Planning.<br />
Bunting, S.W., Kundu, N. & Mukherjee, M. 2005. Peri-urban aquaculture <strong>and</strong> poor<br />
livelihoods in Kolata, India. pp 61–76. In B. Costa-Pierce, A. Desbonnet, P. Edwards &<br />
D. Baker (eds.) Urban Aquaculture. Walling<strong>for</strong>d, Engl<strong>and</strong>, CABI Publishing.<br />
Costa-Pierce, B., Desbonnet, A., Edwards, P. & Baker, D. (eds.). 2005. Urban Aquaculture.<br />
Walling<strong>for</strong>d, Engl<strong>and</strong>, CABI Publishing. 285 pp.<br />
Demaine, H. 2005. Greater Noakhali Aquaculture Extension Project. GNAEC’s Growing<br />
Concentration on Pro-poor Aquaculture: A Review Paper. Noakhali, Bangladesh,<br />
GNAEP. 6 pp.<br />
DoF (Department <strong>of</strong> Fisheries). 2005. Saronika, National Fisheries Fortnight 2005, 7-21 August,<br />
2005. Dhaka, Department <strong>of</strong> Fisheries, Ministry <strong>of</strong> Fisheries <strong>and</strong> Livestock. 132 pp.<br />
DoF (Department <strong>of</strong> Fisheries). 2006. Statistical Yearbook <strong>of</strong> Bangladesh, 2004-05. Dhaka,<br />
Fisheries Resources Survey System, Department <strong>of</strong> Fisheries, Ministry <strong>of</strong> Fisheries <strong>and</strong><br />
Livestock. 42 pp<br />
Edwards, P. & Alan, G. 2001. Fish <strong>feeds</strong> in countries <strong>of</strong> Lower Mekong Basin. AARM<br />
Newsletter, 7 (2): 2–3 <strong>and</strong> 8.<br />
Faruque, A.M.O. 2006. Development <strong>of</strong> database on feed resources <strong>and</strong> small-scale shrimp<br />
farming practices in Khulna region <strong>and</strong> <strong>for</strong>mulation <strong>of</strong> low cost shrimp feed. Mymensing,<br />
Bangladesh, Department <strong>of</strong> Aquaculture, Bangladesh Agricultural University. 295 pp.<br />
(PhD thesis).<br />
Hasan, M.R., 2001. Dem<strong>and</strong>-led research on management <strong>of</strong> wild freshwater fish in<br />
Bangladesh. Dhaka, SUFER Project, DFID, University Grants <strong>of</strong> Bangladesh. 76 pp.<br />
Hasan, M.R. 2001. Nutrition <strong>and</strong> feeding <strong>for</strong> <strong>sustainable</strong> aquaculture development in the<br />
third millennium. pp. 193–219. In R.P. Subasinghe, P. Bueno, M.J. Phillips, C. Hough,<br />
S.E. McGladdery & J.R. Arthur, (eds.) Aquaculture in the Third Millennium. Technical<br />
Proceedings <strong>of</strong> the Conference on Aquaculture in the Third Millennium, Bangkok,<br />
Thail<strong>and</strong>, 20-25 February 2000, Bangkok, NACA <strong>and</strong> Rome, FAO.<br />
Hasan, M.R., Alam, M.G.M. & Islam, M.A. 1989. Evaluation <strong>of</strong> some indigenous<br />
ingredients as dietary protein sources <strong>for</strong> the catfish (Clarias batrachus, Linnaeus)<br />
fry. pp. 125–137. In E.A. Huisman, N. Zonneveld & A.H.M. Bouwmans, (eds.)<br />
Aquacultural research in Asia: management techniques <strong>and</strong> nutrition. AA Wageningen,<br />
The Netherl<strong>and</strong>s, Pudoc.<br />
Hasan, M.R., Roy, P.K. & Ak<strong>and</strong>, A.M. 1994. Evaluation <strong>of</strong> leucaena leaf meal as a<br />
dietary protein source <strong>for</strong> Indian major carp, Labeo rohita fingerlings. pp. 69–76. In S.S.<br />
De Silva, (ed.) Fish nutrition research in Asia. Special Publication No. 9, Manila, Asian<br />
Fisheries Society.<br />
Hossain, M.A. 1996. Proximate <strong>and</strong> amino acid composition <strong>of</strong> some potential Bangladesh<br />
fish feed ingredients. Bangladesh Journal <strong>of</strong> Zoology, 24: 163–168.<br />
Hossain, M.A. 2006. A consultancy report on proximate composition <strong>of</strong> ingredients <strong>for</strong> a<br />
cost effective feed <strong>for</strong>mulation <strong>for</strong> prawn, Macrobrachium rosenbergii (de Man) prepared<br />
<strong>for</strong> Greater Noakhali Aquaculture Extension Project (GNAEP). Noakhali, Bangladesh,<br />
GNAEP.<br />
Islam, R., Akhter, F., Alam, F. & Tarafder, S.R. 1999. The growth <strong>and</strong> survival <strong>of</strong> hatchery<br />
produced prawn (Macrobrachium resenbergii) post larvae in a gher farming system.<br />
Dhaka, GOLDA Project, CARE-Bangladesh.<br />
Kader, M.A., Hossain, M.A. & Hasan, M.R. 2005. A survey <strong>of</strong> the nutrient composition <strong>of</strong><br />
some commercial fish <strong>feeds</strong> available in Bangladesh. Asian Fisheries Science, 18: 59–69.
138<br />
<strong>Study</strong> <strong>and</strong> <strong>analysis</strong> <strong>of</strong> <strong>feeds</strong> <strong>and</strong> <strong>fertilizers</strong> <strong>for</strong> <strong>sustainable</strong> aquaculture development<br />
Karim, M. 2006. The livelihood impacts <strong>of</strong> fishponds integrated within farming systems in<br />
Mymensingh District, Bangladesh. Stirling, Scotl<strong>and</strong>, University <strong>of</strong> Stirling. 371 pp. (PhD<br />
thesis).<br />
Knud-Hansen, C.F. 1998. Pond fertilization ecological approach <strong>and</strong> practical application.<br />
Corvallis, USA, Pond Dynamics/Aquaculture CRSP. 125pp.<br />
Knud-Hansen, C.F. & Pautong, A. 1993. On the role <strong>of</strong> urea in pond fertilization.<br />
Aquaculture, 114: 273–283.<br />
Little, D.C. & Bunting, S.W. 2005. Opportunities <strong>and</strong> constraints to urban aquaculture,<br />
with a focus on south <strong>and</strong> southeast Asia. pp. 25–44. In B. Costa-Pierce, A. Desbonnet,<br />
P. Edwards & D. Baker, (eds.) Urban Aquaculture, Walling<strong>for</strong>d, Engl<strong>and</strong>, CABI<br />
Publishing.<br />
Miah, M.J.U., Das, M., Hossain, M.A., Hossain, M.M. & Hossain, M.A.A. 1996. Effects<br />
<strong>of</strong> fertilization on zooplankton production. Progressive Agriculture, 7: 203–206.<br />
Muir, J. 2003. Structural features. pp 27–85. In J. Muir (ed.) Fisheries sector review<br />
<strong>and</strong> future development. Theme study: economic per<strong>for</strong>mance, Dhaka, World Bank,<br />
DANIDA, USAID, FAO, DFID.<br />
Murtuza, G. 1998. The role <strong>of</strong> Bangladesh fisheries development corporation in development<br />
<strong>and</strong> harvesting <strong>of</strong> fish in Bangladesh. pp. 6–8. In Sankalan, national fish week. Dhaka,<br />
Department <strong>of</strong> Fisheries.<br />
NACA/FAO. 2004. Emerging trends <strong>and</strong> experiences in Asia-Pacific Aquaculture. Bangkok,<br />
NACA <strong>and</strong> Rome, FAO, 144 pp.<br />
Saha, S.B., Gupta, M.V., Hussain, M.G., Shah, M.S. & Rahman, M.M. 1989. Effects<br />
<strong>of</strong> different <strong>fertilizers</strong> on the growth <strong>and</strong> survival <strong>of</strong> silver carp (Hypophthalmichthys<br />
molitrix Val.) spawn in nursery ponds. Bangladesh J. Zool., 17: 57–67.<br />
Thompson, P.M., Sultana, P. & Firoz Khan, A.K.M. 2005. Aquaculture Extension Impacts<br />
in Bangladesh: A Case <strong>Study</strong> from Kapasia, Gazipur. WorldFish Center Technical Report<br />
63. Dhaka, WorldFish Center, Bangladesh <strong>and</strong> South Asia Office. 75p.<br />
Xin, Z. 1989. Rice bran as an energy-rich supplementary feed in a fertilized system <strong>for</strong> Nile<br />
tilapia. Bangkok, Asian Institute <strong>of</strong> Technology. (PhD thesis).<br />
Zaher, M. & Mazid, M.A. 1994. Aqua<strong>feeds</strong> <strong>and</strong> feeding strategies in Bangladesh. pp. 161–<br />
180. In M.B. New, A.G.J. Tacon & I. Csavas (eds.) Farm-made aqua<strong>feeds</strong>. FAO Fisheries<br />
Technical Paper No. 343, Rome, FAO.
Analysis <strong>of</strong> <strong>feeds</strong> <strong>and</strong> <strong>fertilizers</strong> <strong>for</strong> <strong>sustainable</strong> aquaculture development in Bangladesh 139<br />
APPENDIX<br />
A.1. Family, common English <strong>and</strong> scientific names <strong>of</strong> major aquaculture species in Bangladesh<br />
Major group Family Common English name Scientific name<br />
Major carps Cyprinidae<br />
Exotic carps Cyprinidae<br />
Other carps Cyprinidae<br />
Snakeheads Channidae<br />
Catfishes<br />
Bagridae<br />
Rohu Labeo rohita<br />
Catla Catla catla<br />
Mrigal Cirrhinus cirrhosus<br />
Silver carp Hypophthalmichthys molitrix<br />
Common carp Cyprinus carpio<br />
Common/mirror carp Cyprinus carpio<br />
Grass carp Ctenopharyngodon idella<br />
Java barb Barbonymus gonionotus<br />
Kuria labeo Labeo gonius<br />
Orange-fin labeo Labeo calbasu<br />
Olive barb Puntius sarana<br />
Snakehead murrel Channa striata<br />
Great snakehead Channa marulius<br />
Spotted snakehead Channa punctata<br />
Rita Rita rita<br />
Long-whiskered catfish Sperata aor<br />
Giant river-catfish Sperata seenghala<br />
Siluridae Wallago Wallago attu<br />
Pangasiidae<br />
Yellowtail catfish Pangasius pangasius<br />
Sutchi catfish Pangasius hypophthalmus<br />
Schilbeidae Silond catfish Silonia silondia<br />
Catfish Eutropiichthys vacha<br />
Heteropneustidae Stinging catfish Heteropneustes fossilis<br />
Clariidae<br />
Walking catfish Clarias batrachus<br />
North African catfish Clarias gariepinus<br />
Climbing perch Anabantidae Climbing perch Anabas testudineus<br />
Other fishes<br />
Shrimps & prawns<br />
Notopteridae<br />
Percidae<br />
Penaeidae<br />
Palaemonidae<br />
Clown knifefish Notopterus chitala<br />
Bronze featherback N. notopterus<br />
Nile tilapia Oreochromis niloticus<br />
Mozambique tilapia O. mossambicus<br />
Black tiger shrimp Penaeus monodon<br />
White shrimp Penaeus indicus<br />
Brown tiger shrimp Penaeus semisulcatus<br />
Brown shrimp Penaeus brevicornis<br />
Brown shrimp Metapenaeus monoceros<br />
Shrimp Parapenaeopsis sculptilis<br />
Source: Hasan (1990); FishBase (05/2007) (http://www.fishbase.org/search.php)<br />
Giant freshwater prawn Macrobrachium rosenbergii<br />
Monsoon river prawn Macrobrachium malcolmsoni
140<br />
<strong>Study</strong> <strong>and</strong> <strong>analysis</strong> <strong>of</strong> <strong>feeds</strong> <strong>and</strong> <strong>fertilizers</strong> <strong>for</strong> <strong>sustainable</strong> aquaculture development<br />
B.1. Amino acid composition <strong>of</strong> feed ingredients used in Bangladesh (percent dry matter)<br />
Fish<br />
Silkworm Poultry Soybean Sesame Mustard Linseed Cotton Leucaena Water Duckweed<br />
Wheat<br />
Amino acids Fishmeal<br />
Bonemeal<br />
Rice bran<br />
silage<br />
pupae <strong>of</strong>fal meal meal oilcake meal seed meal hyacinth meal<br />
bran<br />
Threoonine 3.13 2.52 5.37 2.29 2.64 1.63 1.21 1.46 1.24 1.21 1.21 1.08 0.70 0.47 0.49<br />
Cystine 0.48 0.44 0.88 0.73 0.69 0.28 0.32 0.70 0.37 0.39 0.17 0.10 0.12 0.14 0.18<br />
Valine 3.16 2.53 7.90 3.01 3.85 2.10 1.27 1.47 1.75 1.56 1.49 1.19 0.76 0.59 0.62<br />
Methionine 1.95 1.75 1.20 1.22 1.04 0.54 1.37 0.32 0.58 - 0.58 0.17 0.09 0.23 -<br />
Isoleucine 2.65 2.13 0.85 2.66 3.47 1.82 0.92 1.34 1.41 1.15 1.12 0.95 0.50 0.37 0.42<br />
Leucine 4.96 4.46 10.34 4.19 4.92 3.37 1.79 2.32 2.43 1.92 2.22 1.75 1.10 0.72 0.89<br />
Tyrosine 2.23 1.92 2.43 3.49 2.42 1.29 0.56 0.73 0.64 0.64 0.87 0.68 0.39 0.19 0.29<br />
Phenylalanine 2.54 2.16 6.84 1.89 3.13 2.22 2.11 1.38 1.53 1.51 1.57 1.19 0.71 0.47 0.61<br />
Histidine 0.65 0.53 4.95 2.30 1.56 1.24 0.63 0.72 0.75 0.65 0.42 0.46 0.26 0.30 0.46<br />
Lysine 4.85 4.12 7.78 4.56 3.95 3.01 1.27 1.96 1.18 1.27 1.33 0.98 0.93 0.49 0.64<br />
Arginine 3.64 3.10 3.96 3.13 3.95 3.48 2.91 1.81 2.23 2.90 1.48 1.02 1.81 0.68 0.89<br />
Source: Hossain (1996)
Analysis <strong>of</strong> <strong>feeds</strong> <strong>and</strong> <strong>fertilizers</strong><br />
<strong>for</strong> <strong>sustainable</strong> aquaculture<br />
development in China<br />
M. Weimin<br />
Freshwater Fisheries Research Centre<br />
9 East Shanshui Road, Binhu District, Wuxi 214081<br />
China<br />
L. Mengqing<br />
Yellow Sea Fisheries Research Institute<br />
PO Box 266071, 106 Nanjing Road, Qingdao<br />
China<br />
Summary 142<br />
1. General overview <strong>of</strong> aquaculture practices <strong>and</strong> farming systems 144<br />
2. Fertilizers, feed ingredients <strong>and</strong> <strong>feeds</strong> 152<br />
3. Feed management strategies <strong>and</strong> pond management techniques 162<br />
4. The development <strong>of</strong> auqafeed industries in China 175<br />
5. Problems <strong>and</strong> constraints <strong>of</strong> aquaculture <strong>feeds</strong> <strong>and</strong> feedings 180<br />
6. Resource availability <strong>and</strong> the expansion <strong>of</strong> the aquaculture industry 182<br />
7. Recommendations <strong>for</strong> improved utilization <strong>of</strong> <strong>fertilizers</strong> <strong>and</strong> feed resources 184<br />
Acknowledgements 186<br />
References 186<br />
Appendix 188<br />
Weimin, M. <strong>and</strong> Mengqing, L. 2007. Analysis <strong>of</strong> <strong>feeds</strong> <strong>and</strong> <strong>fertilizers</strong> <strong>for</strong> <strong>sustainable</strong><br />
aquaculture development in China. In M.R. Hasan, T. Hecht, S.S. De Silva <strong>and</strong> A.G.J.<br />
Tacon (eds). <strong>Study</strong> <strong>and</strong> <strong>analysis</strong> <strong>of</strong> <strong>feeds</strong> <strong>and</strong> <strong>fertilizers</strong> <strong>for</strong> <strong>sustainable</strong> aquaculture<br />
development. FAO Fisheries Technical Paper. No. 497. Rome, FAO. pp. 141–190.<br />
141
142<br />
<strong>Study</strong> <strong>and</strong> <strong>analysis</strong> <strong>of</strong> <strong>feeds</strong> <strong>and</strong> <strong>fertilizers</strong> <strong>for</strong> <strong>sustainable</strong> aquaculture development<br />
SUMMARY<br />
Over the past quarter-century, aquaculture in China has recorded an annual average<br />
increase in production <strong>of</strong> 13.5 percent. In 2004, total production was 32.09 million<br />
tonnes. The rapid development <strong>of</strong> the aquaculture sector has significantly stimulated<br />
the development <strong>of</strong> the aquafeed industry in China. In recent years commercially<br />
manufactured feed production has been increasing at a rate <strong>of</strong> about 20 percent<br />
annually. Developments in <strong>and</strong> expansion <strong>of</strong> the aquafeed industry has further spurred<br />
the development <strong>of</strong> aquaculture in the country. Recent trends in the intensification <strong>of</strong><br />
aquaculture <strong>and</strong> species diversification have had significant impacts on the production<br />
<strong>and</strong> use <strong>of</strong> <strong>feeds</strong> <strong>and</strong> <strong>fertilizers</strong>, which may negatively impact on the <strong>sustainable</strong><br />
development <strong>of</strong> the sector in China. For example, in 2004 average yields in freshwater<br />
pond culture reached 5.5 tonnes/ha, which is a 60.4 percent over average yields attained<br />
in 1994. Similarly, the number <strong>of</strong> freshwater species groups included in the national<br />
production statistics increased from 11 in 1995 to 40 in 2004.<br />
This review summarizes the development <strong>of</strong> the aquaculture industry in China <strong>and</strong> its<br />
contribution to animal protein food supply, income <strong>and</strong> employment generation, export<br />
earnings <strong>and</strong> the national economy. Aquaculture currently supplies about 30 percent<br />
<strong>of</strong> animal food to the Chinese people. At the same time, the industry provides some<br />
4.5 million full time <strong>and</strong> 3–4 million part-time jobs <strong>for</strong> rural communities. In 2004,<br />
the average annual income <strong>of</strong> aquaculture labour (US$1 100) was nearly double that<br />
<strong>of</strong> the income in agriculture. Aquaculture systems <strong>and</strong> practices, in particular on-farm<br />
feed management strategies <strong>and</strong> pond management techniques have been introduced to<br />
improve feed <strong>and</strong> fertilizer utilization to enhance fish <strong>and</strong> shellfish production. Research<br />
on the nutritional requirements <strong>of</strong> culture species <strong>and</strong> the development <strong>of</strong> technologies<br />
<strong>for</strong> improved pond <strong>and</strong> water quality management, the use <strong>of</strong> water quality promoting<br />
agents <strong>and</strong> improved methods <strong>of</strong> feed preparation, <strong>for</strong>mulation <strong>and</strong> presentation have<br />
been the major driving <strong>for</strong>ces <strong>of</strong> the sector in the recent past.<br />
An overview is provided <strong>of</strong> the various feed ingredients, <strong>feeds</strong> <strong>and</strong> <strong>fertilizers</strong><br />
commonly used in aquaculture in China with particular emphasis on how they are<br />
used. It was estimated that about 70 percent <strong>of</strong> the total aquafeed produced in China is<br />
used in freshwater pond culture <strong>of</strong> grass carp, common carp, crucian carp <strong>and</strong> tilapia.<br />
A significant proportion <strong>of</strong> pond aquaculture in China is dependent on farm-made<br />
<strong>feeds</strong> containing <strong>feeds</strong>tuffs such as rice bran, rapeseed meal, peanut meal, soybean meal,<br />
silkworm pupae either singly or in combination with organic <strong>and</strong> inorganic <strong>fertilizers</strong>.<br />
Shrimp culture in China is mainly an earthen pond based activity using good quality<br />
industrially manufactured compounded feed with FCRs that vary between 1.2 <strong>and</strong><br />
1.6:1. In comparison to freshwater fish production, the output from mariculture remains<br />
very low. Marine fish culture employs net-cages, l<strong>and</strong>-based tank <strong>and</strong> earthen pond<br />
systems. Marine fish cage culture largely depends on trash fish, while extruded <strong>feeds</strong><br />
in combination with farm-made <strong>feeds</strong> are used in l<strong>and</strong>-based tank culture systems <strong>and</strong><br />
earthen ponds. It was estimated that about 4 million tonnes <strong>of</strong> trash fish are directly used<br />
as aqua<strong>feeds</strong> annually.<br />
The development <strong>of</strong> the aquafeed industries were reviewed with emphasis on carps,<br />
tilapia, bream, eel <strong>and</strong> shrimp. In 2004, approximately 8 million tonnes <strong>of</strong> compound<br />
aqua<strong>feeds</strong> were produced <strong>and</strong> this accounted <strong>for</strong> about 8.6 percent <strong>of</strong> total animal feed<br />
production in China. Attention was also given to recent developments in aquafeed<br />
quality assurance <strong>and</strong> control st<strong>and</strong>ards.<br />
The major challenges facing the aquaculture industry <strong>and</strong> its <strong>sustainable</strong> development<br />
in China are availability <strong>of</strong> <strong>and</strong> accessibility to aquaculture feed ingredients especially<br />
fishmeal, availability <strong>of</strong> organic <strong>fertilizers</strong>, economic <strong>and</strong> social constraints with respect<br />
to feed resource use, preparation <strong>of</strong> farm-made <strong>feeds</strong>, feed application <strong>and</strong> use <strong>of</strong><br />
commercially manufactured pellet <strong>feeds</strong> by small to medium-scale farmers. In addition<br />
<strong>and</strong> as important are social <strong>and</strong> environmental impacts caused by improper use <strong>of</strong>
Analysis <strong>of</strong> <strong>feeds</strong> <strong>and</strong> <strong>fertilizers</strong> <strong>for</strong> <strong>sustainable</strong> aquaculture development in China 143<br />
commercially manufactured aqua<strong>feeds</strong>. Globally, China is one the largest importers <strong>of</strong><br />
soybean products <strong>and</strong> fishmeal. Between 2000 <strong>and</strong> 2004 soybean <strong>and</strong> fishmeal imports<br />
increased by nearly 100 percent, in comparison with an increase <strong>of</strong> only 60 percent<br />
during the preceding decade. The rapid expansion <strong>of</strong> the aquafeed industry is the<br />
principal reason <strong>for</strong> this increase in import volumes. If this trend were to continue it<br />
would seriously impact on the supply-dem<strong>and</strong> balance <strong>of</strong> these two feed ingredients in<br />
world trade.<br />
The advantages <strong>and</strong> disadvantages <strong>of</strong> the increasing dependence on commercial <strong>feeds</strong><br />
are considered. While there are some distinct advantages the disadvantages are many <strong>and</strong><br />
these could have serious environmental impacts <strong>and</strong> negative economic consequences <strong>for</strong><br />
small to medium-scale farms.<br />
Strategies <strong>and</strong> approaches to use feed ingredients, <strong>feeds</strong> <strong>and</strong> fertilizer more efficiently<br />
<strong>for</strong> <strong>sustainable</strong> aquaculture development in China are suggested. These include,<br />
among others, improving feed <strong>for</strong>mulations <strong>and</strong> manufacturing technology, sourcing<br />
new <strong>and</strong> alternative feed ingredients, the important role <strong>of</strong> science <strong>and</strong> technology to<br />
improve nutrient absorption <strong>of</strong> presently used <strong>feeds</strong>tuffs, particularly protein sources<br />
<strong>and</strong> improving on-farm feed management. Recommendations are provided <strong>for</strong> the<br />
implementation <strong>of</strong> these strategies, which include government incentives to promote<br />
resource efficient aquaculture systems <strong>and</strong> practices, regulating measures such as<br />
tightening the control over aquaculture effluent discharge, discouraging the inefficient<br />
use <strong>of</strong> feed ingredients <strong>and</strong> stronger support <strong>for</strong> systematic aquaculture feed <strong>and</strong> feeding<br />
related research <strong>and</strong> development activities.
144<br />
<strong>Study</strong> <strong>and</strong> <strong>analysis</strong> <strong>of</strong> <strong>feeds</strong> <strong>and</strong> <strong>fertilizers</strong> <strong>for</strong> <strong>sustainable</strong> aquaculture development<br />
1. GENERAL OVERVIEW OF AQUACULTURE PRACTICES AND FARMING<br />
SYSTEMS<br />
1.1 History <strong>and</strong> present status <strong>of</strong> aquaculture in China<br />
The earliest recorded history <strong>of</strong> aquaculture in China dates back over 2 500 years to the<br />
“The Treatise on Pisciculture”- the first monograph on aquaculture in the world written<br />
by Fan Li. Earliest aquaculture practices started with pond culture <strong>of</strong> common carp<br />
<strong>and</strong> continued <strong>for</strong> about 1 500 years when this practice was <strong>for</strong>bidden during the Tang<br />
Dynasty some 1 200 years ago. This led to the introduction <strong>of</strong> integrated polyculture,<br />
using four Chinese carps. Extensive fish culture practices in open-waters were initiated<br />
during more or less the same period. The traditional aquaculture practices remained<br />
virtually unchanged until the 1970s.<br />
The development <strong>of</strong> aquaculture as a modern industry in China started in the early<br />
1980s, after implementation <strong>of</strong> economic re<strong>for</strong>ms <strong>and</strong> the “open-door” policy. The<br />
development <strong>of</strong> the sector in the last quarter <strong>of</strong> a century was characterised by rapid<br />
expansions in scope, production, technological advances, particularly with respect<br />
to seed production, diversification <strong>of</strong> species <strong>and</strong> farming systems <strong>and</strong> advances in<br />
management skills <strong>and</strong> systems. More recently there has been a trend towards greater<br />
intensification <strong>of</strong> culture systems <strong>and</strong> the introduction <strong>of</strong> new species. These factors<br />
have been the major driving <strong>for</strong>ces <strong>for</strong> developments in feed technology <strong>and</strong> feeding<br />
practices. Feed <strong>and</strong> feeding have become the most important factors influencing the<br />
per<strong>for</strong>mance <strong>of</strong> different aquaculture practices <strong>and</strong> the development <strong>of</strong> the sector as a<br />
whole.<br />
Within the last 20 years aquaculture has become the most important component<br />
<strong>of</strong> the fisheries sector in China. In 1988 fisheries production exceeded 10 million<br />
tonnes <strong>and</strong> <strong>for</strong> the first time aquaculture contributed over 50 percent <strong>of</strong> the total. Since<br />
1993, the contribution by aquaculture has reached 60 percent. In 2003, aquaculture<br />
production amounted to some 30.27 million tonnes <strong>and</strong> this makes a significant<br />
contribution to the total animal protein supply, income generation <strong>of</strong> rural households<br />
<strong>and</strong> the national economy. China currently accounts <strong>for</strong> about 70 percent <strong>of</strong> global<br />
aquaculture production.<br />
Presently, the fisheries sector provides about 30 percent <strong>of</strong> animal protein consumed<br />
in China (Figure 1), although fish consumption varies regionally. On a per capita basis<br />
people in the southeastern part <strong>of</strong> the country consume the largest quantities <strong>of</strong> aquatic<br />
products, while in the northwest consumption is much lower. By 2003, aquaculture<br />
contributed 65.5 percent to total fisheries production, provides about 20 percent <strong>of</strong><br />
total animal food supply<br />
FIGURE 1<br />
Relative contribution to total animal food supply by various<br />
sectors in 2004<br />
16.95%<br />
8.13%<br />
11.23%<br />
2.13%<br />
3.91%<br />
Source: MOA (2004)<br />
29.20%<br />
28.45%<br />
Aquatic products<br />
Pig<br />
Cattle/buffalo<br />
Goat/sheep<br />
Poultry<br />
Poultry egg<br />
Milk<br />
to the peoples <strong>of</strong> China<br />
<strong>and</strong> per capita availability<br />
<strong>of</strong> aquatic products<br />
increased from
Analysis <strong>of</strong> <strong>feeds</strong> <strong>and</strong> <strong>fertilizers</strong> <strong>for</strong> <strong>sustainable</strong> aquaculture development in China 145<br />
comprised 11.2 percent <strong>of</strong><br />
the total national agricultural<br />
output, <strong>of</strong> which 70.3 percent<br />
was from aquaculture <strong>and</strong><br />
in the same year fisheries<br />
comprised 2.8 percent <strong>of</strong><br />
GDP. As shown in Figure<br />
2, the share <strong>of</strong> fisheries to<br />
the total value <strong>of</strong> agricultural<br />
output has increased<br />
significantly in the past 20<br />
years.<br />
Aquatic products have<br />
become the most important<br />
agricultural exports <strong>of</strong> China.<br />
In 2004, the total value <strong>of</strong><br />
exported fisheries products<br />
reached US$5.49 billion with<br />
a trade surplus <strong>of</strong> US$3.01<br />
billion. The export value <strong>of</strong><br />
FIGURE 2<br />
Proportional changes in the value <strong>of</strong> agricultural outputs,<br />
1983–2003<br />
% <strong>of</strong> total agricultural output value<br />
80<br />
70<br />
60<br />
50<br />
40<br />
30<br />
20<br />
10<br />
0<br />
Crop farming &<br />
plantation<br />
Source: MOA (1984, 1994, 2004)<br />
Forestry Animal<br />
husb<strong>and</strong>ry<br />
Fisheries<br />
aquatic products accounted <strong>for</strong> 23.5 percent <strong>of</strong> the total agricultural export value<br />
(US$23.39 billion with a <strong>for</strong>eign trade deficit <strong>of</strong> US$4.6 billion). Although aquatic<br />
products only accounted <strong>for</strong> 0.93 percent <strong>of</strong> total national exports in 2004, the trade<br />
surplus accounted <strong>for</strong> 9.41 percent <strong>of</strong> the total national <strong>for</strong>eign trade surplus (US$32<br />
billion). Currently the bulk <strong>of</strong> exported fisheries products are aquaculture products.<br />
Aquaculture contributes significantly to employment, livelihoods <strong>and</strong> income<br />
<strong>of</strong> rural people in China. In 2004, the fisheries industry employed approximately<br />
13.02 million people, <strong>of</strong> which 7.12 million were full time workers (4.49 million in<br />
aquaculture). In 2004, the average income <strong>for</strong> fisheries workers reached US$1100/year,<br />
which is about 45 percent higher than in the agricultural sector as a whole.<br />
1.2 Aquaculture production by species <strong>and</strong> practices in China<br />
1.2.1 Production by species<br />
Since the middle <strong>of</strong> the 1990s, changes in consumer dem<strong>and</strong>s <strong>and</strong> the pursuit by<br />
farmers to increase returns have stimulated the strong diversification <strong>of</strong> species in<br />
all aquaculture systems <strong>and</strong> practices. Currently, the number <strong>of</strong> species cultured in<br />
freshwater, brackish-water <strong>and</strong> marine environments exceeds 100. In 2004, about<br />
80 different species were included in the national statistical database <strong>of</strong> aquaculture<br />
production. Production by volume <strong>and</strong> value <strong>of</strong> the major aquatic species in inl<strong>and</strong><br />
water bodies are shown respectively in Figures 3 <strong>and</strong> 4. In 2004, grass carp, silver carp,<br />
common carp, bighead <strong>and</strong> crucian carp accounted <strong>for</strong> 71.7 percent <strong>of</strong> the total inl<strong>and</strong><br />
waters aquaculture production in China. Of these species, grass carp has become the<br />
most important. Although different carp species still contribute the largest share, the<br />
contribution by other species has become significant in relation to production by<br />
value. This is mainly due to the higher market value <strong>of</strong> species such as crab, shrimps,<br />
freshwater prawns <strong>and</strong> eels.<br />
Figure 4 shows the production <strong>of</strong> the major finfish <strong>and</strong> crustacean species in<br />
brackish-water <strong>and</strong> marine environments. In 2004, production by volume in these two<br />
environments was dominated by shrimp that account <strong>for</strong> about 37.9 percent <strong>of</strong> total<br />
production. Pacific white shrimp (Litopenaeus vannamei) has become the single most<br />
important culture species. The value <strong>of</strong> the major marine <strong>and</strong> brackish-water finfish<br />
<strong>and</strong> crustaceans produced in 2004 is shown in Figure 6. In terms <strong>of</strong> value this sector is<br />
dominated by shrimp <strong>and</strong> prawns.<br />
1983<br />
1993<br />
2003
146<br />
)<br />
s<br />
e<br />
n<br />
n<br />
o<br />
t<br />
d<br />
n<br />
a<br />
s<br />
u<br />
o<br />
h<br />
t<br />
(<br />
n<br />
o<br />
i<br />
t<br />
c<br />
u<br />
d<br />
o<br />
r<br />
P<br />
4000<br />
3500<br />
3000<br />
2500<br />
2000<br />
1500<br />
1000<br />
500<br />
0<br />
Source: BOF (2005)<br />
)<br />
$<br />
S<br />
U<br />
n<br />
o<br />
i<br />
l<br />
l<br />
i<br />
m<br />
(<br />
e<br />
u<br />
l<br />
a<br />
V<br />
4000<br />
3500<br />
3000<br />
2500<br />
2000<br />
1500<br />
1000<br />
500<br />
0<br />
Seabass<br />
<strong>Study</strong> <strong>and</strong> <strong>analysis</strong> <strong>of</strong> <strong>feeds</strong> <strong>and</strong> <strong>fertilizers</strong> <strong>for</strong> <strong>sustainable</strong> aquaculture development<br />
FIGURE 3<br />
Production <strong>of</strong> major aquaculture species in inl<strong>and</strong> water in China, 2004<br />
M<strong>and</strong>arin fish<br />
Source: FAO (2006)<br />
)<br />
s<br />
e<br />
n<br />
n<br />
o<br />
t<br />
d<br />
n<br />
a<br />
s<br />
u<br />
o<br />
h<br />
t<br />
(<br />
n<br />
o<br />
i<br />
t<br />
c<br />
u<br />
d<br />
o<br />
r<br />
P<br />
400<br />
350<br />
300<br />
250<br />
200<br />
150<br />
100<br />
50<br />
0<br />
Sea bass<br />
M<strong>and</strong>arin fish<br />
Swamp eel<br />
Japanese eel<br />
Snakehead<br />
Black carp<br />
Swamp eel<br />
Japanese eel<br />
Snakehead<br />
Catfish<br />
Black carp<br />
Wuchang bream<br />
Nile tilapia<br />
Crucian carp<br />
Bighead carp<br />
Nile tilapia<br />
Crucian carp<br />
Bighead carp<br />
Common carp<br />
Species<br />
Silver carp<br />
Species<br />
Grass carp<br />
Common carp<br />
Silver carp<br />
Grass carp<br />
Other fishes<br />
Giant freshwater prawn<br />
Oriental river prawn<br />
Pacific white shrimp<br />
Chinese river crab<br />
S<strong>of</strong>t-shell turtle<br />
FIGURE 4<br />
Production value <strong>of</strong> major aquaculture species in inl<strong>and</strong> water in China, 2004<br />
Amberjacks<br />
Puffers<br />
Cobia<br />
Groupers<br />
Red drum<br />
Porgies, sea breams<br />
Flatfishes nei<br />
Large yellow croaker<br />
Percoids<br />
Other fishes<br />
S<strong>of</strong>t-shell turtle<br />
Giant freshwater prawn<br />
Oriental river prawn<br />
Pacific white shrimp<br />
Chinese river crab<br />
FIGURE 5<br />
Production <strong>of</strong> major marine <strong>and</strong> brackish-water fish <strong>and</strong> crustaceans in China, 2004<br />
Source: BOF (2006)<br />
Species<br />
Pacific white shrimp<br />
Fleshy prawn<br />
Marine crabs<br />
Other crustaceans
Analysis <strong>of</strong> <strong>feeds</strong> <strong>and</strong> <strong>fertilizers</strong> <strong>for</strong> <strong>sustainable</strong> aquaculture development in China 147<br />
)<br />
$<br />
S<br />
U<br />
n<br />
o<br />
i<br />
l<br />
l<br />
i<br />
m<br />
(<br />
e<br />
u<br />
l<br />
a<br />
V<br />
FIGURE 6<br />
Production value <strong>of</strong> major marine <strong>and</strong> brackish-water fish <strong>and</strong> crustacean in China, 2004<br />
1200<br />
1000<br />
800<br />
600<br />
400<br />
200<br />
0<br />
Amberjacks<br />
Puffers<br />
Source: FAO (2006)<br />
Cobia<br />
Groupers<br />
Red drum<br />
Porgies, sea breams<br />
Flatfishes<br />
Large yellow croaker<br />
Species<br />
Other fishes<br />
Pacific white shrimp<br />
Fleshy prawn<br />
Marine crabs<br />
Other crustaceans<br />
1.2.2 Production by systems <strong>and</strong> practices<br />
Due to the organizational structure <strong>of</strong> fisheries <strong>and</strong> aquaculture statistics in China, it<br />
is not possible to provide a precise account <strong>of</strong> production by systems, although it is<br />
possible to undertake an approximate assessment <strong>of</strong> production <strong>of</strong> the different species<br />
under major culture practices. However, there is no doubt that semi-intensive pond<br />
polyculture <strong>of</strong> carp contributes the major share <strong>of</strong> inl<strong>and</strong> aquaculture production. The<br />
estimated production from the major inl<strong>and</strong> aquaculture practices are presented in Table<br />
1 <strong>and</strong> Table 2 summarizes the production <strong>of</strong> marine <strong>and</strong> brackish-water species by<br />
systems. Mollusc monoculture <strong>and</strong> seaweed culture is not considered in this review.<br />
TABLE 1<br />
Estimated production from major inl<strong>and</strong> aquaculture practices in China, 2004<br />
Estimated<br />
Major practices<br />
production<br />
(million tonnes)<br />
Semi-intensive polyculture <strong>of</strong> carps in pond 9–10<br />
Extensive polyculture <strong>of</strong> carps in natural water bodies 3–4<br />
Intensive monoculture <strong>of</strong> common carp, crucian carp <strong>and</strong> tilapia 2–3<br />
Semi-intensive/intensive monoculture <strong>of</strong> freshwater prawns <strong>and</strong> crabs in ponds 1.0<br />
Extensive polyculture/monoculture <strong>of</strong> fish/prawn/crab in paddy fields 1.0<br />
Semi-intensive pen polyculture <strong>of</strong> carps 0.50<br />
Intensive cage monoculture <strong>of</strong> high valued species 0.50<br />
Highly intensive culture <strong>of</strong> eels, s<strong>of</strong>t-shelled turtle <strong>and</strong> puffer fish in indoor<br />
0.10<br />
re-circulating systems<br />
Source: calculated from BOF (2005)<br />
TABLE 2<br />
Estimated production from different marine/brackish aquaculture practices in China, 2004<br />
Estimated<br />
Major practices<br />
production<br />
(tonnes)<br />
Semi-intensive/intensive monoculture <strong>of</strong> shrimp in ponds 530 000<br />
Extensive polyculture <strong>of</strong> crab/shrimp/mollusk in ponds 190 000<br />
Extensive culture <strong>of</strong> seabass <strong>and</strong> other species in ponds <strong>and</strong> pens 100 000<br />
Intensive monoculture <strong>of</strong> grouper/yellow croaker <strong>and</strong> other species in cages 150 000<br />
Semi-intensive/intensive culture <strong>of</strong> porgies/red drum/cobia/amberjack in ponds 100 000<br />
Intensive monoculture <strong>of</strong> high valued fish in indoor re-circulating systems 80 000<br />
Source: calculated from BOF (2005)
148<br />
<strong>Study</strong> <strong>and</strong> <strong>analysis</strong> <strong>of</strong> <strong>feeds</strong> <strong>and</strong> <strong>fertilizers</strong> <strong>for</strong> <strong>sustainable</strong> aquaculture development<br />
1.3 Aquaculture systems <strong>and</strong> practices in China<br />
1.3.1 Aquaculture systems<br />
The classification <strong>of</strong> aquaculture systems is usually based on the level <strong>of</strong> intensity,<br />
although the culture environment <strong>and</strong> the species composition are also <strong>of</strong>ten taken into<br />
consideration. Considering these aspects, the major aquaculture systems employed in<br />
China are listed in Tables 3 <strong>and</strong> 4.<br />
1.3.2 Aquaculture practices<br />
An important indicator <strong>of</strong> the rapid development <strong>of</strong> aquaculture in China is the rate <strong>of</strong><br />
diversification in aquaculture practices in the past two decades. With over 100 different<br />
species that are farmed in a wide variety <strong>of</strong> environments throughout China it is very<br />
difficult to estimate <strong>and</strong> describe the various practices applied by farmers. Hence only<br />
some <strong>of</strong> the more important aquaculture practices <strong>and</strong> their major features are listed<br />
in Tables 5 <strong>and</strong> 6.<br />
Extensive culture <strong>of</strong> carps in small lakes <strong>and</strong> reservoirs<br />
This practice started in the 1960s <strong>and</strong> is the most extensive <strong>for</strong>m <strong>of</strong> polyculture practiced<br />
in the country (Figure 7). In these water bodies the fish are entirely dependent on natural<br />
productivity. Stocking <strong>of</strong> artificially produced seed is the only material input. Bighead<br />
<strong>and</strong> silver carp are the major species <strong>and</strong> common, crucian <strong>and</strong> grass carp, wuchang<br />
TABLE 3<br />
Inl<strong>and</strong> aquaculture systems <strong>and</strong> species in China, 2004<br />
Culture system Major species<br />
Extensive polyculture in<br />
lakes/reservoirs<br />
Semi-intensive<br />
polyculture in ponds<br />
Intensive monoculture<br />
in ponds<br />
Semi-intensive<br />
polyculture in cages<br />
Intensive monoculture<br />
in cages<br />
Semi-intensive<br />
polyculture in pens<br />
Extensive integrated<br />
rice-fish farming<br />
Highly intensive indoor<br />
re-circulating<br />
systems<br />
Wuchang bream, crucian carp, bighead carp, common carp, silver carp, grass<br />
carp, Chinese river crab<br />
Grass carp, common carp, wuchang bream, tilapia, crucian carp, bighead<br />
carp, silver carp, largemouth bass, M<strong>and</strong>arin fish, black carp, tilapia, giant<br />
freshwater prawn, oriental river prawn, Chinese river crab, s<strong>of</strong>t-shell turtle<br />
Largemouth bass, M<strong>and</strong>arin fish, Japanese eel, snakehead, catfish, tilapia,<br />
crucian carp, common carp, giant freshwater prawn, oriental river prawn,<br />
Pacific white shrimp, Chinese river crab, s<strong>of</strong>t-shell turtle<br />
Wuchang bream, grass carp, tilapia<br />
Largemouth bass, M<strong>and</strong>arin fish, catfish, tilapia, common carp<br />
Grass carp, wuchang bream, black carp, crucian carp, bighead carp, common<br />
carp, silver carp, M<strong>and</strong>arin fish, Chinese river crab<br />
Swamp eel, catfish, tilapia, crucian carp, bighead carp, common carp, silver<br />
carp, grass carp, oriental river prawn, Chinese river crab<br />
Japanese eel, s<strong>of</strong>t-shell turtle, puffer fish, sturgeon<br />
TABLE 4<br />
Brackish-water <strong>and</strong> marine aquaculture systems <strong>and</strong> species in China, 2004<br />
Culture system Major species<br />
Semi-intensive polyculture in ponds Shrimp with molluscs, marine crabs, finfish <strong>and</strong> seaweed<br />
Intensive monoculture in ponds Amberjacks, red drum, black porgy, red sea breams, percoids,<br />
Pacific white shrimp, fleshy prawn, tiger prawn<br />
Extensive culture in ponds Percoids, mullet, crab<br />
Intensive monoculture in cages Amberjacks, cobia, groupers, red drum, black porgies, red sea<br />
breams, flatfishes, large yellow croaker, seabass<br />
Extensive polyculture in pens/coves Mullet, percoids, marine crabs<br />
Intensive monoculture indoor Flounder, turbot, red drum, red sea breams<br />
re-circulating systems
Analysis <strong>of</strong> <strong>feeds</strong> <strong>and</strong> <strong>fertilizers</strong> <strong>for</strong> <strong>sustainable</strong> aquaculture development in China 149<br />
bream <strong>and</strong> Chinese river crab are secondary species<br />
<strong>and</strong> stocking is undertaken according to well defined<br />
schedules with respect to species composition, size <strong>and</strong><br />
density. Depending on the size <strong>and</strong> productivity <strong>of</strong> the<br />
waterbody, stocking densities range from 150–3000<br />
seed/ha. Care is taken to prevent the escape <strong>of</strong> fish by<br />
blocking the outlet <strong>and</strong> inlet water courses with fencing<br />
material <strong>and</strong> production ranges from 150–750 kg/ha/<br />
year without any artificial feeding <strong>and</strong> fertilization,<br />
although smaller irrigation reservoirs may be fertilized.<br />
Semi-intensive <strong>and</strong> intensive culture <strong>of</strong> carp in<br />
freshwater ponds<br />
Pond culture is the most traditional aquaculture practice<br />
<strong>and</strong> also the most important in terms <strong>of</strong> total fish<br />
production in China. Carp species are still used as the primary species in semi-intensive<br />
pond polyculture together with tilapia (mainly O. niloticus), crab, prawns <strong>and</strong> some<br />
carnivorous species such as M<strong>and</strong>arin fish <strong>and</strong> largemouth bass as secondary species. A<br />
large variety <strong>of</strong> <strong>feeds</strong> are used, including natural <strong>feeds</strong> (aquatic weeds/terrestrial grass,<br />
benthic animals, abattoir by-products <strong>and</strong> silkworm pupae) <strong>and</strong> commercial pellets.<br />
Ponds are fertilized only during preparation <strong>and</strong> stocking density, size <strong>of</strong> seed <strong>and</strong><br />
species composition is dependent on the production target.<br />
Semi-intensive <strong>and</strong> intensive culture <strong>of</strong> carp in pen<br />
Pen culture is a relative new practice that was introduced into China in the early 1980s<br />
to increase fish production in freshwater lakes. Polyculture <strong>of</strong> different carp species<br />
under semi-intensive conditions is the most common practice. Herbivorous species<br />
(grass carp <strong>and</strong> wuchang bream) are usually stocked as the primary species, while silver,<br />
bighead, common <strong>and</strong> crucian carps are used as secondary species. Commercial <strong>feeds</strong><br />
such as soybean <strong>and</strong> rapeseed cake, pellet <strong>feeds</strong> <strong>and</strong> natural feed such as aquatic weeds/<br />
terrestrial grasses/vegetables <strong>and</strong> freshwater molluscs are commonly used. Production<br />
ranges between 10–15 tonnes/ha/year although levels <strong>of</strong> 37.5 tonnes/ha have been<br />
attained under experimental conditions.<br />
Extensive culture <strong>of</strong> carps, tilapia <strong>and</strong> catfish in paddy field<br />
This is a traditional aquaculture practice <strong>and</strong> is particularly popular in southern China<br />
(Figure 8). Peripheral <strong>and</strong> central crossing trenches are constructed in the paddy to<br />
maintain the required minimum water depth throughout<br />
the culture period. Fish are stocked be<strong>for</strong>e or after rice<br />
seedling are transplanted at very low densities. Because<br />
<strong>of</strong> the short culture period, farmers normally stock large<br />
juveniles. Supplementary <strong>feeds</strong> are applied occasionally<br />
<strong>and</strong> the application <strong>of</strong> pesticides is well managed to<br />
ensure the biosafety <strong>of</strong> the fish. Production ranges<br />
between 450–750 kg/ha/year, depending on input levels<br />
<strong>and</strong> management.<br />
Intensive monoculture <strong>of</strong> tilapia, common <strong>and</strong> crucian<br />
carp in ponds<br />
Intensive monoculture <strong>of</strong> tilapia, common <strong>and</strong><br />
crucian carp is a more recent practice in China. It is<br />
characterized by high stocking densities <strong>and</strong> complete<br />
dependence on pellet <strong>feeds</strong>. Production ranges between<br />
FIGURE 7<br />
Harvesting <strong>of</strong> carp with combined<br />
fishing gears in Xinanjiang Reservoir,<br />
Zhejiang province<br />
FIGURE 8<br />
Extensive culture <strong>of</strong> fish/prawn/crab in<br />
a paddy field, Dongping, Shangdong<br />
province<br />
COURTESY OF FANG XIUZHEN
150<br />
FIGURE 9<br />
Intensive monoculture <strong>of</strong> tilapia in<br />
cages in a reservoir, Hepu County,<br />
Guangxi Autonomous region<br />
<strong>Study</strong> <strong>and</strong> <strong>analysis</strong> <strong>of</strong> <strong>feeds</strong> <strong>and</strong> <strong>fertilizers</strong> <strong>for</strong> <strong>sustainable</strong> aquaculture development<br />
12–22.5 tonnes/ha/year. Tilapias are cultured mainly<br />
in southern China, while common <strong>and</strong> crucian carp<br />
are more generally produced in central <strong>and</strong> northern<br />
China.<br />
Intensive monoculture <strong>of</strong> common carp <strong>and</strong> tilapia in<br />
cages<br />
Intensive, cage monoculture <strong>of</strong> common carp is more<br />
popular in northern China, while intensive cage culture<br />
<strong>of</strong> tilapia is mainly practiced in southern China (Figure 9).<br />
The fish are entirely dependent on pellets <strong>and</strong> <strong>for</strong><br />
common carp <strong>and</strong> both floating <strong>and</strong> submerged cages are<br />
used. Production <strong>of</strong> common carp in small cages can reach 200–300 kg/m 3 /cycle. Tilapia<br />
are raised only in floating cages <strong>and</strong> production ranges from 50–100 kg/m 3 /cycle.<br />
Extensive culture <strong>of</strong> freshwater prawns <strong>and</strong> crabs in paddy fields<br />
Extensive culture <strong>of</strong> freshwater prawns <strong>and</strong> crabs in paddy fields is a recent<br />
development, particularly in central <strong>and</strong> southern China. Production is basically<br />
dependent on natural food in the paddy fields. Supplementary <strong>feeds</strong> (locally available<br />
grain by-products <strong>and</strong> natural <strong>feeds</strong>) are sometimes applied. Average production is 7.5<br />
tonnes <strong>of</strong> rice <strong>and</strong> 300–450 kg <strong>of</strong> prawns or crabs per hectare per season. Silver <strong>and</strong>/or<br />
bighead carp are occasionally also stocked into the ponds at low densities.<br />
Semi-intensive <strong>and</strong> intensive monoculture <strong>of</strong> freshwater prawns in ponds<br />
Semi-intensive <strong>and</strong> intensive monoculture <strong>of</strong> freshwater prawns in ponds is also a<br />
relatively new practice in China. It started with Macrobrachium rosenbergii <strong>and</strong> now<br />
also includes M. nipponense <strong>and</strong> Litopenaeus vannamei. L. vannamei is currently the<br />
most important crustacean produced in freshwater. The prawns or shrimp are fed on<br />
pellets <strong>and</strong> organic fertilizer is used to enhance natural productivity during the initial<br />
culture stages. Production levels vary by species from 1.5–3.0 tonnes/ha/cycle <strong>for</strong> M.<br />
nipponense, 6.0–7.5 tonnes <strong>for</strong> L. vannamei <strong>and</strong> 3.0–4.5 tonnes <strong>for</strong> M. rosenbergii.<br />
Intensive monoculture <strong>of</strong> eels in ponds<br />
Pond aquaculture is the most common farming practice <strong>for</strong> Japanese <strong>and</strong> European<br />
eels in China, particularly in Fujian <strong>and</strong> Guangdong provinces. Production is based<br />
on <strong>for</strong>mulated <strong>feeds</strong> <strong>and</strong> organic fertilizer is only applied during pond preparation<br />
to enhance natural food production during the initial stages. Average production is<br />
around 15 tonnes/ha/cycle.<br />
Semi-intensive <strong>and</strong> intensive culture <strong>of</strong> shrimp in brackish-water ponds<br />
Semi-intensive <strong>and</strong> intensive brackish-water pond culture is the major culture practice<br />
<strong>for</strong> L. vannamei, Penaeus monodon, Penaeus chinensis <strong>and</strong> other marine shrimp species.<br />
It is mainly practiced in coastal areas <strong>and</strong> production is mainly based on use <strong>of</strong> pellet<br />
<strong>feeds</strong>. Organic fertilizer is used only in semi-intensive culture practices. Production<br />
in semi-intensive farming ranges from 1.5–2.5 tonnes/ha/cycle <strong>for</strong> P. monodon, P.<br />
chinensis <strong>and</strong> P. japonicus <strong>and</strong> between 4.5–9.0 tonnes/ha/cycle <strong>for</strong> L. vannamei.<br />
Intensive farming <strong>of</strong> shrimp in brackish-water ponds is normally restricted to L.<br />
vannamei, with production levels <strong>of</strong> 15–30 tonnes/ha/cycle.<br />
Intensive monoculture <strong>of</strong> finfish in marine cages<br />
Intensive, cage monoculture <strong>of</strong> large yellow croaker, grouper, cobia (Figure 10) <strong>and</strong> red<br />
drum is a relatively recent development. The most commonly used feed is trash fish,<br />
although <strong>for</strong>mulated <strong>feeds</strong> have now also been developed <strong>and</strong> used <strong>for</strong> some species.
COURTESY OF LIANG MENGQUING<br />
Analysis <strong>of</strong> <strong>feeds</strong> <strong>and</strong> <strong>fertilizers</strong> <strong>for</strong> <strong>sustainable</strong> aquaculture development in China 151<br />
FIGURE 10<br />
Intensive monoculture <strong>of</strong> cobia in marine<br />
cages, Sh<strong>and</strong>ong province<br />
Production varies according to species <strong>and</strong> ranges<br />
from 15–30 kg/m 3 /cycle.<br />
FIGURE 11<br />
Intensive culture <strong>of</strong> marine fish in<br />
indoor running water system, Sh<strong>and</strong>ong<br />
province<br />
Intensive culture <strong>of</strong> marine finfish in indoor flow-through or re-circulating systems<br />
The use <strong>of</strong> indoor, marine re-circulating or flow-through systems <strong>for</strong> intensive<br />
monoculture <strong>of</strong> flounder, turbot, Japanese/European eel <strong>and</strong> puffer fish is also a recent<br />
initiative (Figure 11). Only <strong>for</strong>mulated <strong>feeds</strong> are used in these systems <strong>and</strong> production<br />
varies by species from 3–10 kg/m 3 /cycle.<br />
TABLE 5<br />
Summary <strong>of</strong> major inl<strong>and</strong> aquaculture practices in China, 2004<br />
Culture<br />
environment<br />
Polyculture/<br />
monoculture<br />
Major species Intensity level Food/feed type Yield per cycle*<br />
Lake/reservoir Polyculture Carps, Chinese river crab Extensive Natural food 150–750 kg/ha<br />
Pond<br />
Cage in river/<br />
lake/reservoir<br />
Pen in lake/<br />
reservoir<br />
Rice paddy<br />
Indoor<br />
re-circulating<br />
Polyculture<br />
Carps, tilapia, s<strong>of</strong>tshelled<br />
turtle, Chinese<br />
river crab, M<strong>and</strong>arin fish<br />
Semiintensive<br />
Natural food,<br />
commercial feed<br />
7.5–15.0 tonnes/ha<br />
Monoculture Common & crucian carp Intensive Commercial feed 15.0–22.5 tonnes/ha<br />
Monoculture Tilapia Intensive Commercial feed 15–20 tonnes/ha<br />
Monoculture Japanese/European eel Intensive Commercial feed 15 tonnes/ha<br />
Monoculture Giant freshwater prawn Intensive Commercial feed 3.0–4.5 tonnes/ha<br />
Monoculture Pacific white shrimp Intensive Commercial feed 6–12 tonnes/ha<br />
Monoculture Oriental river prawn<br />
Monoculture Chinese river crab<br />
Polyculture<br />
Grass carp, Wuchang<br />
bream<br />
SemiintensiveSemiintensiveSemiintensive<br />
Natural food <strong>and</strong><br />
commercial feed<br />
Natural food <strong>and</strong><br />
commercial feed<br />
Natural food <strong>and</strong><br />
commercial feed<br />
1.5–3.0 tonnes/ha<br />
1.5–3.0 tonnes/ha<br />
30–60 kg/m 3<br />
Monoculture Tilapia Intensive Commercial feed 80–100 kg/m3 Monoculture Common carp Intensive Commercial feed 100–200 kg/m3 Monoculture Catfish Intensive<br />
Trash fish <strong>and</strong><br />
commercial feed<br />
60–100 kg/m3 Monoculture<br />
Polyculture Carps<br />
Polyculture<br />
M<strong>and</strong>arin fish,<br />
largemouth bass<br />
Chinese river crab with<br />
carps<br />
Semiintensive<br />
Extensive/<br />
semiintensiveSemiintensive<br />
Polyculture Carps, catfish, prawn Extensive<br />
Monoculture<br />
Monoculture<br />
Chinese river crab,<br />
swamp eel<br />
Japanese eel/European<br />
eel<br />
Extensive<br />
Monoculture S<strong>of</strong>t-shelled turtle Intensive<br />
Live fish/trash fish 10–20 kg/m 3<br />
Natural food <strong>and</strong><br />
commercial feed<br />
Natural food <strong>and</strong><br />
commercial feed<br />
Natural food <strong>and</strong><br />
supplementary feed<br />
Natural food <strong>and</strong><br />
supplementary feed<br />
10–20 tonnes/ha<br />
Crab 6–9 tonnes/ha<br />
450–750 kg/ha<br />
225–450 kg/ha<br />
Intensive Commercial feed 10 kg/m 3<br />
Natural food <strong>and</strong><br />
commercial feed<br />
5–10 kg/m 3<br />
*Duration <strong>of</strong> a production cycle ranges from 6 months to 3 years depending upon the species <strong>and</strong> the region where aquaculture is<br />
practised. The duration <strong>of</strong> production cycle <strong>of</strong> prawn <strong>and</strong> shrimp is usually 6 months, 1.5–2.0 years <strong>for</strong> most carp species, while it<br />
is 2–3 <strong>for</strong> eel.<br />
COURTESY OF LIANG MENGQUING
152<br />
<strong>Study</strong> <strong>and</strong> <strong>analysis</strong> <strong>of</strong> <strong>feeds</strong> <strong>and</strong> <strong>fertilizers</strong> <strong>for</strong> <strong>sustainable</strong> aquaculture development<br />
TABLE 6<br />
Summary <strong>of</strong> major marine/brackish aquaculture practices in China, 2004<br />
Culture<br />
environment<br />
Brackish-water<br />
ponds<br />
Polyculture/<br />
monoculture<br />
Polyculture<br />
Marine cages Monoculture<br />
Indoor<br />
re-circulating<br />
Major species Intensity level Food/feed type Yield per cycle<br />
Shrimp, mullet, tilapia,<br />
crab<br />
Semi-intensive<br />
Commercial <strong>feeds</strong><br />
<strong>and</strong> natural food<br />
4–6 tonnes/ha<br />
Monoculture Shrimp Intensive Commercial <strong>feeds</strong> 15–20 tonnes/ha<br />
Monoculture Tilapia/black porgy<br />
Intensive/semiintensive<br />
Commercial <strong>feeds</strong> 15.0–22.5 tonnes/ha<br />
Monoculture Shrimp Semi-intensive<br />
Commercial <strong>feeds</strong><br />
<strong>and</strong> natural food<br />
1.5–3.0 tonnes/ha<br />
Large yellow croaker/<br />
grouper/tilapia/red sea<br />
bream/black porgy/<br />
seabass<br />
Intensive<br />
Monoculture Flounder, trout Highly intensive<br />
Trash fish/<br />
commercial <strong>feeds</strong><br />
Commercial <strong>feeds</strong>,<br />
moist pellet<br />
15–30 kg/m 3<br />
10 kg/m 3<br />
2. FERTILIZERS, FEED INGREDIENTS AND FEEDS<br />
2.1 Feed Ingredients<br />
Aquaculture is a development priority <strong>of</strong> the government <strong>and</strong> the industry is expected<br />
to make further advances in the 21 st century. The availability <strong>of</strong> feed ingredients is<br />
one <strong>of</strong> the key factors that will impact on the future development <strong>of</strong> aquaculture in<br />
China. For this reason it is pivotal to assess the future availability <strong>of</strong> feed ingredients.<br />
The chemical composition, amino acid pr<strong>of</strong>ile, mineral <strong>and</strong> vitamin content <strong>and</strong> the<br />
apparent nutrient <strong>and</strong> amino acid digestibility <strong>of</strong> selected feed ingredients <strong>of</strong> animal<br />
<strong>and</strong> plant origin by various aquatic species are presented in Tables 7 to 18.<br />
2.1.1 Feed ingredients <strong>of</strong> animal origin<br />
The major feed ingredients <strong>of</strong> animal origin in China are fishmeal, hydrolyzed poultry<br />
feather meal, squid meal, fish silage, meat by-product meals, poultry by-product meal,<br />
blood products, silkworm pupae meal <strong>and</strong> shrimp meal. Many <strong>of</strong> these ingredients,<br />
especially fishmeal, are imported <strong>and</strong> ef<strong>for</strong>ts are being made to partially replace<br />
imported feed ingredients with locally available material.<br />
Fishmeal<br />
Most <strong>of</strong> the locally produced fishmeal is produced from various clupeid species<br />
such as Engraulis japanicus, Sardinella longiceps, Coilia ectenes, <strong>and</strong> Sardinops sagax<br />
melanosticta. Occasionally fishmeal from other species is also available. Approximately<br />
400 000 tonnes <strong>of</strong> fishmeal is produced in China, <strong>of</strong> which about 70–80 percent is<br />
used in aqua<strong>feeds</strong>. The escalating cost <strong>of</strong> fishmeal is now beginning to limit its use in<br />
aqua<strong>feeds</strong>. The average optimum inclusion levels <strong>of</strong> fishmeal in <strong>feeds</strong> <strong>for</strong> carnivores<br />
is 50.0 percent, omnivores/herbivores 25.0 percent, penaeid shrimps 25.0 percent <strong>and</strong><br />
other crustaceans 20.0 percent.<br />
Squid meal<br />
Squid meal is a by-product <strong>of</strong> squid processing <strong>and</strong> is an important aquafeed ingredient,<br />
particularly <strong>for</strong> shrimp. Squid meal has growth promoting properties <strong>and</strong> is a good<br />
attractant. Studies have shown that squid contains some unidentified growth enhancing<br />
factor, which presently is simply referred to as the “squid factor”. Growth <strong>of</strong> Pacific<br />
white shrimp (Litopenaeus vannamei) is enhanced by 2.5–20 percent when the diet is<br />
supplemented with squid meal. Squid meal is produced in China <strong>and</strong> is also imported.<br />
Reliable production statistics are not available.<br />
Fish <strong>and</strong> other marine silage<br />
Fish <strong>and</strong> other marine silages are liquid concentrates, manufactured from trash fish<br />
<strong>and</strong> by-products <strong>and</strong> wastes <strong>of</strong> fish processing. The crude protein content (on a dry
Analysis <strong>of</strong> <strong>feeds</strong> <strong>and</strong> <strong>fertilizers</strong> <strong>for</strong> <strong>sustainable</strong> aquaculture development in China 153<br />
matter basis) varies widely, although the amino acid pr<strong>of</strong>ile is not significantly different<br />
from that <strong>of</strong> dried fish. The level <strong>of</strong> free amino acids in fish silage is high. Silage made<br />
from marine fish <strong>and</strong> crustaceans has chemo-attractant properties. In particular, shrimp<br />
silage has some feeding stimulatory properties <strong>for</strong> a variety <strong>of</strong> fish species. Fish silage<br />
may also contain unidentified growth enhancing factors.<br />
Meat by-product meal<br />
Meat by-products include abattoir wastes, or meat that has been confiscated <strong>and</strong> not<br />
fit <strong>for</strong> human consumption, scraps from the meat processing <strong>and</strong> canning industry,<br />
as well as processed livestock casualties. These products are reduced to either meat<br />
or meat <strong>and</strong> bone meal. The chemical composition <strong>of</strong> meat meal <strong>and</strong> meat <strong>and</strong> bone<br />
meal varies widely <strong>and</strong> depends on the quality <strong>and</strong> origin <strong>of</strong> the raw material <strong>and</strong> the<br />
rendering plant.<br />
2.1.2 Feed ingredients <strong>of</strong> plant origin <strong>and</strong> single cell proteins<br />
The main ingredients <strong>of</strong> plant origin that are used or have potential to be used in<br />
aqua<strong>feeds</strong> in China are cottonseed meal, rapeseed meal, soybean meal, peanut meal,<br />
sunflower meal, wheat <strong>and</strong> wheat by-products <strong>and</strong> rice by-products. Most are locally<br />
produced <strong>and</strong> the country is only partially dependent on imports.<br />
Cotton seed meal<br />
It is estimated that about 8–10 million tonnes <strong>of</strong> cottonseed is produced in China<br />
per annum (http://www.chinafeed.org.cn/cms/code/business/include/php/189909.<br />
htm). It is estimated that about 4–5 million tonnes <strong>of</strong> cottonseed meal is produced<br />
annually <strong>of</strong> which approximately 60 percent is used in aqua<strong>feeds</strong>.<br />
Rape seed meal<br />
The reported annual production <strong>of</strong> rapeseed meal is about 5 million tonnes <strong>and</strong> it is<br />
estimated that approximately 80 percent is used by the aquafeed industry.<br />
Soybean meal<br />
Soybean meal is the most important protein source in animal <strong>feeds</strong>. It is used <strong>for</strong><br />
partial replacement <strong>of</strong> fishmeal in many aqua<strong>feeds</strong> <strong>and</strong> in some instances replaces<br />
fishmeal completely. It is commonly used because <strong>of</strong> its high protein content <strong>and</strong> global<br />
availability. Annual soybean meal production in China is around 15.50–17.55 million<br />
tonnes, the greater proportion <strong>of</strong> which is solvent extracted.<br />
Peanut meal<br />
Similarly, peanut meal is one <strong>of</strong> the most important protein sources in animal <strong>feeds</strong> <strong>and</strong><br />
is also used as a partial or total replacement <strong>for</strong> fishmeal. About 14–15 million tonnes<br />
are produced annually, <strong>of</strong> which about 30–40 percent is used in aqua<strong>feeds</strong> <strong>and</strong> the<br />
remainder is used <strong>for</strong> livestock feed.<br />
Wheat <strong>and</strong> wheat by-products<br />
Available wheat by-products are wheat bran, wheat middlings, wheat germ <strong>and</strong> wheat<br />
gluten. About 100 million tonnes <strong>of</strong> wheat is produced annually in China.<br />
Rice by-products<br />
The most commonly used rice by-product in aqua<strong>feeds</strong> is the bran. It is used mainly<br />
as an energy source. Rice pollard is also used in aqua<strong>feeds</strong>, but to a lesser extent. Rice<br />
bran is most <strong>of</strong>ten used in diets <strong>for</strong> omnivorous <strong>and</strong> herbivorous fish. It is inexpensive<br />
<strong>and</strong> used mainly <strong>for</strong> species such as grass carp (Ctenopharyngodon idella), silver carp<br />
(Hypophthalmichthys molitrix) <strong>and</strong> Nile tilapia (Oreochromis niloticus).
154<br />
<strong>Study</strong> <strong>and</strong> <strong>analysis</strong> <strong>of</strong> <strong>feeds</strong> <strong>and</strong> <strong>fertilizers</strong> <strong>for</strong> <strong>sustainable</strong> aquaculture development<br />
There are several locally produced single cell protein sources that are used as<br />
aquafeed ingredients <strong>and</strong> these are brewer's yeast, molasses yeast <strong>and</strong> brewers grain.<br />
2.2 Fertilizers<br />
Inorganic <strong>and</strong> organic <strong>fertilizers</strong> are applied in extensive <strong>and</strong> semi-intensive pond<br />
systems to stimulate the growth <strong>of</strong> natural food, although the popularity <strong>of</strong> <strong>fertilizers</strong><br />
use in aquaculture is declining. All <strong>fertilizers</strong> are locally produced.<br />
Inorganic fertilizer<br />
The most widely used inorganic <strong>fertilizers</strong> in aquaculture are mono-ammonium<br />
phosphate <strong>and</strong> di-ammonium phosphate as nitrogen <strong>and</strong> phosphorus sources, urea as<br />
nitrogen source <strong>and</strong> ammonium sulphate.<br />
Organic fertilizer<br />
The most widely used organic <strong>fertilizers</strong> in ponds are pig, chicken <strong>and</strong> duck manure,<br />
cow dung <strong>and</strong> green fodder.<br />
2.3 Feeding practices in relation to farming systems <strong>and</strong> species<br />
Grass, silver, common, bighead <strong>and</strong> crucian carp account <strong>for</strong> more than 70 percent<br />
<strong>of</strong> the total freshwater aquaculture production <strong>and</strong> <strong>of</strong> these, grass carp is the most<br />
important species. About 70 percent <strong>of</strong> aqua<strong>feeds</strong> produced annually in China is<br />
consumed by grass carp, common carp, crucian carp <strong>and</strong> tilapia.<br />
Herbivorous fish.<br />
The most common herbivorous aquaculture species in China are grass <strong>and</strong> silver carp.<br />
Under cage culture conditions silver carp <strong>and</strong> bighead carp are fed on compound <strong>feeds</strong>,<br />
consisting <strong>of</strong> mainly plant based ingredients with a 30–40 percent crude protein content.<br />
The commercial carp feed industry supplies pressed <strong>and</strong> extruded floating pellets <strong>and</strong><br />
is well established in the major carp producing regions. The growout period <strong>for</strong> carp<br />
under cage culture conditions ranges from 6 months to 1 year in tropical regions <strong>and</strong><br />
in temperate regions may range from 1–2 years.<br />
Omnivorous fish<br />
The most common omnivorous species produced in China are common carp, crucian<br />
carp <strong>and</strong> Nile tilapia. Omnivorous fish larvae are fed on microparticulate diets in<br />
combination with Brachionus, Acartia <strong>and</strong> Pseudodiaptomus nauplii. Tilapia are farmed<br />
in a multitude <strong>of</strong> systems <strong>and</strong> environments (ponds, cages, raceways <strong>and</strong> reservoirs,<br />
in freshwater <strong>and</strong> brackish water, under mono- <strong>and</strong> polyculture conditions <strong>and</strong><br />
under extensive conditions with limited inputs <strong>and</strong> under semi-intensive <strong>and</strong> superintensive<br />
stocking densities with high inputs, in static <strong>and</strong> in flow-through water <strong>and</strong><br />
in recirculation systems using bi<strong>of</strong>iltration). Under most <strong>of</strong> these conditions they are<br />
fed on compound <strong>feeds</strong>.<br />
The main protein sources used in tilapia <strong>feeds</strong> are fishmeal, soybean meal, peanut,<br />
rapeseed <strong>and</strong> cottonseed meal as well as meat <strong>and</strong> bone meal, meat meal <strong>and</strong> feather<br />
meal. Main energy sources include animal <strong>and</strong> vegetable fats, corn, wheat <strong>and</strong> wheat<br />
by-products. Vitamins <strong>and</strong> minerals are included separately, or as combined premixes.<br />
The <strong>feeds</strong> are also supplemented with phosphate <strong>and</strong> limestone <strong>and</strong> other additives<br />
may include antioxidants <strong>and</strong> binders.<br />
Carnivorous fish<br />
The main carnivorous species are large yellow croaker, seabass, black rock fish,<br />
grouper, cobia, red sea bream, turbot, flounder, red drum, <strong>and</strong> puffer. Large yellow<br />
croaker, black rock fish, grouper, cobia <strong>and</strong> red sea bream are cultured in cages using
Analysis <strong>of</strong> <strong>feeds</strong> <strong>and</strong> <strong>fertilizers</strong> <strong>for</strong> <strong>sustainable</strong> aquaculture development in China 155<br />
mainly trash fish. Seabass, puffer <strong>and</strong> red drum are produced in ponds with commercial<br />
<strong>feeds</strong>, farm-made <strong>feeds</strong> <strong>and</strong> trash fish. Turbot <strong>and</strong> flounder are cultured indoors in<br />
flow-through or re-circulating systems with farm-made feed <strong>and</strong> commercial <strong>feeds</strong>.<br />
Carnivorous fish <strong>feeds</strong> usually contain high levels <strong>of</strong> fishmeal <strong>and</strong> moderately low level<br />
<strong>of</strong> plant ingredients (primarily soybean meal).<br />
Crustaceans<br />
Shrimp are farmed mainly in ponds under semi-intensive conditions using artificial<br />
<strong>feeds</strong>. Shrimp <strong>feeds</strong> normally include moderately high levels <strong>of</strong> fishmeal, soybean meal,<br />
peanut meal, shrimp meal <strong>and</strong> wheat meal.<br />
TABLE 7<br />
Chemical composition (percent dry matter) <strong>of</strong> major feed ingredients <strong>of</strong> animal origin<br />
Ingredients<br />
Dry<br />
matter<br />
Crude<br />
protein<br />
Crude<br />
lipid<br />
Ash<br />
Crude<br />
fibre<br />
NFE Ca P<br />
Fishmeal<br />
Anchovy 92.0 68.2 9.3 16.9 - 5.6 - -<br />
Estuarine tapertail anchovy 93.1 54.9 2.4 11.3 0.2 1.9 - -<br />
Polack 94.0 55.1 12.8 26.7 0.8 4.6 - -<br />
Sardine 93.0 63.4 9.8 15.3 0.3 9.6 - -<br />
Sealed sardine 93.9 62.9 8.3 14.8 0.2 3.1 - -<br />
Mixed fish 92.6 58.3 10.0 22.5 0.6 1.2 - -<br />
Poultry feather meal 92.0 84.0 2.5 2.8 1.5 0.6 0.4 0.70<br />
Squid meal 8.0–13.0 40.0–45.0 16.0–21.0 5.0–10.0 - - - -<br />
Fish silage 24.9 58.3 16.0 14.7 3.6 28.9<br />
Meat meal 94.6 54.0 8.8 27.5 2.4 - 8.0 3.80<br />
Meat <strong>and</strong> bone meal 94.0 46.0 10.0 35 2.5 - 10.7 5.40<br />
Blood meal 90.0 80.0 1.0 4.5 1.0 - 0.3 0.25<br />
Silkworm pupae meal (full-fat) 88.9 55.1 23.2 3.8 5.5 6.4 - -<br />
Silkworm pupae meal (de-oiled) 91.9 72.8 2.0 5.6 6.2 7.3 - -<br />
Shrimp meal 92.5 37.2 1.3 38.2 21.4 - 15.0 2.20<br />
Shrimp head meal 96.8 58.2 8.9 22.6 11.9 - - -<br />
Shrimp shell meal 96.0 45.9 0.4 31.7 27.2 - 11.1 3.60<br />
Source: Unpublished data <strong>of</strong> National Centre <strong>for</strong> Quality Supervision <strong>and</strong> Test <strong>of</strong> Aquatic Product, Qingdao,<br />
P.R. China (pers. comm.)<br />
TABLE 8<br />
Amino acid pr<strong>of</strong>ile (percent dry matter) <strong>of</strong> major feed ingredients <strong>of</strong> animal origin<br />
Amino acids<br />
Anchovy<br />
(true)<br />
Tapertail<br />
anchovy<br />
Fishmeal <strong>of</strong> different origin Poultry<br />
Polack Sardine<br />
Sealed<br />
sardine<br />
Mixed<br />
fishmeal<br />
feather<br />
meal<br />
Squid<br />
meal<br />
Fish<br />
silage<br />
Meat<br />
meal<br />
Meat<br />
& bone<br />
meal<br />
Blood<br />
meal*<br />
Arginine 3.88 6.6 6.6 6.6 5.3 5.4 5.44 2.67 4.9 3.73 3.53 3.19<br />
Histidine 1.54 2.0 2.4 2.7 1.7 2.0 0.51 4.15 1.8 1.06 0.90 3.96<br />
Isoleucine 4.70 4.8 4.7 4.3 5.1 4.2 3.56 1.58 3.2 1.89 1.66 0.90<br />
Leucine 7.70 8.1 7.5 7.1 7.4 7.2 6.46 2.40 5.7 3.44 3.05 10.12<br />
Lysine 5.87 7.2 7.7 8.0 0.2 6.9 1.63 3.09 6.6 3.43 2.98 5.99<br />
Methionine 2.90 3.0 2.8 2.4 2.6 2.9 0.48 0.63 2.5 0.76 0.66 0.91<br />
Phenylalanine 4.20 3.8 3.9 3.4 3.2 3.5 3.14 1.58 2.9 1.93 1.73 5.47<br />
Threonine 4.40 5.2 4.2 4.0 4.2 4.1 0.38 1.64 3.1 1.79 1.69 1.02<br />
Tryptophan - - - - - - 0.52 0.90 1.1 0.87 0.77 1.73<br />
Valine 5.40 5.3 5.8 4.9 - 4.6 6.03 2.04 4.3 2.64 2.38 6.41<br />
Tyrosine 1.20 1.0 1.1 0.7 0.9 - - - - - - -<br />
*Percent <strong>of</strong> crude protein<br />
Source: Unpublished data <strong>of</strong> National Centre <strong>for</strong> Quality Supervision <strong>and</strong> Test <strong>of</strong> Aquatic Product, Qingdao,<br />
P.R. China (pers. comm.)
156<br />
<strong>Study</strong> <strong>and</strong> <strong>analysis</strong> <strong>of</strong> <strong>feeds</strong> <strong>and</strong> <strong>fertilizers</strong> <strong>for</strong> <strong>sustainable</strong> aquaculture development<br />
TABLE 9<br />
Apparent nutrient digestibility (%) <strong>of</strong> various ingredients <strong>of</strong> animal origin by various aquatic<br />
species<br />
Feed ingredients/aquatic species<br />
Fishmeal (local)<br />
Dry matter Crude protein Crude lipid Gross energy P<br />
1<br />
Seabass 62.03 92.30 89.40 83.96 85.52<br />
Grass carp 81.51 84.04 83.83 - -<br />
Chinese long-snout catfish - 90.91 83.00 - -<br />
Black carp<br />
Fishmeal (imported)<br />
68.17 88.38 81.65 79.16 12.62<br />
1<br />
Grass carp 83.06 87.54 80.56 - -<br />
Nile tilapia - 92.21 - - -<br />
Fleshy prawn - 91.47 - - -<br />
Blunt nose black bream 64.20 83.90 98.10 - -<br />
Black carp<br />
Poultry feather meal<br />
77.35 89.30 100.00 91.54 -<br />
2<br />
Nile tilapia - 93.36 - - -<br />
Fleshy prawn - 76.42 - - -<br />
Blunt nose black bream<br />
Meat & bone meal<br />
62.20 86.90 - - -<br />
3<br />
Seabass 58.62 77.39 88.31 67.94 53.39<br />
Blunt nose black bream 70.00 89.10 91.80 - 15.00<br />
Black carp 71.39 88.00 97.00 79.66 25.42<br />
Grass carp 59.13 79.21 81.36 - -<br />
Fleshy prawn<br />
Meat meal<br />
- 81.35 - - -<br />
3<br />
Seabass 70.10 87.30 82.80 - -<br />
Pacific white shrimp<br />
Blood meal<br />
76.00 90.00 - - -<br />
4<br />
Nile tilapia - 91.58 - - -<br />
Blunt nose black bream 88.00 83.38 0.22 - 0.24<br />
Black carp 85.42 92.19 - 86.62 -<br />
Chinese long-snout catfish - 85.93 - 82.27 -<br />
Fleshy prawn - 73.47 - - -<br />
Source: 1 Chang et al. (2005); Lei, Yang <strong>and</strong> He (1996); Lin, Luo <strong>and</strong> Ye (2001); Liu, Zhu <strong>and</strong> Chen (1990); Rong,<br />
Liang <strong>and</strong> Yue (1994); Ye, Lin <strong>and</strong> Luo (2003); You et al., (1993); Wu et al., (1995); Wu et al., (2000), 2 Rong, Liang<br />
<strong>and</strong> Yue (1994); Wu et al, (1995); Wu et al, (2000); 3 Chang et al. (2005); Lin, Luo <strong>and</strong> Ye (2001); Liu, Zheng <strong>and</strong><br />
Zhao (2004); Rong, Liang <strong>and</strong> Yue (1994); 4 Lei, Yang <strong>and</strong> He (1996); Liu, Zhu <strong>and</strong> Chen (1990); Rong, Liang <strong>and</strong><br />
Yue (1994); You et al. (1993); Wu et al. (1995); Wu et al. (2000)
Analysis <strong>of</strong> <strong>feeds</strong> <strong>and</strong> <strong>fertilizers</strong> <strong>for</strong> <strong>sustainable</strong> aquaculture development in China 157<br />
TABLE 10<br />
Apparent amino acid digestibility (%) <strong>of</strong> various ingredients <strong>of</strong> animal origin by various aquatic species<br />
Ingredients/species<br />
Fishmeal (local)<br />
Arg His Ile Leu Lys Met Phe Thr Try Val Tyr Cys<br />
1<br />
Seabass 94.37 83.32 91.41 90.53 89.03 89.58 90.85 93.63 - 92.34 - -<br />
Grass carp<br />
Fishmeal (imported)<br />
84.90 93.10 87.50 85.50 90.50 93.80 74.9 90.10 - 89.80 - -<br />
1<br />
Grass carp 86.70 90.00 98.90 87.30 91.30 90.90 98.10 85.30 - 88.60 - -<br />
Nile tilapia 94.90 93.60 92.10 91.30 93.20 94.60 90.50 92.30 - 90.80 92.70 85.90<br />
Fleshy prawn<br />
Poultry feather meal<br />
90.91 91.02 90.96 90.92 90.91 60.91 90.92 90.82 - 90.84 - -<br />
2<br />
Nile tilapia 94.50 59.30 96.20 94.20 56.50 89.90 93.60 92.50 - 95.80 91.50 90.80<br />
Fleshy prawn<br />
Meat & bone meal<br />
76.42 77.95 76.43 76.39 76.61 76.49 76.41 76.42 - 76.37 - -<br />
3<br />
Seabass<br />
Meat meal<br />
82.79 81.41 75.47 79.12 82.57 79.03 75.28 74.57 - 77.95 - -<br />
3<br />
Grass carp 80.40 87.00 74.00 84.60 79.00 88.50 71.00 84.20 - 81.40 - -<br />
Fleshy prawn<br />
Blood meal<br />
81.47 81.34 81.37 81.35 81.89 81.18 81.30 81.35 - 81.35 - -<br />
4<br />
Nile tilapia 93.90 95.50 - 91.90 90.40 78.10 92.30 87.20 - 90.60 - -<br />
Fleshy prawn 49.70 40.49 49.57 49.30 50.32 49.45 49.27 49.76 51.56 49.70 - -<br />
Source: 1 Chang et al. (2004); Liu, Zheng <strong>and</strong> Zhao (2004); Rong, Liang <strong>and</strong> Yue (1994); Wu et al. (2000), 2 Rong, Liang <strong>and</strong> Yue<br />
(1994); Wu et al. (2000), 3 Chang et al. (2004); Rong, Liang <strong>and</strong> Yue (1994); Ye, Lin <strong>and</strong> Luo (2003), 4 Rong, Liang <strong>and</strong> Yue (1994);<br />
Wu et al. (2000)<br />
TABLE 11<br />
Chemical composition (percent dry matter) <strong>of</strong> major plant feed ingredients <strong>and</strong> single cell proteins<br />
Ingredients<br />
Plant based feed ingredients<br />
Dry matter Crude protein Crude lipid Ash<br />
Crude<br />
fibre<br />
NFE Ca P<br />
Rape seed meal 89.0 36.5 3.5 4.8 11.7 20.5 0.68 1.17<br />
Soybean meal, solvent extracted 89.5 44.5 1.0 6.0 6.5 - 0.25 0.60<br />
Soybean meal, expeller 89.0 42.0 4.0 6.0 6.0 - 0.25 0.60<br />
Peanut meal, solvent extracted 91.0 47.0 1.0 5.5 - - 0.20 0.60<br />
Peanut meal, expeller 91.0 45.0 5.0 5.5 4.2 - 0.20 0.55<br />
Peanut meal with hull 88.6 29.3 9.9 6.3 27.9 - 0.26 0.29<br />
Wheat flour 89.0 13.0 2.0 1.8 3.0 - 0.05 0.40<br />
Wheat bran 87.5 15.5 4.0 6.0 10.5 - 0.10 1.15<br />
Wheat middling 87.5 15.5 4.0 4.5 7.5 - 0.10 0.90<br />
Wheat germ 89.5 25.0 8.0 4.5 3.0 - 0.05 1.00<br />
Rice bran, de-fatted 89.0 15.5 1.0 8.0 8.5 - 0.10 1.40<br />
Rice bran, full-fat 89.5 13.0 14.0 16.7 12.0 - 0.10 1.60<br />
Rice hull<br />
Single cell protein<br />
91.5 3.0 0.7 22.8 39.3 - - -<br />
Brewer’s yeast 91.7 51.4 0.6 8.4 2.0 29.3 - -<br />
Torula yeast 91.7 47.1 1.1 6.9 2.0 34.6 - -<br />
Molasses yeast 95.5 42.5 2.8 8.8 0.5 47.2 - -<br />
Brewers grain 92.5 25.0 6.0 4.0 15.0 - 0.25 0.48<br />
Source: Unpublished data <strong>of</strong> National Centre <strong>for</strong> Quality Supervision <strong>and</strong> Test <strong>of</strong> Aquatic Product, Qingdao, P.R. China<br />
(pers. comm.)
158<br />
TABLE 12<br />
Amino acid pr<strong>of</strong>ile (percent dry matter) <strong>of</strong> major plant feed ingredients <strong>and</strong> single cell proteins<br />
Brewers<br />
grain<br />
Molasses<br />
yeast<br />
Torula<br />
yeast<br />
Brewer’s<br />
yeast<br />
Rice<br />
bran,<br />
full-fat<br />
Wheat<br />
germ<br />
Wheat<br />
middling<br />
Wheat<br />
bran<br />
Peanut<br />
meal,<br />
expeller<br />
Peanut<br />
meal,<br />
solvent<br />
Soybean<br />
meal,<br />
expeller<br />
Soybean<br />
meal,<br />
solvent<br />
Rape<br />
seed<br />
meal<br />
Cotton<br />
seed<br />
meal,<br />
Cotton<br />
seed meal,<br />
solvent<br />
Amino acids<br />
extracted<br />
extracted<br />
expeller<br />
extracted<br />
Arginine 4.47 4.51 2.23 3.07 2.93 4.62 4.05 0.87 1.21 1.88 0.85 2.46 2.60 2.27 1.22<br />
Histidine 1.04 1.07 1.09 0.86 1.00 0.93 0.85 0.36 0.45 0.65 0.32 1.00 1.40 1.11 0.49<br />
<strong>Study</strong> <strong>and</strong> <strong>analysis</strong> <strong>of</strong> <strong>feeds</strong> <strong>and</strong> <strong>fertilizers</strong> <strong>for</strong> <strong>sustainable</strong> aquaculture development<br />
Isoleucine 1.28 1.39 1.46 1.70 1.74 1.69 1.70 0.70 0.57 0.88 0.51 2.94 2.90 2.70 1.47<br />
Leucine 2.23 2.35 2.71 3.05 3.07 2.61 2.62 1.09 1.09 1.56 0.90 3.56 3.50 3.89 1.89<br />
Lysine 1.81 1.64 2.15 3.53 2.27 1.62 1.33 0.67 0.81 1.54 0.57 3.70 3.80 3.76 0.87<br />
Methionine 0.52 0.57 0.77 0.65 0.46 0.42 0.50 0.20 0.28 0.44 0.24 1.0 0.80 0.84 0.45<br />
Phenylalanine 2.21 2.18 1.54 1.89 1.94 1.99 1.95 0.64 0.67 0.94 0.58 2.77 3.00 2.46 1.38<br />
Threonine 1.23 1.36 1.71 1.00 0.66 - - 0.53 0.60 0.97 0.47 2.41 2.60 2.82 0.97<br />
Tryptophan 0.47 0.53 0.49 1.37 1.46 1.09 1.17 0.39 0.23 0.30 0.10 0.73 0.50 0.59 0.37<br />
Valine 1.82 1.97 1.94 0.93 1.78 1.79 1.89 0.68 0.83 1.17 0.76 2.90 2.90 2.97 0.40<br />
Source: Unpublished data <strong>of</strong> National Centre <strong>for</strong> Quality Supervision <strong>and</strong> Test <strong>of</strong> Aquatic Product, Qingdao, P.R. China (pers. comm.)
Analysis <strong>of</strong> <strong>feeds</strong> <strong>and</strong> <strong>fertilizers</strong> <strong>for</strong> <strong>sustainable</strong> aquaculture development in China 159<br />
TABLE 13<br />
Apparent nutrient digestibility (%) <strong>of</strong> major plant feed ingredients by various aquatic species<br />
Feed ingredients/<br />
aquatic species<br />
Cotton seed meal<br />
Dry matter Crude protein Crude lipid Carbohydrate Crude fibre Gross energy P<br />
1<br />
Seabass 40.59 76.79 80.46 - - 16.99 -<br />
Grass carp 59.49 75.22 51.16 - - - 8.50<br />
Blunt nose black<br />
bream<br />
43.80 81.20 90.40 23.4 - - -<br />
Black carp 64.60 85.50 57.00 60.0 18.0 - -<br />
Fleshy prawn<br />
Rapeseed meal<br />
- 83.14 - - - - -<br />
2<br />
Seabass 58.66 81.30 86.09 - - 68.01 -<br />
Grass carp 68.62 77.81 81.33 - - - -<br />
Blunt nose black<br />
bream<br />
49.30 80.70 85.70 45.7 - - 8.20<br />
Black carp 61.59 86.42 98.80 63.0 18.0 65.93 43.41<br />
Chinese long-snout<br />
catfish<br />
- 89.87 - - - 79.07 -<br />
Nile tilapia - 86.57 - - - - -<br />
Fleshy prawn<br />
Soybean meal<br />
- 80.16 - - - - -<br />
3<br />
Seabass 66.00 90.60 86.70 - - 76.20 47.50<br />
Grass carp 75.40 87.50 82.20 - - - -<br />
Blunt nose black<br />
bream<br />
77.80 95.70 - 74.4 - - 39.70<br />
Black carp 79.30 96.80 - 67.1 - 81.30 64.40<br />
Chinese long-snout<br />
catfish<br />
- 76.30 - - - 61.40 -<br />
Fleshy prawn - 92.00 - - - - -<br />
Peanut meal, solvent extracted4 Seabass 64.40 87.05 87.21 - - 73.16 59.20<br />
Blunt nose black<br />
bream<br />
Peanut meal with hull<br />
- 95.70 - 74.4 - - 39.70<br />
4<br />
Blunt nose black<br />
bream<br />
29.50 86.20 - 45.3 - - 11.50<br />
Black carp 46.04 88.93 - 51.3 - 51.44 22.27<br />
Nile tilapia - 89.87 - - - - -<br />
Fleshy prawn - 86.94 - - - - -<br />
Source: 1 Chang et al. (2005); Lin, Luo <strong>and</strong> Ye (2001); Liu, Zheng <strong>and</strong> Zhao (2004); Rong, Liang <strong>and</strong> Yue (1994);<br />
You et al. (1993); Wu et al. (1995); Wu et al. (2000 2 Chang et al. (2005); Lei, Yang <strong>and</strong> He (1996); Lin, Luo <strong>and</strong> Ye<br />
(2001); Liu, Zhu <strong>and</strong> Chen (1990); Rong, Liang <strong>and</strong> Yue (1994); You et al. (1993); Wu et al. (1995); Wu et al. (2000),<br />
3 Chang et al. (2005); Lei, Yang <strong>and</strong> He (1996); Lin, Luo <strong>and</strong> Ye (2001); Liu et al. (1990); Rong, Liang <strong>and</strong> Yue<br />
(1994); You et al. (1993); Wu et al. (1995), 4 Chang et al. (2005); Liu, Zhu <strong>and</strong> Chen (1990); Rong, Liang <strong>and</strong> Yue<br />
(1994); You et al. (1993); Wu et al. (1995)
160<br />
<strong>Study</strong> <strong>and</strong> <strong>analysis</strong> <strong>of</strong> <strong>feeds</strong> <strong>and</strong> <strong>fertilizers</strong> <strong>for</strong> <strong>sustainable</strong> aquaculture development<br />
TABLE 14<br />
Apparent nutrient digestibility (%) <strong>of</strong> major plant feed ingredients <strong>and</strong> single cell protein by<br />
various aquatic species<br />
Feed ingredients/aquatic<br />
species<br />
Wheat flour<br />
Dry<br />
matter<br />
Crude<br />
protein<br />
Crude<br />
lipid<br />
Carbohydrate Gross<br />
energy<br />
Grass carp 59.97 87.06 82.49 - - -<br />
Chinese long-snout<br />
catfish<br />
Wheat bran<br />
- 94.17 - - 48.43 -<br />
1<br />
Grass carp 62.61 73.20 52.42 - - -<br />
Black carp 42.81 87.16 99.30 37.45 33.95 33.96<br />
Nile tilapia<br />
Wheat middling<br />
- 91.54 - - - -<br />
1<br />
Grass carp 61.64 71.53 53.22 - - -<br />
Nile tilapia<br />
Barley flour<br />
- 89.03 - - - -<br />
1<br />
Grass carp 59.97 59.36 50.09 - - -<br />
Black carp<br />
Rice bran, de-fatted<br />
66.90 74.60 82.80 71.50 - -<br />
2<br />
Grass carp<br />
Rice bran, full-fat<br />
47.41 76.36 56.99 - - -<br />
2<br />
Nile tilapia - 60.48 - - - -<br />
Blunt nose black bream<br />
Brewer’s yeast<br />
61.00 74.90 86.80 65.10 - 3.00<br />
3<br />
Nile tilapia - 91.69 - - - -<br />
Grass carp 64.24 85.04 82.53 - - -<br />
Fleshy prawn<br />
Torula yeast<br />
- 84.75 - - - -<br />
3<br />
Fleshy prawn<br />
Molasses yeast<br />
- 87.63 - - - -<br />
3<br />
Fleshy prawn<br />
Brewers’ grain<br />
- 74.22 - - - -<br />
4<br />
Grass carp 71.71 68.47 69.09 - - -<br />
Source: 1 Lei, Yang <strong>and</strong> He (1996); Liu, Zhu <strong>and</strong> Chen (1990); Lin et al. (2001); You et al. (1993); 2 Lin et al. (2001); Wu<br />
et al. (1995); Wu et al. (2000), 3 Lin, Luo <strong>and</strong> Ye (2001); Rong, Liang <strong>and</strong> Yue (1994); Wu et al. (2000), 4 Lin, Luo <strong>and</strong><br />
Ye (2001)<br />
P
Analysis <strong>of</strong> <strong>feeds</strong> <strong>and</strong> <strong>fertilizers</strong> <strong>for</strong> <strong>sustainable</strong> aquaculture development in China 161<br />
TABLE 15<br />
Apparent amino acid digestibility (%) <strong>of</strong> major plant feed ingredients by various aquatic species<br />
Feed<br />
ingredients/<br />
aquatic species<br />
Cotton seed meal<br />
Arg His Ile Leu Lys Met Phe Thr Try Val<br />
1<br />
Seabass 93.59 83.97 80.82 82.89 77.32 60.30 86.46 79.25 - 76.99<br />
Grass carp 89.20 73.70 89.50 84.10 87.80 86.10 65.30 87.2 - 88.50<br />
Nile tilapia 94.70 89.90 80.20 82.90 75.20 59.90 89.90 85.4 - 87.20<br />
Fleshy prawn<br />
Rape seed meal<br />
83.11 83.19 83.08 83.14 83.23 82.97 83.12 83.08 83.21 83.27<br />
2<br />
Seabass 91.87 91.64 82.55 84.32 89.93 75.95 88.09 83.62 - 81.72<br />
Grass carp 84.80 88.30 81.60 83.60 91.50 87.60 72.70 83.00 - 81.80<br />
Nile tilapia 94.90 93.70 86.90 83.90 78.80 89.30 86.40 80.20 - 81.80<br />
Fleshy prawn<br />
Soybean meal<br />
80.28 80.34 80.25 80.20 80.21 80.60 80.15 80.07 80.93 80.32<br />
3<br />
Seabass 97.34 97.89 92.35 90.66 93.96 70.05 91.72 91.49 - 88.10<br />
Grass carp 84.90 88.50 66.50 83.60 90.50 85.60 64.90 82.10 - 82.80<br />
Nile tilapia 99.40 98.20 94.20 96.40 96.30 94.90 96.40 96.90 - 94.20<br />
Fleshy prawn 92.13 92.22 92.07 92.11 92.06 92.25 92.12 91.90 92.06 92.11<br />
Peanut meal, solvent extracted4 Seabass 97.34 97.89 92.35 90.66 93.96 70.05 91.72 91.49 - 88.10<br />
Peanut meal, expeller4 Fleshy prawn 87.00 87.16 87.06 87.02 87.14 87.06 86.96 86.97 87.34 87.01<br />
Peanut meal with hull4 Nile tilapia<br />
Wheat flour<br />
97.00 87.20 80.10 86.20 95.20 85.70 87.80 85.70 -<br />
4<br />
Grass carp<br />
Wheat bran<br />
93.00 90.40 82.90 89.60 90.10 87.80 83.60 80.20 - 86.30<br />
4<br />
Grass carp 76.20 91.10 94.80 87.10 86.90 90.00 77.20 85.40 - 79.30<br />
Nile tilapia 97.80 97.40 94.10 92.70 93.50 88.20 91.10 94.20 - 87.10<br />
Fleshy prawn<br />
Wheat middlings<br />
72.34 73.68 73.00 72.46 72.75 72.05 73.13 75.03 73.34 72.46<br />
4<br />
Grass carp 75.90 82.20 82.90 79.40 89.80 90.20 84.60 71.00 - 87.10<br />
Nile tilapia 99.10 100.00 92.50 94.90 96.10 88.20 95.60 - - 91.80<br />
Source: Chang et al. (2004); Lin et al. (200); You et al. (1993); Wu et al. (2000), 2 Chang et al. (2004); Lin et al. (200); Rong,<br />
Liang <strong>and</strong> Yue (1994); Wu et al. (2000), 3 Chang et al. (2004); Lin et al. (2000); Rong, Liang <strong>and</strong> Yue (1994); Wu et al.<br />
(2000), 4 Chang et al. (2004); Rong, Liang <strong>and</strong> Yue (1994); Wu et al. (2000)<br />
TABLE 16<br />
Apparent amino acid digestibility (%) <strong>of</strong> major plant feed ingredients <strong>and</strong> single cell proteins by various<br />
aquatic species<br />
Single cell protein/aquatic species<br />
Barley flour<br />
Arg His Ile Leu Lys Met Phe Thr Val Tyr Cys<br />
1<br />
Grass carp 82.8 82.3 84.5 82.9 80.2 79.2 74.5 74.9 - 73.0 -<br />
Rice bran, full-fat 2 -<br />
Grass carp 88.2 90.9 87.7 88.4 90.0 88.6 73.4 84.1 - 90.0 -<br />
Nile tilapia<br />
Brewer’s yeast<br />
74.2 84.8 89.0 63.6 60.4 72.9 76.6 62.5 - 67.3 -<br />
3<br />
Nile tilapia 93.3 88.9 82.4 89.3 76.2 92.4 90.3 85.9 86.4 86.6 81.9<br />
Grass carp 87.9 38.1 25.1 60.1 94.8 31.6 67.9 54.9 85 35.0 -<br />
Fleshy prawn 84.8 84.8 84.8 84.8 84.8 84.8 84.8 84.9 84.3 - -<br />
Torula yeast 3 -<br />
Fleshy prawn 87.6 87.8 86.7 87.7 87.7 88.2 87.6 87.8 87.7 - -<br />
Molasses yeast 3 -<br />
Fleshy prawn 74.3 74.2 74.2 74.3 74.5 74.1 74.3 74.2 74.4 - -<br />
Brewers’ grain 4 -<br />
Grass carp 83.4 86.1 86.8 85.6 84.7 88.0 75.8 74.6 78.1 - -<br />
Source: 1 Liu et al. (2000); Rong, Liang <strong>and</strong> Yue (1994); Wu et al. (2000), 2 Liu, Zheng <strong>and</strong> Zhao (2004); Wu et al. (2000), 3 Rong, Liang<br />
<strong>and</strong> Yue (1994); Ye et al. (2003); Wu et al. (2000), 4 Liu, Zheng <strong>and</strong> Zhao (2004)
162<br />
TABLE 17<br />
Mineral content <strong>of</strong> major feed ingredients<br />
Minerals Unit<br />
Meat<br />
meal<br />
<strong>Study</strong> <strong>and</strong> <strong>analysis</strong> <strong>of</strong> <strong>feeds</strong> <strong>and</strong> <strong>fertilizers</strong> <strong>for</strong> <strong>sustainable</strong> aquaculture development<br />
Meat &<br />
bone meal<br />
Blood<br />
meal<br />
Soybean<br />
meal, solvent<br />
extracted<br />
Soybean<br />
meal,<br />
expeller<br />
Peanut meal,<br />
solvent extracted<br />
Peanut<br />
meal,<br />
expeller<br />
Wheat<br />
middling<br />
Calcium % 7.96 10.16 0.27 0.25 0.33 0.20 0.16 0.11 0.07<br />
Phosphorus % 4.00 4.86 0.26 1.71 0.62 0.63 0.56 0.83 0.64<br />
Sodium % 1.31 0.73 0.32 0.12 0.24 0.42 0.41 0.20 -<br />
Potassium % 0.57 1.58 0.14 0.07 0.02 1.14 1.13 0.97 0.83<br />
Magnesium % 0.27 1.13 0.22 0.28 0.25 0.04 0.32 0.24 0.23<br />
Chlorine % 1.20 0.74 - 0.60 1.91 - 0.03 0.08 -<br />
Sulphur % 0.50 0.26 0.34 0.22 0.33 26.8 0.29 0.24 -<br />
Manganese mg/kg 9.6 13.3 5.3 29.9 32.3 0.03 25.4 112.2 -<br />
Iron mg/kg 0.044 0.050 0.307 0.008 0.0016 32.7 - 0.008 -<br />
Zinc mg/kg 104.4 95.3 4.4 - - 15.3 - 150.2 -<br />
Copper mg/kg 9.8 1.5 13.3 15.8 18.0 - - 18.3 -<br />
Selenium mg/kg 0.420 0.262 - - - 0.065 - - -<br />
Iodine mg/kg 1.313 - - - - - 0.109 -<br />
Source: Unpublished data <strong>of</strong> National Centre <strong>for</strong> Quality Supervision <strong>and</strong> Test <strong>of</strong> Aquatic Product, Qingdao, P.R. China<br />
(pers. comm.)<br />
TABLE 18<br />
Vitamin content <strong>of</strong> major feed ingredients<br />
Vitamins Unit Blood meal<br />
Soybean<br />
meal, solvent<br />
extracted<br />
Soybean<br />
meal,<br />
expeller<br />
Peanut<br />
meal,<br />
solvent<br />
extracted<br />
Peanut<br />
meal,<br />
expeller<br />
Brewer’s<br />
yeast<br />
Wheat<br />
germ<br />
Torula<br />
yeast<br />
A (Retinol) IU/g - 0.7 0.3 - 0.4 - -<br />
E (α-tocopherol) mg/kg - - 6.6 - - - -<br />
B1 (Thiamine) mg/kg 0.4 1.5 4.0 5.7 7.1 90.3 6.2<br />
B2 (Rib<strong>of</strong>lavin) mg/kg 2.5 4.0 3.5 10.9 5.2 36.4 49.2<br />
B3 (Nicotinic acid) mg/kg 31.0 14.1 14.9 172 166 458 499<br />
B5 (Pantothenic acid) mg/kg 2.9 14.1 14.9 50.2 47.2 109.0 83.1<br />
B6 (Pyridoxine) mg/kg 4.43 - - - - 43.24 29.54<br />
B7 (Biotin) mg/kg 0.08 0.73 0.30 0.33 - 0.96 1.39<br />
B9 (Folic acid) mg/kg 0.10 - 6.60 0.65 - 9.42 22.4<br />
B12 (Cyanocobalamin) mg/kg 44.3 - - - - - -<br />
Choline mg/kg 729 2 551 2 763 1 963 1 650 4 075 2 887<br />
Source: Unpublished data <strong>of</strong> National Centre <strong>for</strong> Quality Supervision <strong>and</strong> Test <strong>of</strong> Aquatic Product, Qingdao, P.R. China<br />
(pers. comm.)<br />
3. FEED MANAGEMENT STRATEGIES AND POND MANAGEMENT TECHNIQUES<br />
Enhanced levels <strong>of</strong> intensity in virtually all aquaculture sectors have led to enormous<br />
increases in the dem<strong>and</strong> <strong>for</strong> <strong>feeds</strong>. Moreover, price escalations <strong>of</strong> feed ingredients have<br />
also increased the share <strong>of</strong> feed cost in the total production costs.<br />
To ease the problems <strong>of</strong> feed supply <strong>and</strong> to minimize feed costs, various management<br />
strategies <strong>and</strong> pond management techniques have been developed <strong>and</strong> adopted. These<br />
have made a significant contribution to the <strong>sustainable</strong> development <strong>of</strong> the industry.<br />
3.1 Nutritional requirements <strong>of</strong> major aquaculture species in China<br />
Underst<strong>and</strong>ing the nutritional requirements <strong>of</strong> cultured animals is the fundamental<br />
basis <strong>for</strong> good feed management practices at the industrial <strong>and</strong> small-scale level.<br />
Intensive research on the nutritional requirements <strong>of</strong> common aquaculture species was<br />
undertaken during 1980–1990s <strong>and</strong> this was strongly driven by the early developments<br />
in compound aquafeed production. Many <strong>of</strong> these findings are still used by the feed<br />
industry <strong>and</strong> are presented in Tables 19 to 23.
Analysis <strong>of</strong> <strong>feeds</strong> <strong>and</strong> <strong>fertilizers</strong> <strong>for</strong> <strong>sustainable</strong> aquaculture development in China 163<br />
TABLE 19<br />
Nutritional requirements (percent dry matter) <strong>of</strong> important aquacultures species in China<br />
Species<br />
Crude protein<br />
Fry Juvenile Adult<br />
Crude lipid Carbohydrate Crude fibre<br />
Common carp 43–47 37–42 28–32 4.6 38.5 3.7–7.0<br />
Black carp 33–41 29.5–40.9 35 4.6 25–38.5<br />
Grass carp 25–30 28–32 4.2–4.8 36.5–42.5 12.0<br />
Wuchang bream 25.6–41.4 21.1–30.6 4.5 25–28 36.5–42.5<br />
Crucian carp 40.0 30.0 28 5–8 36.0 12.2<br />
Rainbow trout 43.0 36–40 35–40 8.5 20–30 3.0<br />
Nile tilapia 48.5 12–15 30–40 5–20<br />
Japanese eel 48.5 45.0 44 5–8 18.3–27.3<br />
Channel catfish 35–40 30–35 28–35 5–12 40.0<br />
Black porgy 40–45 10–14 15.0 6.25<br />
Source: modified after Li (1996)<br />
TABLE 20<br />
Nutritional requirements (percent dry matter) <strong>of</strong> fleshy prawn, Penaeus chinensis <strong>and</strong> black<br />
tiger shrimp, Penaeus monodon<br />
Species<br />
Crude protein<br />
Post larvae Juvenile Adult<br />
Crude lipid Carbohydrate Crude fibre Ca P<br />
C/P ratio<br />
Fleshy prawn 40 42 44 4–6 20–26 3.7–7.0 1.0–1.5 1.7–2.5 1:1.7<br />
Tiger shrimp 40–44 40 35–38 4 3–5 3.5–4.5 3.5–4.5<br />
Post larvae 0.7–1.0 cm, juvenile 3.0–6.0 cm <strong>and</strong> adult >6 cm.<br />
Source: modified from Li, Song <strong>and</strong> Lou (1986), Li (1990) <strong>and</strong> Li (1996)<br />
TABLE 21<br />
Nutritional requirements (percent dry matter) <strong>of</strong> giant freshwater prawn, Macrobrachium<br />
rosenbergii<br />
Nutrient Juvenile (1–4 cm) Early growout (4–6 cm) Late growout (>6 cm)<br />
Crude protein 40–45 35–40 28–35<br />
Crude lipid 7–9 5–7 4–5<br />
Carbohydrate 20–24 24–30 30–35<br />
Crude fibre 4 5 6<br />
Crude ash 10–12 12–14 14–16<br />
Calcium 0.9–1.1 1.8–2.2 1.8–2.2<br />
Phosphorus 0.9–1.1 1.8–2.2 1.8–2.2<br />
Source: adapted from Li (1996)<br />
TABLE 22<br />
Nutritional requirements (percent dry matter) <strong>of</strong> s<strong>of</strong>t-shelled turtle<br />
Crude protein<br />
Juvenile Adult<br />
Crude lipid Carbohydrate Crude fibre<br />
47.4–49.1 43.3–45.1 6–7 22.7–25.3
164<br />
<strong>Study</strong> <strong>and</strong> <strong>analysis</strong> <strong>of</strong> <strong>feeds</strong> <strong>and</strong> <strong>fertilizers</strong> <strong>for</strong> <strong>sustainable</strong> aquaculture development<br />
is lagging behind. The feed additive industry in China is very pr<strong>of</strong>itable <strong>and</strong> is driving<br />
research towards underst<strong>and</strong>ing the amino acid, vitamin <strong>and</strong> mineral requirements<br />
<strong>of</strong> aquatic species <strong>and</strong> hence much <strong>of</strong> the research is focused on these aspects. See<br />
Annexure 1 <strong>for</strong> in<strong>for</strong>mation on the amino acid, mineral <strong>and</strong> vitamin requirement<br />
<strong>of</strong> the major aquaculture species. The current lack <strong>of</strong> systematic research on the<br />
nutritional requirements <strong>of</strong> aquaculture species will certainly impact on development<br />
<strong>of</strong> compound aqua<strong>feeds</strong>.<br />
3.2 Farm-made <strong>feeds</strong><br />
Traditional fish farming practices mainly relied on natural food organisms, enhanced by<br />
organic fertilization <strong>and</strong> supplementary <strong>feeds</strong> such as aquatic weeds, terrestrial grasses,<br />
naturally collected molluscs <strong>and</strong> by-products/wastes from agricultural production <strong>and</strong><br />
processing activities. Due to the intensification <strong>of</strong> fish farming <strong>and</strong> the introduction<br />
<strong>of</strong> new species, aquaculture has become more dependent on artificial <strong>feeds</strong>. The use<br />
<strong>of</strong> commercially manufactured pellets is becoming more popular, although farm-made<br />
<strong>feeds</strong> still play <strong>and</strong> enormously important role in Chinese aquaculture.<br />
Because <strong>of</strong> the diversity <strong>of</strong> farmed species there are many different types <strong>of</strong> farm-made<br />
<strong>feeds</strong>. In general, farm-made or processed <strong>feeds</strong> can be classified into several categories.<br />
3.2.1 Simple processed raw feed ingredients <strong>and</strong> natural food organisms<br />
These <strong>feeds</strong> are commonly used in semi-intensive farming <strong>of</strong> marine fish, crabs <strong>and</strong> prawns<br />
<strong>and</strong> may include soaked soybean, maize <strong>and</strong> soybean/rapeseed cake, crushed molluscs,<br />
chopped trash fish or mussel meat, germinated barley, soybean milk <strong>and</strong> dregs.<br />
3.2.2 Compound farm-made <strong>feeds</strong><br />
Some farmers produce a compound pellet using on-farm produced ingredients<br />
according to several <strong>for</strong>mulations. Most <strong>of</strong> these <strong>feeds</strong> are nutritionally unbalanced. On<br />
the other h<strong>and</strong>, some very well balanced <strong>feeds</strong> are produced, especially <strong>for</strong> high value<br />
species such as eel, puffer fish <strong>and</strong> some marine fish species.<br />
3.2.3 Custom made compound pellets<br />
These <strong>feeds</strong> are made by small <strong>and</strong> medium-scale feed manufacturers who have<br />
specialized their operations such that they can make smaller quantities <strong>of</strong> <strong>feeds</strong><br />
according to their own or their clients’ <strong>for</strong>mulation <strong>and</strong> specifications.<br />
3.2.4 Comparison between farm-made <strong>feeds</strong> <strong>and</strong> industrially manufactured pellets<br />
There are no statistical data on the proportional use <strong>of</strong> farm-made <strong>and</strong> commercially<br />
manufactured <strong>feeds</strong> in China. However, it is estimated that just less than 8 million<br />
tonnes <strong>of</strong> commercially manufactured aqua<strong>feeds</strong> were used in 2004. Farm-made <strong>feeds</strong><br />
(all types, including the <strong>feeds</strong> made by small <strong>and</strong> medium-scale processors) there<strong>for</strong>e<br />
play a far more important role in aquaculture than industrial aqua<strong>feeds</strong>. It is not<br />
possible to provide an estimate <strong>of</strong> annual farm-made feed production <strong>and</strong> use. Export<br />
<strong>of</strong> aqua<strong>feeds</strong> from China is very limited <strong>and</strong> imports mainly comprise starter <strong>feeds</strong> <strong>for</strong><br />
shrimp <strong>and</strong> eel. However, it is difficult to estimate total exports <strong>and</strong> imports.<br />
In comparison to commercially manufactured <strong>feeds</strong>, farm-made <strong>feeds</strong> have certain<br />
advantages <strong>and</strong> disadvantages. The manufacture <strong>of</strong> farm-made feed usually requires<br />
more time because <strong>of</strong> primitive equipment with a limited production capacity. Most<br />
commercial feed manufacturers have established convenient retailing chains <strong>for</strong><br />
farmers, except in remote areas with poor transport facilities. Farm-made <strong>feeds</strong> are<br />
<strong>of</strong>ten in the <strong>for</strong>m <strong>of</strong> moist pellets, paste/dough or fresh or in other <strong>for</strong>ms that can not<br />
be stored <strong>for</strong> as long as sinking or exp<strong>and</strong>ed (floating) pellets.<br />
Farm-made/processed <strong>feeds</strong> <strong>and</strong> commercially manufactured <strong>feeds</strong> are <strong>of</strong>ten used <strong>for</strong><br />
different species or in different practices. Practical feed conversion ratios <strong>of</strong> different
Analysis <strong>of</strong> <strong>feeds</strong> <strong>and</strong> <strong>fertilizers</strong> <strong>for</strong> <strong>sustainable</strong> aquaculture development in China 165<br />
farm-made <strong>feeds</strong> are seldom compared <strong>and</strong> because <strong>of</strong> the different <strong>for</strong>mulations <strong>and</strong><br />
ingredients used it is difficult to compare the biological <strong>and</strong> economic efficiency <strong>of</strong><br />
these <strong>feeds</strong> with commercially manufactured <strong>feeds</strong>.<br />
3.3 Pond management techniques<br />
As mentioned earlier, pond aquaculture is the most important practice in terms <strong>of</strong><br />
aquaculture production. Many practical techniques to minimise feed costs have been<br />
developed by scientists <strong>and</strong> farmers <strong>and</strong> in particular these have focused on reducing<br />
feed use <strong>and</strong> improving feed utilization.<br />
Fertilization<br />
Pond fertilization throughout the culture cycle was a common practice in extensive<br />
<strong>and</strong> semi-intensive polyculture <strong>of</strong> carp species <strong>and</strong>, if applied appropriately, this<br />
practise can reduce feed requirements to a minimum. However, the trend <strong>of</strong> increasing<br />
intensification has led to significant increases in the use <strong>of</strong> artificial <strong>feeds</strong>, such that the<br />
role <strong>of</strong> <strong>fertilizers</strong> in pond aquaculture has become less important than be<strong>for</strong>e, especially<br />
during growout. However, fertilization is still the major approach to provide food<br />
during seed production operations <strong>of</strong> many species. The fertilization <strong>of</strong> ponds during<br />
the preparation phase is also still commonly practiced in carp <strong>and</strong> shrimp/prawn<br />
culture. Commonly used <strong>fertilizers</strong> in ponds include pig, chicken, duck manure, cow<br />
dung <strong>and</strong> green fodder. During pond preparation the base quantity is between 2 250–<br />
3 750 kg pig manure/ha <strong>and</strong> if ponds are fertilized during the production cycle then<br />
quantities ranging from 1 500–2 250 kg/ha are used <strong>for</strong> each application.<br />
Inorganic fertilization is commonly practiced in many small irrigation reservoirs to<br />
enhance natural productivity <strong>and</strong> to increase fish production. N <strong>and</strong> P <strong>fertilizers</strong> are<br />
commonly used <strong>and</strong> the recommended dose is usually 0.5 mg/l <strong>for</strong> N <strong>and</strong> 0.05 mg/l<br />
<strong>for</strong> P.<br />
Pond substratum management<br />
Improving the pond substratum is another important management technique, which<br />
is directly related to feed management strategies. It usually consists <strong>of</strong> three activities,<br />
total drainage, sun drying <strong>and</strong> liming. These practices promote the decomposition <strong>of</strong><br />
organic matter in the bottom soil <strong>and</strong> accelerate the release <strong>of</strong> nutrients soon after<br />
filling, leading to enhanced production <strong>of</strong> natural food organisms <strong>and</strong> a reduction in<br />
artificial feed requirements. Managing the pond substratum also results in improved<br />
water quality during the production cycle, particularly higher DO levels <strong>and</strong> this<br />
contributes to improved feed utilization <strong>and</strong> growth. Excessive bottom silt is<br />
mechanically removed. This minimises the accumulation <strong>of</strong> organic matter leading to<br />
improved water quality.<br />
In super-intensive systems, especially <strong>for</strong> shrimp, the bottom is lined with plastic<br />
<strong>and</strong> central draining pipes are installed that enables the removal <strong>of</strong> all wastes produced<br />
during the culture cycle. Bottom aeration systems have also been introduced into<br />
super-intensive shrimp culture ponds (up to 20–30 tonnes/ha/cycle)<br />
Water quality maintenance: aeration <strong>and</strong> water exchange<br />
Feed utilization efficiency is highly influenced by water quality, especially DO levels.<br />
Aeration is the most commonly used method to maintain good water quality in semiintensive<br />
<strong>and</strong> intensive culture practices. Three different types <strong>of</strong> aerators are commonly<br />
used in China, paddle-wheels, turbines <strong>and</strong> water jets. The <strong>for</strong>mer is commonly used in<br />
shrimp ponds <strong>and</strong> the latter two types are commonly used in fishponds. These range<br />
from modern types that are internationally available to ingenious home made devices<br />
(Figures 12, 13 <strong>and</strong> 14).
166<br />
<strong>Study</strong> <strong>and</strong> <strong>analysis</strong> <strong>of</strong> <strong>feeds</strong> <strong>and</strong> <strong>fertilizers</strong> <strong>for</strong> <strong>sustainable</strong> aquaculture development<br />
FIGURE 12<br />
Paddle wheel aerators in freshwater semiintensive<br />
culture pond <strong>of</strong> Pacific white shrimp,<br />
Suzhou city, Jiangsu province<br />
FIGURE 13<br />
Farm-made paddle wheel aerator used in<br />
brackish-water, semi-intensive shrimp culture,<br />
Beihai city, Guangxi Autonomous Region<br />
FIGURE 14<br />
Turbine type aerators <strong>and</strong> water pump in a<br />
freshwater semi-intensive culture pond <strong>of</strong><br />
giant freshwater prawn, Gaoyou city, Jiangsu<br />
province<br />
Water exchange is practiced<br />
only when water quality can not<br />
be effectively maintained through<br />
aeration or other methods <strong>and</strong> this<br />
is because it requires more energy<br />
<strong>and</strong> is subject to availability.<br />
Use <strong>of</strong> beneficial micro-organisms<br />
Since the late 1990s, new methods<br />
<strong>for</strong> water quality maintenance<br />
have been widely adopted in<br />
China <strong>and</strong> this involves the use <strong>of</strong><br />
beneficial micro-organisms. Two<br />
types are commonly used, viz.<br />
photosynthetic bacteria <strong>and</strong> EM<br />
(effective micro-organisms). The<br />
micro-organisms have two major<br />
functions, viz. improvement <strong>of</strong><br />
water quality <strong>and</strong> prevention <strong>of</strong><br />
disease by decreasing the levels<br />
<strong>of</strong> NH 3 <strong>and</strong> NO 2 <strong>and</strong> increasing<br />
DO levels in the water. Some<br />
bacteria also directly improve feed<br />
utilization.<br />
3.4 Feed <strong>for</strong>mulation<br />
Increased intensification in<br />
aquaculture has significantly<br />
increased the quantity <strong>of</strong> feed used.<br />
Many aquaculture practices are<br />
now entirely dependent on artificial<br />
<strong>feeds</strong>. To improve feed utilization,<br />
traditionally used raw feed stuffs<br />
(mostly by-products from grain<br />
processing <strong>and</strong> oil extraction) are<br />
being replaced by commercially<br />
manufactured compound <strong>feeds</strong>.<br />
Many <strong>of</strong> the <strong>for</strong>mulations are<br />
considered confidential, although<br />
some commonly used ones are<br />
listed in Tables 24 to 34.
Analysis <strong>of</strong> <strong>feeds</strong> <strong>and</strong> <strong>fertilizers</strong> <strong>for</strong> <strong>sustainable</strong> aquaculture development in China 167<br />
TABLE 24<br />
Practical feed <strong>for</strong>mulation <strong>for</strong> Nile tilapia<br />
Ingredients<br />
TABLE 25<br />
Practical feed <strong>for</strong>mulation <strong>for</strong> grass carp <strong>and</strong> wuchang bream<br />
Ingredient<br />
Fry<br />
(0.1–1.0 g)<br />
Ingredient composition (% dry matter)<br />
Fingerling Growout<br />
Corn 8.95 12.95<br />
Wheat bran 10.0 11.0<br />
Low-grade wheat flour 18.8 16.8<br />
Soybean cake 14.0 5.0<br />
Rape seed cake 41.0 51.0<br />
Fishmeal 4.0 -<br />
Binder 1.0 1.0<br />
Growth <strong>and</strong> immune enhancing additive mix 1.25 1.25<br />
Coarse powder* 1.0 1.0<br />
Approximate cost (US$/tonne) 300<br />
Ingredient composition (% dry matter)<br />
Fingerling<br />
(10–50 g)<br />
*Mineral powder <strong>for</strong> better pelleting <strong>and</strong> ingredient mixing<br />
Source: You Yang, Jiangnan Feed Co. Ltd., Changshu city, Jiangsu province (pers. comm.)<br />
Growout<br />
(>50g)<br />
Fishmeal 50.0 12.0 4.0<br />
Soybean meal 17.0 46.0 34.0<br />
Wheat middling 4.0 30.0 30.0<br />
Wheat meal 4.2 - -<br />
Corn - 6.2 22.1<br />
Corn gluten meal 12.0 - -<br />
Poultry by-product meal 2.0 - 6.0<br />
Vegetable oil - 3.6 0.5<br />
Fish oil 1.0 - -<br />
Fish protein hydrolysate 4.0 - -<br />
Phosphate - 1.4 2.6<br />
Vitamin & mineral premix 0.5 0.5 0.5<br />
Binder - - 0.01<br />
Methionine<br />
Proximate composition (% dry matter)<br />
- - 0.01<br />
Dry matter 91.0 90.0 88.3<br />
Crude protein 49.5 35.0 28.5<br />
Crude fat 13.0 12.4 11.9<br />
Approximate cost (US$/tonne) 400 300 250<br />
Source: You Yang, Jiangnan Feed Co. Ltd., Changshu city, Jiangsu province (pers. comm.)<br />
TABLE 26<br />
Practical feed <strong>for</strong>mulation <strong>for</strong> common carp, crucian carp <strong>and</strong> Nile tilapia<br />
Ingredient<br />
Ingredient composition (% dry matter)<br />
Fingerling Growout<br />
Corn 6.9 10.0<br />
Wheat bran - 4.0<br />
Low grade wheat flour 11.85 11.75<br />
Soybean cake 32.0 27.0<br />
Rape seed cake 40.0 41.0<br />
Fishmeal 6.0 3.0<br />
Binder 1.0 1.0<br />
Growth <strong>and</strong> immune enhancing additive mix 1.25 1.25<br />
Coarse powder* 1.0 1.0<br />
Approximate cost (US$/tonne)<br />
*Mineral powder <strong>for</strong> better pelleting <strong>and</strong> ingredient mixing<br />
300 250<br />
Source: You Yang, Jiangnan Feed Co. Ltd., Changshu city, Jiangsu province (pers. comm.)
168<br />
<strong>Study</strong> <strong>and</strong> <strong>analysis</strong> <strong>of</strong> <strong>feeds</strong> <strong>and</strong> <strong>fertilizers</strong> <strong>for</strong> <strong>sustainable</strong> aquaculture development<br />
TABLE 27<br />
Practical feed <strong>for</strong>mulation <strong>for</strong> turbot, flounder <strong>and</strong> red sea bream (growout)<br />
Ingredient<br />
Ingredient composition (percent dry matter)<br />
Turbot 1 Flounder 1 Red sea bream 2<br />
Fishmeal 45.0 42 30<br />
Hydrolyzed protein 5.0 10<br />
Blood meal 5.0<br />
Silage 4.0<br />
Yeast 5.0 10 5<br />
Groundnut/peanut meal 10.0 10 16<br />
Soybean cake 10.0 10 16<br />
Wheat flour 15.5 13<br />
Wheat middling 15<br />
Fish oil 1.0 4<br />
Calcium diacid phosphate 2.0 2<br />
Dicalcium monophosphate 2<br />
Phosphatid 1.0 1.5<br />
Phospholipid 1.5<br />
Choline 0.5 0.5 0.5<br />
Vitamin mix 0.5 0.5 1.0<br />
Mineral mix 0.5 0.5 1.0<br />
Proximate composition (% dry matter)<br />
Dry matter 87.3 84.22<br />
Crude protein 47.6 45.5<br />
Crude lipid 7.1 7.03<br />
Ash 10.7 10.37<br />
Approximate cost (US$/tonne) 800–900 800–900<br />
Source: 1 Yellow Sea Fisheries Research Institute Feed Company, Qingdao, Sh<strong>and</strong>ong Province (pers. comm.);<br />
2 Lei (2005)<br />
TABLE 28<br />
Practical feed <strong>for</strong>mulation <strong>for</strong> eel (percent dry matter)<br />
Ingredient Glass eel 0 Glass eel 1 Black eel Juvenile Growout<br />
White fishmeal 68.0 68.0 66.0 60.0 52.0<br />
Red fishmeal 2.0 2.0 2.0 5.0 10.0<br />
Popped soybean - - - 4.7 7.2<br />
Potato starch 20.0 20.0 10.0 - -<br />
Cassava starch - - 12.2 2.25 23.0<br />
Hydrolyzed protein 1.2 1.2 3.5 3.5 3.5<br />
Yeast 2.0 2.0 2.0 2.0 2.0<br />
Calcium diacid phosphate 0.2–0.3 0.2–0.3 0.2–0.3 0.2–0.3 0.2–0.3<br />
Vitamin 0.3 0.3 0.25 0.2 0.15<br />
Mineral mix 1.0 1.0 1.0 1.0 1.0<br />
50% chloridised choline 0.3–0.5 0.3–0.5 0.3–0.5 0.3–0.5 0.3–0.5<br />
Salt 0.2 0.2 0.2 0.3 0.3<br />
Lysine 0.2 0.2 0.15 0.15 0.125<br />
Methionine 0.1 0.1 - 0.1 0.075<br />
Lysine 0.15 0.15 0.1 0.1 0.1<br />
Growth enhancing agent 0.05 0.05 0.05 - -<br />
Casein 4.0 - - -<br />
Fish meat protein 4.0 - 2.0 - -<br />
Approximate cost (US$/tonne) 1500–1600 1500–1600 1250–1400 1050–1200 950–1050<br />
Source: He Yijing, feed manufacturer in Guangdong province (pers. comm.)
Analysis <strong>of</strong> <strong>feeds</strong> <strong>and</strong> <strong>fertilizers</strong> <strong>for</strong> <strong>sustainable</strong> aquaculture development in China 169<br />
TABLE 29<br />
Practical feed <strong>for</strong>mulation <strong>for</strong> Pacific white shrimp, Litopenaeus vannamei<br />
Ingredient<br />
Ingredient composition (% dry matter)<br />
Starter Growout 2 Growout 3<br />
Wheat meal 29.5 28.6 30.6<br />
Soybean cake 15.0 15.0 15.0<br />
Groundnut cake 11.0 16.0 16.0<br />
Fishmeal 30.0 25.0 23.0<br />
Squid meal 3.0 2.0 2.0<br />
Shrimp bran* 0 1.0 1.0<br />
Yeast 3.0 3.0 3.0<br />
Bone meal 1.1 - -<br />
Calcium phosphate 2.0 2.0 2.5<br />
Calcium diacid phosphate 1.5 1.5 2.0<br />
Binder 1.2 1.2 1.0<br />
Growth <strong>and</strong> immune enhancing additive mix 1.0 1.0 1.0<br />
Fish oil 1.0 1.0 1.0<br />
Sea salt 1.5 1.5 1.5<br />
Lure agent 0.1 0.1 0.1<br />
FRC** 0.1 0.1 0.1<br />
Polysaccharide 0.1 0.1 0.1<br />
High stability Vitamin C 0.1 0.1 0.1<br />
Approximate cost (US$/tonne) 850–950 750–800 650–700<br />
*By-product from shrimp processing industry; **a commercial herb additive <strong>for</strong> increasing resistance to disease <strong>and</strong><br />
stress.<br />
Source: You Yang, Jiangnan Feed Co. Ltd., Changshu city, Jiangsu province (pers. comm.)<br />
TABLE 30<br />
Practical feed <strong>for</strong>mulation <strong>for</strong> flounder, shrimp, Nile tilapia <strong>and</strong> carp (percent dry matter)<br />
Ingredient 1 Flounder 2 Shrimp 3 Tilapia 4 Carp<br />
Fishmeal 45 27 12 6<br />
Fish hydrolysates 5<br />
Blood meal 5<br />
Squid meal 3<br />
Shrimp bran 10<br />
Yeast 5 5<br />
Soybean meal 10 20 46 32<br />
Peanut meal 10 20<br />
Rapeseed meal 40<br />
Corn meal 3.5 8<br />
Low grade wheat flour 13 11.5<br />
Wheat middlings 30<br />
Wheat gluten meal 10<br />
Vitamin mix 0.5 1.0 1.0 1.0<br />
Mineral mix 0.5 0.5 0.5 0.5<br />
Lecithin 1.5<br />
Fish oil 5 2<br />
Vegetable oil 3.6<br />
Dicalcium phosphate 1 1.4<br />
Binder 1.0<br />
Proximate composition (%)<br />
Crude protein 45.0 40.0 28.6<br />
Source: 1,2 Jin Haili Feed Co. Ltd, 3 You Yang Feed Co. Ltd, 4 Ying Hui Feed Co. Ltd (pers. comm.)
170<br />
<strong>Study</strong> <strong>and</strong> <strong>analysis</strong> <strong>of</strong> <strong>feeds</strong> <strong>and</strong> <strong>fertilizers</strong> <strong>for</strong> <strong>sustainable</strong> aquaculture development<br />
TABLE 31<br />
Practical feed <strong>for</strong>mulation <strong>for</strong> fleshy prawn, Penaeus chinensis<br />
Ingredients<br />
Ingredient composition (% dry matter)<br />
Juvenile Middle stage Adult<br />
Fishmeal 27 25 25<br />
Soybean meal 40 40 40<br />
Yeast 5 7 6.5<br />
Shrimp bran* 10 10 12<br />
Squad meal 3 3 1.5<br />
Fish oil 2 2 2<br />
Wheat gluten meal 10 10 10<br />
Lecithin 1.5 1.5 1.5<br />
Vitamin mix 1 1 1<br />
Mineral mix 0.5 0.5 0.5<br />
Approximate cost (US$/tonne) 470 460 450<br />
*by-product from shrimp processing industry.<br />
Source: Yellow Sea Fisheries Research Institute Feed Company, Qingdao, Sh<strong>and</strong>ong Province (pers. comm.)<br />
TABLE 32<br />
Practical feed <strong>for</strong>mulation <strong>for</strong> giant freshwater prawn, Macrobrachium rosenbergii<br />
Ingredient (%)<br />
Ingredient composition (% dry matter)<br />
Juvenile Early growout Late growout<br />
Wheat bran 0 7.85 9.35<br />
Low grade wheat flour 14.35 14.5 18.0<br />
Soybean cake 32.0 23.2 22.5<br />
Rape seed cake 15.2 22.0 21.6<br />
Fishmeal 33.8 22.5 17.5<br />
Coarse fishmeal 0 5.3 6.0<br />
Shell meal 1.0 1.0 1.6<br />
Binder 1.2 1.2 1.0<br />
Moult promoting agent 0.2 0.2 0.2<br />
Growth <strong>and</strong> immune enhancing additive mix 1.25 1.25 1.25<br />
Coarse powder* 1.0 1.0 1.0<br />
Average cost (US$/tonne) 850–1000 600<br />
*Mineral powder to improve pelleting <strong>and</strong> ingredient mixing<br />
Source: You Yang, Jiangnan Feed Co. Ltd., Changshu city, Jiangsu province (pers. comm.)<br />
TABLE 33<br />
Practical feed <strong>for</strong>mulation <strong>for</strong> oriental river prawn, Macrobrachium nipponense<br />
Ingredient<br />
Ingredient composition (% dry matter)<br />
Juvenile Early growout Late growout<br />
Wheat bran - 6.95 10.0<br />
Low grade wheat flour 19.25 18.5 15.75<br />
Soybean cake 29.4 21.0 19.5<br />
Rape seed cake 16.0 20.6 26.0<br />
Fishmeal 23.3 19.0 11.3<br />
Coarse fishmeal 5.4 6.5 4.2<br />
Shell meal 3.2 3.8 4.8<br />
Binder 1.2 1.2 1.0<br />
Moult inducing agent 0.2 0.2 0.2<br />
Growth <strong>and</strong> immune enhancing additive mix 1.25 1.25 1.25<br />
Coarse powder* 1.0 1.0 1.0<br />
Approximate cost (US$/tonne) 500 400 350<br />
*Mineral powder to improve pelleting <strong>and</strong> ingredient mixing<br />
Source: You Yang, Jiangnan Feed Co. Ltd., Changshu city, Jiangsu province (pers. comm.)
Analysis <strong>of</strong> <strong>feeds</strong> <strong>and</strong> <strong>fertilizers</strong> <strong>for</strong> <strong>sustainable</strong> aquaculture development in China 171<br />
TABLE 34<br />
Practical feed <strong>for</strong>mulation <strong>for</strong> Chinese river crab<br />
Ingredient<br />
Ingredient composition (% dry matter)<br />
Juvenile Adult<br />
Wheat bran 4.75 8.5.5<br />
Wheat flour 13.5 17.5<br />
Soybean cake 28.0 22.0<br />
Rape seed cake 15.0 20.0<br />
Fishmeal 26.0 20.0<br />
Coarse fishmeal 6.0 4.5<br />
Shell meal 3.1 4.0<br />
Binder 1.2 1.0<br />
Moult promoting agent 0.2 0.2<br />
Growth <strong>and</strong> immune enhancing additive mix 1.25 1.25<br />
Coarse powder* 1.0 1.0<br />
Approximate cost (US$/tonne) 500 400<br />
*Mineral powder to improve pelleting <strong>and</strong> ingredient mixing<br />
Source: You Yang, Jiangnan Feed Co. Ltd., Changshu city, Jiangsu province (pers. comm.)<br />
3.5 Feed preparation/manufacturing techniques<br />
Farm-made <strong>feeds</strong> are commonly used in many kinds <strong>of</strong> aquaculture practices in China,<br />
especially in extensive <strong>and</strong> semi-intensive aquaculture systems. It is estimated that<br />
farm-made <strong>feeds</strong> account <strong>for</strong> about 40 percent <strong>of</strong> the country’s aquaculture production<br />
<strong>and</strong> the remaining 60 percent are accounted <strong>for</strong> by natural <strong>feeds</strong> <strong>and</strong> by commercially<br />
manufactured <strong>feeds</strong>. This provides some measure <strong>of</strong> the importance <strong>of</strong> farm-made<br />
<strong>feeds</strong>. Although the use <strong>of</strong> commercially manufactured <strong>feeds</strong> is becoming more<br />
popular, farm-made <strong>feeds</strong> or <strong>feeds</strong> supplied by small producers are likely to continue<br />
to play a very important role in aquaculture in China <strong>for</strong> a long time to come.<br />
Farm-made <strong>feeds</strong> have distinct advantages in that they are normally made from<br />
locally available ingredients, although this also has serious shortcomings. Many<br />
farm-made <strong>feeds</strong> are unbalanced <strong>and</strong> are presented in an unsuitable <strong>for</strong>m, which<br />
usually results in poor ingestion, nutrient utilization, reduced production efficiency<br />
<strong>and</strong> deterioration <strong>of</strong> the culture environment. Moreover, due to limited on-farm<br />
storage facilities ingredients are not always properly stored, leading to rancidity <strong>and</strong><br />
mould <strong>for</strong>mation. Using such ingredients in <strong>feeds</strong> affects the growth <strong>and</strong> the health<br />
<strong>of</strong> fish.<br />
Various traditional <strong>and</strong> recently improved techniques are used <strong>for</strong> the preparation<br />
<strong>and</strong> manufacturing <strong>of</strong> aqua<strong>feeds</strong> to enhance quality <strong>and</strong> water stability. Most feed<br />
ingredients are ground to a required particle size <strong>and</strong> mixing is normally carried out<br />
using specialized equipment that meet required mixing st<strong>and</strong>ards. Wheat <strong>and</strong> potato<br />
starch are generally used as binders to improve water stability, although special binders<br />
may also be used. After compounding the feed the mixture is normally steamed <strong>and</strong><br />
if required this is done under pressure, particularly in the process <strong>of</strong> manufacturing<br />
floating <strong>feeds</strong>. Steaming (or cooking as practised by farmers) is very important <strong>for</strong><br />
binding the feed <strong>and</strong> <strong>for</strong> improved nutrient utilization.<br />
Many feed companies sell premixed <strong>for</strong>mulations that are used by farmers either<br />
as is or are mixed with other ingredients such as trash fish <strong>and</strong> then processed into a<br />
suitable <strong>for</strong>m. Micronutrient premixes are commercially available in China. In recent<br />
years, many special feed additives have been developed. These provide additional<br />
properties, e.g. a moult stimulating agent that has been developed <strong>for</strong> crustaceans.<br />
Immuno-stimulants are popularly used in <strong>feeds</strong> <strong>for</strong> species that are susceptible to<br />
diseases. Presently used immuno-stimulants include Chinese herb extracts <strong>and</strong> various<br />
polysaccharides. Growth enhancement agents are also used in aqua<strong>feeds</strong> <strong>for</strong> certain<br />
species.
172<br />
FIGURE 15<br />
Chopped trash fish <strong>for</strong> making<br />
compound feed <strong>for</strong> Chinese river crab,<br />
Suzhou city, Jiangsu province<br />
FIGURE 16<br />
Cooking <strong>of</strong> feed ingredient <strong>for</strong><br />
preparation <strong>of</strong> farm-made feed,<br />
Dongping County, Sh<strong>and</strong>ong province<br />
FIGURE 17<br />
Commercial dry pellet used <strong>for</strong> giant<br />
freshwater prawn, Gaoyou city, Jiangsu<br />
Province<br />
<strong>Study</strong> <strong>and</strong> <strong>analysis</strong> <strong>of</strong> <strong>feeds</strong> <strong>and</strong> <strong>fertilizers</strong> <strong>for</strong> <strong>sustainable</strong> aquaculture development<br />
Various techniques are used to improve nutrient<br />
utilization <strong>of</strong> farm-made aqua<strong>feeds</strong>. Many feed stuffs<br />
such as trash fish <strong>and</strong> pumpkin are chopped (Figure 15)<br />
to make them more palatable. Trash fish <strong>and</strong> mussel meat<br />
(frozen or fresh) is minced, particularly <strong>for</strong> the early stage<br />
rearing <strong>of</strong> fish, shrimp/prawns <strong>and</strong> crabs. Minced fish is<br />
sometimes mixed with other feed ingredients <strong>and</strong> minced<br />
fish is also commonly used in the preparation <strong>of</strong> moist<br />
pellets or paste <strong>feeds</strong>.<br />
Cooking is a commonly used method to improve the<br />
biological quality <strong>of</strong> certain feed stuffs, especially maize,<br />
barley <strong>and</strong> pumpkin (Figure 16). Cooked feed stuffs are<br />
<strong>of</strong>ten mixed with other ingredients such as trash fish.<br />
Molluscs such as snails <strong>and</strong> clams are commonly<br />
used as <strong>feeds</strong> <strong>for</strong> crustaceans <strong>and</strong> some fish species such<br />
as black carp. The shells are usually crushed by special<br />
crushing/grinding machines prior to feed application.<br />
This process is <strong>of</strong>ten omitted <strong>for</strong> fish that are able to<br />
crush the shell without difficulty.<br />
Many ingredients are ground to a fine powder <strong>for</strong><br />
nursery operations <strong>and</strong> growout. The most typical<br />
example is grinding soybean or soybean cake to make<br />
soybean milk or a granular paste <strong>for</strong> nursery operations<br />
<strong>for</strong> several fish species. Grain <strong>feeds</strong>tuffs (e.g. maize,<br />
barley, wheat bran, soybean/soybean cake) are usually<br />
soaked in water be<strong>for</strong>e they are fed to the fish or soaked<br />
<strong>and</strong> cooked to improve feed utilization.<br />
The practice <strong>of</strong> germinating certain grains be<strong>for</strong>e<br />
application as <strong>feeds</strong> is most commonly used to meet the<br />
special requirement <strong>of</strong> certain species, e.g. germinated<br />
barley sprouts are fed to grass carp broodstock in early<br />
spring.<br />
3.6 Feed presentation methods<br />
Feed presentation methods in China are as diverse as the<br />
sector itself <strong>and</strong> vary with species, systems <strong>and</strong> the level<br />
<strong>of</strong> intensity. Some <strong>of</strong> the presentation methods are shown<br />
in Figures 18–23.<br />
Commercially manufactured <strong>feeds</strong> are applied in<br />
the <strong>for</strong>m <strong>of</strong> dry pellet (sinking or floating) or moist<br />
pastes (such as <strong>for</strong> eel) (Figure 17). In recent years, the<br />
use <strong>of</strong> floating pellets in intensive culture systems has<br />
become more popular. This is mainly because waste<br />
<strong>and</strong> environmental impacts are minimised <strong>and</strong> nutrient<br />
utilization is optimized.<br />
Farm-made <strong>feeds</strong> are presented in different <strong>for</strong>ms.<br />
Some feed stuffs are presented in their original <strong>for</strong>m, such as aquatic weeds, terrestrial<br />
grasses <strong>and</strong> vegetables (Figure 18). Alternatively the ingredients are mixed <strong>and</strong> processed<br />
prior to feeding (Figures 20–22). Moist pellets are also used on some relatively large<br />
farms. The extruded moist pellets are usually kept at low temperatures be<strong>for</strong>e use. Live<br />
food fish are also used <strong>for</strong> some <strong>of</strong> the highly carnivorous species such as M<strong>and</strong>arin<br />
fish. Live food fish such as mud carp <strong>and</strong> juvenile wuchang bream are either produced<br />
in the same waterbody or supplied to the target fish on a regular basis.
Analysis <strong>of</strong> <strong>feeds</strong> <strong>and</strong> <strong>fertilizers</strong> <strong>for</strong> <strong>sustainable</strong> aquaculture development in China 173<br />
FIGURE 18<br />
Green fodder grown on pond dyke <strong>for</strong><br />
herbivorous fish, Gaoyou city, Jiangsu<br />
province<br />
FIGURE 20<br />
Cooked maize used as feed <strong>for</strong> Chinese<br />
river crab, Suzhou city, Jiangsu province<br />
FIGURE 19<br />
Trash fish used as feed <strong>for</strong> marine fish,<br />
Sh<strong>and</strong>ong province<br />
FIGURE 21<br />
Paste feed <strong>for</strong> intensive culture <strong>of</strong> eel<br />
Feed particle size varies according to the requirements <strong>of</strong> the life history stage or<br />
the species. Table 35 lists pellet sizes <strong>for</strong> some <strong>of</strong> the important aquaculture species at<br />
different stages.<br />
TABLE 35<br />
Feed pellet size <strong>for</strong> some important aquaculture species in China<br />
Species Stage<br />
Size st<strong>and</strong>ard<br />
Diameter (mm) Length (mm)<br />
Common carp/<br />
Fingerling 1.0–2.0 2.0–4.0<br />
crucian carp<br />
Growout 2.0–4.0 4.0–7.0<br />
Wuchang bream/ Fingerling 1.0–2.0 2.0–4.0<br />
grass carp<br />
Growout 2.0–4.0 4.0–7.0<br />
Nile tilapia<br />
Fingerling<br />
Growout<br />
1.0–2.0<br />
2.0–4.0<br />
2.0–4.0<br />
4.0–7.0<br />
Chinese river crab<br />
Juvenile<br />
Growout<br />
1.0–2.0<br />
2.0–5.0<br />
2.0–3.0<br />
4.0–7.0<br />
Juvenile (crumble) 0.3–1.0 0.3–1.0<br />
Oriental river prawn<br />
Juvenile (pellet)<br />
Middle stage<br />
0.5–1.5<br />
1.0–2.0<br />
1.5–3.0<br />
2.0–5.0<br />
Adult 1.8–2.5 4.0–7.0<br />
Juvenile (crumble) 0.3–1.0 0.3–1.0<br />
Giant freshwater Juvenile (pellet) 0.5–1.5 1.5–3.0<br />
prawn<br />
Middle stage 1.0–2.0 2.0–5.0<br />
Adult 1.8–2.5 4.0–7.0<br />
Juvenile (crumble) 0.3–1.0 0.3–1.0<br />
Pacific white shrimp<br />
Juvenile (pellet)<br />
Middle stage<br />
0.5–1.5<br />
1.2–2.0<br />
1.5–3.0<br />
3.0–4.0<br />
Adult 1.0–2.0 2.0–5.0<br />
Swimming crab Growout 4.8–5.6 12–19<br />
Source: various feed manufacturers (pers. comm.)<br />
COURTESY OF LIANG MENGQUING<br />
COURTESY OF HE YIJING
174<br />
<strong>Study</strong> <strong>and</strong> <strong>analysis</strong> <strong>of</strong> <strong>feeds</strong> <strong>and</strong> <strong>fertilizers</strong> <strong>for</strong> <strong>sustainable</strong> aquaculture development<br />
FIGURE 22<br />
Preparation <strong>of</strong> semi-moist feed <strong>for</strong> crab<br />
by mixing cooked maize <strong>and</strong> chopped<br />
fish, Suzhou city, Jiangsu province<br />
FIGURE 23<br />
Floating feeding frame <strong>for</strong> application<br />
<strong>of</strong> green fodder in a pond, Gaoyou city,<br />
Jiangsu province<br />
The feeding rate is very much dependent on the type <strong>of</strong> feed, water temperature<br />
<strong>and</strong> culture stage <strong>of</strong> the stock. Dry pellets are normally fed to finfish at 2–5 percent<br />
<strong>of</strong> body weight per day. Feeding rates <strong>for</strong> shrimp are much higher <strong>and</strong> usually range<br />
from 4–8 percent <strong>of</strong> body weight, while the feeding rate <strong>of</strong> herbivorous fish with<br />
green fodder can be as high as 10–20 percent <strong>of</strong> body weight per day. Daily rations<br />
are controlled through different means in the various culture practices. Although the<br />
daily ration is generally determined according to average fish weight <strong>and</strong> temperature,<br />
the actual amount is <strong>of</strong>ten adjusted according to the feeding behaviour <strong>and</strong> intensity<br />
<strong>of</strong> the fish. This is <strong>of</strong>ten assessed by checking the feed left over in feeding areas or on<br />
feed trays at a certain time after feeding. A commonly used feeding schedule <strong>for</strong> Nile<br />
tilapia is illustrated in Table 36, which also shows that ration is determined by the level<br />
<strong>of</strong> intensity.<br />
Feeding frequency is dependent on the feeding habit <strong>of</strong> the species <strong>and</strong> the feed<br />
application method. In shrimp/prawn culture, animals are fed 4–6 times daily in the<br />
early stage <strong>of</strong> culture <strong>and</strong> later reduced to 3–4 times per day. If manual feeding is<br />
practiced then fish are normally fed 2–3 times per day. If automatic feeders are used then<br />
fish are normally fed 4–6 times a day. Frequent feeding can improve feed utilization.<br />
Several feed application methods are illustrated in Figures 23–27. A floating frame<br />
is usually used in ponds <strong>for</strong> feeding with aquatic weeds, terrestrial grasses or vegetable<br />
leaves (Figure 23). The frames are commonly made <strong>of</strong> bamboo <strong>and</strong> confine the floating<br />
feed. Residues <strong>and</strong> uneaten material are concentrated on the bottom, under the<br />
frame, which facilitates easy removal. Feeding trays are also traditionally used <strong>for</strong> the<br />
application <strong>of</strong> sinking pellets <strong>and</strong> are also useful to monitor feeding intensity, adjusting<br />
the daily ration <strong>and</strong> to monitor fish health Figure 24).<br />
TABLE 36<br />
Feeding recommendations <strong>for</strong> different size classes <strong>of</strong> tilapia under different farming conditions<br />
Fish weight (g)<br />
Feed particle<br />
size<br />
(mm)<br />
Feeding rate (% wet body weight) Feeding<br />
Semi-intensive (20 000/ha)<br />
frequency<br />
(time/day)<br />
Analysis <strong>of</strong> <strong>feeds</strong> <strong>and</strong> <strong>fertilizers</strong> <strong>for</strong> <strong>sustainable</strong> aquaculture development in China 175<br />
FIGURE 24<br />
Feeding tray used <strong>for</strong> sinking <strong>feeds</strong> in<br />
a semi-intensive fish pond, Suzhou city,<br />
Jiangsu province<br />
FIGURE 26<br />
Feeding by broadcasting <strong>for</strong> tilapia in<br />
freshwater cage culture, Hepu County,<br />
Guangxi Autonomous Region<br />
FIGURE 25<br />
Semi-automatic feeder used in intensive<br />
fish pond, Gaoyou city, Jiangsu province<br />
FIGURE 27<br />
Broadcasting <strong>of</strong> trash fish in marine<br />
cages, Sh<strong>and</strong>ong province<br />
Feeding shelves are usually used in indoor re-circulating systems <strong>for</strong> application<br />
<strong>of</strong> dough or paste <strong>feeds</strong>, e.g. <strong>for</strong> eels. Semi-automatic <strong>and</strong> automatic feeders <strong>for</strong> dry<br />
sinking or floating pellets are now commonly used in intensive pond culture <strong>and</strong> cage<br />
culture (Figure 25). The feeders are set to deliver a certain amount <strong>of</strong> feed at predetermined<br />
times. Broadcasting <strong>of</strong> feed over the water surface is a common feeding<br />
method used in intensive shrimp <strong>and</strong> prawn culture <strong>and</strong> during the early stages <strong>of</strong> fish<br />
nursery operations (Figures 26 <strong>and</strong> 27). It is per<strong>for</strong>med by h<strong>and</strong> either from the pond<br />
dyke or from a boat.<br />
4. THE DEVELOPMENT OF AUQAFEED INDUSTRIES IN CHINA<br />
4.1 Background <strong>and</strong> historical development<br />
China is currently the world’s largest producer <strong>of</strong> industrially compounded aqua<strong>feeds</strong>.<br />
The bulk <strong>of</strong> the feed is manufactured <strong>for</strong> freshwater cyprinids. It is estimated that<br />
40–45 percent <strong>of</strong> farmed fish in China are fed on industrially manufactured compound<br />
aqua<strong>feeds</strong> <strong>and</strong> about 8.0 million tonnes <strong>of</strong> commercial aqua<strong>feeds</strong> are produced annually.<br />
Currently, there are over 360 large <strong>and</strong> medium scale aquaculture feed manufacturers<br />
with an annual production <strong>of</strong> about 2.7 million tonnes. There are also a large number<br />
<strong>of</strong> small aquafeed mills that produce <strong>feeds</strong> on dem<strong>and</strong>. Local <strong>and</strong> international research<br />
results provide the basic reference points <strong>for</strong> <strong>for</strong>mulating commercial aqua<strong>feeds</strong>.<br />
Aquafeed technologies were introduced from Taiwan Province <strong>of</strong> China, Europe<br />
<strong>and</strong> the United States <strong>of</strong> America. Presently, aquafeed machinery is manufactured in<br />
China.<br />
COURTESY OF LIANG MENGQUING
176<br />
<strong>Study</strong> <strong>and</strong> <strong>analysis</strong> <strong>of</strong> <strong>feeds</strong> <strong>and</strong> <strong>fertilizers</strong> <strong>for</strong> <strong>sustainable</strong> aquaculture development<br />
The development <strong>of</strong> China’s animal feed industry started in the late 1970’s. In May<br />
1984, the State Council promulgated the “1984–2000 Outline <strong>of</strong> China’s Feed Industry<br />
Development”. This plan resulted in China’s feed industry growing from practically<br />
nothing in 1975 to one <strong>of</strong> the worlds largest within two decades. The number <strong>of</strong> mills<br />
exp<strong>and</strong>ed to over 14 000 in 1985. State owned <strong>and</strong> managed mills constituted over<br />
60 percent <strong>of</strong> all feed mills at the end <strong>of</strong> the 1980’s. However, this has changed <strong>and</strong><br />
most are now owned <strong>and</strong> operated by the private sector or by public/private joint<br />
venture companies. In 1976 the total annual output <strong>of</strong> compound animal <strong>feeds</strong> was 0.6<br />
million tonnes. By 2002 production had increased to 56 million tonnes <strong>and</strong> by 2004 to<br />
93 million tonnes.<br />
Since the late 1980’s the dem<strong>and</strong> <strong>for</strong> compound aqua<strong>feeds</strong> has increased rapidly. At<br />
present there are more than 10 000 large, medium <strong>and</strong> small aquafeed mills to include<br />
that produce different <strong>feeds</strong> <strong>and</strong> additives. Most <strong>of</strong> the feed mills are located in coastal<br />
areas such as Guangdong, Fujian, Hainan, Guangxi, Zhejiang, Sh<strong>and</strong>ong, Liaoning,<br />
Shanghai <strong>and</strong> Tianjin <strong>and</strong> the feed output <strong>of</strong> these provinces account <strong>for</strong> more than<br />
50 percent <strong>of</strong> total aquafeed production. Feed mills producing <strong>feeds</strong> <strong>for</strong> common<br />
freshwater fishes are located mainly in Sichuan province. By 2004, China produced<br />
over 8 million tonnes <strong>of</strong> compounded aqua<strong>feeds</strong>, which then accounted <strong>for</strong> 8.6 percent<br />
<strong>of</strong> total compound animal feed production. The aquafeed industry is the fastest<br />
exp<strong>and</strong>ing agricultural industry in China <strong>and</strong> is currently growing at over 30 percent<br />
per annum. The industry is also becoming more efficient as old <strong>and</strong> inefficient mills are<br />
closed <strong>and</strong> new mills are opened.<br />
During the 1980s the Customs Bureau <strong>of</strong> China removed import levies on feed<br />
milling equipment <strong>and</strong> reduced the levies on many <strong>feeds</strong>tuffs. By 1990 there were over<br />
270 factories that manufactured feed milling equipment. The reduction in levies on<br />
feed stuffs led to the <strong>for</strong>mation <strong>of</strong> joint ventures <strong>and</strong> the entry <strong>of</strong> <strong>for</strong>eign owned feed<br />
manufacturing firms from Thail<strong>and</strong>, United States <strong>of</strong> America, Japan, United Kingdom,<br />
Hong Kong <strong>and</strong> Taiwan Province <strong>of</strong> China. These changes have significantly influenced<br />
the industry by introducing new milling techniques, feed <strong>for</strong>mulations, management<br />
methods <strong>and</strong> marketing practices. The competition within the aquafeed industry has<br />
also made the sector more efficient. Initially, aqua<strong>feeds</strong> were produced as a special<br />
feed line in existing livestock feed mills. This has obviously changed <strong>and</strong> extruded <strong>and</strong><br />
floating aqua<strong>feeds</strong> made by specialist aquafeed mills have been commercially available<br />
since 1996. While compound <strong>feeds</strong> were initially only fed to high value export species<br />
such as marine shrimp, producers are exp<strong>and</strong>ing the use <strong>of</strong> compound <strong>feeds</strong> <strong>for</strong> other<br />
species as well.<br />
Aqua<strong>feeds</strong> are manufactured in different <strong>for</strong>ms <strong>and</strong> the nutrient composition<br />
depends on the species <strong>and</strong> stage <strong>of</strong> growth. Feed cost varies with quantity, quality <strong>and</strong><br />
type <strong>of</strong> product (sinking or floating pellets, powder <strong>for</strong> s<strong>of</strong>t <strong>feeds</strong> or microparticulate<br />
<strong>feeds</strong> <strong>for</strong> fry). At this juncture the bulk <strong>of</strong> the microparticulate <strong>feeds</strong> used in marine<br />
finfish aquaculture is imported. There are only five aquafeed mills that produce<br />
microparticulate diets <strong>for</strong> marine fish <strong>and</strong> output does not meet the dem<strong>and</strong>.<br />
4.2 Quality assurance <strong>and</strong> feed st<strong>and</strong>ard<br />
The sharp increase in dem<strong>and</strong> <strong>for</strong> aqua<strong>feeds</strong> in the 1980s <strong>and</strong> 1990s resulted in the<br />
shortage <strong>of</strong> feed ingredients <strong>and</strong> poor feed quality. Poorly <strong>for</strong>mulated <strong>feeds</strong> <strong>and</strong><br />
or improper manufacturing processes also resulted in low digestibility <strong>and</strong> poor<br />
water stability. Furthermore, the use <strong>of</strong> feed additives such as growth promoters,<br />
hormones <strong>and</strong> antibiotics was uncontrolled. To resolve these problems the Ministry<br />
<strong>of</strong> Agriculture now supports the National Center <strong>for</strong> Quality Supervision <strong>and</strong> Test <strong>of</strong><br />
Aquatic Products <strong>and</strong> the aquafeed industry associations in feed quality assurance.<br />
Under the new regulations, feed mills must secure a license be<strong>for</strong>e they are allowed to<br />
operate <strong>and</strong> must register the nutritional composition <strong>and</strong> value <strong>of</strong> their <strong>for</strong>mulations.
Analysis <strong>of</strong> <strong>feeds</strong> <strong>and</strong> <strong>fertilizers</strong> <strong>for</strong> <strong>sustainable</strong> aquaculture development in China 177<br />
Feed processing plants are inspected by the feed industry associations <strong>and</strong> by the<br />
National Center <strong>for</strong> Quality Supervision <strong>and</strong> Test <strong>of</strong> Aquatic Products. Sanitary tests<br />
are conducted <strong>and</strong> mills are inspected to ensure proper storage <strong>and</strong> use <strong>of</strong> raw materials<br />
<strong>and</strong> hygiene during the manufacturing process. Feeds are tested r<strong>and</strong>omly to ensure<br />
that they meet the stipulated minimum <strong>and</strong> advertised st<strong>and</strong>ards. Products are also<br />
tested <strong>for</strong> antibiotic levels <strong>and</strong> hormone residues. Some feed st<strong>and</strong>ards are shown in<br />
Tables 37 to 40. To facilitate inspection <strong>and</strong> quality control <strong>of</strong> aqua<strong>feeds</strong>, national,<br />
provincial <strong>and</strong> district centres <strong>of</strong> feed quality control have also been established.<br />
TABLE 37<br />
Feed specification <strong>for</strong> fleshy prawn (Penaeus chinensis)<br />
Number<br />
Feed type/<br />
class<br />
Shrimp size<br />
(cm)<br />
Pellet<br />
diameter (mm)<br />
Pellet<br />
length (mm)<br />
01 Starter 1.0–3.0 0.5–1.5 1.5–3.0<br />
02 Grower 3.1–8.0 1.2–2.0 2.0–5.0<br />
03 Finisher >8.0 1.8–2.5 4.0–8.0<br />
Source: MOA (2002)<br />
TABLE 38<br />
Guaranteed <strong>analysis</strong> <strong>of</strong> feed <strong>for</strong> fleshy prawn<br />
(Penaeus chinensis)<br />
Parameters Index<br />
Pellet diameter ≤<br />
0.425 mm<br />
0.250 mm<br />
3<br />
20<br />
Degree <strong>of</strong> homogenity <strong>of</strong> mixing ≤ 10<br />
Water stability (leaching rate) (%) ≤ 12<br />
Moisture (%) ≤ 11<br />
pH 5.0–8.5<br />
Crude protein (%) ≥ 38<br />
Crude lipid (%) 3–8<br />
Crude fibre (%) ≤ 5<br />
Ash (%) ≤ 16<br />
Source: MOA (2002)<br />
TABLE 39<br />
Guaranteed <strong>analysis</strong> (%) <strong>of</strong> feed <strong>for</strong> flounder<br />
Parameters Starter pellet Juvenile Adult<br />
Fish length (cm) 15.0<br />
Leaching rate (%) ≤ 4.0 4.0 4.0<br />
Crude protein (%) ≥ 50 45 40<br />
Crude lipid (%) ≥ 6.5 5.5 4.5<br />
Crude fibre (%) ≤ 1 2 3<br />
Ash (%) ≤ 15 16 16<br />
Moisture (%) ≤ 10 10 10<br />
Ca (%) ≤ 4 4 4<br />
P (%) ≥ 1.5 1.5 1.5<br />
Source: MOA (2002)<br />
TABLE 40<br />
Technical specifications <strong>for</strong> <strong>for</strong>mulated feed <strong>of</strong> eel<br />
Feed grade White eel Black eel Juvenile Growout<br />
Fish size, weight (g)<br />
Physical <strong>and</strong> chemical characteristics (%)<br />
15<br />
Mesh size (µm) ≤ 200 250<br />
Degree <strong>of</strong> homogenity <strong>of</strong> mixing ≤ 5.0 8.0 10.0 10.0<br />
Leaching rate (%) ≤ 4.0<br />
Crude protein (%) ≥ 52.0 47.0 46.0 45.0<br />
Crude lipid (%) ≥ 3.0<br />
Fibre (%) ≤ 0.8 1.0<br />
Moisture (%) ≤ 10<br />
Ash (%) ≤ 18<br />
Ca (%) ≤ 4.6<br />
P (%) ≤ 1.5<br />
S<strong>and</strong> (%)<br />
Sensory characteristic<br />
≤ 2.0<br />
General appearances Uni<strong>for</strong>m color, without mould, deterioration, blocking <strong>and</strong><br />
insects growth<br />
Visco-elasticity Good extensibility<br />
after stirring<br />
Source: MOA (2002)<br />
Good extensibility <strong>and</strong> visco-elasticity<br />
after stirring
178<br />
TABLE 41<br />
Fishmeal imports <strong>and</strong> exports <strong>for</strong> 1995–2004 (tonnes)<br />
Year Export Import Consumption<br />
1995 3 367 690 050 686 683<br />
1996 778 882 476 881 698<br />
1997 1 488 985 234 983 746<br />
1998 1 474 416 188 414 715<br />
1999 1 308 631 271 629 963<br />
2000 1 718 1 185 713 1 183 994<br />
2001 1 690 901 696 900 007<br />
2002 3 767 958 151 954 384<br />
2003 4 160 800 251 796 090<br />
2004 5 026 1 123 082 1 118 056<br />
<strong>Study</strong> <strong>and</strong> <strong>analysis</strong> <strong>of</strong> <strong>feeds</strong> <strong>and</strong> <strong>fertilizers</strong> <strong>for</strong> <strong>sustainable</strong> aquaculture development<br />
4.3 Exports <strong>and</strong> imports <strong>of</strong> feed<br />
ingredients <strong>and</strong> additives<br />
As the aquaculture industry exp<strong>and</strong>ed imports<br />
<strong>of</strong> feed ingredients, mainly fishmeal, soybean<br />
meal <strong>and</strong> amino acids increased proportionally.<br />
Export <strong>and</strong> import volumes <strong>of</strong> fishmeal <strong>for</strong><br />
1995–2004 <strong>and</strong> soybean <strong>and</strong> three amino<br />
acids (glutamine, lysine <strong>and</strong> methionine)<br />
<strong>for</strong> 2000–2004 are shown in Tables 41 <strong>and</strong> 42.<br />
To promote the development <strong>of</strong> the aquaculture<br />
feed industry, relatively low tariffs are levied<br />
on the major imported raw materials in China.<br />
TABLE 42<br />
Soybean <strong>and</strong> amino acid imports <strong>and</strong> exports <strong>for</strong> 2000 to 2004 (tonnes)<br />
Year<br />
Soybean<br />
Export Import<br />
Glutamic acid<br />
Export Import<br />
Lysine<br />
Export Import<br />
Methionine<br />
Export Import<br />
2000 215 265 10 419 368<br />
2001 261 177 13 939 933 17 607 24 460 782 73 601 275 57 674<br />
2002 305 365 11 315 348 37 167 14 757 974 81 351 186 53 805<br />
2003 294 790 20 741 111 44 135 5 661 8196 75 488 263 72 867<br />
2004 348 648 20 229 940 34 101 2 865 22954 76 475 454 85 819<br />
For example, in 1999 import tariffs on fishmeal intended <strong>for</strong> aqua<strong>feeds</strong> was 3 percent,<br />
compared to 30 percent <strong>for</strong> aquatic products imported <strong>for</strong> human consumption.<br />
Similarly, import duties <strong>for</strong> soybean meal used <strong>for</strong> feed production were 40 percent,<br />
compared to 114 percent <strong>for</strong> soybean products imported <strong>for</strong> other uses. The import<br />
duty on fish oil is 30 percent. The preferential duties on important protein sources<br />
<strong>for</strong> animal <strong>feeds</strong> have had a positive effect on the availability <strong>and</strong> quality <strong>of</strong> <strong>feeds</strong> <strong>for</strong><br />
aquaculture as well as <strong>for</strong> animal husb<strong>and</strong>ry.<br />
Presently China imports about 1.2 million tonnes <strong>of</strong> fishmeal per year, mainly from<br />
Peru, Chile <strong>and</strong> Russia to sustain its feed industry. About 75 percent <strong>of</strong> the imported<br />
fishmeal is used <strong>for</strong> aqua<strong>feeds</strong>. The annual local soybean production is about 15.5–<br />
17.55 million tonnes <strong>and</strong> China imports more than 20 million tonnes <strong>of</strong> soybean from<br />
the United States <strong>of</strong> America <strong>and</strong> Canada.<br />
Additives such as vitamin <strong>and</strong> mineral premixes, stable vitamins, amino acids,<br />
chelated trace elements, mixed enzymes, phytase, probiotics, prebiotics, immunity<br />
stimulants, attractants, antioxidants <strong>and</strong> binders are ether locally produced or imported.<br />
Generally, most <strong>of</strong> the additives are produced in China although amino acids, such as<br />
glutamic acid, lysine, methionine <strong>and</strong> some vitamins are imported.<br />
4.4 Shrimp feed industry<br />
Rapid developments in the shrimp feed industry have contributed to the substantive<br />
harvests in recent years, particularly in the southern coastal regions <strong>of</strong> China.<br />
Shrimp farming in China was initially facilitated by breakthroughs in larval rearing<br />
technologies <strong>and</strong> latterly through the development <strong>of</strong> appropriate <strong>feeds</strong>. Early rearing<br />
stages depend on single cell algae (Phaeodactylum tricornutum, Nitzschia closterium,<br />
Chaetoceros muelleri, Platymonas spp. among others) <strong>and</strong> minced egg yolk <strong>and</strong><br />
soybean milk are also used <strong>for</strong> larval rearing, followed by rotifers <strong>and</strong> Artemia nauplii.<br />
Most hatcheries are equipped with live feed culture facilities. Dried <strong>and</strong> powdered<br />
Spirulina is used in some hatcheries to substitute or supplement live microalgae. Other<br />
<strong>feeds</strong>, such as minced clam meat <strong>and</strong> yeast powder are also used separately or mixed.<br />
Presently, microparticulate <strong>and</strong> microencapsulated <strong>feeds</strong> are widely used in Chinese<br />
shrimp hatcheries.
Analysis <strong>of</strong> <strong>feeds</strong> <strong>and</strong> <strong>fertilizers</strong> <strong>for</strong> <strong>sustainable</strong> aquaculture development in China 179<br />
Be<strong>for</strong>e the advent <strong>of</strong> compound <strong>feeds</strong> shrimp were fed on fishery by-products, such<br />
as low-value fresh trash fish, invertebrates <strong>and</strong> shellfish. These were abundant in the<br />
intertidal zone <strong>and</strong> shallow coastal waters <strong>and</strong> where fed either directly or after being<br />
chopped or crushed. Presently, all shrimp farmers use compound <strong>feeds</strong> with food<br />
conversion ratios <strong>of</strong> 1.2–1.6:1.<br />
4.5 Freshwater fish feed industry<br />
Approximately 70 percent <strong>of</strong> all aquafeed production in China is used <strong>for</strong> pond culture<br />
<strong>of</strong> grass carp, common carp, crucian carp an Nile tilapia. Many other <strong>feeds</strong>tuffs such<br />
as rice bran, rapeseed meal, peanut meal, soybean meal <strong>and</strong> silkworm pupae are also<br />
used in earthen pond systems in combination with organic or inorganic fertilization.<br />
However, it is estimated that only 30 percent <strong>of</strong> carp are now reared on “traditional”<br />
<strong>feeds</strong>. As a consequence <strong>of</strong> the switch to compound <strong>feeds</strong> the carp production cycles are<br />
20–25 percent shorter than they were 10 years ago <strong>and</strong> average FRCs are 1.5:1. Given<br />
the relatively low value <strong>of</strong> carp, feed <strong>for</strong>mulation has become <strong>of</strong> pivotal importance in<br />
this highly competitive sector. The current carp growout <strong>for</strong>mulations contain a variety<br />
<strong>of</strong> ingredients such as fishmeal, peanut meal, soybean meal, rapeseed meal <strong>and</strong> cotton<br />
seed meal. To remain competitive the feed manufacturing sector is very aware <strong>of</strong> the<br />
need to be flexible <strong>and</strong> to further reduce the fishmeal component <strong>of</strong> carp <strong>feeds</strong>. This<br />
will ensure the continued <strong>and</strong> long term sustainability <strong>of</strong> the sector.<br />
4.6 The marine fish feed industry<br />
Compared with freshwater fish production total marine fish aquaculture production is<br />
relatively small, but all are high value species. Marine fish in cages <strong>and</strong> in ponds are fed<br />
mainly on trash fish, farm-made <strong>feeds</strong> <strong>and</strong> extruded pellets, while large-scale industrial<br />
systems exclusively use extruded pellets. Farm-made <strong>feeds</strong> are made from commercial<br />
feed premixes (60–70 percent) that is mixed with trash fish (30–40 percent) to <strong>for</strong>m s<strong>of</strong>t<br />
pellet or dough. The moisture content <strong>of</strong> s<strong>of</strong>t <strong>feeds</strong> is 25–30 percent.<br />
As mentioned above, the type <strong>of</strong> feed is largely determined by the culture system.<br />
For example, since the 1960s aquaculture <strong>of</strong> olive flounder exp<strong>and</strong>ed rapidly <strong>and</strong> the<br />
species is now farmed intensively in l<strong>and</strong> based flow-through systems, in cages as<br />
well as in ponds. In flow-through systems <strong>and</strong> to some extent in cages the fish are fed<br />
on pellets, while farm-made <strong>feeds</strong> consisting <strong>of</strong> premixed feed powders <strong>and</strong> a high<br />
proportion <strong>of</strong> trash fish are predominantly used in cages <strong>and</strong> in ponds. The high cost<br />
<strong>and</strong> reduced availability <strong>of</strong> trash fish is becoming problematic <strong>and</strong> the environmental<br />
impacts <strong>of</strong> using trash fish are well recognised <strong>and</strong> hence it is important to develop<br />
species specific <strong>feeds</strong> <strong>for</strong> the intensive production <strong>of</strong> marine fish. The detailed<br />
nutritional requirements <strong>of</strong> olive flounder have only recently been defined (Lei, 2005)<br />
<strong>and</strong> these findings provide the basis upon which a specific extruded flounder feed can<br />
be developed. Despite the absence <strong>of</strong> a specific <strong>for</strong>mulated feed <strong>for</strong> flounder, over 40<br />
percent <strong>of</strong> flounder is produced using <strong>for</strong>mulated <strong>feeds</strong>. Olive flounder readily accept<br />
dry <strong>for</strong>mulated <strong>feeds</strong> <strong>and</strong> FCRs <strong>of</strong> 1.2:1 have already been achieved. The development<br />
<strong>of</strong> specific <strong>for</strong>mulated <strong>feeds</strong> will go a long way to ensure the future sustainability <strong>of</strong> the<br />
marine fish farming sector in China.<br />
As with flounder, the farming <strong>of</strong> large yellow croaker (Pseudosciaena crocea),<br />
mainly in cages, is also largely dependent on the use <strong>of</strong> trash fish based farm-made<br />
<strong>feeds</strong>. Recent studies have shown that the use <strong>of</strong> trash fish affects flesh quality in yellow<br />
croaker. The basic nutritional requirements <strong>of</strong> large yellow croaker are known (Duan<br />
et al., 2001) <strong>and</strong> an extruded diet <strong>for</strong> this species has been developed <strong>and</strong> is now widely<br />
used, with FCRs <strong>of</strong> 1.5:1. These two examples illustrate the changes that are occurring<br />
in the feeding <strong>of</strong> marine fish in China.
180<br />
<strong>Study</strong> <strong>and</strong> <strong>analysis</strong> <strong>of</strong> <strong>feeds</strong> <strong>and</strong> <strong>fertilizers</strong> <strong>for</strong> <strong>sustainable</strong> aquaculture development<br />
5. PROBLEMS AND CONSTRAINTS OF AQUACULTURE FEEDS AND FEEDINGS<br />
The main trends in aquaculture development in China over the past two decades have<br />
been described in the preceding sections <strong>and</strong> can briefly be summarized as follows:<br />
• There is a general trend towards intensification <strong>of</strong> farming systems. This is driven<br />
by the need to limit resource use <strong>and</strong> simultaneously to maximize production <strong>and</strong><br />
return on investment.<br />
• There is a clear trend towards greater species diversification. This is in response<br />
to changes in consumer preferences <strong>and</strong> the farmers’ pursuance <strong>of</strong> better margins.<br />
Most <strong>of</strong> the species that have recently been introduced into aquaculture are<br />
generally dependent on artificial <strong>feeds</strong>.<br />
• These trends have led to the increasing dependence on <strong>and</strong> dem<strong>and</strong> <strong>for</strong> <strong>for</strong>mulated<br />
<strong>feeds</strong>.<br />
The overall growth <strong>of</strong> the sector <strong>and</strong> the trends described above have given rise to<br />
several major problems <strong>and</strong> constraints <strong>and</strong> these are:<br />
• Availability <strong>and</strong> accessibility <strong>of</strong> aquaculture feed ingredients will become a major<br />
constraint, particularly in view <strong>of</strong> expected increases in production <strong>and</strong> the<br />
increasing use <strong>of</strong> artificial <strong>feeds</strong>.<br />
• Accessibility to aquafeed ingredients (e.g. fishmeal, trash fish, soybeans) may<br />
become a limiting factor under certain circumstances.<br />
• Reduced integration <strong>of</strong> fish with animal husb<strong>and</strong>ry may create problems with<br />
respect to the availability <strong>of</strong> organic <strong>fertilizers</strong>.<br />
• Because <strong>of</strong> competition <strong>for</strong> feed resources, aquaculture may become less<br />
competitive in relation to other sectors with higher economic returns.<br />
• Poor quality farm-made <strong>feeds</strong> may affect feed utilization <strong>and</strong> efficiency.<br />
• Improper feed application affects feed utilization <strong>and</strong> pr<strong>of</strong>it margins <strong>and</strong> has<br />
negative environmental impacts.<br />
• Small <strong>and</strong> medium-scale farmers are affected by the increasing dominance <strong>of</strong> feed<br />
manufacturing companies <strong>and</strong> suppliers.<br />
If these problems <strong>and</strong> constraints are not appropriately addressed they may negatively<br />
impact on the growth <strong>of</strong> the aquaculture sector <strong>and</strong> its <strong>sustainable</strong> development.<br />
5.1 Availability <strong>and</strong> accessibility <strong>of</strong> <strong>feeds</strong>, feed ingredients <strong>and</strong> <strong>fertilizers</strong><br />
The most pressing constraint facing Chinese aquaculture is the future availability <strong>of</strong><br />
<strong>and</strong> accessibility to feed ingredients. This constraint is fuelled by two major factors.<br />
First, while the growth rate <strong>of</strong> Chinese aquaculture has slowed down in recent years it<br />
is inevitable that production will <strong>and</strong> has to increase significantly in the coming years.<br />
According to the national fisheries development plan, by 2010 the per capita availability<br />
<strong>of</strong> aquatic products is expected to reach 44 kg. To meet this target, total fisheries<br />
production must reach 57.2 million tonnes, an increase <strong>of</strong> 8 million tonnes over the<br />
2004 national production figure. Considering the stagnant or even slightly declining<br />
catches from capture fisheries, the increasing dem<strong>and</strong> <strong>for</strong> aquatic products can only be<br />
met by aquaculture. For various reasons as outlined above, aquaculture will become<br />
more dependent on artificial <strong>feeds</strong> hence increasing the dem<strong>and</strong> <strong>for</strong> core ingredients.<br />
By 2010, it is estimated that the dem<strong>and</strong> <strong>for</strong> commercially produced aqua<strong>feeds</strong> will be<br />
15–20 million tonnes, excluding farm-made aqua<strong>feeds</strong>. This is a 46–60 percent increase<br />
over the 2004/05 production <strong>of</strong> 8 million tonnes.<br />
Secondly, China has a population <strong>of</strong> 1.3 billion people, increasing by approximately<br />
17 million annually. It is an onerous task <strong>for</strong> China to meet the basic grain dem<strong>and</strong>s <strong>of</strong><br />
its increasing population. It is also unlikely that the increasing dem<strong>and</strong> <strong>for</strong> aquafeed<br />
ingredients can be met by national agriculture <strong>and</strong> fisheries production capacity. In<br />
addition, competition <strong>for</strong> feed ingredients <strong>of</strong> plant origin from the exp<strong>and</strong>ing animal<br />
husb<strong>and</strong>ry sector will intensify <strong>and</strong> this will put further pressure on the supply<br />
side.
Analysis <strong>of</strong> <strong>feeds</strong> <strong>and</strong> <strong>fertilizers</strong> <strong>for</strong> <strong>sustainable</strong> aquaculture development in China 181<br />
The future supply <strong>of</strong> fishmeal <strong>for</strong> the Chinese aquaculture industry will become<br />
increasingly problematic. In recent years the inclusion rate <strong>of</strong> fishmeal in aqua<strong>feeds</strong><br />
has increased substantially to improve feed efficiency. This, coupled with the increased<br />
production levels <strong>of</strong> shrimp, prawns <strong>and</strong> fish, all <strong>of</strong> which have a high protein dem<strong>and</strong> <strong>of</strong><br />
animal origin has increased the dem<strong>and</strong> <strong>for</strong> fishmeal significantly. National production<br />
<strong>of</strong> fishmeal is limited <strong>and</strong> most <strong>of</strong> the fishmeal used in China is imported. Presently,<br />
world fishmeal production is maintained at around six million tonnes. The increasing<br />
dem<strong>and</strong> <strong>for</strong> fishmeal by China will there<strong>for</strong>e have a major <strong>and</strong> very significant impact<br />
on the balance <strong>of</strong> dem<strong>and</strong> <strong>and</strong> supply in the world market.<br />
Traditional aquaculture practices were closely linked to animal husb<strong>and</strong>ry. Hence<br />
organic fertilizer was a very important input in production systems. This was<br />
convenient <strong>and</strong> practical in that it provided a means <strong>of</strong> increasing farm production<br />
through recycling <strong>of</strong> biological wastes. In recent years aquaculture has become more<br />
isolated from animal husb<strong>and</strong>ry <strong>for</strong> various reasons. Most importantly the poor<br />
economic returns from improperly managed animal rearing activities have made these<br />
practices unviable. Moreover, small-scale animal rearing is gradually being replaced<br />
by large-scale, industrial operations. This reduces the traditional linkage between<br />
aquaculture <strong>and</strong> animal husb<strong>and</strong>ry <strong>and</strong> also impacts on the supply <strong>of</strong> organic <strong>fertilizers</strong>.<br />
The inconvenience <strong>and</strong> additional transport costs in acquiring adequate quantities <strong>of</strong><br />
manure is to now limiting the use <strong>of</strong> organic <strong>fertilizers</strong> in fish culture.<br />
5.2 Economic <strong>and</strong> social constraints <strong>of</strong> feed resource use<br />
Due to the rapid expansion <strong>of</strong> the animal feed industry, including the aquafeed industry,<br />
the increase in dem<strong>and</strong> <strong>for</strong> feed ingredients has pushed market prices steadily upwards.<br />
According to data released by the Ministry <strong>of</strong> Agriculture, between 2002 <strong>and</strong> 2004 the<br />
price <strong>of</strong> maize increased by nearly 30 percent, soybean meal price by about 90 percent<br />
(up to US$360/tonne in 2004) <strong>and</strong> fishmeal by 10–15 percent in the same period. These<br />
significant price increases over a relatively short time period have impacted on the<br />
economic returns <strong>of</strong> farmers as well as feed manufacturers.<br />
Despite concerted ef<strong>for</strong>ts by all role players to improve the quality <strong>of</strong> aqua<strong>feeds</strong><br />
<strong>and</strong> their application, utilization efficiency is far from satisfactory <strong>and</strong> this results in<br />
excessive discharge <strong>of</strong> nutrients into the environment. The increasing use <strong>of</strong> commercial<br />
<strong>feeds</strong> in aquaculture has also resulted in greater public concern on the pollution <strong>of</strong><br />
aquatic environments by aquaculture.<br />
Improving the quality <strong>of</strong> aqua<strong>feeds</strong> to achieve greater feed efficiency, higher<br />
returns <strong>and</strong> reduced environmental impacts has become an urgent issue <strong>for</strong> the<br />
<strong>sustainable</strong> development <strong>of</strong> aquaculture in the country. The major challenge lies in<br />
improving feed quality without increasing costs. Major technical breakthroughs in<br />
the nutrition <strong>of</strong> cultured animals <strong>and</strong> feed manufacturing technology are, there<strong>for</strong>e,<br />
urgently needed.<br />
5.3 Use <strong>of</strong> commercially manufactured pellet <strong>feeds</strong> by small <strong>and</strong> mediumscale<br />
aquaculture<br />
The recent trend towards greater use <strong>of</strong> manufactured <strong>feeds</strong> has advantages <strong>and</strong><br />
disadvantages. The advantages include greater convenience <strong>and</strong> <strong>of</strong>fer farmers a greater<br />
choice with respect to species selection <strong>and</strong> also improved production efficiency <strong>and</strong><br />
yield. On the other h<strong>and</strong>, the disadvantages <strong>of</strong> industrially manufactured <strong>feeds</strong>,<br />
especially <strong>for</strong> small <strong>and</strong> medium scale farmers, must not be overlooked <strong>and</strong> these<br />
are:<br />
• reduced the usage <strong>of</strong> locally available resources, which are usually cheaper;<br />
• increasing number <strong>of</strong> farmers ab<strong>and</strong>oning traditional semi-intensive polyculture<br />
systems, which usually <strong>and</strong> <strong>of</strong>ten have sound ecological <strong>and</strong> economic<br />
benefits;
182<br />
<strong>Study</strong> <strong>and</strong> <strong>analysis</strong> <strong>of</strong> <strong>feeds</strong> <strong>and</strong> <strong>fertilizers</strong> <strong>for</strong> <strong>sustainable</strong> aquaculture development<br />
• breacking <strong>of</strong> the traditional linkage between aquaculture <strong>and</strong> other agricultural<br />
activities such as animal husb<strong>and</strong>ry <strong>and</strong> horticulture, which promotes recycling<br />
<strong>of</strong> wastes <strong>and</strong> by-products;<br />
• increasing dependence <strong>of</strong> farmers on feed manufacturers <strong>and</strong> retailers influences<br />
their production goals <strong>and</strong> decisions; <strong>and</strong><br />
• high input-high output production systems using pelleted <strong>feeds</strong> increases market<br />
risks to the farmers, especially when they are mislead by feed suppliers.<br />
6. RESOURCE AVAILABILITY AND THE EXPANSION OF THE AQUACULTURE<br />
INDUSTRY<br />
During the period 1980–1990 the average annual growth rate <strong>of</strong> aquaculture was<br />
around 10 percent <strong>and</strong> from 1999–2000 it was 11.1 percent. The future expansion <strong>of</strong><br />
the aquaculture industry in China will largely depend on available resources (feed<br />
<strong>and</strong> <strong>fertilizers</strong>) <strong>and</strong> support facilities (science, technology, feedmills <strong>and</strong> improved life<br />
support systems).<br />
6.1 Ingredient requirements<br />
Because <strong>of</strong> their high nutrient density, <strong>for</strong>mulated aqua<strong>feeds</strong> are among the most<br />
expensive animal <strong>feeds</strong> in the market. Their high cost is also largely attributable to the<br />
liberal use <strong>of</strong> expensive ingredients such as fishmeal <strong>and</strong> fish oil. Due to an increasing<br />
dem<strong>and</strong> <strong>for</strong> aqua<strong>feeds</strong> <strong>and</strong> overfishing, the dem<strong>and</strong> <strong>for</strong> fishmeal will exceed supply in<br />
the very near future. Hence there is a desperate need to assess <strong>and</strong> exploit new protein<br />
sources to replace fishmeal in artificial <strong>feeds</strong> as much as possible. This is particularly<br />
important <strong>for</strong> China, which has the largest aquaculture industry in the world but only<br />
produces a very limited quantity <strong>of</strong> fishmeal.<br />
According to the China Fisheries Yearbook (2001) the total aquaculture production<br />
<strong>of</strong> 25.8 million tonnes in 2000 (excluding aquatic plants <strong>and</strong> seaweeds) consisted <strong>of</strong><br />
52.1 percent filter feeders, 26.4 percent omnivorous species, 12.3 percent herbivorous<br />
species <strong>and</strong> 4.5 percent carnivorous species. The production subtotal <strong>for</strong> omnivorous,<br />
herbivorous <strong>and</strong> carnivorous species there<strong>for</strong>e amounted to approximately 11.2 million<br />
tonnes (Table 43). If all <strong>of</strong> the <strong>for</strong>mer had been produced using compound <strong>feeds</strong> at a<br />
FCR <strong>of</strong> 1.5:1 then approximately 16.7 million tonnes <strong>of</strong> artificial <strong>feeds</strong> would have been<br />
required. At present, China has to import about 1.2 million tonnes <strong>of</strong> fishmeal a year <strong>for</strong><br />
the animal feed industry <strong>and</strong> <strong>of</strong> which, aqua<strong>feeds</strong> use approximately 70 percent. If the<br />
annual production <strong>of</strong> aqua<strong>feeds</strong> reaches 16.7 million tonnes as calculated above, then<br />
China would need approximately 3.64 million tonnes <strong>of</strong> fishmeal per annum to sustain<br />
its current production <strong>of</strong> fish <strong>and</strong> crustaceans (Table 43). The carnivorous species<br />
consumed the largest proportion <strong>of</strong> the available fishmeal (71.1 percent <strong>of</strong> the total<br />
used in aqua<strong>feeds</strong>), followed by omnivorous species (17.3 percent), <strong>and</strong> herbivorous<br />
species (9.3 percent). In addition, about 4 million tonnes <strong>of</strong> trash fish are used as feed<br />
<strong>for</strong> marine finfish. To meet this theoretical dem<strong>and</strong> is, quite frankly, impossible. The<br />
only way to sustain the required level <strong>of</strong> growth <strong>of</strong> aquaculture in China is to exploit<br />
new protein sources <strong>and</strong> reduce the fishmeal inclusion levels in <strong>feeds</strong>. However,<br />
significant reductions in dietary fishmeal inclusion levels will result in reduced feed<br />
palatability <strong>and</strong> production. It is there<strong>for</strong>e important <strong>for</strong> science to consider not only<br />
the possible essential amino acid imbalances but also to pay particular attention to feed<br />
attractants.<br />
In 2004, freshwater fish were the biggest consumers <strong>of</strong> commercial <strong>feeds</strong> (accounting<br />
<strong>for</strong> approximately 70 percent <strong>of</strong> total aquafeed usage), followed by shrimp (10 percent).<br />
The main ingredients in freshwater fish <strong>and</strong> shrimp <strong>feeds</strong> are soybean meal, peanut<br />
meal <strong>and</strong> rape seed meal <strong>and</strong> on a combined basis their total inclusion level amounts to<br />
about 50 percent In 2003, the total production <strong>of</strong> common carp, crucian carp, tilapia,<br />
wuchang bream, black carp <strong>and</strong> grass carp was about 9.15 million tonnes. On the basis
Analysis <strong>of</strong> <strong>feeds</strong> <strong>and</strong> <strong>fertilizers</strong> <strong>for</strong> <strong>sustainable</strong> aquaculture development in China 183<br />
<strong>of</strong> a FCR <strong>of</strong> 1.5:1 these fish consumed an approximate amount <strong>of</strong> 13.7 million tonnes<br />
<strong>of</strong> feed. Similarly, the production <strong>of</strong> 1.3 million tonnes <strong>of</strong> crustaceans in 2003 at a FCR<br />
<strong>of</strong> 1.5:1 would have consumed approximately 2.0 million tonnes <strong>of</strong> feed. This suggests<br />
that about 15.7 million tonnes <strong>of</strong> feed were consumed by freshwater fish <strong>and</strong> crustacean<br />
alone. However, in 2003 total commercial aquafeed production only amounted to some<br />
7.8 million tonnes. Notwithst<strong>and</strong>ing the fact that marine fish were not considered in<br />
this calculation it is clear that there is a substantial gap between the requirement <strong>for</strong><br />
commercial <strong>feeds</strong> <strong>and</strong> actual production.<br />
To predict the future feed requirements <strong>of</strong> the aquaculture industry we used data<br />
provided by the National Feed Industry Office (Table 44). It was calculated that<br />
freshwater fish will have the highest requirement <strong>and</strong> that marine fish species like<br />
flatfish, grouper, cobia, large yellow croaker, seabass <strong>and</strong> shrimp will eventually require<br />
substantial amounts <strong>of</strong> artificial <strong>feeds</strong> because <strong>of</strong> increasing production. It is also<br />
predicted that trash fish will be gradually replaced by artificial <strong>feeds</strong> in the coming ten<br />
years. At current growth rates the predicted total feed requirement <strong>for</strong> all sectors by<br />
2015 is approximately 54 million tonnes (Table 44). Because not all fish farmers will be<br />
using artificial <strong>feeds</strong> by 2015 <strong>and</strong> because FCRs are expected to improve this estimate<br />
is considered as the upper maximum, but gives some inkling <strong>of</strong> the magnitude <strong>of</strong> the<br />
challenges faced by Chinese aquaculture.<br />
To evaluate whether the available raw materials can sustain the requirements <strong>for</strong> the<br />
projected production increases, the <strong>feeds</strong>tuff requirements <strong>and</strong> available resources are<br />
compared. The projected potential annual dem<strong>and</strong> <strong>for</strong> feed ingredients by the animal<br />
feed industry is shown in Table 45, which shows that there will be a 43.2 million tonne<br />
shortfall <strong>for</strong> energy sources <strong>and</strong> a 25.2 million tonne shortfall <strong>for</strong> protein sources.<br />
TABLE 43<br />
The potential annual dem<strong>and</strong> <strong>of</strong> fishmeal <strong>for</strong> aquaculture <strong>feeds</strong> in China (based on aquaculture<br />
production in 2000)<br />
Feeding habits<br />
Estimated production<br />
(million tonnes)<br />
FCR<br />
(approx)<br />
Feed production<br />
(million tonnes)<br />
% fishmeal<br />
in feed<br />
Requirement<br />
<strong>of</strong> fishmeal<br />
(million tonnes)<br />
Carnivorous 1.16 1.5 1.74 40 0.70<br />
Omnivorous 6.81 1.5 10.22 25 2.56<br />
Herbivorous 3.17 1.5 4.76 8 0.38<br />
Total 11.14 16.7 3.64<br />
TABLE 44<br />
Predicted production <strong>and</strong> feed requirement<br />
<strong>of</strong> major aquaculture species by 2015 (million<br />
tonnes)<br />
Species 2004 2015 FCR<br />
Feed requirement<br />
by 2015<br />
Freshwater<br />
aquaculture<br />
18.92 20.0 1.5 30.0<br />
Mariculture 13.17 16.0 1.5 24.0<br />
Total 32.09 36.0 54.0<br />
Source: National Feed Industry Office, MOA, Beijing<br />
(pers. comm.)<br />
TABLE 45<br />
Projected potential annual dem<strong>and</strong> <strong>of</strong> feed resources <strong>for</strong> animal<br />
<strong>feeds</strong> including aqua<strong>feeds</strong> by 2015<br />
2015<br />
Source<br />
Requirement<br />
(million tonnes)<br />
Cereals/energy<br />
sources<br />
Available resources<br />
(million tonnes)<br />
6.2 Fertilizer requirement<br />
The role <strong>of</strong> <strong>fertilizers</strong> in pond culture has become less important than be<strong>for</strong>e, especially<br />
during growout. Fertilizers are still needed in extensive <strong>and</strong> semi-intensive ponds<br />
where natural food is required. It is predicted that the total pond surface area will<br />
remain relatively constant over the next 10 years <strong>and</strong> because fertilizer requirements<br />
Dem<strong>and</strong> shortfalls<br />
(million tonnes)<br />
320.5 277.3 43.2<br />
Protein sources 50.0 24.8 25.2<br />
Source: National Feed Industry Office, MOA, Beijing (pers. comm.)
184<br />
<strong>Study</strong> <strong>and</strong> <strong>analysis</strong> <strong>of</strong> <strong>feeds</strong> <strong>and</strong> <strong>fertilizers</strong> <strong>for</strong> <strong>sustainable</strong> aquaculture development<br />
are calculated on the basis <strong>of</strong> surface area it is predicted that adequate quantities <strong>of</strong><br />
organic <strong>and</strong> inorganic <strong>fertilizers</strong> will be available <strong>for</strong> the <strong>for</strong>eseeable future.<br />
7. RECOMMENDATIONS FOR IMPROVED UTILIZATION OF FERTILIZERS AND<br />
FEED RESOURCES<br />
Aquaculture has many advantages over other animal production sectors, such as<br />
high food conversion efficiencies, low surface area requirements <strong>and</strong> relatively high<br />
economic returns. Aqua<strong>feeds</strong>, in particular as well as <strong>fertilizers</strong> are among the most<br />
important limiting factors that will affect the expansion <strong>and</strong> <strong>sustainable</strong> development <strong>of</strong><br />
the industry in the future. Greater efficiency in the use <strong>of</strong> feed <strong>and</strong> fertilizer resources<br />
is there<strong>for</strong>e required. The industry already faces several problems <strong>and</strong> constraints <strong>and</strong><br />
others will emerge with time. Based on the preceding review, it is recommended that the<br />
following strategies <strong>and</strong> policy guidelines be implemented to address the challenges.<br />
7.1 Development <strong>of</strong> new feed ingredient resources<br />
China is a country with a huge population <strong>and</strong> relatively limited l<strong>and</strong> resources.<br />
Competition <strong>for</strong> feed ingredients (especially <strong>for</strong> fishmeal <strong>and</strong> grains) will no doubt<br />
increase in the <strong>for</strong>eseeable future. There<strong>for</strong>e, it is very important to develop new<br />
resources <strong>for</strong> aqua<strong>feeds</strong>.<br />
In addition to commonly used feed ingredients such as maize, barley, soybean<br />
<strong>and</strong> groundnut cake, China currently produces over 50 million tonnes <strong>of</strong> rice bran<br />
<strong>and</strong> wheat bran, over 20 million tonnes <strong>of</strong> residues from distiller <strong>and</strong> brewery waste<br />
<strong>and</strong> over 30 million tonnes <strong>of</strong> potato, sweet potato <strong>and</strong> cassava. With appropriate<br />
technologies the use <strong>of</strong> high quality feed ingredients such as grains <strong>and</strong> oilseed cakes<br />
can be significantly improved. The utilization <strong>of</strong> plant proteins by aquatic animals is<br />
still inefficient, e.g. only 50 <strong>and</strong> 70 percent <strong>of</strong> the proteins in rapeseed <strong>and</strong> soybean<br />
cake are utilized. By improving the protein utilization <strong>of</strong> these ingredients by 20–30<br />
percent would, <strong>for</strong> example, provide an additional supply <strong>of</strong> 1 million tonnes <strong>of</strong> high<br />
value ingredients.<br />
In addition, by changing agricultural systems, special feed ingredient crops should<br />
be cultivated increase production within the existing constraint <strong>of</strong> available farm l<strong>and</strong>.<br />
For example, growing green fodder on pond dykes <strong>and</strong> other scattered <strong>and</strong> unused l<strong>and</strong><br />
areas within farm boundaries can replace commercial <strong>feeds</strong> <strong>for</strong> herbivorous species.<br />
7.2 Promote fish farming systems <strong>and</strong> practices that increase the efficient<br />
use <strong>of</strong> <strong>feeds</strong> <strong>and</strong> <strong>fertilizers</strong><br />
The Chinese aquaculture sector is characterised by highly diversified culture systems<br />
<strong>and</strong> practices. There is a growing tendency <strong>for</strong> farmers to ab<strong>and</strong>on traditional <strong>and</strong><br />
highly efficient aquaculture systems <strong>and</strong> practices in favour <strong>of</strong> simpler feed based<br />
systems with higher production levels. This is especially the case in relatively well<br />
developed areas where the use <strong>of</strong> <strong>fertilizers</strong> <strong>and</strong> locally available resources is decreasing<br />
<strong>and</strong> the use <strong>of</strong> commercial <strong>feeds</strong> is increasing. Farmers are not always aware <strong>of</strong> the fact<br />
that these changes have, in many instances, led to reduced feed efficiency <strong>and</strong> increased<br />
production costs. A typical example is that the FCR in super intensive shrimp farming<br />
systems is usually 20 <strong>and</strong> 10 percent higher than under semi-intensive <strong>and</strong> intensive<br />
farming conditions, respectively.<br />
The adoption <strong>of</strong> aquaculture systems <strong>and</strong> practices with optimum feed <strong>and</strong> fertilizer<br />
utilization efficiency is a strategy that should be vigorously promoted. Practices that<br />
should be promoted include semi-intensive, pond based multi-species polyculture,<br />
integrated aquaculture in paddy fields, integrated fish farming (fish-crop-animal) <strong>and</strong><br />
semi-intensive polyculture <strong>of</strong> shrimp, finfish, seaweed <strong>and</strong> molluscs in brackish-water<br />
ponds. Where monoculture is undertaken, farmers should be encouraged to use semiintensive<br />
instead <strong>of</strong> intensive or super-intensive practices.
Analysis <strong>of</strong> <strong>feeds</strong> <strong>and</strong> <strong>fertilizers</strong> <strong>for</strong> <strong>sustainable</strong> aquaculture development in China 185<br />
7.3 Promoting improved management practices<br />
Improving the culture environment can play a significant role in improving feed<br />
utilization. For example, the FCR <strong>of</strong> grass carp under pond culture conditions at<br />
optimum temperatures increases 1.34 fold at DO levels below 3.4 mg/l compared<br />
with DO above 3.5 mg/l <strong>and</strong> feed intake is reduced by 35 percent compared with DO<br />
levels above 7 mg/l (source: http://www.china-fisheries.com/zhuanlan/displaytech.<br />
asp?sort=feed&id=3313, 2004).<br />
Some new approaches have recently been adopted, such as the use <strong>of</strong> beneficial microorganisms<br />
<strong>and</strong> aerators. However, some traditional <strong>and</strong> very effective methods, such<br />
as pond draining, sun-drying <strong>of</strong> the substratum, removal <strong>of</strong> excessive silt <strong>and</strong> clearing<br />
be<strong>for</strong>e restocking have been ab<strong>and</strong>oned by many farmers due to various reasons. It is<br />
very important to encourage farmers to retain traditional pond management techniques<br />
to maintain good culture environments, especially with respect to the improvement <strong>of</strong><br />
pond bottom conditions. In addition, other modern techniques <strong>and</strong> equipment should<br />
be more efficiently used to maintain water quality above certain st<strong>and</strong>ard thresholds.<br />
For example, aerators should not only be used in emergencies when DO levels<br />
are critically low but should be used to improve oxygen distribution when surface<br />
oxygen levels are high. The relatively higher cost <strong>of</strong> power is compensated <strong>for</strong> by the<br />
comprehensive benefits generated by improved feed utilization.<br />
An approach that is currently receiving attention is the biological treatment <strong>of</strong><br />
intensive aquaculture effluents that will enable water re-use. This may have significant<br />
future implications.<br />
7.4 Strengthen scientific research <strong>and</strong> technology development<br />
By improving feed manufacturing technologies <strong>and</strong> feed application techniques, it is<br />
possible to maximise the utilization <strong>of</strong> available feed resources. The following research<br />
<strong>and</strong> development priorities have been identified.<br />
Comprehensive nutrition research<br />
The industrial aquafeed industry in China is relatively new <strong>and</strong> is a sector that has to<br />
provide appropriate products <strong>for</strong> a hugely diverse <strong>and</strong> rapidly growing production<br />
sector. The absence <strong>of</strong> detailed research on the nutritional requirements <strong>of</strong> culture<br />
species imposes enormous challenges on the industry. Research is required on the<br />
nutritional requirements <strong>of</strong> cultured species at different stages <strong>of</strong> ontogeny <strong>and</strong> under<br />
different environmental <strong>and</strong> culture systems <strong>and</strong> practices. In particular, it is important<br />
to underst<strong>and</strong> the utilization efficiency <strong>of</strong> different ingredients at different life history<br />
stages <strong>of</strong> the species, such that the most appropriate <strong>feeds</strong> can be <strong>for</strong>mulated. Moreover,<br />
there is a need to better underst<strong>and</strong> the feeding behaviour <strong>of</strong> fish <strong>and</strong> shrimp species<br />
under different culture practices <strong>and</strong> systems <strong>and</strong> ontogenetic stages.<br />
Development <strong>and</strong> adoption <strong>of</strong> technology to improve the utilization <strong>of</strong> different feed<br />
ingredients<br />
Feed manufacturing technologies have to be developed to improve nutrient utilization<br />
<strong>of</strong> different feed ingredients. Advanced processing technologies can significantly<br />
improve the acceptability <strong>and</strong> digestibility <strong>of</strong> <strong>feeds</strong> by altering the internal structure<br />
<strong>and</strong> providing appropriate physical features to the feed. These need to be developed.<br />
Research on feed additives to improve feed utilization must also be promoted. In<br />
particular this research should focus on enzymes, essential amino acid, fatty acids,<br />
vitamins, minerals, immuno-stimulants <strong>and</strong> growth enhancing agents.<br />
Although feed manufacturers produce over 100 different types <strong>of</strong> <strong>feeds</strong> <strong>for</strong><br />
cultured species at different culture stages, the <strong>for</strong>mulations are based on limited<br />
scientific research. In most instances the available <strong>feeds</strong> are simple adaptations <strong>of</strong> the<br />
<strong>for</strong>mulations <strong>for</strong> similar species with minor modifications. Hence, more resources
186<br />
<strong>Study</strong> <strong>and</strong> <strong>analysis</strong> <strong>of</strong> <strong>feeds</strong> <strong>and</strong> <strong>fertilizers</strong> <strong>for</strong> <strong>sustainable</strong> aquaculture development<br />
should be invested by both the public <strong>and</strong> the private sector to strengthen the scientific<br />
basis <strong>of</strong> feed <strong>for</strong>mulation <strong>and</strong> to develop new <strong>and</strong> innovative ingredient processing<br />
technologies<br />
7.5 Improve on-farm feed application technologies<br />
When aqua<strong>feeds</strong> are applied under certain conditions, the utilization <strong>of</strong> the feed is<br />
highly dependent on the application schedules <strong>and</strong> methods. While less wasteful<br />
feeding methods have been adopted by farmers in recent years, their feeding schedules<br />
are largely based on tradition <strong>and</strong> lack a scientific basis. Hence feeding rates,<br />
frequencies <strong>and</strong> feeding times vary greatly among <strong>and</strong> between farms <strong>and</strong> is manifest<br />
in highly variable production levels. There is a very real need to establish st<strong>and</strong>ard<br />
feeding schedules <strong>for</strong> various species at various life history stages under specific culture<br />
practices <strong>and</strong> environmental conditions.<br />
ACKNOWLEDGEMENTS<br />
The authors wish to thank the Aquaculture Management <strong>and</strong> Conservation Service<br />
(FIMA) <strong>of</strong> the Food <strong>and</strong> Agricultural Organization <strong>of</strong> the United Nations <strong>for</strong> including<br />
China in this global review on the use <strong>of</strong> aqua<strong>feeds</strong> <strong>and</strong> <strong>fertilizers</strong>. In particular, we<br />
thank Dr Mohammad R. Hasan <strong>of</strong> FIMA who coordinated the study. The completion<br />
<strong>of</strong> the review greatly benefited from his valuable advice on the conduction the study,<br />
preparation <strong>of</strong> the review <strong>and</strong> suggestions <strong>for</strong> the revision <strong>of</strong> the review. We also<br />
sincerely acknowledge Mr Bao Jianping, Mr You Yang, Mr He Yijin <strong>and</strong> Mr Zhujian,<br />
who either assisted in the arrangement <strong>of</strong> field interviews or collected data. We also<br />
extend our sincere gratitude to the resource persons who were interviewed <strong>and</strong> who<br />
provided most valuable inputs to the review.<br />
REFERENCES<br />
BOF. 2005. 2004. China Fisheries Statistic Yearbook. Bureau <strong>of</strong> Fisheries. Beijing, Ministry<br />
<strong>of</strong> Agriculture. 122 pp.<br />
Chang, Q., Liang, M., Wang, J. & Zhai, Y. 2004. Available amino acid <strong>and</strong> phosphorus<br />
<strong>of</strong> various feed ingredients <strong>for</strong> Japanese sea bass (Lateolabrax sp). Marine Fisheries<br />
Research, 2(25): 35–40.<br />
Chang, Q., Liang, M., Wang, J., & Zhai, Y. 2005. Apparent digestibility coefficients<br />
<strong>of</strong> various feed ingredients <strong>for</strong> Japanese sea bass (Lateolabrax Japonicus). Acta<br />
Hydrobiological Sinica, 2(29): 172–175.<br />
China Fisheries Yearbook. 2001. China Fisheries Yearbook, Vol. 8. Beijing, Chinese<br />
Aquaculture Publishing Company. pp. 243–247.<br />
Duan, Q., Mai, K., Zhong, H., Si, L., Wang, X. 2001. Studies on the nutrition <strong>of</strong> the large<br />
yellow croaker, Pseudosciaena crocea R. I: growth response to graded levels <strong>of</strong> dietary<br />
protein <strong>and</strong> lipid. Aquaculture Research, 32 (Suppl., 1): 46–52.<br />
FAO. 2006. FAO Fisheries Department, Fishery In<strong>for</strong>mation, Data <strong>and</strong> Statistics Unit.<br />
Fishstat Plus: Universal s<strong>of</strong>tware <strong>for</strong> fishery statistical time series. Aquaculture<br />
production: quantities 1950-2004, Aquaculture production: values 1984-2004;<br />
Capture production: 1950-2004; Commodities production <strong>and</strong> trade: 1950-2004; Total<br />
production: 1970-2004, Vers. 2.30 (available at: http://www.fao.org/fi/statist/FISOFT/<br />
FISHPLUS.asp).<br />
Fred, H. 2001. Feeding tilapia <strong>for</strong> sweet-tasting flesh <strong>and</strong> ready marketability. International<br />
Aqua Feed, 4(4): 12–19.<br />
Lei, J. 2005. Marine fish culture theory <strong>and</strong> techniques. Beijing, China Agriculture Press,<br />
pp. 463–465.<br />
Lei, W., Yang, Y. & He, X. 1996. Apparent digestibility coefficient <strong>of</strong> crude protein<br />
<strong>and</strong> energy <strong>for</strong> six commercial feed ingredients <strong>for</strong> Chinese long-snout catfish. Acta<br />
Hydrobiological Sinica, 2(20): 113–118.
Analysis <strong>of</strong> <strong>feeds</strong> <strong>and</strong> <strong>fertilizers</strong> <strong>for</strong> <strong>sustainable</strong> aquaculture development in China 187<br />
Li, A., Song, X. & Lou, W. 1986. Effect <strong>of</strong> different protein level in feed <strong>of</strong> growth <strong>of</strong> fleshy<br />
prawn Fenneropenaeus chinensis. Qilu Fisheries, 3: 19–23<br />
Li, A. 1990. Research progress on nutritional physiology <strong>of</strong> flesh prawn Fenneropenaeus<br />
chinensis. Feed Industry, 6: 25–29.<br />
Li, A. (ed). 1996. Nutrition <strong>and</strong> feed <strong>of</strong> aquatic animals. China Agricultural Press, Beijing.<br />
Lin, S., Luo, l. & Ye, Y. 2001. Apparent digestibility <strong>of</strong> crude proteins <strong>and</strong> crude fats in 17<br />
feed ingredients in grass carp. Journal <strong>of</strong> Fishery Sciences <strong>of</strong> China, 3(8): 59–64.<br />
Liu, Y., Zhu, Y. & Chen, H. 1990. Digestibility <strong>of</strong> black carp to fourteen fish <strong>feeds</strong>. Fishery<br />
In<strong>for</strong>mation, 6: 166–169.<br />
Liu, L., Zheng, S., Zhao, B. 2004. Effects <strong>of</strong> different levels <strong>of</strong> squid viscera meal in<br />
practical <strong>feeds</strong> on growth per<strong>for</strong>mance <strong>of</strong> shrimp Litopenaeus vannamei. A Collection <strong>of</strong><br />
the 3rd China Symposium on Aqua-animal Nutrition <strong>and</strong> Feed. pp. 98–105.<br />
MOA. 1984. China Agricultural Year Book. Beijing, China Agricultural Press. 490 pp.<br />
MOA. 1994. China Agricultural Year Book. Beijing, China Agricultural Press. 513 pp.<br />
MOA. 2004. Analysis on situation <strong>and</strong> prospect <strong>of</strong> feed market in China in the 1 st half <strong>of</strong><br />
2004 (available at http://www.agri.gov.cn/xxfb/t20040812_231786.htm).<br />
MOA. 2004. China Agricultural Year Book. Beijing, China Agricultural Press. 508 pp.<br />
MOA.2002. A collection <strong>of</strong> st<strong>and</strong>ard in feed industry. Beijing, China St<strong>and</strong>ard Press. 387<br />
pp.<br />
Rong, C., Liang, S. & Yue, B. 1994. Protein <strong>and</strong> amino acid digestibility <strong>of</strong> sixteen feed<br />
ingredients <strong>for</strong> Penaeus orientalis. Journal <strong>of</strong> Fisheries <strong>of</strong> China, 2(18): 132–137<br />
Wang, Q. & Wang, M. 2001. Feeds <strong>and</strong> feeding <strong>of</strong> Chinese shrimp. International Aqua<br />
Feed, 2(4): 11–14.<br />
Wu, J., Yong, W., You, W., Wen, H. & Liao Z. 2000. Nutritional value <strong>of</strong> proteins in 13 feed<br />
ingredients <strong>for</strong> Oreochromis niloticus. Journal <strong>of</strong> Fishery Sciences <strong>of</strong> China, 2(7): 37–42.<br />
Wu, J., Yong, W., You, W., Wen, H. & Liao, Z. 1995. Apparent digestibility <strong>and</strong> digestible<br />
energy <strong>of</strong> 12 <strong>feeds</strong>tuffs <strong>for</strong> bluntnose black bream (Megalobrama amblycephala Yih).<br />
Journal <strong>of</strong> Fishery Sciences <strong>of</strong> China, 3(2): 55–62.<br />
Ye, Y., Lin, S. & Luo, L. 2003. Apparent digestibility coefficient <strong>of</strong> 27 feed ingredients <strong>for</strong><br />
grass carp. Journal <strong>of</strong> Fishery Sciences <strong>of</strong> China, 1: 60–64.<br />
You, W., Yong, W., Wu, D., Wu, J., Liao, Z. & Wen, H. 1993. Evaluation <strong>of</strong> nutritive value<br />
<strong>of</strong> 11 feed ingredients <strong>for</strong> black carp (Mylopharyngodon piceus). Freshwater Fishery, 23:<br />
8–12.
188<br />
APPENDIX<br />
<strong>Study</strong> <strong>and</strong> <strong>analysis</strong> <strong>of</strong> <strong>feeds</strong> <strong>and</strong> <strong>fertilizers</strong> <strong>for</strong> <strong>sustainable</strong> aquaculture development<br />
Appendix A. Aquaculture species in China<br />
A.1. List <strong>of</strong> major aquaculture species in China<br />
Common name Scientific name<br />
Amberjacks Seriola spp<br />
Bighead carp Aristichthys nobilis<br />
Black carp Mylopharyngodon piceus<br />
Black tiger shrimp Penaeus monodon<br />
Catfish Clarias leather<br />
Channel catfish Ictalurus punctatus<br />
Chinese long-snout catfish Leiocassis longirostris<br />
Chinese river crab/Chinese mitten-h<strong>and</strong>ed crab Eriocheir sinensis<br />
Cobia Rachycentron canadum<br />
Common carp Cyprinus carpio<br />
Crucian carp Carassius carassius<br />
Estuarine tapertail anchovy Coilia ectenes<br />
Fleshy prawn Penaeus chinensis<br />
Giant freshwater prawn/giant river prawn Macrobrachium rosenbergii<br />
Goldfish Carassius auratus auratus<br />
Grass carp/white amur Ctenopharyngodon idella<br />
Grouper Epinephelus spp.<br />
Japanese eel Anguilla japonica<br />
Japanese shrimp/kuruma prawn Penaeus japonicus<br />
Large yellow croaker Pseudosciaena crocea<br />
Largemouth bass Micropterus salmoides<br />
M<strong>and</strong>arin fish/Chinese perch Siniperca chuatsi<br />
Mozambique tilapia Oreochromis mossambicus<br />
Mud crab Scylla serrata<br />
Nile tilapia Oreochromis niloticus<br />
North African catfish Clarias gariepinus<br />
Olive flounder Paralichthys oliuaceus<br />
Oriental river prawn Macrobrachium nipponense<br />
Pacific white shrimp/white-leg shrimp Litopenaeus vannamei<br />
Polack/pollack bone frame Pollachius pollachius<br />
Puffer fish Fugu spp<br />
Red drum Sciaenops ocellatus<br />
Red sea bream/sea bream Pagrus major<br />
Seabass/Japanese seaperch/perch Lateolabrax japonicus<br />
Silver carp Hypophthalmichthys molitrix<br />
Snakehead Ophicephalus argus, Channa spp.<br />
S<strong>of</strong>t-shell turtle Trionyx sinensis<br />
Swamp eel/mud eel Monopterus albus<br />
Swimming crab/gazami crab Portunus trituberculatus<br />
Turbot Psetta maxima<br />
Walking catfish Clarias batrachus<br />
Wuchang bream/white amur bream/bluntnose<br />
black bream<br />
Megalobrama amblycephala
Analysis <strong>of</strong> <strong>feeds</strong> <strong>and</strong> <strong>fertilizers</strong> <strong>for</strong> <strong>sustainable</strong> aquaculture development in China 189<br />
Appendix B. Nutrient requirements <strong>of</strong> selcted aquaculture species<br />
B.1. Dietary essential amino acid requirements <strong>of</strong><br />
fleshy prawn <strong>and</strong> red sea bream (g/kg diet)<br />
EAA Fleshy prawn Red sea bream<br />
Methionine 12.4 5.3<br />
Threonine 17.8 4.1<br />
Valine 21.4 8.0<br />
Isoleucine 17.6 2.0<br />
Leucine 29.3 10.5<br />
Phenylalanine 14.7 33.7<br />
Lysine 31.0 23.9<br />
Tryptophan 3.2 -<br />
Histidine 8.6 4.0<br />
Arginine 40.0 4.7<br />
Source: Wang <strong>and</strong> Wang (2001) <strong>for</strong> fleshy prawn <strong>and</strong> Lei<br />
(2005) <strong>for</strong> red sea bream<br />
B.2. Dietary vitamin <strong>and</strong> trace mineral requirement <strong>for</strong> fleshy prawn P. chinensis (mg/kg <strong>of</strong> diet,<br />
unless otherwise specified)<br />
Vitamin Requirement<br />
A 12 000-18 000 IU<br />
D 6000 IU<br />
E 36–44<br />
K 3.2–3.6<br />
B1 (Thiamine) 6<br />
B2 (Rib<strong>of</strong>lavin) 10-20<br />
B3 (Nicotinic acid) 40<br />
B5 (Calcium pantothenate) 10<br />
B6 (Pyridoxine) 14<br />
B7 (Biotin) 0.08<br />
B9 (Folic acid/pteroylglutamic acid) 0.5<br />
B12 (Cyanocobalamin) 0.001–0.002<br />
C (LAPP 15%) 400<br />
Inositol 400<br />
Choline chloride<br />
Trace mineral<br />
400<br />
Selenium 20<br />
Copper 30<br />
Cobalt 30<br />
Zinc 100–200<br />
Iodine 30<br />
Manganese 60–80<br />
Source: Wang <strong>and</strong> Wang (2001)
190<br />
<strong>Study</strong> <strong>and</strong> <strong>analysis</strong> <strong>of</strong> <strong>feeds</strong> <strong>and</strong> <strong>fertilizers</strong> <strong>for</strong> <strong>sustainable</strong> aquaculture development<br />
B.3. Dietary vitamin <strong>and</strong> mineral requirements <strong>of</strong> Nile tilapia (mg per kg diet unless otherwise<br />
specified)<br />
Vitamin Amount<br />
B2 (Rib<strong>of</strong>lavin) 5–6<br />
B3 (Niacin) 6–10<br />
B12 (Cyanocobalamin) NR<br />
C 40–125<br />
D 375 IU<br />
E 25–100<br />
Choline<br />
Mineral<br />
NR<br />
Calcium 0.7%<br />
Manganese 2.5<br />
Phosphorus 0.45–0.9%<br />
Zinc 20–30<br />
NR = no requirement established.<br />
Source: Fred (2001)
Analysis <strong>of</strong> <strong>feeds</strong> <strong>and</strong> <strong>fertilizers</strong><br />
<strong>for</strong> <strong>sustainable</strong> aquaculture<br />
development in India<br />
S. Ayyappan<br />
Indian Council <strong>of</strong> Agricultural Research<br />
Krishi Anusndhan Bhavan, Pusa, New Delhi 110 012<br />
India<br />
S. Ahamad Ali<br />
Central Institute <strong>of</strong> Brackishwater Aquaculture<br />
75, Santhome High Road, RA Puarm, Chennai 600 028<br />
India<br />
Summary 192<br />
1. General overview <strong>of</strong> aquaculture practices <strong>and</strong> farming systems 194<br />
2. Review <strong>and</strong> <strong>analysis</strong> <strong>of</strong> aquaculture <strong>feeds</strong> <strong>and</strong> feed ingredients 198<br />
3. On-farm feed management strategies 206<br />
4. Problems <strong>and</strong> constraints <strong>of</strong> aquaculture <strong>feeds</strong> <strong>and</strong> feeding 211<br />
5. Resource availability <strong>and</strong> expansion <strong>of</strong> the aquaculture industry 212<br />
6. Recommendations <strong>for</strong> improved utilization <strong>of</strong> fertilizer <strong>and</strong> feed<br />
resources <strong>and</strong> suggested policy guidelines 214<br />
Acknowledgements 215<br />
References 215<br />
Appendix 219<br />
Ayyappan, S. <strong>and</strong> Ahmad Ali, S. 2007. Analysis <strong>of</strong> <strong>feeds</strong> <strong>and</strong> <strong>fertilizers</strong> <strong>for</strong> <strong>sustainable</strong><br />
aquaculture development in India. In M.R. Hasan, T. Hecht, S.S. De Silva <strong>and</strong> A.G.J.<br />
Tacon (eds). <strong>Study</strong> <strong>and</strong> <strong>analysis</strong> <strong>of</strong> <strong>feeds</strong> <strong>and</strong> <strong>fertilizers</strong> <strong>for</strong> <strong>sustainable</strong> aquaculture<br />
development. FAO Fisheries Technical Paper. No. 497. Rome, FAO. pp. 191–219.<br />
191
192<br />
<strong>Study</strong> <strong>and</strong> <strong>analysis</strong> <strong>of</strong> <strong>feeds</strong> <strong>and</strong> <strong>fertilizers</strong> <strong>for</strong> <strong>sustainable</strong> aquaculture development<br />
SUMMARY<br />
Fisheries <strong>and</strong> aquaculture contribute significantly towards the Indian agricultural<br />
economy. Total fisheries production during 2003–04 was 6.4 million to which aquaculture<br />
contributed about 2.37 million tonnes. The share <strong>of</strong> fisheries in the national GDP is 1.4<br />
percent <strong>and</strong> in the agricultural GDP its share is 4.5 percent. Aquaculture has been growing<br />
rapidly over the last two decades, contributing 37–38 percent <strong>of</strong> total fish production.<br />
India has substantial aquatic resources to diversify <strong>and</strong> exp<strong>and</strong> its aquaculture sector.<br />
The major species groups that are farmed in India are fresh water fishes, freshwater<br />
prawns, penaeid shrimps, mud crabs <strong>and</strong> brackish-water fishes. Aquaculture is practised<br />
in a variety <strong>of</strong> agro-climatic zones ranging from tropical to temperate areas. Freshwater<br />
aquaculture is the largest contributor to aquaculture production <strong>and</strong> has grown at an<br />
average rate <strong>of</strong> 6.6 percent per annum. The most important species are the Indian major<br />
carps (Catla catla, Labeo rohita, Cirrhinus cirrhosus), common carp (Cyprinus carpio),<br />
grass carp (Ctenopharyngodon idella), silver carp (Hypophthalmichthys molitrix),<br />
<strong>and</strong> giant freshwater prawn (Macrobrachium rosenbergii). Fish species such as snake<br />
heads (e.g. snakehead murrel Channa striata) <strong>and</strong> catfishes (e.g. walking catfish Clarias<br />
batrachus, North African catfish C. gariepinus, stinging catfish Heteropneustes fossilis,<br />
sutchi catfish Pangasius hypophthalmus) are farmed, but to a lesser extent. Cold-water<br />
fish such as trout (rainbow trout Oncorhynchus mykiss, brown trout Salmo trutta fario,<br />
snow trout Schizothorax richardsonii) <strong>and</strong> golden mahseer (Tor putitora) are cultured in<br />
the upl<strong>and</strong>s <strong>of</strong> northern India, mainly <strong>for</strong> sport fisheries. Freshwater fishes are cultured<br />
<strong>and</strong> produced in diverse farming systems (extensive to intensive) <strong>and</strong> farming practices<br />
are tailored to match the availability <strong>of</strong> inputs <strong>and</strong> the investment capabilities <strong>of</strong> the<br />
farmers.<br />
Brackish-water aquaculture in India is synonymous with penaeid shrimp aquaculture.<br />
Because <strong>of</strong> its rapid growth rate <strong>and</strong> better market price, black tiger shrimp (Penaeus<br />
monodon) is the most important penaeid aquaculture species. Indian white shrimp<br />
(Fenneropenaeus indicus) is another important species <strong>and</strong> farmers have begun to show<br />
interest in Pacific white shrimp (Litopenaeus vannamei), though the culture <strong>of</strong> this<br />
species is currently not permitted. Species like P. semisulcatus, Marsupenaeus japonicus<br />
<strong>and</strong> P. merguiensis are available as alternatives, but have not become very popular.<br />
Extensive shrimp culture has been practised in India <strong>for</strong> over 100 years. Traditional<br />
shrimp aquaculture is based on wild juveniles that are trapped in ponds. Because <strong>of</strong> the<br />
dem<strong>and</strong> <strong>for</strong> shrimp, farmers have changed their farming approach. Small <strong>and</strong> marginal<br />
farmers use improved extensive <strong>and</strong> semi-intensive systems, while large farmers <strong>and</strong><br />
corporate companies practise semi-intensive <strong>and</strong> intensive shrimp culture. The total<br />
area under shrimp culture is around 150 000 ha <strong>and</strong> shrimp production has grown at<br />
an average <strong>of</strong> seven percent per annum during the last 15 years. Except <strong>for</strong> traditional<br />
farming systems, shrimp farming is not permitted within the Coastal Regulation Zone.<br />
Shrimp farming in India is a regulated activity under the auspices <strong>of</strong> the Aquaculture<br />
Authority <strong>of</strong> India, which ensures that the development <strong>of</strong> the industry progresses in<br />
an environmentally <strong>sustainable</strong> manner. Low-density shrimp culture with a stocking<br />
density <strong>of</strong> 6 PL/m 2 <strong>and</strong> production targets <strong>of</strong> 1 000–1 500 kg/ha/crop is advocated to<br />
achieve the goals <strong>of</strong> <strong>sustainable</strong> shrimp culture. The mud crabs Scylla tranquebarica <strong>and</strong><br />
S. serrata are the most popular brackish-water crab species cultured in India.<br />
Asian seabass/barramundi (Lates calcarifer), grey mullets (Mugil spp.), milkfish<br />
(Chanos chanos) <strong>and</strong> pearlspot (Etroplus suratensis) are the important brackish-water<br />
finfish species farmed in India. Seed <strong>of</strong> all species is collected from the wild <strong>and</strong> this limits<br />
the growth <strong>of</strong> brackish-water fish farming. Recent advances in seabass propagation are<br />
likely to stimulate the growth <strong>of</strong> this sub-sector.<br />
Nutrients from <strong>fertilizers</strong> (organic <strong>and</strong> inorganic) <strong>and</strong> <strong>feeds</strong> are used in Indian<br />
aquaculture. While <strong>fertilizers</strong> are used mainly <strong>for</strong> initiating <strong>and</strong> maintaining natural<br />
productivity, <strong>feeds</strong> are used only under semi- <strong>and</strong> intensive culture conditions. Poultry
Analysis <strong>of</strong> <strong>feeds</strong> <strong>and</strong> <strong>fertilizers</strong> <strong>for</strong> <strong>sustainable</strong> aquaculture development in India 193<br />
manure is rapidly becoming the fertilizer <strong>of</strong> choice. Of the total N <strong>and</strong> P <strong>fertilizers</strong><br />
produced in the country, aquaculture uses only about 0.53 <strong>and</strong> 4.27 percent <strong>of</strong> nitrogen<br />
<strong>and</strong> phosphorus <strong>fertilizers</strong>, respectively.<br />
Fishmeal production in India is split into the production <strong>of</strong> sterile fishmeal (crude<br />
protein 55–60 percent) <strong>and</strong> a lower quality fishmeal, which is made from sun dried trash<br />
fish. The quantity <strong>of</strong> sterile fishmeal produced in the country is only about 5 000–6 000<br />
tonnes while 176 400 tonnes <strong>of</strong> dried trash fish is available <strong>for</strong> the production <strong>of</strong> lower<br />
grade fishmeal. Besides this, mantis shrimp (57 940 tonnes), shrimp head (31 235 tonnes)<br />
<strong>and</strong> sergisted shrimp (48 000 tonnes) are available <strong>for</strong> inclusion into aqua<strong>feeds</strong>. Among<br />
the plant protein resources, approximately 5.0–5.5 million tonnes <strong>of</strong> soybean meal is<br />
available per annum. Groundnut cake is generally accessible <strong>and</strong> readily available. Other<br />
important plant ingredients that are available <strong>for</strong> aqua<strong>feeds</strong> are cottonseed meal, coconut<br />
cake, sesame cake, mustard cake, rape seed cake <strong>and</strong> sunflower cake meal. Cereals such<br />
as wheat, rice, maize, sorghum <strong>and</strong> other millets are cultivated in the country. Cassava is<br />
also cultivated in some parts <strong>of</strong> the country. Rice bran <strong>and</strong> wheat bran are conventionally<br />
used in aqua<strong>feeds</strong>. Non-conventional aquafeed ingredients such as blood meal, meat meal,<br />
bone meal <strong>and</strong> poultry feather meal <strong>and</strong> silkworm pupae are also available. Vegetable oils<br />
such as groundnut oil, coconut oil, sunflower oil, sesame oil, mustard oil, soybean oil,<br />
soy lecithin, palm oil <strong>and</strong>, <strong>of</strong> late, rice bran oil are produced in the country. Fish oil is also<br />
produced, but on a very limited scale.<br />
The farm-gate price <strong>of</strong> fish determines the choice <strong>of</strong> culture system, <strong>feeds</strong> <strong>and</strong> feed<br />
management practices. For carps, farmers use the mixture <strong>of</strong> rice bran <strong>and</strong>/or wheat bran<br />
<strong>and</strong> oilseed cake feed along with natural plankton production through periodic organic<br />
<strong>and</strong> inorganic fertilization. Shrimp farmers use a variety <strong>of</strong> <strong>feeds</strong> <strong>and</strong> feeding practices,<br />
ranging from single item <strong>feeds</strong> to farm-made <strong>feeds</strong>, using three to four ingredients, to<br />
“made to order <strong>feeds</strong>” <strong>and</strong> industrially manufactured extruded shrimp <strong>feeds</strong>. The “made<br />
to order” <strong>feeds</strong> are manufactured by small-scale manufacturers who make the <strong>feeds</strong><br />
according to the customers’ requirements <strong>and</strong> choice <strong>of</strong> the ingredient. Shrimp feed<br />
production in the country has increased from 30 000 tonnes in 1990 to 193 500 tonnes<br />
in 2004.<br />
Aquaculture production is expected to reach 6.282 million tonnes by 2020. It has been<br />
calculated that the estimated fertilizer dem<strong>and</strong> <strong>for</strong> aquaculture can be met com<strong>for</strong>tably.<br />
The requirement <strong>for</strong> nitrogen <strong>and</strong> phosphorus <strong>fertilizers</strong> will be about 1.0 <strong>and</strong> 8.2 percent,<br />
respectively <strong>of</strong> their total production. The position with regard to the availability <strong>of</strong> rice<br />
bran, wheat bran <strong>and</strong> oil cakes is also more than adequate <strong>for</strong> the future expansion <strong>of</strong><br />
aquaculture.<br />
Shrimp production is projected to reach 236 000 tonnes by 2020. It has been shown<br />
that the industrial <strong>and</strong> small-scale feedmills will be able to supply the future feed dem<strong>and</strong>s,<br />
although fish oil may be in short supply. There is a need to explore the replacement <strong>of</strong><br />
fish oil with vegetable oils.<br />
Several priority issues have been identified that may require attention <strong>for</strong> aquaculture<br />
to develop on a <strong>sustainable</strong> basis. These include improved feed <strong>for</strong>mulation, the production<br />
<strong>of</strong> high quality, water stable <strong>feeds</strong> <strong>and</strong> improved methods <strong>of</strong> feed management. Such<br />
advances will ensure a reduced environmental impact <strong>of</strong> aquaculture <strong>and</strong> will contribute<br />
greatly towards satisfying consumer dem<strong>and</strong>s. Moreover, the promulgation <strong>of</strong> the<br />
Coastal Aquaculture Bill (2005) empowers government agencies to regulate <strong>and</strong> monitor<br />
<strong>for</strong> the <strong>sustainable</strong> development <strong>of</strong> the sector.
194<br />
<strong>Study</strong> <strong>and</strong> <strong>analysis</strong> <strong>of</strong> <strong>feeds</strong> <strong>and</strong> <strong>fertilizers</strong> <strong>for</strong> <strong>sustainable</strong> aquaculture development<br />
1. GENERAL OVERVIEW OF AQUACULTURE PRACTICES AND FARMING<br />
SYSTEMS<br />
India’s total fish production in 2004 amounted to 6.4 million tonnes, to which<br />
aquaculture contributed 2.37 million tonnes (37.0 percent). The fisheries sector (capture<br />
fisheries <strong>and</strong> aquaculture) contributes significantly to the Indian agricultural economy<br />
(Table 1). More than seven million fishers <strong>and</strong> fish farmers depend on fisheries <strong>and</strong><br />
aquaculture <strong>for</strong> their livelihood. It is estimated that a further six million people are<br />
engaged directly <strong>and</strong> indirectly in related industrial activities.<br />
Aquaculture has shown significant growth in the last two decades <strong>and</strong> has<br />
trans<strong>for</strong>med itself into an industry contributing substantially to food production,<br />
both in terms <strong>of</strong> quantity <strong>and</strong> value. Capture fisheries are stagnating. Fortunately<br />
aquaculture has been making increasing <strong>and</strong> significant contributions to the national<br />
fish supply. The country is endowed with substantial aquatic resources (Table 2) <strong>and</strong> a<br />
diverse fish fauna. Both freshwater as well as brackish-water aquaculture are practised<br />
in the country.<br />
TABLE 1<br />
Facts <strong>and</strong> figures about fisheries <strong>and</strong> aquaculture in India. In<strong>for</strong>mation refers to the period <strong>of</strong><br />
2003–04 except where otherwise indicated<br />
Parameter Value<br />
Total fish production (million tonnes) 6.40<br />
Inl<strong>and</strong> fish production (million tonnes) 3.46<br />
Marine fish production (million tonnes) 2.94<br />
Area under freshwater aquaculture (thous<strong>and</strong> ha) 600.00<br />
Area under freshwater prawn culture (thous<strong>and</strong> ha) 41.87<br />
Area under shrimp culture (thous<strong>and</strong> ha) 151.00<br />
Annual growth (%) rate <strong>of</strong> inl<strong>and</strong> fisheries (1991–2000) 6.60<br />
Annual growth (%) rate <strong>of</strong> marine fisheries (1991–2000) 2.20<br />
Share <strong>of</strong> aquaculture (%) in total fish production 37.00<br />
Share <strong>of</strong> fisheries in gross domestic product (GDP) (%) 1.40<br />
Share <strong>of</strong> fisheries in agriculture GDP (%) 4.50<br />
Total quantity <strong>of</strong> fish export (thous<strong>and</strong> tonnes) 461.33<br />
Export earnings <strong>of</strong> fisheries products (US$ billion) 1 1.48<br />
Share (%) <strong>of</strong> shrimp <strong>of</strong> total fisheries export 63.50<br />
Share (%) <strong>of</strong> fish <strong>of</strong> total fisheries export 34.62<br />
Source: Ayyappan <strong>and</strong> Biradar (2004); Agricultural Research Data Book (2004); MPEDA 2 (2004)<br />
TABLE 2<br />
The available aquatic resources <strong>for</strong> fresh <strong>and</strong> brackish-water<br />
aquaculture in India, 2003<br />
Name <strong>of</strong> water resource<br />
Area available<br />
(million hectares)<br />
1 US$1.00 = Rs 43.00 (Indian Rupee, INR) (May 2005)<br />
2 Marine Products Export Development Authority<br />
Area utilized <strong>for</strong><br />
aquaculture<br />
(%)<br />
Freshwater resources<br />
Ponds 2.25 11.0<br />
Natural depressions 1.30 10.0<br />
Reservoirs 3.00 9.0<br />
Brackish-water resources 1.24 12.0<br />
A wide range <strong>of</strong><br />
freshwater, brackishwater<br />
<strong>and</strong> marine aquatic<br />
organisms are cultured in<br />
India (Table 3). The major<br />
groups are freshwater<br />
fish <strong>and</strong> prawns, penaeid<br />
shrimps, crabs <strong>and</strong><br />
brackish-water fishes<br />
(Figure 1).
Analysis <strong>of</strong> <strong>feeds</strong> <strong>and</strong> <strong>fertilizers</strong> <strong>for</strong> <strong>sustainable</strong> aquaculture development in India 195<br />
1.1 Freshwater Aquaculture<br />
Freshwater aquaculture is the largest<br />
contributor to aquaculture production in<br />
the country. During the 1990s this sector<br />
grew at a rate <strong>of</strong> 6.6 percent per annum. The<br />
establishment <strong>of</strong> the Freshwater Fisheries<br />
Development Agency (FFDA), which<br />
operates at the state level, has helped to<br />
increase the total production as well as yield<br />
from 600 kg/ha/year in 1975 to 2 200 kg/<br />
ha/year in 2000 (Ayyappan <strong>and</strong> Biradar,<br />
2004). The most important species cultured<br />
are the Indian major carps, common carp,<br />
grass carp, silver carp <strong>and</strong> giant freshwater<br />
prawn. Air breathing fish such as clariid<br />
catfish are cultured to a lesser extent. Coldwater<br />
fish such as rainbow trout, snow trout<br />
<strong>and</strong> mahseer are cultured in the upl<strong>and</strong>s<br />
<strong>of</strong> northern India. The latter however is a<br />
small-scale activity that caters mainly <strong>for</strong> the<br />
needs <strong>of</strong> sport fishing.<br />
FIGURE 1<br />
Production <strong>of</strong> major species groups in India in 2004<br />
Source: FAO (2006)<br />
Freshwater fishes are produced in a variety <strong>of</strong> systems, each <strong>of</strong> which has developed<br />
in relation to the availability <strong>of</strong> inputs in the region <strong>and</strong> the investment capabilities<br />
<strong>of</strong> the farmers (Ayyappan, 1997). Culture systems mainly consist <strong>of</strong> polyculture <strong>of</strong><br />
Indian major carps (mixed farming) <strong>and</strong> the culture <strong>of</strong> exotic carps along with Indian<br />
major carps (composite fish culture). These combinations are practised under various<br />
conditions, including fertilizer <strong>and</strong> feed based systems, waste water based systems,<br />
biogas slurry systems, aquatic weed systems, agriculture/horticulture based systems<br />
<strong>and</strong> live-stock based systems, also known as integrated fish farming. Air breathing<br />
fishes are cultured either in mono or polyculture systems. Based on the criteria above,<br />
TABLE 3<br />
Major groups <strong>of</strong> fish <strong>and</strong> shellfish cultured in India during 2003<br />
Group/sector Species<br />
Annual production<br />
(million tonnes)<br />
Domestic market value<br />
(million US$)<br />
Freshwater finfish<br />
Indian major carps Catla catla, Labeo rohita <strong>and</strong><br />
Cirrhinus cirrhosus<br />
2.61 3 035<br />
Common carp Cyprinus carpio<br />
Grass carp Ctenopharyngodon idella<br />
Silver carp<br />
Others*<br />
Brackish-water finfish<br />
Hypophthalmichthys molitrix<br />
Milkfish, mullets, Asian seabass, pearlspot<br />
Freshwater crustaceans<br />
0.01 0.02<br />
Giant freshwater prawn Macrobrachium rosenbergii 0.036 356<br />
Monsoon river prawn<br />
Brackish-water Crustaceans**<br />
Macrobrachium malcolmsonii<br />
Penaeid shrimp Penaeus monodon <strong>and</strong><br />
Fenneropenaeus indicus<br />
0.10 1 480<br />
Mud crabs Scylla tranquebarica <strong>and</strong><br />
Scylla serrata<br />
0.05 6.4<br />
*Others primarily include snakeheads, cat fishes, coldwater fish <strong>and</strong> mahseer; **Estimated market value <strong>of</strong> brackish-water<br />
crustaceans are based on export earnings;<br />
Source: Ayyappan <strong>and</strong> Biradar (2004); Agricultural Research Data Book (2004); MPEDA (2004); Kathirvel, P<strong>and</strong>ian <strong>and</strong><br />
Balasubramanian (2004)
196<br />
<strong>Study</strong> <strong>and</strong> <strong>analysis</strong> <strong>of</strong> <strong>feeds</strong> <strong>and</strong> <strong>fertilizers</strong> <strong>for</strong> <strong>sustainable</strong> aquaculture development<br />
TABLE 4<br />
Culture systems <strong>and</strong> production levels <strong>of</strong> freshwater carps, 2004<br />
Culture System Yield (tonnes/ha/year)<br />
Composite fish culture 4 – 6<br />
Sewerage based fish culture 3 – 5<br />
Weed based polyculture 3 – 5<br />
Biogas slurry fish culture 3 – 5<br />
Integrated fish farming 3 – 5<br />
Intensive culture (with feed <strong>and</strong> aeration) 10 – 15<br />
TABLE 5<br />
Area under freshwater prawn culture <strong>and</strong> production in different states, 2004<br />
State<br />
Area developed<br />
(ha)*<br />
Area under culture<br />
(ha)**<br />
Total production<br />
(tonnes)<br />
Yield<br />
(tonnes/ha/year)<br />
West Bengal 4 532 4 450 2 435 0.55<br />
Orissa 3 000 470 450 0.96<br />
Andhra Pradesh 32 290 27 286 32 085 1.18<br />
Tamil Nadu 380 159 133 0.84<br />
Kerala 886 886 238 0.27<br />
Karnataka 256 206 113 0.55<br />
Maharashtra 7 139 6 981 306 0.04<br />
Gujarat 1 440 1 430 106 0.07<br />
Total 49 920 41 870 35 870 0.86<br />
*Area developed <strong>and</strong> ready <strong>for</strong> prawn culture; **area presently used <strong>for</strong> prawn culture<br />
Source: MPEDA (2004)<br />
aquaculture is practised at three levels <strong>of</strong> intensity. Large waterbodies <strong>of</strong> 20–25 ha are<br />
used <strong>for</strong> extensive aquaculture. In these systems the fish are produced on natural food<br />
production without the application <strong>of</strong> external inputs. Semi-intensive fish production<br />
systems are those in which supplementary feeding is provided in addition to the<br />
application <strong>of</strong> <strong>fertilizers</strong> to improve natural productivity. Intensive fish production<br />
systems are those in which the fish are fed balanced <strong>feeds</strong>, while pond water is aerated<br />
<strong>and</strong> exchanged at predetermined intervals. The various culture systems adopted <strong>for</strong><br />
Indian carp culture have been well st<strong>and</strong>ardized <strong>and</strong> the production levels achieved in<br />
these systems are summarized in Table 4.<br />
In recent years, giant freshwater prawn (Macrobrachium rosenbergii) culture has<br />
become an important aquaculture activity in many states <strong>of</strong> India <strong>and</strong> particularly in<br />
Andhra Pradesh. This was mainly driven by the closing <strong>of</strong> the culture cycle <strong>and</strong> the<br />
commercial scale production <strong>of</strong> prawn seed. It is estimated that 41 870 ha are currently<br />
used <strong>for</strong> prawn culture (Table 5) <strong>and</strong> approximately 35 870 tonnes were produced in<br />
2003/04. Prawns are produced in extensive, mixed <strong>and</strong> semi-intensive culture systems.<br />
Organic manures <strong>and</strong> <strong>fertilizers</strong> are applied in ponds <strong>and</strong> the prawns are fed with<br />
<strong>for</strong>mulated pellet <strong>feeds</strong>. In extensive culture systems ponds are stocked with nursery<br />
reared juveniles (3–5 g) at 8 000 to 15 000/ha. In mixed culture systems prawns are reared<br />
together with Indian major carps (catla <strong>and</strong> rohu). Under semi-intensive, monoculture<br />
conditions ponds are stocked at 50 000/ha <strong>and</strong> production levels are in the range <strong>of</strong><br />
350 to 2 000 kg/ha/crop. Production levels <strong>of</strong> prawn under mixed culture conditions<br />
are highly variable depending upon the stocking density used <strong>and</strong> the fish production<br />
ranged from 150 to 2 500 kg/ha/year (Rao, An<strong>and</strong>akumar <strong>and</strong> Sinha,1999).<br />
1.2 Brackish-water Aquaculture<br />
Brackish-water aquaculture in India is synonymous with penaeid shrimp aquaculture.<br />
Black tiger shrimp (Penaeus monodon) is the most popular species <strong>for</strong> aquaculture,<br />
while Indian white shrimp (Fenneropenaeus indicus) is also cultured. Recently there has<br />
been interest in the farming <strong>of</strong> Pacific white shrimp (Litopenaeus vannamei), though<br />
the culture <strong>of</strong> this shrimp is not <strong>of</strong>ficially endorsed.
Analysis <strong>of</strong> <strong>feeds</strong> <strong>and</strong> <strong>fertilizers</strong> <strong>for</strong> <strong>sustainable</strong> aquaculture development in India 197<br />
TABLE 6<br />
Area under shrimp farming in different states <strong>and</strong> shrimp production, 2004<br />
State Potential area<br />
available (ha)<br />
Shrimp aquaculture in India<br />
has been practised <strong>for</strong> more than<br />
100 years, in the ‘pokkali 3 ’ fields<br />
<strong>of</strong> Kerala state <strong>and</strong> under ‘trap<br />
culture’ conditions in ‘Bheries 4 ’ in<br />
West Bengal, Karnataka <strong>and</strong> Goa.<br />
These traditional culture systems<br />
are shallow ponds used <strong>for</strong> paddy<br />
cum shrimp/fish culture, where<br />
tidal inflow provides the seed<br />
stock. Because <strong>of</strong> declining shrimp<br />
stocks farmers are supplementing<br />
the wild shrimp seed with<br />
hatchery reared PLs. Since there<br />
is no selective stocking <strong>of</strong> the<br />
ponds with a particular species,<br />
the systems are best described<br />
as multi-species polyculture <strong>of</strong><br />
shrimp <strong>and</strong> finfish. Harvesting<br />
Area developed<br />
(ha)*<br />
Area under<br />
aquaculture (ha)**<br />
occurs during the spring tides by fixing a bag net in the sluice gate during the<br />
outgoing tide. The shrimp species harvested from these systems are predominantly<br />
Fenneropenaeus indicus, Penaeus merguinensis, Metapenaeus dobsoni <strong>and</strong> M. monoceros.<br />
Miscellaneous fish species such as mullet (Mugil spp.), milkfish (Chanos chanos), <strong>and</strong><br />
pearlspot (Etroplus suratensis) are harvested along with shrimp. It is estimated that<br />
some 50 000 ha are used <strong>for</strong> traditional shrimp farming. Economically shrimp are the<br />
most important species in these systems <strong>and</strong> production ranges from 200–500 kg/ha/<br />
cycle.<br />
The advent <strong>of</strong> hatchery production <strong>of</strong> shrimp seed <strong>and</strong> the subsequent adoption<br />
<strong>of</strong> shrimp monoculture systems in the 1980s trans<strong>for</strong>med shrimp farming into a<br />
billion dollar industry in India. Small <strong>and</strong> marginal farmers mainly practise improved<br />
extensive <strong>and</strong> semi-intensive farming at stocking densities <strong>of</strong> 3–5/m 2 <strong>and</strong> 10–20/m 2 ,<br />
respectively, while larger farmers <strong>and</strong> corporate farms use semi-intensive <strong>and</strong> intensive<br />
technologies at stocking densities <strong>of</strong> 20–100 PL/m 2 . The principal culture species are<br />
P. monodon <strong>and</strong> F. indicus. Production levels in the various systems ranges <strong>for</strong>m 500<br />
kg/ha/crop in extensive systems, 2 000–4 000 kg/ha/crop in semi-intensive systems<br />
3 Tall growing variety <strong>of</strong> paddy commonly cultivated in the state <strong>of</strong> Kerala<br />
4 Traditional farming system <strong>of</strong> shrimp with a large water spread area<br />
Total production<br />
(tonnes)<br />
Yield<br />
(tonnes/ha/year)<br />
West Bengal 40 500 50 405 49 925 29 714 0.60<br />
Orissa 31 600 12 880 12 116 12 390 1.02<br />
Andhra Pradesh 150 000 79 270 69 638 53 124 0.76<br />
Tamil Nadu 56 800 5 416 3 214 6 070 1.89<br />
Kerala 65 000 16 323 14 029 6 461 0.46<br />
Karnataka 8 000 3 435 3 085 1 830 0.59<br />
Goa 18 500 1 001 963 700 0.73<br />
Maharashtra 80 000 1 056 615 981 1.60<br />
Gujarat 376 000 1 537 1 013 1 510 1.49<br />
Total 1 190 900 171 320 154 600 112 780 0.73<br />
*Area developed <strong>and</strong> readily available <strong>for</strong> shrimp culture; **area presently used <strong>for</strong> shrimp culture.<br />
Source: MPEDA (2004)<br />
FIGURE 2<br />
Expansion <strong>of</strong> area under shrimp culture <strong>and</strong> shrimp production<br />
in India<br />
Area under aquaculture<br />
(thous<strong>and</strong> ha) <strong>and</strong> production<br />
(thous<strong>and</strong> tonnes)<br />
Source: MPEDA (2004)<br />
Yield<br />
Yield (tonnes/ha/year)
198<br />
<strong>Study</strong> <strong>and</strong> <strong>analysis</strong> <strong>of</strong> <strong>feeds</strong> <strong>and</strong> <strong>fertilizers</strong> <strong>for</strong> <strong>sustainable</strong> aquaculture development<br />
<strong>and</strong> 5 000–16 000 kg/ha/crop in intensive culture systems. The total area under shrimp<br />
culture systems has exp<strong>and</strong>ed rapidly in different states (Table 6) <strong>and</strong> production has<br />
shown rapid growth (Figure 2).<br />
Shrimp farming in India took a negative turn in 1995 with the occurrence <strong>of</strong> WSSV<br />
(white spot syndrome virus) disease outbreak. Simultaneously environmental <strong>and</strong> legal<br />
issues also surfaced. The Supreme Court <strong>of</strong> India in its judgement in 1996 directed<br />
that construction <strong>of</strong> shrimp culture ponds <strong>and</strong> shrimp culture activity should not be<br />
permitted within the Coastal Regulation Zone, except <strong>for</strong> traditional <strong>and</strong> improved<br />
traditional types <strong>of</strong> culture practised in low lying coastal areas. In pursuance <strong>of</strong> the<br />
directive <strong>of</strong> the Supreme Court, the Govt. <strong>of</strong> India set up a statutory body ‘The<br />
Aquaculture Authority <strong>of</strong> India’ under the Environmental Protection Act (1986). The<br />
main functions <strong>of</strong> the Aquaculture Authority are to regulate shrimp culture in the<br />
coastal areas <strong>and</strong> to promote <strong>sustainable</strong> <strong>and</strong> environmental friendly shrimp farming<br />
in the country. Since then, low-density shrimp culture with a stocking density <strong>of</strong><br />
6 PLs/m 2 <strong>and</strong> production targets <strong>of</strong> 1 000–1 500 kg/ha/crop is advocated. However, a<br />
large number <strong>of</strong> farmers are still using stocking densities <strong>of</strong> 20/m 2 <strong>and</strong> above. Recently<br />
parliament has passed the Coastal Aquaculture Bill (2005), which empowers the<br />
government to regulate <strong>and</strong> monitor the sector’s <strong>sustainable</strong> development.<br />
Parallel to these trans<strong>for</strong>mations in the industry there has been a search <strong>for</strong><br />
alternative shrimp species. This is mainly because the entire shrimp farming industry is<br />
largely dependent on tiger shrimp. However, due to the superior growth <strong>and</strong> value <strong>of</strong><br />
the tiger shrimp this is proving to be difficult.<br />
1.2.1 Finfish aquaculture<br />
Asian seabass (Lates calcarifer), grey mullets (Mugil sp.), milkfish (Chanos chanos) <strong>and</strong><br />
pearlspot (Etroplus suratensis) are the most important species. The non-availability <strong>of</strong><br />
seed on a commercial scale is the most limiting factor <strong>for</strong> finfish aquaculture. Breeding<br />
<strong>and</strong> larval rearing technologies have recently been developed <strong>for</strong> Asian seabass (Arasu,<br />
Abraham <strong>and</strong> Kailasam, 2004) <strong>and</strong> this is expected to stimulate the sector.<br />
1.2.2 Mudcrab aquaculture<br />
The mud crab species, Scylla serrata <strong>and</strong> S. tranquebarica are the most popular<br />
brackish-water crab species cultured in India. Mud crabs are cultured in traditional<br />
shrimp culture fields in the states <strong>of</strong> West Bengal, Kerala, Karnataka <strong>and</strong> Tamil Nadu.<br />
Production is reported to be within the range <strong>of</strong> 10–35 kg/ha/year (Kathirvel, P<strong>and</strong>ian<br />
<strong>and</strong> Balasubramanian, 2004). Juvenile mud crabs are also collected from the wild<br />
<strong>and</strong> cultured on a small scale in fenced earthen ponds <strong>and</strong> in cages. They are stocked<br />
at 1–2 juveniles/m 2 <strong>and</strong> fed fresh trash fish, clam meat <strong>and</strong> slaughterhouse waste at<br />
5–10 percent <strong>of</strong> biomass. Crabs are cultured <strong>for</strong> 7–10 months <strong>and</strong> harvested at<br />
500–600 g weight <strong>and</strong> production in these systems range from 500–1 000 kg/ha/crop.<br />
Mud crabs are also farmed in polyculture with milkfish <strong>and</strong> grey mullets in some<br />
areas (Kathirvel, P<strong>and</strong>ian <strong>and</strong> Balasubramanian, 2004). Fattening <strong>of</strong> s<strong>of</strong>t, post-moulted<br />
mud crabs is also practised in earthen ponds <strong>and</strong> cages. Fattening <strong>and</strong> hardening is<br />
normally undertaken <strong>for</strong> a period <strong>of</strong> 25–30 days, during which they are fed with <strong>feeds</strong>,<br />
as previously mentioned, <strong>and</strong> then exported. Crab fattening is very pr<strong>of</strong>itable <strong>and</strong> is<br />
becoming increasingly popular. Exported figures <strong>for</strong> crabmeat <strong>and</strong> live crabs in 2004<br />
were 141 tonnes (US$1.0 million) <strong>and</strong> 1 896 tonnes (US$5.36 million), respectively.<br />
Large scale hatchery propagation still needs to be perfected.<br />
2. REVIEW AND ANALYSIS OF AQUACULTURE FEEDS AND FEED INGREDIENTS<br />
Nutrients from both <strong>fertilizers</strong> <strong>and</strong> <strong>feeds</strong> are used in Indian aquaculture. Fertilizers are<br />
used primarily <strong>for</strong> initiating <strong>and</strong> maintaining natural productivity <strong>and</strong> <strong>feeds</strong> are used in<br />
semi-intensive <strong>and</strong> intensive culture practices.
Analysis <strong>of</strong> <strong>feeds</strong> <strong>and</strong> <strong>fertilizers</strong> <strong>for</strong> <strong>sustainable</strong> aquaculture development in India 199<br />
TABLE 7<br />
Manures <strong>and</strong> <strong>fertilizers</strong> used in freshwater fish aquaculture<br />
Manure/fertilizer Application rate<br />
(tonnes/ha/year)<br />
Remarks<br />
Lime 0.10–1.25 Applied prior to fertilization<br />
Cow dung 20.0–25.0 50% <strong>of</strong> total amount is used as an initial<br />
dose, mixed with 10–25 kg <strong>of</strong> single<br />
super phosphate <strong>and</strong> the remaining<br />
amount in monthly intervals<br />
Poultry manure 8.0–10.0 As above<br />
Urea or di-ammonium phosphate,<br />
Single superphosphate<br />
0.2–0.5 Applied in monthly/<strong>for</strong>tnightly intervals<br />
2.1 Use <strong>of</strong> <strong>fertilizers</strong> <strong>and</strong> manure in aquaculture<br />
The major aquaculture activity in India is the culture <strong>of</strong> freshwater fish, which is<br />
principally based on natural food production through the use <strong>of</strong> <strong>fertilizers</strong> <strong>and</strong><br />
manures. The culture technology <strong>of</strong> Indian major carps <strong>and</strong> other carps in different<br />
types <strong>of</strong> culture systems (Veerina et al., 1993), involves the periodical application <strong>of</strong><br />
<strong>fertilizers</strong> <strong>and</strong> manures in ponds. Prior to the application <strong>of</strong> <strong>fertilizers</strong> some farmers<br />
apply agricultural lime <strong>and</strong> dolomite at 100 kg/ha. After two to three days <strong>of</strong> liming,<br />
<strong>fertilizers</strong> are applied. Both organic manure (including cow dung slurry from bio-gas<br />
plants) <strong>and</strong> chemical <strong>fertilizers</strong> are used. The present trend is that more farmers are<br />
using poultry manure. In recent years, farmers have also started using bio-<strong>fertilizers</strong><br />
at 1–2 tonnes/ha. The type <strong>of</strong> commonly used <strong>fertilizers</strong> <strong>and</strong> application rates are<br />
presented in Table 7.<br />
Freshwater prawn ponds are fertilized with manures <strong>and</strong> inorganic <strong>fertilizers</strong>. Ponds<br />
are dried <strong>for</strong> 4–8 weeks after harvest <strong>and</strong> then ploughed using tractors. Once every two<br />
years the surface soil is removed <strong>and</strong> used <strong>for</strong> agricultural purposes. Lime is applied at<br />
variable application rates (100–1 200 kg/ha), depending on soil pH. Some farmers also<br />
apply dolomite at 100 kg/ha. Cattle manure is applied at 0.5–5.0 tonnes/ha <strong>and</strong> poultry<br />
manure at 2.0 tonnes/ha. Inorganic fertilizer application rates are urea 5–50 kg/ha,<br />
single superphosphate 6–85 kg/ha <strong>and</strong> ammonium phosphate 8–125 kg/ha (Rao,<br />
An<strong>and</strong>akumar <strong>and</strong> Sinha, 1999).<br />
In shrimp aquaculture, manure <strong>and</strong> fertilizer are also used during pond preparation.<br />
The primary function <strong>of</strong> fertilization in semi-intensive <strong>and</strong> intensive shrimp ponds<br />
is to develop green water (phytoplankton) be<strong>for</strong>e stocking <strong>and</strong> to maintain the<br />
same throughout the culture period. Based on the nutrient availability in the soil,<br />
the recommended application rates are: nitrogenous fertilizer (urea or ammonium<br />
phosphate) 15–20 kg/ha/year, phosphate fertilizer (super phosphate) 10 kg/ha/year,<br />
organic manure (cattle dung or poultry manure) 1 000–1 500 kg/ha/year. No <strong>fertilizers</strong><br />
are, however, used in traditional shrimp culture systems.<br />
2.2 Availability <strong>of</strong> <strong>fertilizers</strong><br />
Agriculture being the mainstay <strong>of</strong> the Indian economy, <strong>fertilizers</strong> <strong>and</strong> manures are<br />
produced on a large scale (Table 8). A total <strong>of</strong> 19.42 million tonnes <strong>of</strong> nitrogenous<br />
<strong>fertilizers</strong> <strong>and</strong> 2.41 million tonnes <strong>of</strong> phosphate <strong>fertilizers</strong> were produced in 2002/03.<br />
In addition, approximately 615.6 million tonnes <strong>of</strong> cattle manure <strong>and</strong> 14.9 million<br />
tonnes <strong>of</strong> poultry manure are available annually. Approximately 16.2 percent <strong>of</strong> cattle<br />
manure is used in aquaculture. Bio-<strong>fertilizers</strong> are also produced <strong>and</strong> used in agriculture.<br />
Aquaculture uses about 0.53 percent <strong>of</strong> the nitrogen fertilizer <strong>and</strong> 4.27 percent <strong>of</strong> the<br />
annual phosphorus fertilizer production.<br />
2.3 Feed ingredients <strong>and</strong> <strong>feeds</strong> used in aquaculture<br />
Conventional feed ingredients such as rice bran, wheat bran <strong>and</strong> groundnut cake are<br />
extensively used <strong>for</strong> feeding carps in freshwater aquaculture. Dried trash fish powder,
200<br />
<strong>Study</strong> <strong>and</strong> <strong>analysis</strong> <strong>of</strong> <strong>feeds</strong> <strong>and</strong> <strong>fertilizers</strong> <strong>for</strong> <strong>sustainable</strong> aquaculture development<br />
TABLE 8<br />
Estimated availability <strong>of</strong> <strong>fertilizers</strong> <strong>and</strong> manures in India (2002/03) <strong>and</strong> their use in aquaculture<br />
Fertilizer/manure Nutrient<br />
(%)<br />
Quantity available<br />
(million tonnes)<br />
Estimated use in<br />
aquaculture<br />
(million tonnes)<br />
Ammonium sulphate Nitrogen 20.6 0.54<br />
Ammonium chloride Nitrogen 25.0 0.08<br />
Calcium ammonium nitrate Nitrogen 25.0 0.17<br />
Urea Nitrogen 46.0 18.62<br />
Total nitrogenous <strong>fertilizers</strong> 19.42 0.103<br />
Single super phosphate Phosphorus<br />
(P2 O5) 16.0<br />
2.41<br />
Total phosphate <strong>fertilizers</strong> 2.41 0.103<br />
Cattle manure 615.6 100.2<br />
Poultry manure 14.9<br />
Total organic manure 630.5 150.3<br />
Source: Agricultural Research Data Book (2004)<br />
silkworm pupae <strong>and</strong> defatted oilseed cakes <strong>and</strong> meals (soybean, mustard, sesame <strong>and</strong><br />
cotton seed) are occasionally used. Non-conventional feed ingredients (alternative<br />
ingredients other than usually used) from animal by-products such as meat meal, meat<br />
<strong>and</strong> bone meal, blood meal <strong>and</strong> Azolla (Mohanty <strong>and</strong> Das, 1995), are seldom used due<br />
to the uncertainty <strong>of</strong> supply. Trash fish, poultry <strong>of</strong>fal <strong>and</strong> other animal by-products<br />
are used <strong>for</strong> carnivorous fish culture. Both conventional <strong>and</strong> non-conventional feed<br />
ingredients are used in <strong>for</strong>mulating <strong>feeds</strong> <strong>for</strong> shrimp <strong>and</strong> giant freshwater prawn<br />
(Alagarswami <strong>and</strong> Ahamad Ali, 2000; Dani, 2000; P<strong>and</strong>ian, 2000; Paul Raj, 2000). Feed<br />
ingredients <strong>of</strong> marine origin such as fishmeal <strong>and</strong> fish oil are extensively used in shrimp<br />
<strong>and</strong> prawn feed <strong>for</strong>mulations. Shrimp meal, squid products <strong>and</strong> mantis shrimp meal are<br />
also in great dem<strong>and</strong>.<br />
2.4 Availability <strong>of</strong> <strong>feeds</strong> <strong>and</strong> ingredients<br />
2.4.1 Ingredients <strong>of</strong> marine <strong>and</strong> animal origin<br />
The dem<strong>and</strong> <strong>for</strong> feed ingredients <strong>of</strong> marine animal origin by the shrimp feed industry<br />
is increasing rapidly. Other animal by-products such as meat <strong>and</strong> bone meal <strong>and</strong> blood<br />
meal are also available, but their use by industrial feed manufacturers is minimal due<br />
to limited availability. Table 9 provides estimates <strong>of</strong> the availability <strong>of</strong> feed ingredient<br />
<strong>of</strong> marine origin (Table 9).<br />
Approximately 5 000–6 000 tonnes <strong>of</strong> high quality fishmeal (crude protein (CP)<br />
55–60 percent) is produced annually. In addition, about 176 400 tonnes <strong>of</strong> low value,<br />
sun dried trash fish is available annually. This is known as feed-grade dry fish, which<br />
is pulverized <strong>and</strong> sold as fishmeal. Besides this, mantis shrimp (57 940 tonnes), shrimp<br />
head (31 235 tonnes) <strong>and</strong> sergisted shrimp (48 000 tonnes) are available. It is expected<br />
that at least 40 percent <strong>of</strong> these ingredients are used by the aquafeed industry <strong>and</strong> the<br />
rest are used by the poultry <strong>and</strong> other livestock feed industries. Of the estimated 176<br />
400 tonnes <strong>of</strong> low value sun dried trash fish, an estimated 100 000 to 130 000 tonnes is<br />
powdered as dry fishmeal (with CP
Analysis <strong>of</strong> <strong>feeds</strong> <strong>and</strong> <strong>fertilizers</strong> <strong>for</strong> <strong>sustainable</strong> aquaculture development in India 201<br />
TABLE 9<br />
Estimated availability <strong>and</strong> cost <strong>of</strong> marine <strong>and</strong> other animal protein resources in India<br />
Ingredient Crude protein<br />
content (%)<br />
Marine ingredients – indigenous<br />
Quantity available<br />
(thous<strong>and</strong> tonnes)<br />
Cost<br />
(US$/kg)<br />
Fishmeal (sterile CP 60%) 55.0–60.0 5–6 0.82<br />
Dry fish (feed grade) or pulverized<br />
fishmeal<br />
45.0–55.0 177 0.58<br />
Mantis shrimp (Squilla sp.) 42.0–45.0 58 0.23<br />
Sergisted shrimp (Acetes) 55.0–60.0 48 0.69<br />
Shrimp head waste 32.0–38.0 31 0.19<br />
Cuttlefish 40.0–45.0 4 1.16<br />
Squid 55.0–68.0 7 1.16<br />
Clam meat 40.0–48.0 4 1.16<br />
Mussel meat 50.0–55.0 1 1.16<br />
Small crabs<br />
Marine ingredients – imported<br />
38.0–42.0 6 0.16<br />
Fishmeal (CP >60%) 60.0–70.0 20–25 1.05–0.94<br />
Fish soluble 55.0–60.0 3–5 1.63<br />
Squid meal 60.0–65.0 5 1.60<br />
Squid liver meal 45.0–55.0 3–5 1.16<br />
Source: Ahamad Ali et al. (1995); Dani (2000); P<strong>and</strong>ian (2000); Paul Raj (2000); Agricultural Research Data Book (2004)<br />
Ali <strong>and</strong> Mohamed, 1982) <strong>and</strong> is now increasingly being used in <strong>feeds</strong> <strong>for</strong> shrimp <strong>and</strong><br />
prawns. The chitin manufacturing industry <strong>and</strong> the poultry feed industry are the major<br />
competitors <strong>for</strong> this raw material, though the supply is adequate <strong>for</strong> aquaculture.<br />
Squid, shrimp <strong>and</strong> mollusc meal (clam <strong>and</strong> mussel) are primarily used as feed<br />
attractants <strong>and</strong> <strong>for</strong> growth promoters <strong>for</strong> shrimp besides being good protein sources.<br />
These ingredients are largely not accessible <strong>and</strong> not available because the resources<br />
are small <strong>and</strong> the product is in great dem<strong>and</strong> <strong>for</strong> human consumption <strong>and</strong> <strong>for</strong> export.<br />
Hence these products are imported by the aquafeed industry. Squid <strong>and</strong> cuttlefish<br />
processing waste products are valuable ingredients <strong>for</strong> shrimp <strong>feeds</strong> (Ahamad Ali,<br />
1998), though supply is limited.<br />
2.4.2 Ingredients <strong>of</strong> plant origin<br />
Plant ingredients constitute the largest nutrient resources <strong>for</strong> aqua<strong>feeds</strong>. Their use as<br />
protein, lipid <strong>and</strong> energy (carbohydrate) sources in feed <strong>for</strong>mulations are shown in<br />
Table 10.<br />
Protein sources<br />
Soybean meal is the most important <strong>of</strong> the plant protein sources. Soybean cultivation<br />
is on the increase in the country <strong>and</strong> hence the outlook <strong>for</strong> the availability <strong>of</strong> soybean<br />
meal <strong>for</strong> aqua<strong>feeds</strong> is positive. Soybean meal contains several anti-nutritional factors<br />
(Table 11), though these can be destroyed by heat treatment. Corn (maize) gluten,<br />
a by-product <strong>of</strong> the corn starch manufacturing industry, is another promising plant<br />
protein source. It has a 45–50 percent crude protein content but is deficient in some<br />
amino acids, especially arginine <strong>and</strong> lysine. However, it can be used along with other<br />
protein sources in aqua<strong>feeds</strong>. Preliminary studies have shown that corn gluten can<br />
partially replace (10–15 percent) fishmeal in Indian white shrimp feed (Ahamad Ali,<br />
Syama Dayal <strong>and</strong> Ambasankar, 2004). Corn gluten has also been evaluated in the diets<br />
<strong>of</strong> Indian carps (Kaur, 2002).<br />
Groundnut oilseed cake is sought after by both the terrestrial animal <strong>and</strong> the<br />
aquafeed industries. Groundnut cake is extensively used in cattle, poultry, fish <strong>and</strong><br />
shrimp <strong>feeds</strong> <strong>and</strong> is readily available. Although its use in high quality shrimp <strong>feeds</strong> is<br />
limited, groundnut cake is utilized in considerable quantities in farm-made <strong>feeds</strong> <strong>and</strong><br />
by small-scale feed producers.
202<br />
<strong>Study</strong> <strong>and</strong> <strong>analysis</strong> <strong>of</strong> <strong>feeds</strong> <strong>and</strong> <strong>fertilizers</strong> <strong>for</strong> <strong>sustainable</strong> aquaculture development<br />
Other important available plant protein sources are cottonseed meal, coconut<br />
oilseed cake, sesame cake, mustard cake, rape seed cake <strong>and</strong> sunflower oilseed cake<br />
meal. They are readily available to the aquafeed industry but their use in fish <strong>and</strong><br />
shrimp <strong>feeds</strong> is limited due to various reasons. Their inclusion levels do not normally<br />
exceed 15 percent. With improved processing technology these resources could, in<br />
future, play a greater role in aqua<strong>feeds</strong>.<br />
Energy sources<br />
India produces a variety <strong>of</strong> cereals. The most <strong>of</strong> which prominent are wheat, rice,<br />
maize, sorghum <strong>and</strong> other millets. Tapioca tuber (cassava) is also cultivated in some<br />
parts <strong>of</strong> the country. All are excellent energy (carbohydrate) sources. Cereal grains are<br />
the primary staple foods in India <strong>and</strong> competition <strong>for</strong> their use is high. However, they<br />
are accessible <strong>and</strong> available <strong>for</strong> use in aqua<strong>feeds</strong> (Table 10). Wheat is most extensively<br />
used in shrimp <strong>feeds</strong> <strong>for</strong> its carbohydrate content as well as <strong>for</strong> its gluten content,<br />
which is a good binder, followed by rice <strong>and</strong> maize products. Sorghum, pearl millet<br />
<strong>and</strong> other coarse cereals such as ragi (milo) <strong>and</strong> finger millet are available, but not <strong>of</strong>ten<br />
used in aquafeed <strong>for</strong>mulations.<br />
The rice granaries <strong>of</strong> India produce large quantities <strong>of</strong> rice bran, most <strong>of</strong> which<br />
is used by the animal feed industry. Besides being a good source <strong>of</strong> energy, rice bran<br />
contains between 8–9 percent protein, lipids, B-group vitamins <strong>and</strong> cellulose. Rice bran<br />
is readily available <strong>for</strong> fish <strong>and</strong> prawn <strong>feeds</strong>.<br />
Wheat bran is increasingly used in fish <strong>and</strong> prawn <strong>feeds</strong>, particularly in the northern<br />
states where wheat bran is more abundant compared to rice bran. Tapioca (cassava) is<br />
used in shrimp <strong>and</strong> fish feed <strong>for</strong>mulations as a carbohydrate source <strong>and</strong> as a binder<br />
(Ahamad Ali, 1988).<br />
TABLE 10<br />
Estimated availability <strong>and</strong> cost <strong>of</strong> feed ingredients <strong>of</strong> plant origin <strong>for</strong> their potential use in<br />
aqua<strong>feeds</strong> in India<br />
Ingredient Annual availability<br />
(million tonnes)<br />
Cost<br />
(US$/kg)<br />
Potential use<br />
in aqua<strong>feeds</strong><br />
(million tonnes)<br />
Protein sources<br />
Soybean cake 5.0–5.5 0.30 0.0356<br />
Groundnut cake 8.0–8.5 0.23 0.0202<br />
Corn gluten NA 0.25 NA<br />
Cotton seed cake 0.75–0.80 0.18 0.0096<br />
Sesame cake 0.45–0.50 0.23 0.0062<br />
Sunflower cake 0.8–1.0 0.14 0.0034<br />
Rape seed/mustard cake 5.0–5.8 0.19 0.0152<br />
Linseed cake<br />
Energy (carbohydrate) sources<br />
0.1 NA NA<br />
Coconut cake 0.14– 0.16 0.23 0.0019<br />
Maize (2002–2003) 14.0–14.7 0.25 0.1476<br />
Sorghum (2002–2003) 7.5–8.0 0.19 0.0102<br />
Pearl millet (2002–2003) 11.0–11.8 0.2 0.0840<br />
Other cereals (2002–2003) 31.8 0.19 0.3816<br />
Wheat (2002–2003) 72.6 0.34 0.8713<br />
Rice (2002–2003) 89.3 0.35 0.5817<br />
Rice bran<br />
(including defatted bran 7%)<br />
3.0–3.5 0.07–0.13 0.0242<br />
Wheat bran 2.0–2.5 0.19 0.0186<br />
Tapioca 5.6–6.0 0.14 0.0672<br />
NA=No available data<br />
Source: Ahamad Ali et al. (1998); Dani (2000); P<strong>and</strong>ian (2000); Paul Raj (2000); Agricultural Research Data Book<br />
(2004)
Analysis <strong>of</strong> <strong>feeds</strong> <strong>and</strong> <strong>fertilizers</strong> <strong>for</strong> <strong>sustainable</strong> aquaculture development in India 203<br />
TABLE 11<br />
Anti-nutritional factors in some plant ingredients<br />
Ingredient Potential anti-nutrient<br />
Groundnut cake Phytic acid & protease inhibitor<br />
Soybean meal Trypsin inhibitor<br />
Mustard cake Glucosinolates<br />
Cotton seed cake Gossypol & cyclopropionic acid<br />
Sesame cake Phytic acid & protease inhibitor<br />
Rapeseed cake Protease inhibitor <strong>and</strong> glucosinolates<br />
Sunflower cake Saponins & protease inhibitor<br />
Lucaene leaf Mimosin<br />
Cassava leaf (Manihot esculants) Hydrocyanic acid<br />
Lupin seed cake Saponins, alkaloid & protease inhibitor<br />
Alfalfa meal (Medicago sp.) Protease inhibitor, saponins, phytoestrgens<br />
Source: Francis, Makkar <strong>and</strong> Becker (2001); P<strong>and</strong>ian (2000)<br />
Lipid sources<br />
India produces 4.87 million tonnes (2002–03) <strong>of</strong> edible oils (Table 12), such as<br />
groundnut, coconut, sunflower, sesame (gingili), mustard, soybean, soy lecithin, palm<br />
<strong>and</strong> to some extent rice bran oil. Fish <strong>and</strong> shark liver oil is also produced locally.<br />
Because <strong>of</strong> its HUFA <strong>and</strong> PUFA<br />
composition, fish oil is the most sought<br />
after lipid source <strong>for</strong> aquafeed <strong>for</strong>mulations<br />
(Hasan, 2001). The crude local fish oil<br />
is mainly used in the manufacture <strong>of</strong><br />
farm-made <strong>feeds</strong> <strong>and</strong> by small-scale<br />
aquafeed producers. All major aquafeed<br />
companies import fish oil (approximately<br />
5–6 thous<strong>and</strong> tonnes per annum). Plant<br />
oils, though available in the country, are<br />
not easily accessible by the aquafeed <strong>and</strong><br />
animal feed industries because <strong>of</strong> the<br />
high dem<strong>and</strong> <strong>for</strong> human consumption.<br />
Moreover, their fatty acid pr<strong>of</strong>iles do not<br />
adequately meet the essential fatty acid<br />
requirements <strong>of</strong> most <strong>of</strong> the cultured<br />
species. However, soybean oil <strong>and</strong> soy<br />
lecithin are used as sources <strong>of</strong> fat <strong>and</strong><br />
phospholipids in shrimp <strong>feeds</strong>.<br />
2.4.3 Non-conventional feed ingredients<br />
There are several non-conventional feed<br />
ingredients that are suitable <strong>and</strong> available<br />
<strong>for</strong> aquafeed <strong>for</strong>mulations (Table 13).<br />
The usefulness <strong>of</strong> these ingredients<br />
has been tested <strong>for</strong> some fish species<br />
(Dhawan, Kaur <strong>and</strong> Virk., 2004). Some<br />
<strong>of</strong> these animal by-products are used <strong>for</strong><br />
the feeding <strong>of</strong> carnivorous finfish <strong>and</strong><br />
included, on a limited scale, in prawn <strong>and</strong><br />
farm-made shrimp <strong>feeds</strong>. India also has a<br />
large sericulture industry <strong>and</strong> silkworm<br />
pupae are utilized <strong>for</strong> feeding fish, prawns<br />
<strong>and</strong> shrimps (Ahamad Ali, 1992).<br />
TABLE 12<br />
Estimated availability <strong>of</strong> edible oils <strong>and</strong> fish oil in India<br />
Type Availability<br />
(thous<strong>and</strong><br />
tonnes)<br />
Cost<br />
(US$/kg)<br />
Soybean oil 527 1.28<br />
Groundnut oil 1 464 1.28<br />
Sesame oil 227 1.86<br />
Coconut oil 416 1.39<br />
Sunflower oil 262 1.39<br />
Safflower oil 0.45 1.86<br />
Mustard oil/ rape seed oil 1 542 1.39<br />
Cotton seed oil 358 1.28<br />
Palm oil NA 1.00<br />
Soy lecithin NA 0.93<br />
Niger seed oil 0.27 1.63<br />
Fish oil (indigenous) 5–6 1.39<br />
Fish oil (imported) 5.0 2.34–3.48<br />
Squid oil (imported) 3.0 3.5<br />
Source: Agricultural Research Data Book (2004); Ahamad Ali et al.<br />
(1995)<br />
TABLE 13<br />
Estimated availability <strong>of</strong> non-conventional feed<br />
ingredients in India<br />
Ingredient Availability<br />
(tonnes)<br />
Animal products/by-products<br />
Cost<br />
(US$/kg)<br />
Meat <strong>and</strong> bone meal 55 200 0.14<br />
Poultry <strong>of</strong>fal 65 000 0.12<br />
Feather meal Available NA<br />
Slaughter house waste Available NA<br />
Silkworm pupae 40 000 NA<br />
Poultry hatchery waste<br />
Single cell proteins<br />
17 406 NA<br />
Spirulina Available 14.0<br />
Yeast Available 2.8<br />
Yeast extract (from brewery) Available 1.16<br />
NA= not available
204<br />
<strong>Study</strong> <strong>and</strong> <strong>analysis</strong> <strong>of</strong> <strong>feeds</strong> <strong>and</strong> <strong>fertilizers</strong> <strong>for</strong> <strong>sustainable</strong> aquaculture development<br />
Single cell proteins<br />
Spirulina <strong>and</strong> single cell yeasts are used, to a limited extent, in shrimp larval <strong>feeds</strong> in<br />
India. Spirulina is rich in protein (60 percent) <strong>and</strong> contains pigments <strong>and</strong> antioxidants<br />
besides some unknown growth factors (Vaitheeswaran <strong>and</strong> Ahamad Ali, 1986).<br />
Spirulina has the potential to replace fishmeal to some extent, but the high nucleic acid<br />
content limits its use in aqua<strong>feeds</strong>. The large scale production <strong>of</strong> single cell proteins<br />
needs to be examined as protein sources <strong>for</strong> aqua<strong>feeds</strong> (Dani, 2000).<br />
There are several other non-conventional feed ingredients (Dhawan, Kaur <strong>and</strong><br />
Virk, 2004), that have been tested <strong>for</strong> some fish species (Table 14) with encouraging<br />
results. Press mud from the sugar cane industry was used to replace 25 percent <strong>of</strong> the<br />
rice bran in common carp <strong>feeds</strong>, without any adverse effects (Singh <strong>and</strong> Dhawan 1995;<br />
Singh, Dhawan <strong>and</strong> Saxsena, 1999). Molasses can be included at five percent in common<br />
carp diets (Singh <strong>and</strong> Dhawan, 1993). Poultry hatchery waste, silage from poultry<br />
<strong>of</strong>fal meal, slaughter house waste <strong>and</strong> silk worm pupae have all been tested <strong>and</strong> found<br />
suitable <strong>for</strong> various fish species (Butt et al., 1988; Sehagal <strong>and</strong> Sharma, 1991; Swamy<br />
<strong>and</strong> Devaraj, 1995; Chakrabarti, 1996; Borthakur <strong>and</strong> Sharma, 1998; Singh, Kaur <strong>and</strong><br />
<strong>and</strong> Dhawan, 2000).<br />
TABLE 14<br />
Experimental use <strong>of</strong> non-conventional feed ingredients <strong>for</strong> selected fish species<br />
Feed/Ingredient<br />
Agro-industry products<br />
Species tested Reference<br />
Sugar cane molasses Common carp Singh <strong>and</strong> Dhawan (1993)<br />
Press mud<br />
Animal by-products<br />
Common carp<br />
Singh, Dhawan <strong>and</strong> Saxsena<br />
(1999); Singh <strong>and</strong> Dhawan<br />
(1995)<br />
Poultry hatchery waste Common carp Singh, Kaur <strong>and</strong> <strong>and</strong> Dhawan<br />
(2000)<br />
Poultry <strong>of</strong>fal meal Common carp Chakrabarti (1996)<br />
Slaughter house waste Indian major carp, mrigal<br />
Common carp<br />
Silkworm pupae Common carp<br />
Walking catfish (Clarias<br />
batrachus)<br />
Aquatic <strong>and</strong> terrestrial macrophytes<br />
Otellia Indian major carps, catla <strong>and</strong><br />
rohu<br />
Sehagal <strong>and</strong> Sharma (1991)<br />
Butt et al. (1988)<br />
Swamy <strong>and</strong> Devaraj (1995);<br />
Borthakur <strong>and</strong> Sharma (1998)<br />
Patnaik et al. (1991)<br />
Nymphoides Indian major carps Patnaik et al. (1991)<br />
Pistia Rohu Ray <strong>and</strong> Das (1995)<br />
Duck weed (Lemna minor) Common carp Devaraj, Krishna <strong>and</strong><br />
Keshavappa (1981)<br />
Azolla carolaniano<br />
Catla, rohu <strong>and</strong> grass carp Das, Sikdar <strong>and</strong> Chotterjee<br />
Azolla pinnata<br />
Plant leaf & seed meals<br />
(1994);<br />
Mohanty <strong>and</strong> Das (1995)<br />
Lucerne (alfalfa) meal<br />
Medicago sativa<br />
Common carp Swamy <strong>and</strong> Devaraj (1995)<br />
Acacia leaf meal<br />
(Acacia auriculi<strong>for</strong>mis)<br />
Rohu Mondal <strong>and</strong> Ray (1996)<br />
Sal seed (Shorea robusta) Rohu Mukhopadhyay <strong>and</strong> Ray<br />
(1997)<br />
The proximate composition <strong>of</strong> some <strong>of</strong> the important feed ingredients is presented<br />
in Table 15.
Analysis <strong>of</strong> <strong>feeds</strong> <strong>and</strong> <strong>fertilizers</strong> <strong>for</strong> <strong>sustainable</strong> aquaculture development in India 205<br />
TABLE 15<br />
Typical proximate composition <strong>of</strong> selected feed ingredients<br />
Ingredient<br />
Animal by-products<br />
% dry matter basis<br />
Moisture Crude protein Crude lipid Crude fibre CHO Ash<br />
In<strong>for</strong>mation<br />
source<br />
Fishmeal (imported) Grade 1 8.1 70.5 8.5 0.1 Trace 12.8 2<br />
Fishmeal (imported) Grade 2 9.1 69.2 6.5 0.1 0.8 14.3 2<br />
Fishmeal (imported) Grade 3 5.0 66.6 9.5 0.2 0.2 18.5 2<br />
Fishmeal (indigenous) 10.3 64.4 4.7 2.5 2.4 15.7 2<br />
Fishmeal (indigenous) 10.8 55.0 5.4 1.7 3.3 23.8 2<br />
Sergisted shrimp meal 9.8 60.2 6.8 4.4 3.6 15.2 2<br />
Prawn head meal 9.9 39.8 9.6 16.4 4.1 20.2 2<br />
Squid meal 8.4 66.5 4.4 3.9 5.9 10.9 2<br />
Mantis shrimp (Squilla) 10.7 44.2 4.4 5.7 4.3 30.7 2<br />
Clam meat meal 7.7 48.1 13.6 trace 23.0 7.6 2<br />
Meat meal 8.0 50.0 4.4 6.8 25.8 5.0 2<br />
Meat <strong>and</strong> bone meal - 51.0 10.0 - - 16.0 2<br />
Blood meal 10.0 65.3 0.5 - - - 1<br />
Silkworm pupae 9.8 62.2 7.6 1.3 1.9 17.2 2<br />
Poultry feather meal - 85.0 3.2 1.5 - - 3<br />
Poultry hatchery waste - 40.0 - - 15.2 18.0 3<br />
Poultry <strong>of</strong>fal 8.6 60.3 10.1 2.5 6.2 12.3 2<br />
Plant <strong>and</strong> plant by-products<br />
Soybean meal 10.5 51.5 1.00 8.9 19.7 8.5 2<br />
Corn (maize) gluten 6.8 48.2 2.4 4.8 34.0 3.8 2<br />
Groundnut cake meal 7.7 48.4 7.6 2.1 28.2 6.0 2<br />
Groundnut cake meal 13.1 46.9 5.0 8.9 18.0 8.1 2<br />
Mustard cake 9.2 23.6 9.6 6.3 40.9 10.4 2<br />
Sunflower cake meal 7.0 26.7 2.0 30.1 26.4 7.7 2<br />
Sesame cake meal 4.9 34.0 10.8 13.0 24.8 12.5 2<br />
Sesame cake meal 9.8 38.7 6.0 10.7 15.8 19.0 2<br />
Rape seed cake meal 11.0 35.9 0.9 13.2 32.1 6.9 2<br />
Sal seed cake meal 8.6 8.2 2.9 1.7 68.4 10.2 2<br />
Cotton seed cake meal 7.0 37.0 6.7 13.0 35.3 1.0 2<br />
Coconut cake meal 8.9 25.9 11.2 17.9 27.2 8.9 2<br />
Coconut cake meal 8.4 20.3 11.4 16.2 37.5 6.2 2<br />
Corn meal 10.4 9.5 4.0 3.8 68.7 1.7 1<br />
Sorghum 10.0 9.0 2.8 3.0 75.1 0.1 1<br />
Wheat flour 12.5 12.5 2.0 1.8 70.0 1.3 1<br />
Rice flour 11.5 9.1 0.3 trace 78.6 0.5 1<br />
Refined wheat flour 12.3 11.1 0.3 trace 75.2 1.2 1<br />
Rice bran 8.7 9.0 4.5 13.2 40.8 23.8 1<br />
Wheat bran 10.6 10.8 2.5 9.7 6.4 3.0 1<br />
Tapioca flour 8.5 2.0 0.5 3.5 68.5 2.4 1<br />
Pistia meal 4.9 19.5 1.3 11.7 37.0 25.6 1<br />
Leucaena meal 11.8 33.1 4.7 9.0 34.2 7.2 1<br />
Press mud from sugarcane<br />
industry<br />
- 15.4 7.8 23.3 0.8 - 3<br />
Molasses - 3.2 - - 60.8 5.0 3<br />
Single cell protein<br />
Spirulina 7.8 60.9 9.0 7.5 1.8 13.0 1<br />
Yeast (bakers) 1.4 56.1 2.1 0.3 30.2 9.9 1<br />
CHO = digestible carbohydrate; blank indicates data is not available.<br />
Source: 1) N<strong>and</strong>eesha (1993); 2) Ahamad Ali, Gopal <strong>and</strong> Ramana (2000); 3) Dhawan, Kaur <strong>and</strong> Virk (2004)
206<br />
<strong>Study</strong> <strong>and</strong> <strong>analysis</strong> <strong>of</strong> <strong>feeds</strong> <strong>and</strong> <strong>fertilizers</strong> <strong>for</strong> <strong>sustainable</strong> aquaculture development<br />
3. ON-FARM FEED MANAGEMENT STRATEGIES<br />
3.1 Freshwater fish<br />
There are three recommended polyculture practices with st<strong>and</strong>ardized feeding<br />
regimens. These are:<br />
• polyculture <strong>of</strong> catla (Catla catla), rohu (Labeo rohita) <strong>and</strong> mrigal (Cirrhinus<br />
cirrhosus) stocked at 4 000 to 5 000 fingerlings/ha at a species ratio <strong>of</strong> 2:3:2,<br />
respectively;<br />
• polyculture <strong>of</strong> the three Indian major carps, plus silver carp (Hypophthalmichthys<br />
molitrix), grass carp (Ctenopharyngodon idella) <strong>and</strong> common carp (Cyprinus<br />
carpio) stocked at a ratio <strong>of</strong> 40 percent Indian carps (1:1:1 species ratio) <strong>and</strong><br />
60 percent other carps at a species ratio <strong>of</strong> 2:1:1 at a density <strong>of</strong> 10 000 fingerlings/ha;<br />
<strong>and</strong><br />
• polyculture <strong>of</strong> rohu <strong>and</strong> catla stocked at 10 000 fingerlings/ha at a ratio <strong>of</strong> 9:1 <strong>and</strong><br />
or mixed with snakehead (Chana striata) at a ratio <strong>of</strong> (9:0.5:0.5).<br />
For these combinations it is recommended that ponds are fertilized with organic<br />
<strong>and</strong> inorganic <strong>fertilizers</strong> <strong>and</strong> the fish are fed on a 1:1 mixed rice bran <strong>and</strong> groundnut<br />
oilseed feed at 2–3 percent <strong>of</strong> biomass per day. The average estimated production from<br />
these systems is about 10 tonnes/ha/year.<br />
However, culture practices are modified to suit local dem<strong>and</strong>, availability <strong>and</strong><br />
cost <strong>of</strong> the required inputs <strong>and</strong> the farm-gate price <strong>of</strong> the fish. The average farmgate<br />
value <strong>of</strong> Indian major carps is less than US$0.5/kg (Rs 25/kg). For example, in<br />
Andhra Pradesh farmers quickly modified the recommended culture combinations<br />
<strong>and</strong> soon developed unique fertilization, feeding <strong>and</strong> feed management practices.<br />
Ingredients are selected purely on the basis <strong>of</strong> availability <strong>and</strong> cost effectiveness.<br />
These adapted local technologies were largely responsible <strong>for</strong> the early success <strong>of</strong> fish<br />
farming in Andhra Pradesh, which subsequently stimulated fish culture throughout<br />
the country.<br />
Fish farmers in Andhra Pradesh only use two species in their combination systems<br />
(viz. catla <strong>and</strong> rohu at a 20:80 ratio). The fish are stocked at 6–12 fry/m 2 in nursery<br />
ponds <strong>and</strong> reared to 100–150 g. Production ponds are prepared by the application <strong>of</strong><br />
20 tonnes/ha/year <strong>of</strong> cow dung or 10 tonnes/ha/year <strong>of</strong> chicken manure. Plankton<br />
density is judged by the colour <strong>of</strong> the water <strong>and</strong> fertilization is regulated accordingly.<br />
Fingerlings are stocked at 10 000/ha <strong>and</strong> the fish are fed on farm-made <strong>feeds</strong> consisting<br />
<strong>of</strong> a 7:3 mix <strong>of</strong> rice bran <strong>and</strong> groundnut oilseed cake, respectively. The feed is presented<br />
to the fish in feeding bags. Holes are punched into the bag <strong>and</strong> up to 20 kg <strong>of</strong> mixed<br />
feed is placed therein; this is then suspended on a pole in the water column (20–25 bags<br />
per ha <strong>of</strong> pond surface area). Feed is replenished once a day in the morning <strong>and</strong> the fish<br />
generally consume the feed in 2–3 hours. Ration size is determined by growth <strong>and</strong> the<br />
feed consumption rate.<br />
The duration <strong>of</strong> the production cycle in these systems is 9–12 months <strong>and</strong> fish<br />
are harvested when rohu attain 1.5 to 1.75 kg <strong>and</strong> catla reach 2.0–2.5 kg (Figure 3).<br />
Production in these culture systems averages between 5 000–8 000 kg/ha/year, although<br />
production rates as high as 14 000–15 000 kg/ha/year have also been reported. Because<br />
farmers practise supplementary feeding it is difficult to assess the true feed conversion<br />
ratio. However, the apparent feed gain ratio is 2.0–4.5. Moreover, farmers intelligently<br />
resort to skilful on-farm feed management strategies. When fish are in an active<br />
growth phase during summer they feed protein rich oilcakes in a larger proportion<br />
(30–40 percent) (Figure 4). During the slow growth phase in winter <strong>and</strong> the monsoon<br />
season only rice bran <strong>for</strong>tified with a small proportion <strong>of</strong> oil cakes is fed to the fish. In<br />
this way feed expenditure is kept under control.<br />
There have been some recent attempts to demonstrate (American Soybean<br />
Association) the use <strong>of</strong> extruded pellet <strong>feeds</strong> in freshwater fish culture in the state <strong>of</strong><br />
Tamil Nadu (Suresh, 2007), though the results have not been adopted by the farmers.
Analysis <strong>of</strong> <strong>feeds</strong> <strong>and</strong> <strong>fertilizers</strong> <strong>for</strong> <strong>sustainable</strong> aquaculture development in India 207<br />
Broodstock are fed with semimoist<br />
dough <strong>feeds</strong> consisting <strong>of</strong> 15–20<br />
percent dry fish powder (fishmeal),<br />
10–15 percent rice flour, 20–25<br />
percent groundnut cake <strong>and</strong> 15–20<br />
percent pulses. The ingredients are<br />
finely powdered <strong>and</strong> mixed. Water is<br />
added (25–30 percent by weight) <strong>and</strong><br />
the mixture is cooked, cooled <strong>and</strong><br />
fed to the brood fish in the <strong>for</strong>m <strong>of</strong><br />
feed balls or meat mincer extruded<br />
spaghetti. The cost <strong>of</strong> cooking<br />
amounts to US$0.04–0.07/kg <strong>of</strong> feed.<br />
Fry in nurseries are fed a mixture <strong>of</strong><br />
rice bran <strong>and</strong> oil cake (1:1 ratio) in<br />
powder <strong>for</strong>m by broadcasting over<br />
the pond.<br />
Carnivorous fishes such as Clarias<br />
batrachus, Heteropneustes fossilis <strong>and</strong><br />
Clarias gariepinus are cultured in<br />
some areas in the north-eastern states.<br />
In the absence <strong>of</strong> hatchery reared<br />
seed, wild juveniles are caught <strong>and</strong><br />
used. Carnivorous fish such catfishes<br />
(Clarias batrachus <strong>and</strong> Heteropneustes<br />
fossilis), snakeheads <strong>and</strong> the African<br />
catfish Clarias gariepinus are also<br />
reared in manured ponds <strong>and</strong> fed<br />
simple <strong>feeds</strong> such as fresh trash fish,<br />
animal by-products, poultry <strong>of</strong>fal,<br />
silkworm pupae <strong>and</strong> kitchen waste.<br />
No attempts have yet been made to<br />
produce a <strong>for</strong>mulated water stable<br />
pellet <strong>for</strong> carnivorous fish in India <strong>and</strong><br />
this is simply related to the absence <strong>of</strong><br />
an adequate dem<strong>and</strong>.<br />
3.2 Giant freshwater prawn<br />
Two types <strong>of</strong> aquaculture practices<br />
are commonly used <strong>for</strong> the culture<br />
<strong>of</strong> giant freshwater prawn. One is<br />
monoculture <strong>of</strong> the prawn while<br />
the other is polyculture along with<br />
Indian major carps (catla <strong>and</strong> rohu).<br />
In monoculture the farmers stock up<br />
to 50 000 seed per hectare directly<br />
FIGURE 3<br />
Partial harvesting <strong>of</strong> carps from a farm in Thanjavur district,<br />
Tamil Nadu<br />
Thanjavur is in the Cauvery delta <strong>and</strong> carp culture is practised<br />
fairly intensively in this area. The carps produced here are <strong>for</strong><br />
local consumption <strong>and</strong> the fish usually fetch a good market price.<br />
FIGURE 4<br />
Ingredients (groundnut cake, rice bran <strong>and</strong> maize flour) <strong>for</strong><br />
preparing farm-made feed in a carp farm near Thanjavur<br />
district, Tamil Nadu<br />
Freshwater carp farmers in India (particularly in Andhra<br />
Pradesh <strong>and</strong> Tamil Nadu) <strong>of</strong>ten resort to different on-farm feed<br />
management strategies. During summer, when carp are in an<br />
active growth phase they feed protein rich oilcakes in a larger<br />
proportion (30–40 percent). During the slow growth phase in<br />
winter <strong>and</strong> the monsoon season only rice bran <strong>for</strong>tified with a<br />
small proportion <strong>of</strong> oil cakes is fed to the fish. In this way feed<br />
expenditure is kept under control.<br />
from hatchery. Whereas in the polyculture practice, the seed is stocked in nursery<br />
ponds at the rate <strong>of</strong> 150–200 PL/m 2 in semi-intensive method <strong>and</strong> 800–1 000 PL/m 2 in<br />
the intensive method (Vasudevappa 2001). During the nursery phase PL are fed with<br />
granular (starter grade) <strong>feeds</strong> <strong>of</strong> 35 percent protein that are commercially available <strong>and</strong><br />
PL are grown to 3.0–5.0 g in about 60 days. These juveniles are stocked in grow-out<br />
ponds at 8 000 to 20 000 per hectare. Along with prawns, fingerlings (3–100 g) <strong>of</strong> catla<br />
<strong>and</strong> rohu are also stocked at 150 to 2 500/ha (Rao, An<strong>and</strong>akumar <strong>and</strong> Sinha, 1999).<br />
COURTSEY OF A.V. SURESH<br />
COURTESY OF P.E. VIJAY ANAND
208<br />
<strong>Study</strong> <strong>and</strong> <strong>analysis</strong> <strong>of</strong> <strong>feeds</strong> <strong>and</strong> <strong>fertilizers</strong> <strong>for</strong> <strong>sustainable</strong> aquaculture development<br />
Prawn pond preparation includes ploughing <strong>of</strong> the substratum, application <strong>of</strong> lime<br />
<strong>and</strong> cattle manure at the rate <strong>of</strong> 500–5 000 kg/ha or poultry droppings at 2 000 kg/ha.<br />
Inorganic <strong>fertilizers</strong> are also used. Urea is applied at the rate <strong>of</strong> 5–50 kg/ha <strong>and</strong> single<br />
super-phosphate or di-ammonium phosphate at 18–25 kg/ha. Stocking <strong>of</strong> prawns or<br />
prawns <strong>and</strong> fish occurs after 10–15 days, when the water has taken on a light green or<br />
brownish colour. More than 60 percent <strong>of</strong> prawn farmers use nutritionally complete<br />
shrimp <strong>feeds</strong>, while the remainders use farm-made <strong>feeds</strong>, which generally contain<br />
20–30 percent crude protein <strong>and</strong> cost around US$0.3–0.4/kg. As many as 18 different<br />
ingredients are used in prawn <strong>feeds</strong>, some <strong>of</strong> which are listed in Table 17. The farmers<br />
hire pelleting units <strong>for</strong> the manufacture <strong>of</strong> <strong>feeds</strong>. Prawns are fed 3–4 times per day at a<br />
rate <strong>of</strong> 2 to 5 percent <strong>of</strong> the body weight. Feed is normally broadcasted over the pond.<br />
The fish mainly <strong>feeds</strong> on the plankton naturally produced in the pond <strong>and</strong> hence no<br />
additional feeding is done. The fish grow to 1–2 kg in weight at the time <strong>of</strong> harvest.<br />
Freshwater prawn ponds are normally stocked in July. After four months, when the<br />
prawns attain an average weight <strong>of</strong> 40 g, they are partially harvested every <strong>for</strong>tnight<br />
over a period <strong>of</strong> 4–6 months until the ponds are finally harvested. Prawn production<br />
levels, depending on stocking density, vary between 350–2 000 kg/ha/crop, whilst fish<br />
production varies from 250–2 500 kg/ha.<br />
3.3 Penaeid shrimp<br />
During the mid 1980s traditional shrimp farmers used a variety <strong>of</strong> single ingredient<br />
<strong>feeds</strong> such as clams, mussels, oysters, snails, trash fish, chicken <strong>of</strong>fal <strong>and</strong> beef<br />
(Alagarswami <strong>and</strong> Ahamad Ali, 2000) or mixed farm-made <strong>feeds</strong> consisting <strong>of</strong> up to<br />
three or four ingredients such as dry fish powder, oil cakes (mainly groundnut), rice<br />
bran <strong>and</strong> cereals (wheat, rice or maize). Examples <strong>of</strong> some farm-made <strong>feeds</strong> are given<br />
in Table 16. The mixed farm-made <strong>feeds</strong> are cooked <strong>and</strong> presented as dough balls or<br />
in the <strong>for</strong>m <strong>of</strong> “spaghetti”, both in moist <strong>and</strong> dry <strong>for</strong>m. These are made by extruding<br />
the cooked mix through a h<strong>and</strong> or electrically operated meat mincer. These practices<br />
have largely been phased out <strong>and</strong> replaced by the “made to order <strong>feeds</strong> or custom<br />
TABLE 16<br />
Examples <strong>of</strong> farm-made feed <strong>for</strong>mulations used by shrimp farmers in various states <strong>of</strong> India<br />
during the mid 1980s<br />
Ingredients %<br />
Andhra Pradesh Karnataka<br />
State<br />
Kerala Maharashtra Tamil Nadu West Bengal<br />
Dried fish powder 21.0 20.0 - 50.0 16.0 32.0<br />
Clam meat - 5.0 50.0 - - -<br />
Squilla - - - - 16.0 -<br />
Snail meat - - - - 20.0 -<br />
Shrimp waste 20.0 - - - - -<br />
Bone meal 20.0 - - - 20.0 -<br />
Fish oil 1.0 - 3.0 - - -<br />
Soybean oil 1.0 - - - - -<br />
Soybean cake 20.0 - - 15.0 - -<br />
Groundnut cake - 15.0 30.0 10.0 - -<br />
Mustard cake - - - - - 33.0<br />
Rice flour - 10.0 - - - -<br />
Rice bran 10.0 50.0 15.0 10.0 16.0 33.0<br />
Wheat flour - - - 10.0 - -<br />
Tapioca flour 6.0 - - - 10.0 -<br />
Vitamin/mineral mix 1.0 - 2.0 5.0 2.0 2.0<br />
Form <strong>of</strong> feed used/<br />
presentation<br />
Ball/pellet Dry powder Ball Pellet Ball/pellet Dry<br />
powder<br />
FCR 2.5–3.0 3.0 3.5 3.0–4.0 2.5–3.0 2.0–2.5<br />
Production<br />
(kg/ha/crop)<br />
500–700 700–900 700–900 700–900 700–900 400–5 000<br />
Source: N<strong>and</strong>eesha (1993)
Analysis <strong>of</strong> <strong>feeds</strong> <strong>and</strong> <strong>fertilizers</strong> <strong>for</strong> <strong>sustainable</strong> aquaculture development in India 209<br />
made <strong>feeds</strong>” <strong>and</strong> commercially<br />
produced, nutritionally complete<br />
<strong>feeds</strong>. The “made to order <strong>feeds</strong>”<br />
are manufactured by small-scale<br />
feed manufacturers who custom<br />
make the <strong>feeds</strong> based on the<br />
individual <strong>for</strong>mulations as well as<br />
the requirement <strong>of</strong> their clients.<br />
Over 20 <strong>of</strong> these small-scale feed<br />
millers operate in Andhra Pradesh<br />
alone. These feed manufacturers<br />
use mainly low-value dry fishmeal,<br />
mantis shrimp (Squilla), shrimp<br />
waste, peanut <strong>and</strong> soybean oilseed<br />
cake, crude fish oil, cereal flours<br />
<strong>and</strong> rice bran in addition to some<br />
low-cost additives such as lecithin,<br />
vitamins <strong>and</strong> mineral mixes (see<br />
Table 17 <strong>for</strong> list <strong>of</strong> feed ingredients)<br />
<strong>and</strong> orders <strong>of</strong> between 25 <strong>and</strong><br />
1 000 kg <strong>of</strong> feed are manufactured.<br />
The manufacturer charges the<br />
cost <strong>of</strong> ingredients <strong>and</strong> a processing<br />
cost <strong>of</strong> US$58–70/tonne, with the<br />
total cost <strong>of</strong> feed ranging from<br />
US$0.3–0.56/kg. These custom<br />
made <strong>feeds</strong> normally have a protein content <strong>of</strong> 22–35<br />
percent, FCRs ranging from 1.8–2.5:1 <strong>and</strong> with which<br />
production levels <strong>of</strong> 400–900 kg/ha/crop are attained.<br />
This shrimp feed manufacturing sector has proved to<br />
be highly beneficial to the small <strong>and</strong> marginal farmers<br />
who are not in a position to purchase large quantities <strong>of</strong><br />
commercial <strong>feeds</strong>. Instead they can buy small quantities<br />
<strong>of</strong> feed <strong>and</strong> exercise their choice in the selection <strong>of</strong> feed<br />
ingredients.<br />
Larger farmers <strong>and</strong> corporate companies who<br />
practise semi-intensive <strong>and</strong> intensive shrimp culture use<br />
nutritionally complete extruded pelleted <strong>feeds</strong>. These<br />
<strong>feeds</strong> are manufactured by commercial scale aquafeedmillers<br />
or are imported. There are ten feed mills (see<br />
Suresh, 2007) manufacturing nutritionally complete<br />
shrimp <strong>feeds</strong> in the country. Minimum <strong>and</strong> maximum<br />
inclusion levels used by commercial feedmills are shown<br />
in Table 18. The ingredients used by the commercial<br />
feedmills include fishmeal, squid meal, squid liver meal,<br />
shrimp meal, fish soluble, fish oil, squid oil, soybean<br />
meal, lecithin, cereal flour <strong>and</strong> other essential <strong>and</strong><br />
proprietary additives. Most <strong>of</strong> the ingredients <strong>of</strong> marine<br />
origin are imported while the feed ingredients <strong>of</strong> plant<br />
origin are sourced locally (see also Suresh, 2007).<br />
These extruded <strong>feeds</strong> have protein levels <strong>of</strong> 40–45<br />
percent, FCRs <strong>of</strong> 1.2–1.5:1, cost between US$1.0–1.5/<br />
kg, with which production levels <strong>of</strong> 4–6 tonnes/ha/<br />
TABLE 17<br />
Ingredients used in the ‘made to order’ shrimp <strong>feeds</strong>, average<br />
inclusion levels <strong>and</strong> approximate cost. Inclusion levels are<br />
expressed in percent except otherwise indicated<br />
Ingredient<br />
Inclusion level<br />
(%)<br />
Cost/kg<br />
(US$)<br />
Sergisted shrimp (Acetes) 10.0 0.69<br />
Pulverized dry fishmeal 15.0 0.58<br />
Mantis shrimp (Squilla) 15.0 0.23<br />
Silkworm pupae 3–5 0.19<br />
Meat meal 3–5 0.28<br />
Fish oil 1–2 1.39<br />
Soybean meal 15.0 0.30<br />
Groundnut cake 2–5 0.23<br />
Ragi (millet) 2–5 0.20<br />
Pearl millet 2–5 0.20<br />
Rice bran 2–5 0.18<br />
Maize gluten 5–6 0.25<br />
Chicken egg As per farmers desire -<br />
Dicalcium phosphate 0.8–1.0 0.93<br />
Wheat flour 5–10 0.34<br />
Calcium carbonate 0.1–0.15 0.46<br />
Amino acid mix (methionine & lysine) 0.1–0.2 2.32<br />
Vitamin mix 0.5–1.0 3.49<br />
Zeolite 0.01 0.93<br />
Feed probiotic 1.0 kg/tonne 23.25<br />
Yeast extract (brewery residue) 1.0 kg/tonne 0.93<br />
Preservative 0.001 -<br />
Binder 0.8–1.0 3.94<br />
TABLE 18<br />
Common feed ingredients used in commercial<br />
shrimp <strong>feeds</strong> <strong>and</strong> their inclusion levels<br />
Ingredient<br />
Protein sources<br />
Inclusion level<br />
(%)<br />
Fishmeal (imported) 25–40<br />
Fishmeal (pulverized dry fish) 10–35<br />
Squid meal 3–5<br />
Sergisted shrimp (Acetes) 10–15<br />
Shrimp/head meal 5–15<br />
Mantis shrimp 10–15<br />
Silkworm pupae 7–15<br />
Soybean meal 15–30<br />
Groundnut cake 10–25<br />
Sunflower cake 10–15<br />
Sesame cake 10–15<br />
Mustard cake 10–15<br />
Corn gluten<br />
Lipid sources<br />
10–15<br />
Fish oil 2–3<br />
Lecithin<br />
Carbohydrate/energy sources<br />
0.5–2.0<br />
Wheat flour 10–30<br />
Refined wheat flour 10–30<br />
Rice flour 10–30<br />
Rice bran 8–15<br />
Tapioca flour<br />
Binders<br />
10–25<br />
Guar gum 1–3<br />
Wheat gluten 3–5<br />
Binder 0.5–1.0
COURTESY OF S. AHMAD ALI<br />
COURTSEY OF A.V. SURESH<br />
210<br />
<strong>Study</strong> <strong>and</strong> <strong>analysis</strong> <strong>of</strong> <strong>feeds</strong> <strong>and</strong> <strong>fertilizers</strong> <strong>for</strong> <strong>sustainable</strong> aquaculture development<br />
FIGURE 5<br />
Indigenous aerator used in a shrimp culture pond<br />
Small <strong>and</strong> marginal shrimp farmers use indigenously assembled<br />
aerators which are less expensive than industrially made aerators.<br />
These locally made/assembled aerators are operated using diesel<br />
engines where electricity is not available at the farm site.<br />
FIGURE 6<br />
Shrimp feed top-coated with additives by the farmer<br />
As a common practice shrimp farmers in India coat the feed with<br />
different feed additives including probiotics, immunostimulants,<br />
vitamin C, fish oil <strong>and</strong> egg albumin through surface coating <strong>of</strong> the<br />
pellets. These feed additives are perceived by the farmers as feed<br />
attractant <strong>and</strong> growth promoter.<br />
crop are achieved. All these <strong>feeds</strong><br />
are readily available in the market<br />
(<strong>for</strong> further detail see Suresh, 2007).<br />
The industrial feedmills produce a<br />
minimum <strong>of</strong> three grades <strong>of</strong> <strong>feeds</strong><br />
namely, starter, grower <strong>and</strong> finisher.<br />
The shrimp feed industry has grown<br />
substantially over the last 15 years<br />
<strong>and</strong> the consumption <strong>of</strong> shrimp <strong>and</strong><br />
prawn <strong>feeds</strong> has increased from 30 000<br />
tonnes during the early 1990s to 193<br />
500 tonnes in 2004 (see Suresh, 2007).<br />
On-farm shrimp feed management<br />
campaigns are conducted regularly<br />
by different agencies in order to train<br />
shrimp farmers <strong>and</strong> to ensure that<br />
they use good management practices<br />
(GMP) <strong>for</strong> <strong>sustainable</strong> shrimp<br />
farming. These campaigns have been<br />
successful.<br />
Prior to stocking, farmers ensure<br />
proper development <strong>of</strong> a natural<br />
food web (phytoplankton <strong>and</strong><br />
zooplankton) in the pond through<br />
the application <strong>of</strong> organic manure<br />
<strong>and</strong> <strong>fertilizers</strong>. Shrimp seed (>PL 20)<br />
from hatcheries are acclimatized to<br />
pond conditions by adding water to<br />
the seed containers be<strong>for</strong>e they are<br />
stocked in ponds. Most commonly<br />
in the first two weeks external feed is<br />
not provided. Some farmers use a prestarter<br />
powder which is broadcasted<br />
over the pond. The rate <strong>of</strong> feeding<br />
at this stage varies from 20 to 100<br />
percent <strong>of</strong> the estimated biomass <strong>of</strong><br />
the PLs. After two weeks the shrimp<br />
are fed with a starter grade feed (0.5<br />
to 1.0 mm size) at the rate <strong>of</strong> 8–10<br />
percent <strong>of</strong> the biomass. The daily<br />
ration is fed 3–4 times a day <strong>and</strong> feeding trays are used to monitoring consumption<br />
<strong>and</strong> to adjust the ration. Aerators <strong>for</strong> increasing dissolved oxygen in ponds are used as<br />
<strong>and</strong> when required (Figure 5). Small boats are used to broadcast the feed uni<strong>for</strong>mly. By<br />
the time the shrimp reaches a harvestable size, the rate <strong>of</strong> feeding has gradually been<br />
reduced to 2–3 percent <strong>of</strong> biomass. A typical feeding schedule used in shrimp farms is<br />
given in Table 19.<br />
Since the emergence <strong>of</strong> White Spot Viral Syndrome on Indian shrimp farms, water<br />
exchange procedures have changed radically. Farmers now change their water less<br />
<strong>of</strong>ten <strong>for</strong> fear <strong>of</strong> disease outbreaks. Water exchanges are done only when necessary <strong>and</strong><br />
some farmers practise zero water exchange. In some areas farmers have resorted to the<br />
use <strong>of</strong> reservoir ponds, in which water is treated with chlorine prior to using it in the<br />
ponds. It is now also common practice <strong>for</strong> farmers to coat the <strong>feeds</strong> with probiotics <strong>and</strong><br />
immunostimulants (Figure 6). Additional Vitamin C is <strong>of</strong>ten added through surface
Analysis <strong>of</strong> <strong>feeds</strong> <strong>and</strong> <strong>fertilizers</strong> <strong>for</strong> <strong>sustainable</strong> aquaculture development in India 211<br />
TABLE 19<br />
A typical feeding schedules used by shrimp farms in India at stocking densities <strong>of</strong> 5 <strong>and</strong> 10 PLs/m 2<br />
Mean<br />
weight<br />
(g)<br />
Expected<br />
survival<br />
(%)<br />
Rate <strong>of</strong> feeding<br />
(% <strong>of</strong> body weight)*<br />
Quantity <strong>of</strong> feed<br />
(kg/day)*<br />
Week<br />
5/m2 10/m2 5/m2 10/m2 1 0.5 90 nil - nil 2.0<br />
2 1.0 89 nil - nil 4.0<br />
3 2.0 88 4.0 6.0 3.5 10.5<br />
4 2.9 87 3.8 5.5 4.8 13.9<br />
5 3.9 85 3.6 5.0 5.9 16.6<br />
6 5.0 84 3.4 4.8 7.1 20.2<br />
7 6.2 84 3.2 4.6 8.3 23.9<br />
8 7.5 83 3.0 4.4 9.3 27.4<br />
9 9.0 82 3.0 4.0 11.0 29.5<br />
10 11.0 80 3.0 3.8 13.2 33.4<br />
11 14.0 78 2.8 3.4 15.2 37.1<br />
12 16.0 76 2.5 3.2 15.2 38.9<br />
13 18.5 75 2.4 2.8 16.2 38.9<br />
14 20.0 74 2.3 2.7 17.0 40.0<br />
15 22.5 73 2.2 2.5 18.0 41.0<br />
16 25.0 72 2.0 2.3 18.0 41.4<br />
17 28.0 71 2.0 2.1 19.8 41.7<br />
18 31.0 70 2.0 2.0 21.7 43.4<br />
19 33.0 70 1.9 2.0 22.0 46.2<br />
20 35.0 70 1.8 1.9 22.0 46.2<br />
*The above figures are guidelines. The actual figures should be calculated by periodic sampling <strong>and</strong> recording the<br />
average weight <strong>and</strong> estimated survival.<br />
Source: Ahamad Ali, Gopal <strong>and</strong> Ramana (2000)<br />
coating <strong>of</strong> the feed pellets. Fish oil, egg albumin <strong>and</strong> gels are used <strong>for</strong> surface coating.<br />
In their anxiety to grow <strong>and</strong> harvest shrimp successfully farmers are <strong>of</strong>ten convinced/<br />
persuaded to use various other products, though there is no evidence to show that such<br />
products have any beneficial effect.<br />
4. PROBLEMS AND CONSTRAINTS OF AQUACULTURE FEEDS AND FEEDING<br />
4.1 Freshwater aquaculture<br />
Suresh (2007) identified freshwater fish nutrition <strong>and</strong> feeding as the most important<br />
limiting factors <strong>for</strong> the <strong>sustainable</strong> development <strong>of</strong> aquaculture in India. The major<br />
constraints faced by carp farmers are problems related to the quality <strong>and</strong> cost <strong>of</strong> feed<br />
ingredients. Rice bran <strong>of</strong>ten contains excess rice husk <strong>and</strong> oilseed cakes contain an<br />
excess <strong>of</strong> seed shells <strong>and</strong> the use <strong>of</strong> commercially manufactured <strong>feeds</strong> is uneconomical.<br />
The constraints faced by carnivorous fish farmers are the supply, transportation, cost<br />
<strong>and</strong> storage <strong>of</strong> trash fish, poultry <strong>of</strong>fal <strong>and</strong> silkworm pupae. In the absence <strong>of</strong> cold<br />
storage facilities they also face health risks in h<strong>and</strong>ling animal by-products.<br />
Farmers also face constraints in farm-made feed preparation. Due to the lack<br />
<strong>of</strong> proper infrastructure, facilities <strong>and</strong> equipment <strong>and</strong> the high cost <strong>of</strong> fuel, many<br />
farmers do not cook the ingredients, resulting in wastage <strong>of</strong> feed <strong>and</strong> deterioration <strong>of</strong><br />
pond water quality. Nevertheless, despite the drawbacks, farmers have demonstrated<br />
that Indian carps can be successfully farmed on a commercial scale through proper<br />
fertilization <strong>and</strong> skilful on-farm feed management strategies using locally available low<br />
cost <strong>feeds</strong>.<br />
The most serious constraint facing the aquafeed manufacturing industry is the<br />
supply <strong>of</strong> indigenous marine ingredients <strong>and</strong> increasing prices <strong>of</strong> imported ingredients<br />
such as fishmeal. Moreover, there are no <strong>of</strong>ficial prawn or shrimp feed st<strong>and</strong>ards. This<br />
puts farmers at a disadvantage as the <strong>feeds</strong> made by small-scale producers are <strong>of</strong>ten not<br />
<strong>for</strong>mulated according to the nutritional requirements <strong>of</strong> the species <strong>and</strong> <strong>feeds</strong> are <strong>of</strong>ten<br />
made with poor quality raw materials.
212<br />
<strong>Study</strong> <strong>and</strong> <strong>analysis</strong> <strong>of</strong> <strong>feeds</strong> <strong>and</strong> <strong>fertilizers</strong> <strong>for</strong> <strong>sustainable</strong> aquaculture development<br />
4.2 Brackish-water aquaculture<br />
As mentioned earlier, a total <strong>of</strong> 193 500 tonnes <strong>of</strong> shrimp feed are used annually. The<br />
major feed companies which produce nutritionally balanced <strong>feeds</strong> use high quality<br />
feed ingredients such as fishmeal, squid meal <strong>and</strong> other squid products, shrimp meal,<br />
fish soluble <strong>and</strong> fish oil, all <strong>of</strong> which are imported. The large animal <strong>and</strong> aquafeed<br />
manufacturing companies are exempt from customs duty on many <strong>of</strong> these imported<br />
raw materials.<br />
The small-scale feed companies use dry trash fishmeal, shrimp head meal, shrimp<br />
meal, mantis shrimp meal <strong>and</strong> fish oil, but are facing increasing levels <strong>of</strong> competition<br />
from other users. The pulverized fishmeal used by most <strong>of</strong> these smaller companies is<br />
not <strong>of</strong> the desired quality <strong>and</strong> is <strong>of</strong>ten contaminated with shrimp head meal, mantis<br />
shrimp powder <strong>and</strong> s<strong>and</strong> (see Suresh, 2007). Moreover, the local fish oil hardly con<strong>for</strong>ms<br />
to international quality st<strong>and</strong>ards <strong>and</strong> is <strong>of</strong>ten rancid. Farmers <strong>and</strong> the smaller feed<br />
producers are constrained by access to appropriate machinery when making shrimp<br />
feed in accordance with the required quality <strong>and</strong> water stability. At present, most <strong>of</strong> the<br />
feed producers use imported binders such as wheat gluten <strong>and</strong> polymethylolcarbamide,<br />
although some <strong>of</strong> the feed manufacturers use indigenously available guar gum.<br />
Small <strong>and</strong> marginal shrimp farmers <strong>of</strong>ten get themselves into credit trap. They<br />
obtain feed <strong>and</strong> other inputs on a credit basis from the feed dealers with a buy-back<br />
arrangement upon which the farmer has to sell the harvest to the dealer. If there is a<br />
crop failure due to disease, the dealer advances the inputs on credit once again <strong>and</strong> the<br />
farmers have to clear their accumulated debt on harvesting the crop. In this process the<br />
farmer receives a lower price than on the open market. The farmer also loses his/her<br />
bargaining power <strong>and</strong> ends up paying a higher price <strong>for</strong> feed. Most <strong>of</strong> the larger feed<br />
companies can provide credit to farmers <strong>and</strong> wait <strong>for</strong> 3–4 months till when the shrimps<br />
are harvested <strong>for</strong> repayment. Smaller shrimp feed producers are unable to compete in<br />
this arena as they do not have the capital reserves to deal with crop failure. Moreover,<br />
there are no <strong>of</strong>ficial feed st<strong>and</strong>ards <strong>for</strong> shrimp <strong>feeds</strong> in the country at present, as there<br />
are <strong>for</strong> other livestock <strong>feeds</strong>. This places the shrimp farmer at a serious disadvantage.<br />
Fluctuating prices <strong>of</strong> shrimp <strong>and</strong> stringent quality <strong>and</strong> food safety st<strong>and</strong>ards <strong>for</strong> shrimp<br />
on the global market have been pushing farmers to bankruptcy. With the present<br />
scenario, farmers are looking towards developing low cost, high quality <strong>feeds</strong> <strong>for</strong><br />
shrimp farming in India so that the activity remains pr<strong>of</strong>itable <strong>and</strong> is environmentally<br />
<strong>sustainable</strong>.<br />
5. RESOURCE AVAILABILITY AND EXPANSION OF THE AQUACULTURE<br />
INDUSTRY<br />
Aquaculture provides the only alternative opportunity to supply India’s growing<br />
dem<strong>and</strong> <strong>for</strong> fish. In terms <strong>of</strong> l<strong>and</strong> <strong>and</strong> water resources aquaculture can exp<strong>and</strong>. However,<br />
the increasing dem<strong>and</strong> <strong>for</strong> <strong>feeds</strong> <strong>and</strong> feed ingredients may restrict the development <strong>of</strong><br />
the sector. Aquaculture production is expected to reach 6.282 million tonnes by 2020<br />
(Table 20). To achieve this goal depends largely on an adequate nutrient resource base.<br />
The dem<strong>and</strong> <strong>for</strong> organic manures is expected to rise to 190.66 million tonnes (Table 21)<br />
<strong>and</strong> approximately 200 000 tonnes <strong>of</strong> nitrogenous as well as phosphate <strong>fertilizers</strong> will<br />
be required. Given current fertilizer production capacity (19.42 <strong>and</strong> 2.41 million tonnes<br />
<strong>for</strong> nitrogen <strong>and</strong> phosphorus <strong>fertilizers</strong>, respectively during 2003–2004) (see Table 8)<br />
it was concluded that the availability <strong>of</strong> fertilizer will not constrain the expansion <strong>and</strong><br />
development <strong>of</strong> the sector. However, there is going to be pressure on the supply <strong>of</strong><br />
organic manures due to the increasing dem<strong>and</strong> <strong>for</strong> organic food production, which is<br />
gaining popularity.<br />
Freshwater fish culture is expected to continue using current culture <strong>and</strong> feeding<br />
practices. Hence, the projected requirements <strong>for</strong> rice bran <strong>and</strong> wheat bran will increase<br />
from 85 800 tonnes, which is currently used, to 163 020 tonnes (Table 22). This is
Analysis <strong>of</strong> <strong>feeds</strong> <strong>and</strong> <strong>fertilizers</strong> <strong>for</strong> <strong>sustainable</strong> aquaculture development in India 213<br />
TABLE 20<br />
Present (2004) <strong>and</strong> projected aquaculture growth by 2020 in India<br />
Present (2004) Projected (2020)<br />
Sector<br />
Area under<br />
aquaculture<br />
(thous<strong>and</strong> ha)<br />
Production<br />
(million<br />
tonnes/year)<br />
Growth rate<br />
(%)<br />
Area under<br />
aquaculture<br />
(thous<strong>and</strong> ha)<br />
Production<br />
(million<br />
tonnes/year)<br />
possible since the projected requirement is only 3.5 percent <strong>of</strong> the currently available<br />
quantity <strong>of</strong> rice <strong>and</strong> wheat bran. Hence it can be assumed that the availability <strong>of</strong> rice<br />
bran <strong>and</strong> wheat bran will not constrain development.<br />
The dem<strong>and</strong> <strong>for</strong> oilseed cakes is likely to increase from 5 980 tonnes (current use)<br />
to 11 370 tonnes. The current local supply <strong>of</strong> oilseed cakes amounts to some 22.1<br />
Growth rate<br />
(%)<br />
Freshwater fish<br />
culture<br />
600 2.640 6.6 1 000 5.020 6.0<br />
Freshwater<br />
prawn culture<br />
42 0.035 - 80 0.066 6.0<br />
Penaeid shrimp<br />
culture<br />
150 0.115 - 250 0.236 7.0<br />
Brackish-water<br />
fish culture<br />
10 0.010 - 40 0.960 6.0<br />
Total 802 2.800 1 370 6.282<br />
TABLE 21<br />
Present (2004) <strong>and</strong> projected fertilizer requirements by 2020 in India<br />
Fertilizer & manure<br />
I- Freshwater fish culture<br />
a. Nitrogen fertilizer<br />
b. Phosphate fertilizer<br />
c. Organic manure<br />
II- Freshwater prawn culture<br />
a. Nitrogen fertilizer<br />
b. Phosphate fertilizer<br />
c. Organic manure<br />
III- Brackish-water shrimp culture<br />
a. Nitrogen fertilizer<br />
b. Phosphate fertilizer<br />
c. Organic manure<br />
IV- Brackish-water finfish culture<br />
a. Nitrogen fertilizer<br />
b. Phosphate fertilizer<br />
c. Organic manure<br />
Average application<br />
(kg/ha/year)<br />
200<br />
200<br />
20 000<br />
45<br />
45<br />
2500<br />
15<br />
10<br />
1250<br />
Quantity used<br />
(thous<strong>and</strong> tonnes)<br />
100<br />
100<br />
100 000<br />
1.6<br />
1.6<br />
86.6<br />
1.5<br />
1.0<br />
125.0<br />
Total quantity<br />
required by 2020<br />
(thous<strong>and</strong> tonnes)<br />
190<br />
190<br />
190 150<br />
3.05<br />
3.05<br />
164.50<br />
2.25<br />
1.50<br />
187.50<br />
NA NA 3.92<br />
3.92<br />
165.50<br />
TABLE 22<br />
Present (2004) <strong>and</strong> projected use <strong>of</strong> <strong>feeds</strong> <strong>and</strong> feed ingredient <strong>and</strong> the requirements by 2020<br />
<strong>for</strong> freshwater aquaculture <strong>and</strong> marine shrimp culture in India<br />
Major feed/feed ingredients<br />
Present (2004) use per annum<br />
(tonnes)<br />
Projected requirement per<br />
annum by 2020 (tonnes)<br />
Freshwater aquaculture<br />
Rice bran & wheat bran 85 800 163 020<br />
Oil cakes 5 980 11 370<br />
Marine ingredients (<strong>for</strong> prawn <strong>feeds</strong>) 6 000 10 000<br />
Others<br />
Shrimp culture<br />
2 600 4 940<br />
Formulated feed 193 500 307 500<br />
Fishmeal 36 000 73 800<br />
Squid meal 2 700 5 535<br />
Shrimp meal 11 250 23 062<br />
Mantis shrimp meal 15 000 30 750<br />
Soybean meal 33 000 67 650<br />
Cereal flour 30 000 61 500<br />
Fish oil 4 500 9 225<br />
Lecithin 750 1 537<br />
Binders 1 500 3 075
214<br />
<strong>Study</strong> <strong>and</strong> <strong>analysis</strong> <strong>of</strong> <strong>feeds</strong> <strong>and</strong> <strong>fertilizers</strong> <strong>for</strong> <strong>sustainable</strong> aquaculture development<br />
million tonnes per annum. The projected requirement <strong>for</strong> oil cakes <strong>for</strong> aquaculture in<br />
2020 constitutes 0.06 percent <strong>of</strong> the current total supply. There are alternative <strong>feeds</strong><br />
<strong>and</strong> feed ingredients which are not fully explored <strong>and</strong> exploited. Important among<br />
these are Azolla based aquaculture <strong>of</strong> Indian major carps <strong>and</strong> the use <strong>of</strong> duckweed <strong>for</strong><br />
carp culture. Table 14 lists some <strong>of</strong> the non-conventional ingredients that need further<br />
exploration <strong>and</strong> exploitation.<br />
Giant freshwater prawn culture is growing rapidly due to the availability <strong>of</strong> hatchery<br />
produced seed <strong>and</strong> improved economic returns. The sector is expected to exp<strong>and</strong> to a<br />
production level <strong>of</strong> 55 000–60 000 tonnes per annum by 2020. Freshwater prawn <strong>feeds</strong><br />
contain approximately 20–25 percent <strong>of</strong> animal ingredients, besides agricultural byproducts<br />
such as oilseed cake <strong>and</strong> cereal bran. The expected increase in prawn production,<br />
particularly by smaller farms, will put pressure on the supply <strong>of</strong> dry trash fish <strong>and</strong> mantis<br />
shrimp meal. The poultry industry is the greatest competitor (Wood <strong>and</strong> Coulter, 1988;<br />
Ahamad Ali et al., 1995) <strong>for</strong> these ingredients. However, given the reduction in the<br />
inclusion rates <strong>of</strong> fishery products <strong>and</strong> by-products in poultry <strong>feeds</strong> it is reasonably safe<br />
to assume that the supply will meet the future dem<strong>and</strong> <strong>of</strong> the aquafeed industry.<br />
Shrimp culture is projected to grow at around 7–8 percent per annum to reach<br />
236 000 tonnes by 2020. The projected feed requirements <strong>for</strong> this level <strong>of</strong> production<br />
are outlined in Table 22. The currently available total volume <strong>of</strong> marine ingredients<br />
used <strong>for</strong> animal <strong>feeds</strong> in India is in the region <strong>of</strong> 335 191 tonnes. The total projected<br />
dem<strong>and</strong> <strong>for</strong> dry fish, shrimp meal, mantis shrimp meal by small-scale feed producers<br />
is in the region <strong>of</strong> 137 612 tonnes. The dem<strong>and</strong> <strong>of</strong> the industrial scale feedmillers will<br />
continue to be met through imports. Under this scenario both the small-scale <strong>and</strong> the<br />
industrial animal feedmills will be able to supply the needs <strong>of</strong> the sector in future.<br />
The dem<strong>and</strong> <strong>for</strong> soybean meal, cereal flour <strong>and</strong> fish oil is approximately 67 650<br />
tonnes, 61 500 tonnes <strong>and</strong> 9 225 tonnes, respectively. The soybean meal <strong>and</strong> cereal flour<br />
requirements can easily be met by domestic production. Fish oil will however be in<br />
short supply <strong>and</strong> there is a need to explore the replacement <strong>of</strong> fish oil with other edible<br />
oils especially with vegetable oils.<br />
6. RECOMMENDATIONS FOR IMPROVED UTILIZATION OF FERTILIZER AND<br />
FEED RESOURCES AND SUGGESTED POLICY GUIDELINES<br />
For aquaculture to develop in a <strong>sustainable</strong> manner, India requires focused attention<br />
on input needs such as <strong>fertilizers</strong>, feed <strong>and</strong> seed. With regard to the distribution <strong>of</strong><br />
<strong>fertilizers</strong>, aquaculture should be brought under the same policy umbrella as the<br />
agriculture sector. Fish, prawn <strong>and</strong> shrimp farmers should be able to join co-operatives<br />
to improve <strong>and</strong> ease the supply <strong>of</strong> <strong>fertilizers</strong>. With regards to <strong>feeds</strong>, attention should be<br />
focused on the elimination <strong>of</strong> anti-nutritional factors that are present in certain oilseed<br />
cakes <strong>and</strong> on feed stability. Water unstable <strong>feeds</strong> lead to waste <strong>and</strong> water pollution.<br />
Farmers should be encouraged to use simple binders to enhance water stability <strong>of</strong> their<br />
farm-made <strong>feeds</strong>. This would lead to greater pr<strong>of</strong>itability <strong>and</strong> a reduction in nutrient<br />
loading. The available in<strong>for</strong>mation on feed management <strong>and</strong> economic efficiency <strong>of</strong><br />
freshwater fish production should be more actively promoted. Whenever possible<br />
<strong>and</strong> pr<strong>of</strong>itable, farmers should be encouraged to use extruded pellets to improve<br />
feed efficiency. Given the future projections <strong>for</strong> aquaculture, agriculture should be<br />
encouraged to produce crops that are suitable <strong>for</strong> inclusion into aqua<strong>feeds</strong>.<br />
Shrimp aquaculture depends heavily on fishmeal <strong>and</strong> other marine products <strong>and</strong><br />
the aquafeed industry is already in the grip <strong>of</strong> the fishmeal trap. To steer clear <strong>of</strong> this<br />
trap, the search <strong>for</strong> alternative protein sources to replace fishmeal must be aggressively<br />
pursued <strong>and</strong> the production <strong>of</strong> soybeans <strong>for</strong> aqua<strong>feeds</strong> should be actively promoted.<br />
Fishmeal in India is a scarce commodity. To improve the quality <strong>of</strong> the locally<br />
produced fishmeal <strong>and</strong> fish powder there is a need to focus on quality control. This can<br />
be achieved by improving the technologies <strong>for</strong> drying in order to eliminate s<strong>and</strong> <strong>and</strong>
Analysis <strong>of</strong> <strong>feeds</strong> <strong>and</strong> <strong>fertilizers</strong> <strong>for</strong> <strong>sustainable</strong> aquaculture development in India 215<br />
other contaminants. Similar measures are required to deal with mantis shrimp, shrimp<br />
waste <strong>and</strong> sergisted shrimp.<br />
During the early 1990s some 690 000 tonnes <strong>of</strong> bycatch was dumped by trawlers per<br />
annum (Wood et al., 1992). There is good reason to believe that the situation has not<br />
changed much. At an average reduction rate <strong>of</strong> 23 percent the dumped trash fish during<br />
that time would yield approximately 158 700 tonnes <strong>of</strong> high quality fishmeal. The<br />
economic feasibility <strong>of</strong> on-board fishmeal plants should there<strong>for</strong>e be investigated.<br />
To improve feed <strong>and</strong> nutrient utilization there is a need to pay attention to the<br />
following:<br />
• investigate the improved utilization <strong>of</strong> high energy diets (Peisker, 2001);<br />
• improve the digestibility <strong>of</strong> the current high energy aqua<strong>feeds</strong> through<br />
biotechnological innovations, such as exogenous digestive bio-enzymes, probiotics<br />
<strong>and</strong> solid-state fermentation <strong>of</strong> selected feed ingredients;<br />
• develop more comprehensive feed management protocols to reduce wastage <strong>and</strong><br />
to improve the utilization <strong>of</strong> available nutrients to improve FCRs <strong>and</strong> reduce<br />
environmental health risks; <strong>and</strong><br />
• pay greater attention to fish <strong>and</strong> shrimp health, food safety <strong>and</strong> environmental<br />
st<strong>and</strong>ards. This is particularly important with respect to consumer dem<strong>and</strong>s such<br />
as “green” products, the unacceptable practice <strong>of</strong> using trash fish as fish feed<br />
<strong>and</strong> the dem<strong>and</strong> <strong>for</strong> fish <strong>and</strong> shrimp rich in polyunsaturated fatty acids to meet<br />
consumer preference (Rosenlund, 2001).<br />
Globally, environmental issues are going to play a dominant role in how aquaculture<br />
will be practised in future. For aquaculture to develop in a <strong>sustainable</strong> manner in India,<br />
fish <strong>and</strong> shrimp must be produced with minimal environmental impact. For this reason<br />
processing technologies, feed <strong>for</strong>mulation <strong>and</strong> feed management practices have to be<br />
improved to optimize apparent digestibility coefficients <strong>of</strong> the various ingredients.<br />
ACKNOWLEDGEMENTS<br />
The authors express their sincere appreciation to Dr P. Kumariah <strong>and</strong> Dr P.V.<br />
Rangacharyulu <strong>for</strong> their help <strong>and</strong> assistance <strong>and</strong> to Sri. M.V.S. Nagi Reddy, <strong>for</strong> valuable<br />
on-farm discussions.<br />
REFERENCES<br />
Ahamad Ali, S. 1982. Relative efficiencies <strong>of</strong> pelletized <strong>feeds</strong> compounded with different<br />
animal proteins <strong>and</strong> the effect <strong>of</strong> protein level on the growth <strong>of</strong> the prawn Penaeus indicus.<br />
Proc. Symp. Coastal aquaculture, Marine Biological Association <strong>of</strong> India, 1: 321–328.<br />
Ahamad Ali, S. & Mohamed, K.H. 1982. Utilisation <strong>of</strong> prawn waste <strong>and</strong> mantis shrimp <strong>for</strong><br />
compounding <strong>feeds</strong> <strong>for</strong> the culture <strong>of</strong> penaeid prawns, pp. 615–616. Proc. Symp. Harvest<br />
<strong>and</strong> post-harvest technology, 24-27 November 1982. India, Soc. Fish. Tech.<br />
Ahamad Ali, S. 1988. Water stability <strong>of</strong> prawn feed pellets prepared using different binding<br />
materials with special reference to tapioca. Indian J. Fish, 35: 46–51<br />
Ahamad Ali, S. 1992. Evaluation <strong>of</strong> some animal <strong>and</strong> plant protein sources in the diet <strong>of</strong><br />
the shrimp Penaeus indicus. Asian Fishery Science, 5: 277–289.<br />
Ahamad Ali, S., Rangaswamy, C.P., Narayanaswamy, D. & Gopal, C. 1995. Marine protein<br />
sources availability in India as raw materials <strong>for</strong> prawn <strong>feeds</strong>. CIBA, Bulletin No.9, March<br />
1995. Chennai, India, Central Institute <strong>of</strong> Brackish-water Aquaculture. 34 pp.<br />
Ahamad Ali, S. 1998. Studies on the use <strong>of</strong> cuttlefish waste <strong>and</strong> squid waste in shrimp<br />
feed <strong>for</strong>mulations. Proc. Symp. on advances <strong>and</strong> priorities in fisheries technology, 11-13<br />
February 1998. Cochin, India, Society <strong>of</strong> Fisheries Technologists. pp 289–293.<br />
Ahamad Ali, S., Syama Dayal, J. & Ambasankar, K. 2004. India study: corn gluten can<br />
partially replace fishmeal in white shrimp feed. Global Aquaculture Advocate, 7(6): 60.<br />
Ahamad Ali, S., Rangaswamy, C.P., Narayanaswamy, D. & Gopal, C. 1998. Raw material<br />
resources <strong>for</strong> shrimp feed production in India. Fishing Chimes, 18(3): 31–33.
216<br />
<strong>Study</strong> <strong>and</strong> <strong>analysis</strong> <strong>of</strong> <strong>feeds</strong> <strong>and</strong> <strong>fertilizers</strong> <strong>for</strong> <strong>sustainable</strong> aquaculture development<br />
Ahamad Ali, S., Gopal, C. & Ramana, J.V. 2000. Shrimp feed processing <strong>and</strong> production<br />
technology. CIBA Bulletin No.13, March 2000. Central Institute <strong>of</strong> Brackish-water<br />
Aquaculture, Chennai, India. 20 pp.<br />
Alagarswami, K. & Ahamad Ali, S. 2000. Indigenous <strong>feeds</strong> <strong>for</strong> shrimp farming<br />
– development <strong>and</strong> assessment in comparison with imported <strong>feeds</strong>. In G. John <strong>and</strong> A.S.<br />
Ninawe eds. Aquaculture feed <strong>and</strong> health, pp. 56–66. New Delhi, Biotech Consortium<br />
India Limited.<br />
Arasu, A.R.T., Abraham, M. & Kailasam, M. 2004. H<strong>and</strong> book <strong>of</strong> seed production <strong>and</strong><br />
culture <strong>of</strong> Asian seabass, Lates calcarifer (Bloch). CIBA Bulletin No.18. February 2004,<br />
Chennai, India, Central Institute <strong>of</strong> Brackish-water Aquaculture. 58 pp.<br />
Ayyappan, S. 1997. Freshwater aquaculture – towards blue revolution. National aquaculture<br />
week – 1997 Souvenir. Chennai, India, Aquaculture Foundation <strong>of</strong> India. pp. 28–33.<br />
Ayyappan, S. & Biradar, R.S. 2004. Indian Fisheries: looking ahead. Present scenario <strong>and</strong><br />
future needs <strong>of</strong> Indian Fisheries. Decennial publication <strong>of</strong> <strong>for</strong>um <strong>of</strong> fisheries pr<strong>of</strong>essionals,<br />
7-5-181, pp. 1–16. January 2004, Visakhapatnam, India, Ocean View Layout.<br />
Borthakur, S. & Sharma, K. 1998. Protein <strong>and</strong> fat digestibility <strong>of</strong> some non-conventional<br />
fishmeal replacers incorporated in the diet <strong>of</strong> fish Clarias batrachus (Linn). Environmental<br />
Ecology, 16: 368–371.<br />
Butt, J.A., Iqbal, M., Shoh, S.A., Latif, A. & Khattak, G.U.R. 1988. Studies on production<br />
<strong>of</strong> cheap feed through the used <strong>of</strong> wastes as protein <strong>and</strong> energy sources in the diet <strong>of</strong><br />
common carp (Cyprinus carpio). Pakistan Journal <strong>of</strong> Zoology, 20: 209–224.<br />
Chakrabarti, M.N. 1996. Efficacy <strong>of</strong> fish feed <strong>for</strong>mulated with fish <strong>and</strong> poultry <strong>of</strong>fal.<br />
Environmental Ecology, 14: 791–793.<br />
Dani, L.P. 2000. The use <strong>of</strong> alternate <strong>and</strong> low cost feed ingredients: viability <strong>of</strong> approach<br />
<strong>and</strong> cost <strong>analysis</strong>. In G. John <strong>and</strong> A.S. Ninawe eds. Aquaculture feed <strong>and</strong> health, pp<br />
45–55. New Delhi, Biotech Consortium India Limited.<br />
Das, D., Sikdar, K., & Chotterjee, A.K. 1994. Potential <strong>of</strong> Azolla pinnata as biogas generator<br />
<strong>and</strong> as fish feed. International Journal <strong>of</strong> Environment <strong>and</strong> Health, 36: 186–191.<br />
Devaraj, K.V., Krishna, D.V. & Keshavappa, G.Y. 1981. Utilisation <strong>of</strong> duckweed <strong>and</strong><br />
waste cabbage leaves in the <strong>for</strong>mulation <strong>of</strong> fish feed. Mysore Journal <strong>of</strong> Agricultural<br />
Sciences 15: 132–135.<br />
Dhawan, A., Kaur, V.I. & Virk, P. 2004. Non-conventional fish feed resources: an<br />
overview. Fishing Chimes, 23 (10 <strong>and</strong> 11): 66–72.<br />
FAO. 2006. Data <strong>and</strong> statistics unit. Aquaculture production: quantities 1950-2004. FAO<br />
Fisheries Department, Fishery In<strong>for</strong>mation, FISHSTAT Plus (available at http://www.<br />
fao.org/fi/statist/FISOFT/FISHPLUS.asp).<br />
Francis, G., Makkar, H.P.S. & Becker, K. 2001. Antinutritional factors present in plantderived<br />
alternate fish feed ingredients <strong>and</strong> their effects in fish. Aquaculture, 199: 197–227.<br />
Hasan, M.R. 2001. Nutrition <strong>and</strong> feeding <strong>for</strong> <strong>sustainable</strong> aquaculture development in<br />
the third millennium. In R.P. Subasinghe, P. Bueno, M.J. Phillips, C. Hough, S.E.<br />
McGladdery & J.R. Arthur, eds. Aquaculture in the third millennium, 193–219 pp.<br />
Technical proceedings <strong>of</strong> the conference on aquaculture in the third millennium,<br />
Bangkok, Thail<strong>and</strong>, 20-25 February 2000, Bangkok, NACA <strong>and</strong> Rome, FAO.<br />
IASRI (Indian Agricultural Statistics Research Institute). 2004. Agricultural research data<br />
book. New Delhi, Indian Council <strong>of</strong> Agricultural Research, Krishi Bhavan. 280 pp.<br />
Kathirvel, M., P<strong>and</strong>ian, S.K. & Balasubramanian, C.P. 2004. Mud crab culture in India.<br />
CIBA Bulletin No. 17. Chennai, India, Central Institute <strong>of</strong> Brackish-water Aquaculture.<br />
60 pp.<br />
Kaur, V.I. 2002. Studies on utilisation <strong>of</strong> some agro-industrial wastes in carp polyculture<br />
system. Ludhiyana, India, Punjab Agricultural University. (PhD dissertation).<br />
MPEDA (Marine Products Export Development Authority). 2004. The Marine Products<br />
Export Development Authority, Ministry <strong>of</strong> Commerce, Government <strong>of</strong> India, Cochin,<br />
India, website: http://www.mpeda.com.
Analysis <strong>of</strong> <strong>feeds</strong> <strong>and</strong> <strong>fertilizers</strong> <strong>for</strong> <strong>sustainable</strong> aquaculture development in India 217<br />
Mohanty, S.N. & Das, S.P. 1995. Evaluation <strong>of</strong> Azolla caroliniana <strong>for</strong> inclusion in carp<br />
diet. Journal <strong>of</strong> Aquaculture in the Tropics, 10: 343–353.<br />
Mondal, T.K. & Ray, A.K. 1996. The nutritive value <strong>of</strong> Acacia auriculi<strong>for</strong>mis leaf meal<br />
in compounded diets <strong>for</strong> rohu, Labeo rohita fingerlings. The fourth Indian fisheries<br />
<strong>for</strong>um, 164 p. 24–28 November 1996, Cochin, India, Cochin University <strong>of</strong> Science <strong>and</strong><br />
Technology.<br />
Mukhopadhyay, P.K. & Ray, A.K. 1997. The apparent total <strong>and</strong> nutrient digestibility <strong>of</strong> sal<br />
sees meal in rohu, Labeo rohita (Ham.) fingerlings. Aquaculture Research, 28: 683–689.<br />
N<strong>and</strong>eesha, M.C. 1993. Aqua<strong>feeds</strong> <strong>and</strong> feeding strategies in India. In M.B., New, A.G.J<br />
Tacon, <strong>and</strong> I. Csavas, eds. Farm-made aqua<strong>feeds</strong>, RAPA Publication 1993/18 <strong>and</strong> AAD<br />
CP/PROC/5: 213–254.<br />
P<strong>and</strong>ian, T.J. 2000. Scope <strong>for</strong> live feed use, synthetic diet <strong>and</strong> feed development to enhance<br />
freshwater fish/prawn production in India. In G. John <strong>and</strong> A.S. Ninawe eds. Aquaculture<br />
feed <strong>and</strong> health, pp. 12–20. New Delhi, Biotech Consortium India Limited .<br />
Patnaik, S., Swamy, D.N., Raut, M. & Das, K.M. 1991. Use <strong>of</strong> Otellia <strong>and</strong> Nymphoides<br />
leaf meal as protein source in the feed <strong>of</strong> Indian major carp fry. National symposium on<br />
new horizon in freshwater aquaculture. Jan 23-25 1991, Bhubaneswar, India, Central<br />
Institute <strong>of</strong> Freshwater Aquaculture. pp. 100–102.<br />
Paul Raj, R. 2000. Availability <strong>of</strong> raw material <strong>and</strong> marketing <strong>of</strong> various aqua <strong>feeds</strong>. In G.<br />
John <strong>and</strong> A.S. Ninawe eds. Aquaculture feed <strong>and</strong> health, 39–44 pp. New Delhi, Biotech<br />
Consortium India Limited.<br />
Peisker, M. 2001. Amino acids in aqua<strong>feeds</strong>. International Aqua Feed, 4(3): 18–21.<br />
Rao, K.J., An<strong>and</strong>akumar, A. & Sinha, M.K. 1999. Giant freshwater prawn culture in<br />
Nellore region <strong>of</strong> Andhra Pradesh – status <strong>and</strong> strategy <strong>for</strong> development. Orissa, India,<br />
Central Institute <strong>of</strong> Freshwater Aquaculture, Bhubaneswar. 22 pp.<br />
Ray, A.K. & Das, I. 1995. Evaluation <strong>of</strong> dried aquatic weed, Pistia stratiotes meal as a feed<br />
stuff in pelleted feed <strong>for</strong> rohu, Labeo rohita fingerlings. Journal <strong>of</strong> Applied Aquaculture,<br />
5: 35–44.<br />
Rosenlund, G. 2001. The potential <strong>for</strong> using vegetable oils in salmon <strong>feeds</strong>. International<br />
Aqua Feed, 4(3):12–14.<br />
Sehagal, H.S. & Sharma, S. 1991. Efficacy <strong>of</strong> two supplementary diets <strong>for</strong> Indian major<br />
carps, Cirrhinus mrigala: effect on flesh composition. Journal <strong>of</strong> Aquaculture in the<br />
Tropics, 6: 25–34.<br />
Singh, R. & Dhawan, A. 1993. Incorporation <strong>of</strong> molasses with mustard meal <strong>and</strong> rice polish<br />
<strong>for</strong> the development <strong>of</strong> cost effective feed <strong>for</strong> carps. Proc. Third Indian fisheries <strong>for</strong>um,<br />
Pantnagar, India. pp. 269–273.<br />
Singh, R. & Dhawan, A. 1995. Utilisation <strong>of</strong> sugar industry by-products in aquaculture.<br />
Nat. Sym. Aqua., Jammu, India, Jammu University.<br />
Singh, R., Dhawan, A. & Saxsena, P.K. 1999. Potential <strong>of</strong> press-mud a sugar factory byproduct<br />
in supplementary diets <strong>and</strong> its impact on fish growth. Bioresource Technology,<br />
67: 61–64.<br />
Singh, R., Kaur<strong>and</strong>, V. & Dhawan, A. 2000. Utilisation <strong>of</strong> poultry incubator waste in carp<br />
feed. Fifth Indian fisheries <strong>for</strong>um, Bhubaneswar, 17-20 January 2000. 49 pp.<br />
Suresh, A.V. 2007. The development <strong>of</strong> the aquafeed industry in India (this volume).<br />
Swamy, H.V.V. & Devaraj, K.V. 1995. Growth response <strong>of</strong> common carp fry fed on three<br />
<strong>for</strong>mulated <strong>feeds</strong>. International Journal <strong>of</strong> Animal Sciences, 10: 69–72.<br />
Vaitheeswaran, S. & Ahamad Ali, S. 1986. Studies on the evaluation <strong>of</strong> certain substances<br />
as growth promoting agents in the diet <strong>of</strong> the prawn Penaeus indicus. India J. Fish, 33:<br />
95–105.<br />
Vasudevappa, C. 2001. Status <strong>and</strong> scope <strong>for</strong> enhancing giant freshwater prawn production<br />
in India. International Symposium on fish <strong>for</strong> nutritional security in the 21 st century.<br />
4-6 December 2001, Versova, Mumbai, India, Central Institute <strong>of</strong> Fisheries Education<br />
(Deemed University). 154 pp.
218<br />
<strong>Study</strong> <strong>and</strong> <strong>analysis</strong> <strong>of</strong> <strong>feeds</strong> <strong>and</strong> <strong>fertilizers</strong> <strong>for</strong> <strong>sustainable</strong> aquaculture development<br />
Veerina, S.S., N<strong>and</strong>eesha, M.C., Rao, K.G. & De Silva, S.S. 1993. Status <strong>and</strong> technology<br />
<strong>of</strong> Indian major carp farming in Andhra Pradesh, India. Special Publication No. 9,<br />
Mangalore, India, Asian Fisheries Society, Indian Branch. 76 pp.<br />
Wood, J. & Coulter, J. 1988. India’s exp<strong>and</strong>ing prawn culture industry – where will the<br />
feed materials come from?. Bay <strong>of</strong> Bengal News, 32: 12–18.<br />
Wood, J., Brown, J.H., Maclean, H.M. & Rajendran, I. 1992. Feeds <strong>for</strong> artisanal shrimp<br />
culture in India – their development <strong>and</strong> evaluation. BOBP/REP/ 52. 59 pp.
Analysis <strong>of</strong> <strong>feeds</strong> <strong>and</strong> <strong>fertilizers</strong> <strong>for</strong> <strong>sustainable</strong> aquaculture development in India 219<br />
APPENDIX<br />
Dietary nutritional requirement <strong>of</strong> shrimp species<br />
A.1. Dietary nutrient requirements (percent dry matter unless otherwise indicated) <strong>of</strong> tiger<br />
shrimp <strong>and</strong> Indian white shrimp<br />
Nutrients Tiger shrimp Indian white shrimp<br />
Crude protein 35–46 30–43<br />
Arginine 3.71 3.06<br />
Histidine 0.69 1.52<br />
Isoleucine 0.61 1.55<br />
Leucine 1.03 2.98<br />
Lysine 3.16 2.40<br />
Methionine 1.24 1.05<br />
Phenylalanine 1.70 1.64<br />
Threonine 1.61 1.47<br />
Tyrosine 0.51 -<br />
Valine 2.06 2.78<br />
Fat 3.5–8.0 6.0–9.0<br />
Linoleic acid 0.05 -<br />
Linolenic acid 0.10 -<br />
Eicosapentaenoic acid 0.01 -<br />
Docosahexaenoic acid 0.005 -<br />
Lecithin 0.1–2.0 0.5–2.0<br />
Cholesterol 0.5 0.5<br />
Total energy (kcal/100g) 280–370 350–400<br />
Calcium 2.0–2.5 0.5–0.6<br />
Phosphorus 1.2–1.4 1.1<br />
Potassium 0.7–0.9 1.3<br />
Magnesium 0.08–0.15 Trace<br />
Iron (mg/kg) 60–80 -<br />
Zinc (mg/kg) 80–100 240<br />
Manganese (mg/kg) 40–50 Trace<br />
Copper (mg/kg) 8–10 13.6<br />
Cobalt (mg/kg) 0.8–1.0 -<br />
Iodine (mg/kg) 4–5 -<br />
Chromium (mg/kg) 0.6–0.8 -<br />
Selenium (mg/kg) 0.17–0.21 -<br />
Rib<strong>of</strong>lavin (mg/kg) 40 80<br />
Thiamine(mg/kg) 120 100<br />
Pyridoxine (mg/kg) 120 200<br />
Pantothenic acid (mg/kg) 100 75<br />
Niacin (mg/kg) 150 250<br />
Folic acid (mg/kg) 5.0 -<br />
Biotin (mg/kg) 1.0 -<br />
Vitamin B12 (mg/kg)
Development <strong>of</strong> the aquafeed<br />
industry in India<br />
A. Victor Suresh<br />
Aqua Feeds: Formulation & Beyond<br />
A3 Sanskriti Apartments, 17 <strong>and</strong> 18 Velachery Bypass Road, Velachery, Chennai 600 042<br />
India<br />
Summary 222<br />
1. Introduction 223<br />
2. Aquaculture in India: a brief overview 223<br />
3. The animal feed manufacturing sector in India 228<br />
4. Availability <strong>of</strong> feed ingredients 230<br />
5. Aquafeed production 234<br />
6. Problems <strong>and</strong> constraints in the use <strong>of</strong> commercially manufactured<br />
<strong>feeds</strong> <strong>for</strong> small- <strong>and</strong> medium-scale aquaculture 238<br />
7. Recommendations <strong>for</strong> improved utilization <strong>of</strong> industrially<br />
manufactured aqua<strong>feeds</strong> 240<br />
Acknowledgements 241<br />
References 241<br />
Appendix 243<br />
Suresh, A.V. 2007. Development <strong>of</strong> the aquafeed industry in India. In M.R. Hasan,<br />
T. Hecht, S.S. De Silva <strong>and</strong> A.G.J. Tacon (eds). <strong>Study</strong> <strong>and</strong> <strong>analysis</strong> <strong>of</strong> <strong>feeds</strong> <strong>and</strong><br />
<strong>fertilizers</strong> <strong>for</strong> <strong>sustainable</strong> aquaculture development. FAO Fisheries Technical Paper.<br />
No. 497. Rome, FAO. pp. 221–243.<br />
221
222<br />
<strong>Study</strong> <strong>and</strong> <strong>analysis</strong> <strong>of</strong> <strong>feeds</strong> <strong>and</strong> <strong>fertilizers</strong> <strong>for</strong> <strong>sustainable</strong> aquaculture development<br />
SUMMARY<br />
India is the second largest aquaculture producing country after China. The current<br />
annual aquaculture production exceeds 2.47 million tonnes <strong>of</strong> fish, freshwater prawns<br />
<strong>and</strong> marine shrimp. Production <strong>of</strong> carps dominates Indian aquaculture with an annual<br />
production exceeding 2.11 million tonnes, while the total shrimp <strong>and</strong> prawn production<br />
is over 172 000 tonnes. The terrestrial <strong>and</strong> aquatic animal farming sectors are rapidly<br />
exp<strong>and</strong>ing <strong>and</strong> intensifying in India. However, industrial feed manufacturing in India still<br />
lags behind other rapidly developing economies in size <strong>and</strong> sophistication. The current<br />
level <strong>of</strong> industrial feed production <strong>for</strong> terrestrial livestock is estimated to be about<br />
5 million tonnes, though requirements exceed 42 million tonnes. Similarly, aquaculture<br />
requires at least 2.59 million tonnes <strong>of</strong> manufactured <strong>feeds</strong> but, at present, only about<br />
200 000 tonnes are manufactured. Semi-intensive <strong>and</strong> intensive carp <strong>and</strong> other freshwater<br />
fish production systems in India are predominantly based on farm-made <strong>feeds</strong>. An<br />
estimated 6.83 million tonnes <strong>of</strong> feed ingredients are used <strong>for</strong> producing farm-made<br />
<strong>feeds</strong>, while only 10 000 tonnes <strong>of</strong> industrially manufactured <strong>feeds</strong> are used in freshwater<br />
aquaculture. Preliminary data suggest that the use <strong>of</strong> manufactured <strong>feeds</strong> could bring<br />
about significant savings in carp production. Food conversion ratios could be reduced<br />
from 3 to 1:1 when manufactured <strong>feeds</strong> replace farm-made <strong>feeds</strong>. There are additional<br />
benefits associated with manufactured <strong>feeds</strong> in the <strong>for</strong>m <strong>of</strong> cleaner ponds <strong>and</strong> less labour<br />
<strong>for</strong> feed preparation <strong>and</strong> feeding. The principal constraint to the use <strong>of</strong> manufactured<br />
<strong>feeds</strong> in fish production is the perception that such <strong>feeds</strong> are not cost effective. Once<br />
feed manufacturers <strong>and</strong> farmers realize that it is possible to produce pr<strong>of</strong>itably <strong>and</strong> use<br />
<strong>feeds</strong> in fish farming, the use <strong>of</strong> manufactured <strong>feeds</strong> will increase. It is likely that the use<br />
<strong>of</strong> manufactured <strong>feeds</strong> in freshwater fish farming will increase from the present 10 000<br />
tonnes to at least 250 000 tonnes within the next five years.<br />
The use <strong>of</strong> industrially manufactured <strong>feeds</strong> in Indian aquaculture started in the early<br />
1990s when <strong>feeds</strong> were imported from Taiwan Province <strong>of</strong> China, Southeast Asia <strong>and</strong> the<br />
United States <strong>of</strong> America <strong>for</strong> shrimp production. Currently, India has more than sufficient<br />
capacity to produce adequate volumes <strong>of</strong> feed <strong>for</strong> freshwater prawn <strong>and</strong> marine shrimp<br />
farming. Annual production <strong>of</strong> prawn <strong>and</strong> shrimp <strong>feeds</strong> is around 190 000 tonnes against<br />
an installed capacity <strong>of</strong> around 500 000 tonnes per year. Other than in the traditional,<br />
extensive production systems in Kerala <strong>and</strong> West Bengal that are not designed to use<br />
<strong>feeds</strong>, industrially manufactured <strong>feeds</strong> are used in almost all prawn <strong>and</strong> shrimp farms<br />
in India. Falling prices <strong>of</strong> prawns <strong>and</strong> shrimps in the global market have meant lower<br />
pr<strong>of</strong>itability <strong>for</strong> the farmers <strong>and</strong> the high cost <strong>of</strong> feed has become a constraint. While<br />
market <strong>for</strong>ces will no doubt correct this imbalance over a period <strong>of</strong> time, opportunities<br />
exist in research <strong>and</strong> policy-making to achieve efficiencies that would lower the cost <strong>of</strong><br />
feed per unit <strong>of</strong> production.<br />
There is an adequate domestic feed ingredient resource base <strong>for</strong> most <strong>of</strong> the animal<br />
feed requirements by the aquaculture <strong>and</strong> animal production sectors. For example, India<br />
produces 3.5 million tonnes <strong>of</strong> rice bran, the chief ingredient in fish <strong>feeds</strong>, which is sold at<br />
Rs 3 200/tonne (US$71.11). However, maize has to be imported to meet the needs <strong>of</strong> the<br />
poultry sector <strong>and</strong> fishmeal <strong>and</strong> marine oils are imported <strong>for</strong> the shrimp farming sector.<br />
Fortunately, India is one <strong>of</strong> the biggest exporters <strong>of</strong> soybean meal in the world <strong>and</strong> enjoys<br />
a competitive position as far as most aquafeed ingredients are concerned. However, the<br />
high import tariff imposed on feed additives is a constraint, although this will probably<br />
change with the implementation <strong>of</strong> global trade re<strong>for</strong>ms.
Development <strong>of</strong> the aquafeed industry in India 223<br />
1. INTRODUCTION<br />
This report reviews the development <strong>of</strong> the aquafeed industry in India. It is principally<br />
based on secondary in<strong>for</strong>mation <strong>and</strong> data derived from the published literature,<br />
unpublished reports <strong>and</strong> some primary data collected in the field. The report provides:<br />
• a brief overview <strong>of</strong> aquaculture practices <strong>and</strong> farming systems, with production<br />
data (weight <strong>and</strong> value) <strong>of</strong> major species groups;<br />
• an overview <strong>of</strong> the animal feed manufacturing sector including total compound<br />
animal feed production, production capacity <strong>and</strong> potential, feed manufacturing<br />
associations as well as the relevant regulations <strong>and</strong> controls;<br />
• a review <strong>of</strong> availability, nutritional value <strong>and</strong> cost <strong>of</strong> feed ingredients including<br />
feed additives (e.g. vitamins, minerals, antioxidants <strong>and</strong> binders) including<br />
summary in<strong>for</strong>mation on current feed <strong>and</strong> feed ingredient imports <strong>and</strong> exports;<br />
• a summary <strong>of</strong> feed production <strong>for</strong> major species group <strong>and</strong> farming systems;<br />
• a summary <strong>analysis</strong> <strong>of</strong> constraints on the use <strong>of</strong> commercially manufactured feed<br />
<strong>for</strong> small- <strong>and</strong> medium-scale aquaculture enterprises, including a comparative<br />
assessment <strong>of</strong> the economics <strong>of</strong> small-scale aquaculture based on industrially<br />
manufactured complete/semi-complete feed <strong>and</strong> farm-made <strong>feeds</strong>; <strong>and</strong><br />
• recommendations <strong>and</strong> suggested policy guidelines <strong>for</strong> improved utilization <strong>of</strong><br />
industrially manufactured feed.<br />
2. AQUACULTURE IN INDIA: A BRIEF OVERVIEW<br />
In 2004 India was estimated to have harvested about 6.09 million tonnes <strong>of</strong> aquatic<br />
products, mainly finfish <strong>and</strong> shellfish (FAO, 2006). This is slightly lower than the<br />
figures provided by Ayyappan <strong>and</strong> Ahamad Ali (2007), who estimated that India’s<br />
total aquatic food production was 6.4 million tonnes in 2004 <strong>and</strong> that aquaculture<br />
contributed about 2.37 million tonnes <strong>of</strong> this production. The FAO data show that<br />
roughly 59.5 percent was from capture fisheries <strong>and</strong> the remaining 40.5 percent was<br />
from aquaculture. Figure 1 shows that the contribution by capture fisheries has almost<br />
stagnated at about 3.5 million tonnes in the last 10 years, whereas aquaculture has<br />
grown from 1.66 to 2.47 million tonnes during the same period. Ayyapan <strong>and</strong> Diwan<br />
(2004) predicted that Indian aquaculture would continue to grow at an average annual<br />
growth rate <strong>of</strong> about 8 percent in the next five years.<br />
Freshwater aquaculture accounts <strong>for</strong> the bulk <strong>of</strong> production <strong>and</strong> amounts to around<br />
2.34 million tonnes per year. In comparison, the average annual brackish-water <strong>and</strong><br />
marine shrimp production over the last five<br />
years has been around 100 000–170 000<br />
tonnes. Even though this represents only<br />
a small fraction <strong>of</strong> the total marine harvest<br />
in India, the proportional contribution to<br />
total value is high.<br />
2.1 Freshwater aquaculture in India<br />
As stated earlier, current freshwater<br />
aquaculture production in India is 2.34<br />
million tonnes. Most <strong>of</strong> this production<br />
is attributed to carps which accounted<br />
<strong>for</strong> 90.5 percent <strong>of</strong> the total freshwater<br />
production in India (Table 1). In 2004, the<br />
three Indian major carps (catla, rohu <strong>and</strong><br />
mrigal) contributed 59.7 percent, common<br />
carp 19.4 percent <strong>and</strong> the two Chinese<br />
carps (grass <strong>and</strong> silver carp) 11.3 percent to<br />
total freshwater production.<br />
Quantity (thous<strong>and</strong> tonnes)<br />
FIGURE 1<br />
Aquatic food production in India from 1995 to 2004<br />
7000<br />
6000<br />
5000<br />
4000<br />
3000<br />
2 000<br />
1000<br />
0<br />
1995 1996 1997 1998 1999 2000 2001 2002 2003 2004<br />
Source: FAO (2006)<br />
Year<br />
Aquaculture<br />
Capture
224<br />
<strong>Study</strong> <strong>and</strong> <strong>analysis</strong> <strong>of</strong> <strong>feeds</strong> <strong>and</strong> <strong>fertilizers</strong> <strong>for</strong> <strong>sustainable</strong> aquaculture development<br />
TABLE 1<br />
There are three broad types <strong>of</strong> carp farming systems<br />
Aquaculture production by species groups<br />
in 2004<br />
in India (Table 2). The most traditional <strong>of</strong> the three are<br />
Species groups Tonnes the stock-<strong>and</strong>-harvest systems, in which fish seed is the<br />
Indian major carps 1 396 855 only input <strong>and</strong> in which the fish are totally dependent<br />
Catla 467 962 on natural productivity. This is practised in larger water<br />
Rohu 486 113 bodies, particularly reservoirs. Based on current yields<br />
Mrigal 442 780<br />
that range from 11 to 48 kg/ha in large-to-medium <strong>and</strong><br />
Chinese & common carps 719 472<br />
small reservoirs, respectively (Nath <strong>and</strong> Das, 2004), the<br />
Grass carp 100 641<br />
Silver carp 165 084 estimated total annual production <strong>of</strong> fish from these<br />
Common carp 453 747 systems is about 90 000 tonnes. Currently, there is little<br />
Snakeheads 29 949 scope <strong>for</strong> feed use in reservoirs <strong>and</strong> other extensive<br />
Catfishes 42 160 waterbodies. However, should cage culture in reservoirs<br />
Other fishes 108 958 ever become a reality in India, there is a vast potential <strong>for</strong><br />
Freshwater prawns 38 965<br />
increasing fish production <strong>and</strong> feed use.<br />
Monsoon river prawn 245<br />
The second type <strong>of</strong> carp farming practice is generally<br />
Giant freshwater prawn 35 720<br />
Total freshwater aquaculture 2 336 359 referred to as low input, extensive culture. This is practised<br />
Source: FAO (2006)<br />
in a variety <strong>of</strong> waterbodies that may not necessarily<br />
have been excavated <strong>for</strong> fish farming. Examples are rice<br />
paddies <strong>and</strong> seasonally flooded pools. Fish are stocked at low densities (5.00 750 000<br />
embankments <strong>and</strong> drainage feeding with ingredients such as<br />
rice bran <strong>and</strong> oil seed residues
Development <strong>of</strong> the aquafeed industry in India 225<br />
Commercially successful intensification <strong>of</strong> carp culture<br />
started in the southern state <strong>of</strong> Andhra Pradesh in the mid-<br />
to late 1980s (Veerina et al., 1999). The intensification was<br />
characterized by:<br />
1. an increase in the stocking density from 5 000 to about<br />
8 000/ha;<br />
2. a shift towards polyculture <strong>of</strong> Indian carps only <strong>and</strong> in<br />
particular catla <strong>and</strong> rohu at a ratio <strong>of</strong> 1:4-1:15;<br />
3. establishment <strong>of</strong> effective nursery systems <strong>for</strong> the fry<br />
<strong>and</strong> advanced fingerlings. When fingerling <strong>and</strong> growout<br />
production cannot be synchronized, fingerlings<br />
are provided with a maintenance ration until they are<br />
needed. Compensatory growth is rapid <strong>and</strong> the fish<br />
reach 1.5–2.0 kg in one year;<br />
4. their fertilization. Though ponds are large (10–20 ha),<br />
they are fertilized with poultry manure throughout<br />
the production cycle. Fertilization is well<br />
managed <strong>and</strong> farmers routinely sample<br />
pond water to observe plankton production<br />
(Figure 2) <strong>and</strong> add <strong>fertilizers</strong> when necessary;<br />
<strong>and</strong><br />
5. feeding practice. The fish are fed with deoiled<br />
rice bran (90 percent) <strong>and</strong> groundnut<br />
<strong>and</strong>/or cotton oilseed cake. The <strong>feeds</strong>tuffs<br />
are blended <strong>and</strong> packed in plastic bags with<br />
holes (Figure 3) <strong>and</strong> these are suspended<br />
in the ponds (Figure 4). Further details <strong>of</strong><br />
the ingredients <strong>and</strong> feed composition are<br />
provided later in the report.<br />
The market value <strong>of</strong> carps varies within <strong>and</strong><br />
between states. West Bengal as a whole, <strong>and</strong><br />
Kolkata in particular, is the biggest market <strong>for</strong><br />
carps in India, where the current price varies<br />
from Rs 45 to 60/kg (US$1–1.3). 1 Similar prices<br />
are obtained in urban markets in the states <strong>of</strong><br />
Punjab <strong>and</strong> Haryana. Andhra Pradesh is the<br />
biggest intensive carp farming area in the country.<br />
However, because marine fish are preferred here<br />
the market price <strong>for</strong> carp is considerably lower, at<br />
around Rs 26–30/kg (US$0.57–0.66), hence most<br />
<strong>of</strong> the fish are transported to the market in West<br />
Bengal. Intensive carp farming in Tamil Nadu<br />
occurs in the Cauvery delta region. Though also<br />
a coastal region, carp is readily accepted on the<br />
market <strong>and</strong> currently fetches around Rs 40–45/kg<br />
(US$0.9–1.0).<br />
Carnivorous snakeheads, clariid <strong>and</strong> pangasiid<br />
catfish are also produced in India. Snakeheads,<br />
locally known as murrels, are cultured throughout<br />
the country in areas where seed availability is not<br />
a constraint. Snakeheads fetch a high market price<br />
1 US$1.00 = Rs 44.00 (Indian Rupee, INR)<br />
FIGURE 2<br />
Sampling <strong>of</strong> pond water to check<br />
plankton density<br />
Farmers <strong>of</strong> intensive carp culture<br />
system in Andhra Pradesh routinely<br />
sample ponds to determine plankton<br />
density <strong>and</strong> adjust the fertilization<br />
schedule accordingly.<br />
FIGURE 3<br />
Bags used <strong>for</strong> feeding <strong>of</strong> fish in intensive carp<br />
culture in India<br />
The bags are packed with supplementary feed<br />
be<strong>for</strong>e placing them in the pond. Bag feeding<br />
method is commonly used in intensive carp<br />
culture in Andhra Pradesh. The bag has several<br />
holes through which the fish access the feed<br />
packed into the bag.<br />
FIGURE 4<br />
Bag feeding method in intensive carp culture<br />
in India<br />
Bags filled with feed are tied to bamboo poles<br />
placed at the edge or centre <strong>of</strong> ponds.<br />
COURTESY OF P.E. VIJAY ANAND<br />
COURTESY OF P.E. VIJAY ANAND
226<br />
Production (tonnes)<br />
40 000<br />
35 000<br />
30 000<br />
25 000<br />
20 000<br />
15 000<br />
10 000<br />
5 000<br />
0<br />
<strong>Study</strong> <strong>and</strong> <strong>analysis</strong> <strong>of</strong> <strong>feeds</strong> <strong>and</strong> <strong>fertilizers</strong> <strong>for</strong> <strong>sustainable</strong> aquaculture development<br />
<strong>of</strong> Rs 120–180/kg (US$2.67–4.00). As air-breathing fish they are stocked at a high<br />
density; however the lack <strong>of</strong> seed supply, their high protein requirement, slow growth<br />
<strong>and</strong> susceptibility to disease constrain the expansion <strong>of</strong> murrel farming. Wet trash fish<br />
<strong>and</strong> poultry processing waste (mainly guts <strong>and</strong> heads) combined with rice bran <strong>and</strong> oil<br />
seed residues are fed to the fish.<br />
Catfish culture has recently exp<strong>and</strong>ed. While India has a number <strong>of</strong> endemic catfish<br />
species including Clarias batrachus <strong>and</strong> Pangasius pangasius, the faster growing African<br />
catfish, Clarias gariepinus, <strong>and</strong> sutchi catfish, Pangasius hypopthalmus, imported from<br />
Southeast Asia, have become the most widely farmed species in recent years. Legally<br />
these two species are not permitted to be farmed in India, hence production data are<br />
unavailable. Farmers typically use high stocking densities (>40 000/ha) <strong>and</strong> mixed <strong>feeds</strong><br />
composed <strong>of</strong> rice bran, oilseed cake residues, kitchen waste, poultry processing waste<br />
<strong>and</strong> others. The fish grow to 1 kg within six months.<br />
India is one <strong>of</strong> the few countries in Asia without tilapia in aquaculture. Oreochromis<br />
mossambicus was first introduced to India some 50 years ago <strong>and</strong> the species has<br />
now been established in reservoirs <strong>and</strong> lakes throughout the country. Owing to its<br />
unpleasant looking dark skin <strong>and</strong> peritoneum pigmentation, it does not have a broad<br />
market appeal <strong>and</strong> is considered to be a pest species in capture fisheries <strong>and</strong> aquaculture.<br />
Farming trials with red hybrid tilapia showed that the hybrid fish was well accepted<br />
by the market. The introduction <strong>of</strong> species into India requires an exotic species import<br />
permit <strong>and</strong> importers have to comply with quarantine requirements. Currently there<br />
is an initiative to introduce Nile tilapia (O. niloticus) into India, although there are<br />
unconfirmed reports that O. niloticus <strong>and</strong> the genetically improved farm tilapia (GIFT)<br />
have already been introduced via Bangladesh into West Bengal. The prospects <strong>for</strong> tilapia<br />
farming in India are good once appropriate c<strong>and</strong>idate species have been introduced.<br />
Extensive freshwater prawn farming has been practised <strong>for</strong> many years in<br />
floodplains <strong>and</strong> rice paddies in West Bengal <strong>and</strong> Kerala. Semi-intensive prawn farming<br />
only commenced in the mid-1990s in Andhra Pradesh when marine shrimp farming<br />
was severely affected by white spot syndrome virus (WSSV). Prawn farming was also<br />
facilitated by the available shrimp farming infrastructure. The species <strong>of</strong> choice is the<br />
giant freshwater prawn (Macrobrachium rosenbergii) that is locally <strong>and</strong> incorrectly<br />
referred to as “scampi”. Prawns are produced in ponds both under monoculture<br />
<strong>and</strong> polyculture conditions with Indian major carps. Grow-out stocking densities<br />
range from 0.5 to 2.5 prawns/m 2 in polyculture <strong>and</strong> 1 to 5/m 2 in monoculture <strong>and</strong> the<br />
grow-out period is 6–8 months. Average<br />
pond production is about 600 kg/ha;<br />
FIGURE 5<br />
Freshwater prawn production in India from<br />
1996 to 2003<br />
1996 1997 1998 1999 2000 2001 2002 2003<br />
Year<br />
Source: Marine Products Export Development Authority<br />
however, well-managed ponds produce<br />
up to 2 tonnes/ha/crop cycle. Freshwater<br />
prawns (average weight <strong>of</strong> 50 g) fetch<br />
approximately Rs 225/kg (US$5.10).<br />
Prawn production in Andhra Pradesh,<br />
particularly in the district <strong>of</strong> Nellore, grew<br />
rapidly from 1996 to 2002 <strong>and</strong> this area<br />
now contributes approximately 80 percent<br />
<strong>of</strong> the country’s total prawn production.<br />
Low rainfall, disease problems during<br />
seed production <strong>and</strong> grow-out <strong>and</strong> lower<br />
export prices significantly affected prawn<br />
production in this district in 2003–04. This<br />
has been compensated <strong>for</strong> by increased<br />
production from other areas in Andhra<br />
Pradesh <strong>and</strong> elsewhere (Figure 5). India<br />
produces an estimated 25 000–30 000 <strong>of</strong>
Development <strong>of</strong> the aquafeed industry in India 227<br />
brackish-water shrimp in inl<strong>and</strong> waters<br />
(Figure 6), mainly in the districts <strong>of</strong> East<br />
<strong>and</strong> West Godavari in the state <strong>of</strong> Andhra<br />
Pradesh. The production systems, methods<br />
<strong>and</strong> <strong>feeds</strong> are not considerably different<br />
from those used in coastal waters (see<br />
below <strong>for</strong> details).<br />
2.2 Brackish-water <strong>and</strong> marine<br />
aquaculture<br />
India’s brackish-water <strong>and</strong> marine aquaculture<br />
sector produces only marine shrimp, mainly<br />
black tiger shrimp, Penaeus monodon, <strong>and</strong><br />
smaller proportions <strong>of</strong> Indian white shrimp,<br />
Fenneropenaeus indicus, <strong>and</strong> Pacific white<br />
shrimp, Litopenaeus vannamei. Production<br />
<strong>of</strong> marine fishes, including Asian seabass/<br />
barramundi (Lates calcarifer), is negligible.<br />
Extensive shrimp farming has been<br />
practised in India, particularly in Kerala<br />
<strong>and</strong> West Bengal, <strong>for</strong> several decades.<br />
Semi-intensive farming emerged in the late<br />
1980s <strong>and</strong> grew rapidly in the early 1990s<br />
(Figure 7). The outbreak <strong>of</strong> WSSV stemmed<br />
the sector’s growth in 1995. The sector was<br />
also affected by the Indian Supreme Court’s<br />
decision to ban intensive <strong>and</strong> semi-intensive<br />
aquaculture practices within 500 metres<br />
<strong>of</strong> the high tide mark. Subsequently, the<br />
sector has experienced a revival <strong>and</strong> total<br />
production in 2004 reached approximately<br />
116 000 tonnes. Recent setbacks to the sector<br />
include (i) imposition <strong>of</strong> anti-dumping duty<br />
on shrimp exported from India to the<br />
United States <strong>of</strong> America; (ii) low prices <strong>of</strong><br />
shrimp due to global oversupply <strong>and</strong> antidumping<br />
duty; <strong>and</strong> (iii) the 2004 tsunami<br />
that affected hatcheries <strong>and</strong> farms in Tamil<br />
Nadu. WSSV still persists <strong>and</strong> new problems<br />
such as loose shell syndrome threaten the<br />
pr<strong>of</strong>itability <strong>of</strong> the sector. Loose shell syndrome is a unique disease problem in India<br />
that results in severe atrophy <strong>of</strong> the muscles. The etiology <strong>of</strong> the problem remains<br />
largely unknown, although a number <strong>of</strong> factors such as blue-green algae <strong>and</strong> poor pond<br />
bottom are thought to be causative factors.<br />
There are three types <strong>of</strong> shrimp farming systems in India, i.e. traditional extensive,<br />
modified extensive <strong>and</strong> semi-intensive (Table 3). Traditional <strong>and</strong> extensive farmers<br />
in Kerala <strong>and</strong> West Bengal use large (>5 ha), irregular shaped ponds that are filled<br />
during flooding or through tidal exchange. Stocking densities are low (
228<br />
<strong>Study</strong> <strong>and</strong> <strong>analysis</strong> <strong>of</strong> <strong>feeds</strong> <strong>and</strong> <strong>fertilizers</strong> <strong>for</strong> <strong>sustainable</strong> aquaculture development<br />
TABLE 3<br />
Summary <strong>of</strong> shrimp farming systems in India<br />
System type Inputs<br />
Traditional,<br />
extensive<br />
Modified,<br />
extensive<br />
Semi-intensive<br />
Post-larvae/juveniles<br />
(hatchery or wild source),<br />
2–5 animals/m2 ; farm-made<br />
<strong>feeds</strong> or no <strong>feeds</strong><br />
Hatchery-produced postlarvae,<br />
5–10 animals/m2 ;<br />
manufactured <strong>feeds</strong><br />
Hatchery-produced postlarvae,<br />
15–20 animals/m2 ;<br />
manufactured <strong>feeds</strong><br />
Manufactured <strong>feeds</strong> are used in the other two shrimp farming systems. In semiintensive<br />
systems, stocking densities exceed 15 PLs/m 2 <strong>and</strong> yields exceed 2 tonnes/ha/<br />
crop cycle. In the modified extensive systems, stocking densities are in the range <strong>of</strong><br />
7–10/m 2 <strong>and</strong> yields are about 1.0–1.5 tonnes/ha/cycle. Typical pond size is in the range<br />
<strong>of</strong> 0.8–1.0 ha each.<br />
There are two distinct shrimp cycles (crops) in India. The first cropping starts<br />
in February/March <strong>and</strong> ends in May/June. The second cropping starts in August/<br />
September <strong>and</strong> ends in November/December. Typically, the first crop produces a<br />
higher yield than the second crop. Better water quality following the 2–3 months<br />
“between crop holiday” is cited to be the reason <strong>for</strong> such a difference. However, in<br />
recent years <strong>and</strong> with better management, this is becoming less common. The average<br />
duration <strong>of</strong> each crop cycle is 130 days. The average size <strong>of</strong> shrimp at harvest is 25–30 g<br />
<strong>and</strong> the farm-gate price <strong>of</strong> shrimp in the 25–30 g range varies between Rs 210 <strong>and</strong><br />
280/kg (US$4.88–6.22).<br />
3. THE ANIMAL FEED MANUFACTURING SECTOR IN INDIA<br />
The farm animal population <strong>of</strong> India in 2003 was estimated to be about 974.01 million<br />
(see Table 4). It is further estimated that in 2003 India produced a total <strong>of</strong> 5.98 million<br />
tonnes <strong>of</strong> meat, 88 million tonnes <strong>of</strong> milk <strong>and</strong> 40 billion eggs. Despite this large volume<br />
from the livestock sector, animal production in India is largely comprised <strong>of</strong> small- <strong>and</strong><br />
medium-size farming enterprises. Most <strong>of</strong> the <strong>feeds</strong> used <strong>for</strong> animal production consist<br />
<strong>of</strong> natural pasture, farm-made <strong>feeds</strong> <strong>and</strong> some measure <strong>of</strong> scavenging. In comparison<br />
with other developed nations <strong>and</strong> fast-developing economies <strong>of</strong> the world the feed<br />
manufacturing industry is in the early stages <strong>of</strong> development.<br />
The current volume <strong>of</strong> compounded feed production <strong>for</strong> the dairy, poultry <strong>and</strong><br />
aquaculture sectors is about 5 million tonnes (CLFMA, 2005). It has been estimated that<br />
India would require about 42 million tonnes<br />
<strong>of</strong> balanced feed if livestock farming were to<br />
be primarily feed-based. By 2010, this dem<strong>and</strong><br />
is expected to increase to about 60 million<br />
tonnes (CLFMA, 2005). Table 5 summarizes<br />
the current production <strong>and</strong> estimated dem<strong>and</strong><br />
<strong>for</strong> <strong>feeds</strong>.<br />
• Dairy cattle. The dairy cattle industry<br />
in India, though the largest in the world<br />
in terms <strong>of</strong> number <strong>of</strong> cows <strong>and</strong> milk<br />
production, is highly fragmented <strong>and</strong><br />
widely distributed throughout the<br />
country, <strong>and</strong> is in the h<strong>and</strong>s <strong>of</strong> millions<br />
<strong>of</strong> small farmers. Most farmers mix<br />
their own feed <strong>for</strong>mulations <strong>and</strong> rely on<br />
Farm<br />
production<br />
(tonnes/ha/cycle)<br />
Estimated national<br />
production<br />
(tonnes/year)<br />
2.0 30 000<br />
TABLE 4<br />
Farm animal population <strong>of</strong> India in 2003<br />
Number<br />
Species<br />
(million)<br />
Cattle 185.18<br />
Buffalo 97.92<br />
Small ruminants 185.83<br />
Pigs 13.52<br />
Other draught animals 2.55<br />
Poultry* 489.01<br />
Total 974.01<br />
*Poultry population may have been<br />
underestimated. The Compound Livestock Feed<br />
Manufacturers Association (CLFMA) estimated<br />
that there were 150 million layer birds <strong>and</strong> 650<br />
million broiler birds in 2003.<br />
Source: Directorate <strong>of</strong> Economics <strong>and</strong> Statistics,<br />
Ministry <strong>of</strong> Agriculture (2003).
Development <strong>of</strong> the aquafeed industry in India 229<br />
TABLE 5<br />
Dem<strong>and</strong> <strong>and</strong> current production <strong>of</strong> animal <strong>feeds</strong> in India (million tonnes)<br />
Current feed<br />
Sector Feed dem<strong>and</strong><br />
production<br />
In<strong>for</strong>mation<br />
source<br />
Dairy cattle 45.00 2.00 CLFMA<br />
Poultry, broiler 6.21 3.00 CLFMA<br />
Poultry, layer 8.13 Not significant CLFMA<br />
Aquaculture, fish 2.31 0.01 Author<br />
Aquaculture, prawn 0.27 0.19 Author<br />
grazing or stall-feeding, using crop residues. Owing to the poor genetic makeup<br />
<strong>of</strong> the stock <strong>and</strong> management practices, use <strong>of</strong> manufactured feed may not<br />
improve productivity. Experts consider that manufactured <strong>feeds</strong> would be best<br />
utilized <strong>for</strong> only about 10–15 percent <strong>of</strong> dairy cattle in India that are cross-bred<br />
<strong>and</strong> optimally managed. The potential dem<strong>and</strong> <strong>for</strong> dairy cattle feed is estimated<br />
at 45 million tonnes, assuming that only 50 percent <strong>of</strong> milk production in the<br />
country is from cattle that are fed manufactured <strong>feeds</strong> (CLFMA, 2005). The<br />
current estimated production <strong>of</strong> cattle feed is about 2 million tonnes indicating<br />
the high potential <strong>for</strong> the animal feed manufacturing industry. The major markets<br />
<strong>for</strong> dairy cattle <strong>feeds</strong> are Punjab, Haryana, Uttar Pradesh, Gujarat, Maharashtra,<br />
Karnataka, Kerala, Tamil Nadu <strong>and</strong> Andhra Pradesh.<br />
• Poultry. Over the last decade, consumption <strong>of</strong> broiler meat has grown at an<br />
annual rate <strong>of</strong> almost 15 percent. The broiler production sector is technologically<br />
advanced, relies on balanced <strong>feeds</strong> <strong>and</strong> uses most <strong>of</strong> the animal <strong>feeds</strong> manufactured<br />
in India. Nearly 3 million tonnes <strong>of</strong> manufactured <strong>feeds</strong> are used by the sector.<br />
CLFMA (2005) reported that the feed requirement <strong>for</strong> the broiler sector was<br />
6.21 million tonnes in 2004, while some 8.13 million tonnes are required <strong>for</strong><br />
layers. Increased use <strong>of</strong> manufactured <strong>feeds</strong> in the poultry sector is constrained by<br />
cost.<br />
• Aquaculture. See later.<br />
Table 6 provides a summary <strong>of</strong> manufactured feed types, feed composition <strong>and</strong> costs<br />
<strong>of</strong> broiler <strong>feeds</strong> <strong>and</strong> various aqua<strong>feeds</strong>. The data suggest that feed costs as a percentage<br />
<strong>of</strong> market price <strong>for</strong> broilers <strong>and</strong> carps are quite similar. However, better resource<br />
efficiencies are possible if carps are fed on manufactured <strong>feeds</strong> (see later <strong>for</strong> further<br />
discussion). Prawn <strong>and</strong> shrimp <strong>feeds</strong> are more expensive than other <strong>feeds</strong> but, because<br />
<strong>of</strong> the high price <strong>of</strong> shrimp <strong>and</strong> prawns, production is relatively cost effective.<br />
TABLE 6<br />
Type <strong>of</strong> broiler <strong>and</strong> aqua<strong>feeds</strong> manufactured, composition <strong>and</strong> their cost<br />
Animal Broiler Carp Prawn Shrimp<br />
Type <strong>of</strong> feed<br />
Proximate composition<br />
Pellet Mash Pellet Pellet<br />
Crude protein (%) 18 20 28 40<br />
Crude lipid (%) 5.5 2.0 4.0 6.0<br />
Crude fibre (%)<br />
Costs<br />
4 15 4 3<br />
Unit cost <strong>of</strong> feed (Rs/kg) 12 4 28 42<br />
Unit cost <strong>of</strong> feed (US$/kg) 0.27 0.09 0.64 0.95<br />
Feed conversion ration (FCR) 1.8 3.5 2.5 1.6<br />
Feed cost/kg <strong>of</strong> animal produced (Rs) 21.6 14.0 70.0 67.2<br />
Feed cost/kg <strong>of</strong> animal produced (US$) 0.49 0.32 1.59 1.53<br />
Market size (g/animal) 2 000 1 000 70 33<br />
Time to market size (day) 40 365 180 140<br />
Sale price (Rs/kg) 40 30 270 250<br />
Sale price (US$/kg) 0.91 0.68 6.14 5.68<br />
Feed cost (% <strong>of</strong> sale price) 54.00 46.67 25.93 26.88
230<br />
<strong>Study</strong> <strong>and</strong> <strong>analysis</strong> <strong>of</strong> <strong>feeds</strong> <strong>and</strong> <strong>fertilizers</strong> <strong>for</strong> <strong>sustainable</strong> aquaculture development<br />
The Compound Livestock Feed Manufacturers Association (now simply known as<br />
CLFMA) is the only association that is widely recognized by the feed industry. Nearly<br />
50 percent <strong>of</strong> manufactured feed in India is produced by members <strong>of</strong> the association.<br />
CLFMA has recommended quality norms <strong>for</strong> various livestock feed (Appendix, Tables<br />
A.1 <strong>and</strong> A.2). The Bureau <strong>of</strong> Indian St<strong>and</strong>ards has also recommended specifications <strong>for</strong><br />
various livestock <strong>feeds</strong> (Appendix, Tables A.3 <strong>and</strong> A.4). The Marine Products Export<br />
Development Authority (MPEDA) has similarly prescribed norms <strong>for</strong> marine shrimp<br />
<strong>feeds</strong> (see later <strong>for</strong> more detail). These st<strong>and</strong>ards <strong>and</strong> quality norms are adopted on a<br />
voluntary basis <strong>and</strong> are not en<strong>for</strong>ceable.<br />
4. AVAILABILITY OF FEED INGREDIENTS<br />
India is primarily an agricultural economy <strong>and</strong> is one <strong>of</strong> the biggest producers (Table 7)<br />
<strong>of</strong> rice, wheat <strong>and</strong> many oilseeds, including soybean.<br />
The broad agricultural base provides coarse grains, grain by-products (brans), <strong>and</strong><br />
oilseed cake or meals <strong>for</strong> the manufacture <strong>of</strong> animal <strong>feeds</strong>. Ayyappan <strong>and</strong> Ahamad<br />
Ali (2007) provided a detailed estimate <strong>of</strong> agricultural products <strong>and</strong> by-products that<br />
could be used in animal feeding. CLFMA (2005) estimated the feed resources that are<br />
currently available from domestic agricultural production <strong>for</strong> livestock feeding (see<br />
Table 8).<br />
In addition to by-products from crop production, India also produces some animal<br />
by-products such as meat <strong>and</strong> bone meal, blood meal, feather meal, fishmeal, fish oil,<br />
Squilla meal <strong>and</strong> shrimp waste meal. Production volumes <strong>of</strong> terrestrial animal proteins<br />
are not known. Ayyappan <strong>and</strong> Ahamad Ali (2007) estimated that nearly 340 000 tonnes<br />
<strong>of</strong> marine animal proteins are potentially available <strong>for</strong> feed use in India. India produces<br />
nearly 4 million tonnes <strong>of</strong> soybean meal a year, <strong>of</strong> which about 65 percent (2.6 million<br />
tonnes) is exported mainly to the Republic <strong>of</strong> Korea,<br />
TABLE 7<br />
Estimates <strong>of</strong> agricultural outputs in 2003<br />
Commodity<br />
Quantity<br />
(million tonnes)<br />
Rice 87.0<br />
Wheat 72.0<br />
Corn (maize) 14.7<br />
Pearl millet (bajra) 11.8<br />
Sorghum (jowar) 7.3<br />
Finger millet (ragi) 2.0<br />
Barley 1.3<br />
Pulses 15.2<br />
Soybean 5.5<br />
Groundnut 8.3<br />
Rapeseed/mustard seed 5.8<br />
Sunflower 1.0<br />
Cassava 6.0<br />
Source: Hindu Survey <strong>of</strong> Indian Agriculture (2004).<br />
TABLE 8<br />
Available resources <strong>for</strong> animal <strong>feeds</strong> in 2004<br />
Quantity<br />
Commodity<br />
(million tonnes)<br />
Oilseed cake <strong>and</strong> meals 15.76<br />
Brans 13.26<br />
Coarse grains* 5.74<br />
Others 0.53<br />
Total 35.32<br />
*Coarse grain production may have been<br />
underestimated considering the fact that nearly<br />
7.0 million tonnes <strong>of</strong> domestically produced maize<br />
is used by the feed industry.<br />
Source: CLFMA (2005).<br />
Japan, Thail<strong>and</strong>, Indonesia, Malaysia, Viet Nam <strong>and</strong> the<br />
Philippines.<br />
Given the current estimated feed requirement <strong>of</strong><br />
42 million tonnes, the feed resource base is perhaps just<br />
sufficient to meet the requirements. Indian international<br />
trade in animal feed ingredients is rather small except<br />
<strong>for</strong> maize <strong>and</strong> soybean meal. India imports maize when<br />
local production is not sufficient to meet domestic<br />
dem<strong>and</strong>. Concerned about the economic effects <strong>of</strong><br />
cheaper subsidized maize produced in western<br />
countries, particularly the United States <strong>of</strong> America,<br />
on domestic maize, India imposed a tariff <strong>of</strong> 15 percent<br />
on the first 500 000 tonnes <strong>of</strong> maize imported into the<br />
country. Imports above 500 000 tonnes attract a tariff <strong>of</strong><br />
65 percent. Import tariffs <strong>for</strong> major feed ingredients in<br />
India are listed in Table 9.<br />
India imports fishmeal primarily <strong>for</strong> use in shrimp<br />
<strong>feeds</strong>. Small quantities may also be used in poultry<br />
<strong>and</strong> freshwater prawn <strong>feeds</strong>. India is not considered<br />
to be a significant importer <strong>of</strong> fishmeal or any other<br />
animal by-product. The total import <strong>of</strong> marine <strong>and</strong><br />
animal by-products into India is unlikely to exceed<br />
10 000 tonnes per year. There is an <strong>of</strong>ficial ban on the<br />
importation <strong>of</strong> animal <strong>and</strong> poultry by-products due to<br />
fear <strong>of</strong> introduction <strong>of</strong> pathogenic factors responsible<br />
<strong>for</strong> bovine spongi<strong>for</strong>m encephalopathy (BSE) <strong>and</strong><br />
highly pathogenic avian influenza (HPAI), respectively.
Development <strong>of</strong> the aquafeed industry in India 231<br />
Ingredients <strong>and</strong> additives, imported <strong>and</strong> <strong>of</strong> domestic origin, do not require any<br />
<strong>for</strong>m <strong>of</strong> registration in India, although the Ministry <strong>of</strong> Agriculture now requires an<br />
import certificate <strong>for</strong> all animal feed ingredients <strong>and</strong> finished <strong>feeds</strong>. The requirements<br />
vary from ingredient to ingredient <strong>and</strong> are not st<strong>and</strong>ardized. Unrealistic requirements<br />
are imposed from time to time, <strong>for</strong> example, the requirement that all fishmeal is free<br />
<strong>of</strong> WSSV. The certification process is considered by many in the feed industry to be a<br />
trade barrier.<br />
Table 10 presents a list <strong>of</strong> ingredients that are commonly used in feed manufacturing<br />
in India <strong>and</strong> their typical nutritive composition <strong>and</strong> price. Because <strong>of</strong> their importance<br />
in aqua<strong>feeds</strong>, several <strong>of</strong> the available ingredients are discussed in greater detail below.<br />
Complementary in<strong>for</strong>mation on the availability <strong>of</strong> an ingredient <strong>for</strong> <strong>and</strong> use in<br />
aqua<strong>feeds</strong> may be found in Ayyappan <strong>and</strong> Ahamad Ali (2007).<br />
1. Rice bran. India produces 3–3.5 million tonnes <strong>of</strong> rice bran annually. Full-fat<br />
rice bran or rice polish is used <strong>for</strong> the extraction <strong>of</strong> rice bran oil <strong>and</strong> is there<strong>for</strong>e<br />
relatively expensive <strong>for</strong> use in <strong>feeds</strong>. If the oil is not extracted or the polish is not<br />
heat treated, the oil becomes rancid <strong>and</strong> the quality <strong>of</strong> the bran is reduced. Deoiled<br />
rice bran is the most important ingredient in carp <strong>feeds</strong> <strong>and</strong> is also used in<br />
prawn <strong>feeds</strong>. The quality <strong>of</strong> rice bran varies considerably. Mixing <strong>of</strong> rice husks<br />
with the bran is a serious quality issue. This can be detected by the ash <strong>and</strong> fibre<br />
content <strong>of</strong> the bran. High ash <strong>and</strong> fibre contents are indicators <strong>of</strong> poor quality.<br />
The relatively high level <strong>of</strong> protein <strong>and</strong> starch in rice bran makes it a valuable<br />
feed ingredient.<br />
2. Coarse grains. Coarse grains are not used widely in Indian aquaculture.<br />
However, they have a high nutritive value in relation to cost, particularly in fish<br />
<strong>feeds</strong>. Maize, sorghum, finger millet <strong>and</strong> broken rice are good sources <strong>of</strong> starch.<br />
Once extrusion becomes more widely adopted in aquafeed production, the use<br />
<strong>of</strong> coarse grains will increase.<br />
3. Soybean meal. Soybean meal with hulls (44 percent crude protein) <strong>and</strong> dehulled<br />
soybean meal (48 percent crude protein) are available in large quantities in<br />
India. Currently, these products are used only in shrimp <strong>and</strong> prawn <strong>feeds</strong>. Fish<br />
farmers do not use soybean meal due to its high cost. However, once fish <strong>feeds</strong><br />
are commercially manufactured, the use <strong>of</strong> soybean meal will increase.<br />
4. Groundnut cake. Mechanically extracted groundnut cake has been traditionally<br />
used <strong>for</strong> the feeding <strong>of</strong> fish. Solvent extracted groundnut cake is now more<br />
commonly available on a commercial scale. Due to concerns about mycotoxins,<br />
groundnut cake is not used in shrimp <strong>feeds</strong>.<br />
TABLE 9<br />
Import tariffs (%) on feed ingredients imported into India (effective as from 24 August 2005)<br />
Item<br />
Basic<br />
duty<br />
Counter veiling<br />
duty<br />
Cess Total<br />
Fishmeal 5 0 0.10 5.10<br />
Other marine protein meals <strong>and</strong> by-products* 30 0 0.60 30.60<br />
Terrestrial animal protein by-products 30 0 0.60 30.60<br />
Bran, rice (raw or de-oiled) 15 0 0.30 15.30<br />
Bran, other grains (maize, wheat, etc.) 30 0 0.60 30.60<br />
Residues <strong>of</strong> starch manufacturing** 30 0 0.60 30.60<br />
Oilseed cakes <strong>and</strong> solid residues from oil extraction 15 0 0.30 15.30<br />
Concentrates <strong>for</strong> feed preparation 30 0 0.60 30.60<br />
Compounded <strong>feeds</strong> 30 0 0.60 30.60<br />
Brewers’ yeast 30 16 0.92 46.92<br />
Cholesterol 15 16 0.62 31.62<br />
Lecithin 15 16 0.62 31.62<br />
Monocalcium phosphate<br />
* Includes fish solubles, hydrolysate, etc.<br />
** includes wheat gluten<br />
15 16 0.62 31.62
232<br />
<strong>Study</strong> <strong>and</strong> <strong>analysis</strong> <strong>of</strong> <strong>feeds</strong> <strong>and</strong> <strong>fertilizers</strong> <strong>for</strong> <strong>sustainable</strong> aquaculture development<br />
5. Cotton oilseed cake. Solvent-extracted cottonseed cake is used in fish feed.<br />
6. Other oilseed residues. Oil cakes <strong>of</strong> sunflower, coconut (copra meal), sesame <strong>and</strong><br />
rapeseed are presently not commonly used in aqua<strong>feeds</strong>. These have high potential<br />
<strong>for</strong> use in fish <strong>feeds</strong> because <strong>of</strong> their low cost relative to nutritive value.<br />
7. Residues <strong>of</strong> starch manufacturing. Locally produced maize gluten meal has<br />
now become available in India. Its potential <strong>for</strong> use in aqua<strong>feeds</strong>, especially<br />
shrimp <strong>feeds</strong>, is good due to its high nutritive value relative to cost. Wheat gluten<br />
is only available in small volumes. However, significant quantities are imported<br />
from Europe <strong>and</strong> China <strong>for</strong> use in the food industry. It is used in small quantities<br />
(
Development <strong>of</strong> the aquafeed industry in India 233<br />
TABLE 10<br />
Composition <strong>and</strong> price <strong>of</strong> aquafeed ingredients commonly available in India<br />
Ingredient<br />
Crude<br />
protein<br />
Typical composition<br />
(percent as fed basis)<br />
Crude<br />
lipid<br />
Crude<br />
fibre<br />
Ash<br />
Typical price/tonne<br />
Indian<br />
Rs<br />
Grains<br />
Finger millet 6.5 1.2 6.0 7.0 3 500 77.78<br />
Sorghum (white) 8.0 2.5 3.0 2.8 5 000 111.11<br />
Maize 8.5 3.5 2.0 1.9 6 000 133.33<br />
Broken rice 8.5 0.4 0.6 0.8 7 000 155.56<br />
Wheat flour<br />
Grain by-products<br />
11.0 0.4 0.1 0.7 10 500 233.33<br />
Wheat bran 12.8 3.2 11.1 8.4 5 000 111.11<br />
Rice polish 13.0 15.8 6.6 9.8 5 500 122.22<br />
Rice bran, de-oiled 15.2 0.2 17.0 10.1 3 200 71.11<br />
Corn gluten meal 61.2 2.2 1.5 1.0 12 500 277.78<br />
Wheat gluten<br />
Oilseed residues<br />
80.0 0.8 0.1 0.8 46 000 1022.22<br />
Copra meal (solvent extracted) 23.4 1.2 13.0 8.0 6 500 144.44<br />
Sunflower meal (solvent extracted) 28.2 0.6 16.0 7.2 5 000 111.11<br />
Cotton seedcake (solvent extracted) 36.8 2.5 9.8 6.2 7 500 166.67<br />
Rapeseed meal (solvent extracted) 37.0 0.85 6.7 8.3 6 500 144.44<br />
Soybean meal, 44% (solvent extracted) 44.5 1.6 6.0 8.0 11 400 253.33<br />
Soybean meal, 48% (solvent extracted) 49.0 1.6 4.9 7.3 13 400 297.78<br />
Groundnut cake (solvent extracted)<br />
Animal by-products<br />
47.0 0.5 6.0 7.0 9 500 211.11<br />
Fish soluble 26.0 4.0 NA 12.0 28 000 622.22<br />
Shrimp meal 44.0 7.2 15.2 25.0 14 000 311.11<br />
Squid liver powder 47.5 21.2 1.0 4.6 26 000 577.78<br />
Fishmeal, local 57.8 10.9 NA 17.9 21 000 466.67<br />
Fishmeal, imported<br />
Single cell protein<br />
68.0 8.9 NA 13.0 33 000 733.33<br />
Yeast<br />
Oils <strong>and</strong> fats<br />
37.0 0.4 0.1 5.0 26 000 577.78<br />
Fish oil, imported NA 100.0 NA NA 32 000 711.11<br />
Fish oil, local NA 100.0 NA NA 26 000 577.78<br />
Soy lecithin NA 100.0 NA NA 38 000 844.44<br />
TABLE 11<br />
Additives <strong>and</strong> other components used in the aquafeed industry in India<br />
Additive/microingredient Composition/details<br />
Typical price/kg<br />
Indian Rs US$<br />
Imported/local<br />
Cholesterol 95 percent purity, used in<br />
shrimp <strong>feeds</strong><br />
2100 46.67 Imported<br />
Mould inhibitor Mixture <strong>of</strong> propionic acid <strong>and</strong><br />
other organic acids <strong>and</strong> salts<br />
100 2.22 Imported <strong>and</strong> local<br />
Antioxidant Mixture <strong>of</strong> BHT, BHA,<br />
ethoxyquin, etc<br />
160 3.56 Imported <strong>and</strong> local<br />
Pellet binder Modified urea <strong>for</strong>maldehyde 120 2.67 Imported<br />
Monocalcium phosphate 21-23% phosphorus 55 1.22 Imported<br />
Dicalcium phosphate 18% phosphorus 16 0.36 Local<br />
Limestone powder Mostly used as a filler 2 0.03 Local<br />
Mineral premix Typical micromineral premix<br />
<strong>for</strong> fish <strong>feeds</strong><br />
22 0.49 Local<br />
Salt Feed grade 1 0.02 Local<br />
Potassium chloride KCl 50% 20 0.44 Local<br />
Magnesium sulphate MnSO4 31% 15 0.33 Local<br />
Vitamin premix Typical premix <strong>for</strong> fish <strong>feeds</strong>,<br />
without Vitamin C<br />
220 4.89 Imported <strong>and</strong> local<br />
Choline chloride 40 0.89 Imported<br />
Vitamin C, coated 35% active ascorbic acid 360 8.00 Imported<br />
Inositol 400 8.89 Imported<br />
US$
234<br />
<strong>Study</strong> <strong>and</strong> <strong>analysis</strong> <strong>of</strong> <strong>feeds</strong> <strong>and</strong> <strong>fertilizers</strong> <strong>for</strong> <strong>sustainable</strong> aquaculture development<br />
5. AQUAFEED PRODUCTION<br />
It has been estimated that there is a need <strong>for</strong> approximately 2.59 million tonnes <strong>of</strong><br />
aqua<strong>feeds</strong> in India (Table 12), although currently only some 200 000–250 000 tonnes are<br />
industrially manufactured. FCRs using farm-made <strong>feeds</strong> are 2–3 times higher than those<br />
achieved with manufactured <strong>feeds</strong>. On this basis, it was estimated that about 7.11 million<br />
tonnes <strong>of</strong> feed ingredients are used <strong>for</strong> the production <strong>of</strong> aqua<strong>feeds</strong> in India.<br />
5.1 Feeds <strong>for</strong> freshwater fish farming<br />
Almost all freshwater fish in Indian aquaculture are raised on farm-made <strong>feeds</strong>.<br />
Industrially manufactured <strong>feeds</strong> <strong>for</strong> carps are marketed by one major feed company<br />
(Godrej Agrovet Ltd) in Andhra Pradesh, Punjab <strong>and</strong> Tamil Nadu, on a trial basis.<br />
Limited experimental results are available, but at least one trial with grass carps<br />
indicates that FCRs <strong>of</strong> less than 1 are possible with manufactured <strong>feeds</strong>. The total<br />
volume <strong>of</strong> manufactured <strong>feeds</strong> sold <strong>for</strong> freshwater fish culture is estimated to be<br />
10 000 tonnes/year.<br />
As shown in Table 12, an estimated 6.83 million tonnes <strong>of</strong> ingredients are used to<br />
make farm-made <strong>feeds</strong> <strong>for</strong> fish production. Of this volume, at least 3 million tonnes are<br />
used to produce farm-made <strong>feeds</strong> <strong>for</strong> intensive carp production. In the Kolleru area <strong>of</strong><br />
Andhra Pradesh, some 1.8 million tonnes <strong>of</strong> ingredients are used <strong>for</strong> the manufacture<br />
<strong>of</strong> farm-made carp <strong>feeds</strong>.<br />
De-oiled rice bran is the major ingredient <strong>of</strong> all fish <strong>feeds</strong> in India <strong>and</strong> is used either<br />
singly or in combination with other ingredients. In the Cauvery delta, maize is ground<br />
<strong>and</strong> mixed with rice bran <strong>and</strong> groundnut cake to feed carps. The typical ratio <strong>of</strong> mixing<br />
is 2:1:1 <strong>of</strong> rice bran, maize <strong>and</strong> groundnut cake. In Andhra Pradesh, one or more <strong>of</strong> the<br />
following seven ingredients are mixed with rice bran to feed carps: rice polish, broken<br />
rice, groundnut cake, cottonseed cake, sunflower cake, meat meal <strong>and</strong> soybean meal.<br />
Veerina et al. (1993) observed that a combination <strong>of</strong> groundnut oilseed cake <strong>and</strong> rice<br />
bran was used by about 75 percent <strong>of</strong> farmers in the Kolleru area. A more recent survey<br />
indicated that the majority <strong>of</strong> farmers use a blend <strong>of</strong> rice bran, groundnut oilseed cake<br />
<strong>and</strong> cotton oilseed cake. The <strong>for</strong>mulation <strong>and</strong> proximate composition <strong>of</strong> this feed are<br />
shown in Table 13.<br />
TABLE 12<br />
Estimated feed requirements based on aquaculture production in India in 2004<br />
Production<br />
(tonnes)<br />
Type <strong>of</strong> Feed<br />
Current<br />
FCR<br />
Current<br />
volume <strong>of</strong><br />
feed use<br />
(tonnes)<br />
FCR <strong>of</strong><br />
manufacured<br />
feed<br />
Potential<br />
volume <strong>of</strong><br />
manufactured<br />
feed<br />
(tonnes)<br />
Fish<br />
Carps 2 026 3271 Farm-made2 3 6 078 981 1.0 2 026 327<br />
Snakeheads 29 949 Farm-made 5 149 745 2.0 59 898<br />
Catfishes 42 160 Farm-made 4 168 640 1.5 63 240<br />
Other fishes 108 958 Farm-made 4 435 832 1.5 163 437<br />
Total fish <strong>feeds</strong><br />
Crustaceans<br />
6 833 198 2 312 902<br />
Freshwater<br />
prawns<br />
38 965 Manufactured3 1.6 62 344 1.6 62 344<br />
Penaeid shrimp 133 020 Manufactured3 1.6 212 832 1.6 212 832<br />
Total crustacean<br />
<strong>feeds</strong><br />
275 176 275 176<br />
Total aqua<strong>feeds</strong> 7 108 374 2 588 078<br />
1 Carp production data modified by subtracting 90 000 tonnes from FAO data <strong>for</strong> 2004 on the assumption that<br />
90 000 tonnes are produced from stock-<strong>and</strong>-harvest fisheries that are not fed.<br />
2 About 10 000 tonnes <strong>of</strong> manufactured <strong>feeds</strong> are used in freshwater fish culture.<br />
3 Farm-made <strong>feeds</strong> are used in some prawn <strong>and</strong> penaeid shrimp farms in extensive farms in Kerala, Orissa <strong>and</strong> West<br />
Bengal. The exact volume <strong>of</strong> use is not known, but it is not likely to exceed 30 000 tonnes.<br />
Source: FAO (2006) <strong>and</strong> as modified.
Development <strong>of</strong> the aquafeed industry in India 235<br />
Many carp farmers in the Kolleru area feed their fish only<br />
with de-oiled rice bran <strong>and</strong> rice polish up to a size <strong>of</strong> 500 g,<br />
whereafter oil seed residues <strong>and</strong> other protein concentrates<br />
are added to the feed. The daily ration depends on fish<br />
body weight as shown in Table 14. More details on the<br />
composition <strong>of</strong> farm-made <strong>feeds</strong> <strong>and</strong> feeding practices may<br />
be found in Ayyappan <strong>and</strong> Ahamad Ali (2007).<br />
The American Soybean Association (ASA) has been<br />
conducting trials in the Cauvery delta region <strong>of</strong> Tamil Nadu<br />
(Thanjavur district) to compare the per<strong>for</strong>mance <strong>of</strong> carps<br />
fed traditional farm-made <strong>feeds</strong> <strong>and</strong> an extruded floating<br />
feed. It is reported that the fish on extruded floating <strong>feeds</strong><br />
reached market size (~450 g) earlier than fish on farmmade<br />
<strong>feeds</strong> <strong>and</strong> achieved a FCR close to 1:1, while the<br />
fish on farm-made <strong>feeds</strong> had a FCR <strong>of</strong> 2-3:1 (P.E. Vijay<br />
An<strong>and</strong>, pers. comm.) The typical FCR <strong>of</strong> intensive carp<br />
culture systems using farm-made <strong>feeds</strong> ranges from 3 to<br />
4:1. The cost <strong>of</strong> feed is typically Rs 13.5–15.75/kg <strong>of</strong> fish<br />
(US$0.3–0.35).<br />
TABLE 13<br />
Composition <strong>and</strong> estimated cost <strong>of</strong><br />
farm-made <strong>feeds</strong> used in carp farms in<br />
the Kolleru area <strong>of</strong> Andhra Pradesh<br />
Ingredient composition Percent<br />
De-oiled rice bran 80<br />
Groundnut cake 10<br />
Cottonseed cake<br />
Proximate composition<br />
10<br />
Crude protein 20<br />
Crude fat 2<br />
Crude fibre 15<br />
Ash 17<br />
Estimated cost (Indian Rs/kg) 4.5<br />
Estimated cost (US$/kg) 0.1<br />
Source: R. Ramakrishna, pers. comm. (2005).<br />
TABLE 14<br />
Daily ration <strong>for</strong> intensive carp farming<br />
systems in the Kolleru area <strong>of</strong> Andhra<br />
Pradesh<br />
Fish size<br />
(kg)<br />
5.2 Feed production <strong>for</strong> shrimp <strong>and</strong> prawns<br />
India has a well-established capacity to produce <strong>feeds</strong> <strong>for</strong><br />
shrimp <strong>and</strong> prawn culture. Until 1990 the sector relied<br />
solely on farm-made <strong>feeds</strong>. With the advent <strong>of</strong> largescale<br />
semi-intensive shrimp culture in the early 1990s,<br />
vast quantities <strong>of</strong> shrimp <strong>feeds</strong> were imported from Taiwan Province <strong>of</strong> China <strong>and</strong><br />
Thail<strong>and</strong>. However, imports have gradually been replaced by domestically produced<br />
<strong>feeds</strong>. Currently, the domestic shrimp feed manufacturing capacity exceeds dem<strong>and</strong>.<br />
However, about 3 000 tonnes <strong>of</strong> shrimp feed is imported from Indonesia, China,<br />
Taiwan Province <strong>of</strong> China <strong>and</strong> South Africa to cater to the needs <strong>of</strong> niche markets.<br />
Additionally, about 30 tonnes <strong>of</strong> larval shrimp <strong>feeds</strong> are imported as India lacks the<br />
capacity to produce these specialty diets.<br />
Many <strong>of</strong> the traditional, extensive shrimp <strong>and</strong> prawn farms in Kerala <strong>and</strong> West Bengal<br />
either provide no feed or only use farm-made <strong>feeds</strong>. Production from these systems is<br />
likely to be about 30 000 tonnes a year. However, the bulk (130 000–140 000 tonnes)<br />
<strong>of</strong> freshwater prawn <strong>and</strong> shrimp production is reliant on manufactured <strong>feeds</strong>. In 2004,<br />
an estimated 193 500 tonnes <strong>of</strong> prawn <strong>and</strong> shrimp <strong>feeds</strong> were manufactured <strong>and</strong> sold<br />
in India.<br />
India has about 28 feed mills dedicated to the production <strong>of</strong> freshwater prawn <strong>and</strong><br />
shrimp <strong>feeds</strong> (Table 15). Ten <strong>of</strong> these mills are subsidiaries to international aquafeed<br />
companies. Collectively, these companies account <strong>for</strong> 90 percent <strong>of</strong> shrimp <strong>and</strong> prawn<br />
feed sales in India.<br />
Table 16 details the regional distribution <strong>of</strong> shrimp <strong>and</strong> prawn feed mills. It is<br />
apparent from this table that India has an excess shrimp <strong>and</strong> prawn feed manufacturing<br />
capacity. The installed capacity exceeds 500 000 tonnes per year, twice the current<br />
annual requirement. However, the shrimp feed business is highly seasonal (Figure 8).<br />
As a result, in the past disruptions in feed distribution have occurred periodically during<br />
the peak season (May–July). It is estimated that at the peak <strong>of</strong> shrimp production, the<br />
country requires about 1 100 tonnes <strong>of</strong> feed per day. The current installed capacity <strong>of</strong><br />
1 900 tonnes/day implies that supply disruptions are now less likely to occur. In spite<br />
<strong>of</strong> the adequate to excess capacity, many <strong>for</strong>eign feed manufacturers still consider India<br />
as a growing market in the shrimp feed business <strong>and</strong> are investigating the possibility <strong>of</strong><br />
entering it directly or through a local partner.<br />
Ration<br />
(% body weight/day)<br />
2.0 1.5
236<br />
<strong>Study</strong> <strong>and</strong> <strong>analysis</strong> <strong>of</strong> <strong>feeds</strong> <strong>and</strong> <strong>fertilizers</strong> <strong>for</strong> <strong>sustainable</strong> aquaculture development<br />
TABLE 15<br />
Companies involved in the production <strong>of</strong> freshwater prawn <strong>and</strong> marine shrimp <strong>feeds</strong> in India<br />
Company No. <strong>of</strong> plants Description<br />
CP India 2 Thail<strong>and</strong>-based multinational feed company<br />
Avanti 1 Local company that has technology partnership with Thai Union, a<br />
leading feed company in Thail<strong>and</strong><br />
Waterbase 1 Local company that has technology partnership with INVE, a Belgian<br />
company specializing in Artemia <strong>and</strong> larval <strong>feeds</strong><br />
Higashimaru 1 Local company that bought technology <strong>and</strong> br<strong>and</strong> name licence<br />
from Higashimaru, Japan<br />
Grobest 1 A multinational feed company based in Taiwan Province <strong>of</strong> China<br />
Godrej Agrovet 1 The largest livestock feed company in India that has recently<br />
entered into a collaboration agreement with Uni-President <strong>of</strong><br />
Taiwan Province <strong>of</strong> China, a multinational shrimp feed company<br />
Gold Mohur 1 A subsidiary <strong>of</strong> Godrej Agrovet (previously owned by Hindustan<br />
Lever) that uses the br<strong>and</strong> licence <strong>of</strong> Hanaqua Feeds, Taiwan<br />
Province <strong>of</strong> China<br />
Laila Global 1 Local company that has partnered with Global Feeds <strong>of</strong> Indonesia<br />
Cargill Matrix 1 The largest livestock feed company in the world that has recently<br />
entered into a partnership arrangement with a local company<br />
Local 18 Small-scale feed mills (average capacity 1 tonne/hour) that produce<br />
their own <strong>for</strong>mulations or <strong>for</strong>mulations provided by the farmers<br />
Steam pelleting technology combined with post-pellet conditioning is used to<br />
manufacture prawn <strong>and</strong> shrimp <strong>feeds</strong> in India. Most feed mills have installed capacities<br />
<strong>for</strong> fine grinding, extended pre-conditioning (multipass, steam-jacketed conditioners<br />
with 1–2 minutes <strong>of</strong> retention time) (Figure 9), pelleting through die holes down to<br />
1.8 mm <strong>and</strong> live-steam post-conditioning. Crumblers are used to produce particles <strong>for</strong><br />
feeding PLs stocked in ponds.<br />
Specifications used by manufacturers <strong>of</strong> prawn <strong>feeds</strong> are shown in Table 17.<br />
Nutrient density <strong>of</strong> freshwater prawn <strong>feeds</strong> is lower than that <strong>of</strong> marine shrimp<br />
<strong>feeds</strong> (Table 18). Indian shrimp farmers have high quality expectations. The <strong>feeds</strong> are<br />
expected to have at least three hours <strong>of</strong><br />
TABLE 16<br />
Regional distribution <strong>of</strong> shrimp <strong>and</strong> prawn feed<br />
manufacturing plants in India<br />
Region<br />
Number <strong>of</strong><br />
feed plants<br />
Installed capacity**<br />
(tonnes/day)<br />
Andhra Pradesh, northern* 10 740<br />
Andhra Pradesh, southern 11 320<br />
Tamil Nadu 6 720<br />
Kerala 1 120<br />
Total 28 1 900<br />
* One feed plant located in the Union Territory <strong>of</strong> Pondichery has<br />
been included in the northern Andhra Pradesh .<br />
** Estimate based on 20 work hours per day.<br />
Percent sales<br />
16<br />
14<br />
12<br />
10<br />
8<br />
6<br />
4<br />
2<br />
0<br />
FIGURE 8<br />
Monthly sales <strong>of</strong> shrimp feed in India<br />
Jan Feb Mar Apr May Jun Jul Aug Sep Oct Noc Dec<br />
M o n th s<br />
water stability <strong>and</strong> low levels <strong>of</strong> fines.<br />
Farmers expect shrimp to grow to about<br />
3 g in size after the first four weeks <strong>of</strong><br />
stocking; thereafter they are expected<br />
to grow at a rate <strong>of</strong> 2 g/week until they<br />
reach about 25 g. After reaching 25 g,<br />
they are expected to grow at a rate <strong>of</strong><br />
3 g/week. In 2004, MPEDA released a<br />
set <strong>of</strong> quality specifications <strong>for</strong> shrimp<br />
<strong>feeds</strong> in India (Table 19). Compliance is<br />
voluntary at present. The specifications<br />
are considered incomplete because many<br />
key nutrients such as phosphorus <strong>and</strong><br />
vitamin C have not been specified.<br />
Farmers frequently topcoat the <strong>feeds</strong><br />
with vitamins, minerals, squid oil, lecithin,<br />
Spirulina, probiotic bacteria <strong>and</strong> yeast,<br />
immuno-stimulants <strong>and</strong> feed attractants.<br />
Some farmers topcoat every feed they use.<br />
However, the majority only topcoat their<br />
<strong>feeds</strong> <strong>for</strong> use during specific production<br />
phases when they consider growth rates<br />
to be declining or when environmental<br />
conditions are unfavourable. Evaluation <strong>of</strong><br />
the effectiveness <strong>of</strong> topcoating is lacking,
Development <strong>of</strong> the aquafeed industry in India 237<br />
although some preliminary investigations reveal that<br />
most water-soluble vitamins <strong>and</strong> minerals are lost. It is<br />
estimated that top-coating typically increases the cost<br />
<strong>of</strong> feed by Rs 1 500 (US$33.33) per tonne.<br />
The increase in global supply <strong>of</strong> farmed shrimp<br />
against a relatively stable dem<strong>and</strong> in recent years has<br />
caused a gradual <strong>and</strong> possibly irreversible fall in the<br />
price <strong>of</strong> shrimp. As shrimp is a global commodity,<br />
producer countries need to be highly competitive.<br />
This competitiveness is even more important <strong>for</strong><br />
countries such as India in which domestic consumption<br />
<strong>of</strong> shrimp is insignificant <strong>and</strong> which relies almost<br />
exclusively on exports. While India is competitive in<br />
terms <strong>of</strong> labour costs, it is highly uncompetitive with<br />
respect to feed <strong>and</strong> energy costs. Figure 10 shows<br />
that feed price is the highest among the major shrimp<br />
producing countries. This is in spite <strong>of</strong> the fact that<br />
India enjoys a competitive position<br />
with respect to the price <strong>of</strong> soybean<br />
meal <strong>and</strong> wheat in comparison with<br />
other major shrimp producers in<br />
Southeast Asia (Table 20). However,<br />
India is at a considerable disadvantage<br />
with respect to the price <strong>of</strong> fishmeal,<br />
all <strong>of</strong> which is imported, <strong>and</strong> <strong>for</strong> the<br />
tariffs imposed on imported additives.<br />
One should bear in mind, however,<br />
that L. vannamei is the predominant<br />
species in all major shrimp producing<br />
countries except Viet Nam, India <strong>and</strong><br />
Bangladesh where P. monodon is still<br />
the dominant species. L. vannamei<br />
<strong>feeds</strong> are lower in nutrient density<br />
<strong>and</strong> quality when compared to P. monodon <strong>feeds</strong> <strong>and</strong> there<strong>for</strong>e cheaper.<br />
TABLE 17<br />
Specifications commonly used <strong>for</strong> freshwater prawn <strong>feeds</strong> manufactured in India<br />
Feed class<br />
Target<br />
prawn size<br />
(g)<br />
Feed type<br />
Feed size<br />
(mm)<br />
Crude<br />
protein<br />
(%)<br />
Crude<br />
lipid<br />
(%)<br />
Price/tonne*<br />
Indian Rs US$<br />
Starter 0.5–5 Crumble 1.0–1.5 32–40 4–8 36 000–48 000 800–1 067<br />
Grower 5–25 Pellet 2.0–2.3 24–30 3–4 24 000–36 000 533–800<br />
Finisher >25 Pellet 2.3 18–28 3–4 20 000–28 000 444–622<br />
* Price range reflects protein content.<br />
TABLE 18<br />
Specifications commonly used <strong>for</strong> marine shrimp <strong>feeds</strong> manufactured in india<br />
Feed class<br />
Target<br />
prawn size<br />
(g)<br />
Feed type<br />
Feed size<br />
(mm)<br />
Cost (US$ per tonne)<br />
Crude<br />
protein<br />
(%)<br />
Crude<br />
lipid<br />
(%)<br />
FIGURE 9<br />
Shrimp pellet mill with triple-pass<br />
conditioning<br />
Steam pelleting technology combined<br />
with post-pellet conditioning is used to<br />
manufacture prawn <strong>and</strong> shrimp feed in<br />
India<br />
Price/tonne*<br />
Indian Rs US$<br />
Starter 0.5–5<br />
Crumble,<br />
short-cut<br />
pellets<br />
0.5–1.8 40–44 6–8 44 000–48 000 978–1 067<br />
Grower 5–20 Pellet 1.8–2.3 38–42 4–8 41 000–43 000 911–956<br />
Finisher >20 Pellet 2.3 36–38 4–8 38 000–41 000 844–911<br />
* Range in price reflects range in protein level.<br />
900<br />
800<br />
700<br />
600<br />
500<br />
400<br />
300<br />
200<br />
100<br />
0<br />
FIGURE 10<br />
Typical cost <strong>of</strong> shrimp <strong>feeds</strong> in various countries<br />
Panama<br />
Ecuador<br />
Venezuela<br />
China<br />
Mexico<br />
Brazil<br />
Source: data collected by the author in 2004.<br />
Malaysia<br />
Thail<strong>and</strong><br />
Australia<br />
India<br />
Indonesia
238<br />
<strong>Study</strong> <strong>and</strong> <strong>analysis</strong> <strong>of</strong> <strong>feeds</strong> <strong>and</strong> <strong>fertilizers</strong> <strong>for</strong> <strong>sustainable</strong> aquaculture development<br />
TABLE 19<br />
Quality norms prescribed by the Marine Products Export Development Authority <strong>for</strong> shrimp<br />
<strong>feeds</strong> sold in India (percent dry matter basis except otherwise indicated)<br />
Starter Grower Finisher<br />
Crude protein 40–45 30–35 30–35<br />
Non-protein nitrogen
Development <strong>of</strong> the aquafeed industry in India 239<br />
For the small- <strong>and</strong> medium-scale farmers, who comprise the majority <strong>of</strong> the<br />
prawn <strong>and</strong> shrimp farmers in India, the major constraint in the use <strong>of</strong> commercially<br />
manufactured feed is the cost <strong>of</strong> production. The relatively constant feed price compared<br />
with falling shrimp prices means that feed cost as a proportion <strong>of</strong> total production cost<br />
continues rising to unpr<strong>of</strong>itable levels. It is possible to reduce feed costs by by-passing<br />
the distribution network <strong>and</strong> buying directly from the feed manufacturer on a cash<br />
basis. For the small- <strong>and</strong> medium-scale farmers, such a bypass is not a realistic option<br />
as they lack the economy <strong>of</strong> scale <strong>and</strong> access to adequate credit. In such a situation, one<br />
<strong>of</strong> the following may occur:<br />
1. The shrimp production <strong>and</strong> processing sector will start to integrate vertically<br />
to achieve higher efficiencies. A number <strong>of</strong> shrimp feed manufacturers in<br />
India already own hatcheries, farms <strong>and</strong> processing factories. A number <strong>of</strong><br />
large shrimp producers already own or consider owning a feed manufacturing<br />
business. In this scenario, small- <strong>and</strong> medium-scale farmers will either sell their<br />
operations to the larger players or become contract producers.<br />
2. Small- <strong>and</strong> medium-scale farmers will achieve better economies <strong>of</strong> scale through<br />
a cooperative <strong>for</strong>m <strong>of</strong> collective bargaining <strong>and</strong>/or higher efficiency <strong>of</strong> feed use<br />
so that the proportion <strong>of</strong> feed cost to total feed cost is held in check.<br />
3. The feed manufacturers will reduce their pr<strong>of</strong>it margins or improve their<br />
production <strong>and</strong> distribution efficiencies to pass on the margin differential to the<br />
farmers.<br />
Scenarios (1) <strong>and</strong> (3) will depend on market <strong>for</strong>ces, while scenario (2) will<br />
depend on deliberate policy intervention by government <strong>and</strong> other institutions (see<br />
recommendations).<br />
Contrary to the prawn <strong>and</strong> shrimp farming sectors, fish farmers still rely mainly<br />
on farm-made <strong>feeds</strong>. The primary reason why manufactured <strong>feeds</strong> are not used in fish<br />
farming in India is the farmers’ reluctance to use them based <strong>of</strong> the perception that<br />
they would not be cost-effective. This reluctance has in turn retarded the interest <strong>of</strong><br />
feed manufacturers to develop <strong>and</strong> launch <strong>feeds</strong> <strong>for</strong> the fish farming sector. Preliminary<br />
in<strong>for</strong>mation emerging from trials carried out by some <strong>of</strong> the large feed manufacturers<br />
<strong>and</strong> others (e.g. Godrej Agrovet <strong>and</strong> ASA) in India show that the perception <strong>of</strong> the<br />
farmers may not be correct. Under intensive farming conditions using current farmmade<br />
<strong>feeds</strong> at a cost <strong>of</strong> Rs 4–4.5/kg (US$0.08–0.10) the average FCRs range from 3 to<br />
4:1. The cost <strong>of</strong> feed to produce one kg <strong>of</strong> fish is around Rs 14.00–15.75 (US$0.31–<br />
0.35). This means that an extruded feed with a FCR <strong>of</strong> 1:1 at a cost <strong>of</strong> Rs 13–14/kg<br />
(US$0.28–0.31) should theoretically be acceptable to the farmers. The recent drop in<br />
the price <strong>of</strong> extrusion plants made in China makes the prospect <strong>of</strong> af<strong>for</strong>dable extruded<br />
<strong>feeds</strong> a real possibility. It is predicted that at least 30 percent <strong>of</strong> intensive carp, catfish<br />
<strong>and</strong> snakehead farmers are likely to use extruded <strong>feeds</strong> be<strong>for</strong>e 2010. This would equate<br />
to a production <strong>of</strong> about 250 000 tonnes <strong>of</strong> <strong>feeds</strong>, resulting in a doubling <strong>of</strong> the current<br />
level <strong>of</strong> aquafeed production.<br />
The use <strong>of</strong> manufactured <strong>feeds</strong> would also lead to a reduction in water <strong>and</strong> pond<br />
substratum pollution, thereby reducing the costs associated with managing water<br />
quality <strong>and</strong> stress/disease, <strong>and</strong> this would facilitate higher stocking densities <strong>and</strong> yields.<br />
In addition, labour costs could be substantially reduced.<br />
However, there are two major constraints to the use <strong>and</strong> manufacture <strong>of</strong> compounded<br />
<strong>feeds</strong> <strong>for</strong> fish farming in India. First, farmers are constrained by the low price <strong>of</strong> fish<br />
in certain markets <strong>and</strong> during certain times <strong>of</strong> the year such that they cannot af<strong>for</strong>d<br />
manufactured <strong>feeds</strong>. Second, feed manufacturers are equally constrained by the<br />
buying power <strong>of</strong> the farmers, which reduces their flexibility with respect to the use<br />
<strong>of</strong> ingredients to produce cost-effective <strong>feeds</strong>. Remedial suggestions are provided in<br />
section 7.
240<br />
<strong>Study</strong> <strong>and</strong> <strong>analysis</strong> <strong>of</strong> <strong>feeds</strong> <strong>and</strong> <strong>fertilizers</strong> <strong>for</strong> <strong>sustainable</strong> aquaculture development<br />
7. RECOMMENDATIONS FOR IMPROVED UTILIZATION OF INDUSTRIALLY<br />
MANUFACTURED AQUAFEEDS<br />
It is clear from the above synthesis that industrially manufactured <strong>feeds</strong> confer several<br />
microeconomic benefits. The lower FCRs achieved by the use <strong>of</strong> manufactured <strong>feeds</strong><br />
leads to the improved utilization <strong>of</strong> national feed ingredient resources. Moreover, farming<br />
operations are simplified <strong>and</strong> streamlined leading to improved operational efficiency,<br />
higher yields per unit volume/area <strong>of</strong> water <strong>and</strong> higher pr<strong>of</strong>itability. Other benefits include<br />
improved fish quality, farm biosecurity <strong>and</strong> sanitation, etc. To improve the utilization <strong>of</strong><br />
industrially manufactured feed, the following recommendations are made.<br />
7.1 Freshwater fish culture sector<br />
The primary <strong>and</strong> immediate need is to help farmers to underst<strong>and</strong> the value <strong>of</strong><br />
manufactured <strong>feeds</strong>. There have been some “on-farm” trials to demonstrate the<br />
per<strong>for</strong>mance <strong>of</strong> industrially manufactured extruted pellets in intensive culture <strong>of</strong> carps<br />
(see sections 5.1 <strong>and</strong> 6 <strong>for</strong> results <strong>of</strong> some <strong>of</strong> the trials conducted). Although some<br />
<strong>of</strong> these trials use a relatively expensive feed <strong>for</strong>mulation, it is anticipated that a less<br />
expensive <strong>for</strong>mulation could result in an equivalent economic per<strong>for</strong>mance. Trials with<br />
alternative, lower cost <strong>for</strong>mulations will provide useful in<strong>for</strong>mation <strong>for</strong> farmers <strong>and</strong><br />
feed manufacturers alike. Research institutions working on freshwater fish nutrition<br />
need to place greater emphasis on underst<strong>and</strong>ing the nutrient composition <strong>of</strong> local,<br />
commercially available ingredients, such as de-oiled rice bran, rice polish, wheat bran,<br />
maize, sorghum, millets, broken rice, groundnut cake, cotton oilseed cake, soybean<br />
meal, sunflower meal, copra meal, maize gluten meal, local fishmeal, shrimp meal,<br />
blood meal, meat meal <strong>and</strong> feather meal. This would require closer collaboration<br />
between research institutions <strong>and</strong> the industry.<br />
The long-term goal <strong>for</strong> improved utilization <strong>of</strong> <strong>feeds</strong> in freshwater fish farming is to<br />
improve the market price <strong>for</strong> fish. This goal is only possible through a systematic <strong>and</strong><br />
sustained campaign to promote fish as food <strong>and</strong> ensuring that fish <strong>of</strong> a high quality are<br />
available to the consumer. The success <strong>of</strong> such an initiative requires all stakeholders (feed<br />
manufacturers, farmers, suppliers <strong>of</strong> other inputs to the farmers, <strong>and</strong> those in fish supply<br />
business) to unite <strong>and</strong> pool their resources. Broiler <strong>and</strong> egg producers in India have been<br />
successful in running <strong>and</strong> benefiting from such generic campaigns. Lessons can also be<br />
learned from generic promotion campaigns <strong>for</strong> soybeans, milk, cotton <strong>and</strong> catfish.<br />
7.2 For the freshwater prawn <strong>and</strong> marine shrimp culture sector<br />
The primary <strong>and</strong> immediate objective is to address those factors that have an impact on<br />
the price <strong>of</strong> feed. Among others these include:<br />
1. The import tariff on additives is excessively high in comparison with other major<br />
shrimp producers in Asia <strong>and</strong> needs to be reduced.<br />
2. The import permitting system <strong>for</strong> feed ingredients needs to be st<strong>and</strong>ardized<br />
<strong>and</strong> harmonized such that the importation process is free from unnecessary<br />
bureaucratic control.<br />
3. It is possible that some <strong>of</strong> the available <strong>for</strong>mulated <strong>feeds</strong> are over<strong>for</strong>mulated <strong>for</strong><br />
certain nutrients <strong>and</strong> ingredients. Facilities need to be established to conduct<br />
field trials. Creative solutions, such as the establishment <strong>of</strong> pubic / private<br />
entities, need to be found.<br />
4. The nutritive value <strong>of</strong> locally available ingredients such as soybean meal,<br />
fishmeal, fish oil <strong>and</strong> shrimp meal may be improved by improving the processes<br />
used to produce these commodities. Policy-level initiatives such as technological<br />
assistance <strong>and</strong> incentives <strong>for</strong> processors would help.<br />
5. The nutritive value <strong>of</strong> locally available ingredients such as coarse grains, grain<br />
by-products <strong>and</strong> oilseed residues <strong>for</strong> freshwater prawn <strong>and</strong> marine shrimp need<br />
to be established through research.
Development <strong>of</strong> the aquafeed industry in India 241<br />
6. While scientists in research institutions such as the Central Institute <strong>of</strong> Brackishwater<br />
Aquaculture <strong>and</strong> the Central Institute <strong>of</strong> Freshwater Aquaculture have<br />
developed low-cost feed <strong>for</strong>mulation options <strong>for</strong> shrimp <strong>and</strong> freshwater prawns,<br />
respectively, reliable feed per<strong>for</strong>mance data under field conditions prevent<br />
widespread use <strong>of</strong> such <strong>for</strong>mulations. Closer collaboration between public<br />
institutions <strong>and</strong> the industry is required to achieve this goal.<br />
7. Feed application research is necessary to improve the efficiency <strong>of</strong> feed utilization<br />
to reduce the cost <strong>of</strong> feed per unit <strong>of</strong> production. A study by Hari et al. (2004) is<br />
a case in point. They found that P. monodon raised on 25 percent protein <strong>feeds</strong><br />
grew as fast as, or slightly better than, those raised on 40 percent protein <strong>feeds</strong> as<br />
long as the culture systems are provided with a source <strong>of</strong> carbohydrate (tapioca<br />
flour) to promote heterotrophic bacterial growth. A 35 percent reduction in feed<br />
cost <strong>and</strong> a 54 percent increase in revenue were recorded <strong>for</strong> the low protein feed<br />
plus carbohydrate treatment when compared to the high protein <strong>feeds</strong> alone.<br />
8. A significant h<strong>and</strong>icap <strong>for</strong> the small- <strong>and</strong> medium-scale farmers in managing the<br />
cost <strong>of</strong> feed is their lack <strong>of</strong> economies <strong>of</strong> scale <strong>and</strong> cheaper credit. Ef<strong>for</strong>ts should<br />
be made by the central <strong>and</strong> state government agencies promoting aquaculture to<br />
nurture the development <strong>of</strong> farmer cooperatives that would provide collective<br />
bargaining power <strong>for</strong> the purchasing <strong>of</strong> <strong>feeds</strong>, credit <strong>and</strong> other inputs.<br />
9. Disease problems such as loose shell disease severely affect feed utilization.<br />
More resources should be employed on a timely basis to address such problems<br />
so that farmers can be educated on ways to prevent such outbreaks.<br />
The long-term aim should include working towards <strong>and</strong> improvement in the market<br />
price <strong>for</strong> shrimp. While new export markets <strong>and</strong> opportunities need to be identified<br />
<strong>and</strong> opened, the biggest opportunity most likely remains at home. As the Indian<br />
economy improves <strong>and</strong> disposable income <strong>of</strong> the growing middle class increases,<br />
ef<strong>for</strong>ts to increase domestic consumption <strong>of</strong> shrimp <strong>and</strong> freshwater prawns are likely<br />
to be effective in increasing local dem<strong>and</strong>. The generic campaign ideas discussed above<br />
<strong>for</strong> freshwater fish are also applicable to the shrimp <strong>and</strong> freshwater prawn sectors.<br />
ACKNOWLEDGEMENTS<br />
The author wishes to thank the following <strong>for</strong> providing valuable in<strong>for</strong>mation without<br />
which this report could not have been produced.<br />
Dr P.E. Vijay An<strong>and</strong>, Consultant, American Soybean Association, New Delhi, India<br />
Dr Dinesh Bhosale, Regional Ruminant Manager <strong>for</strong> Asia, Alltech, Pune, India<br />
Mr S. Santhanakrishnan, President, Society <strong>of</strong> Aquaculture Pr<strong>of</strong>essionals, Chennai, India<br />
Mr S. Ch<strong>and</strong>rasekar, Country Manager, INVE, Chennai, India<br />
Mr Ravi Ramakrishna, Fisheries Research Station, Acharya NG Ranga Agricultural<br />
University, Kovvali, Andhra Pradesh, India<br />
Mr D. Haribabu, Assistant Pr<strong>of</strong>essor, Acharya NG Ranga Agricultural University,<br />
Nellore, Andhra Pradesh, India<br />
Dr H. Shivan<strong>and</strong>a Murthy, Pr<strong>of</strong>essor, College <strong>of</strong> Fisheries, Karnataka Veterinary<br />
Animal <strong>and</strong> Fisheries Sciences University, Mangalore, India<br />
REFERENCES<br />
Ayyappan, S. & Ahamad Ali, S.A. 2007. Analysis <strong>of</strong> <strong>feeds</strong> <strong>and</strong> <strong>fertilizers</strong> <strong>for</strong> <strong>sustainable</strong><br />
aquaculture development in India (this volume).<br />
Ayyappan, S. & Diwan, A.D. 2004. Road map to increase fish production <strong>and</strong> productivity<br />
in India. Fishing Chimes, 24 (4): 24–26.<br />
CLFMA (Compound Livestock Feed Manufacturers Association). 2005. Summary report<br />
on feed in the 2005 Annual Meeting in Goa. Mumbai, India.
242<br />
<strong>Study</strong> <strong>and</strong> <strong>analysis</strong> <strong>of</strong> <strong>feeds</strong> <strong>and</strong> <strong>fertilizers</strong> <strong>for</strong> <strong>sustainable</strong> aquaculture development<br />
FAO. 2006. FAO Fisheries Department, Fishery In<strong>for</strong>mation, Data <strong>and</strong> Statistics Unit.<br />
Fishstat Plus: Universal s<strong>of</strong>tware <strong>for</strong> fishery statistical time series. Aquaculture production:<br />
quantities 1950-2004, Aquaculture production: values 1984-2004; Capture production:<br />
1950-2004; Commodities production <strong>and</strong> trade: 1950-2004; Total production: 1970-2004,<br />
Vers. 2.30 (available at www.fao.org/fi/statist/FISOFT/FISHPLUS.asp)<br />
Directorate <strong>of</strong> Economics <strong>and</strong> Statistics, Ministry <strong>of</strong> Agriculture. 2003. Livestock census<br />
2003. Provisional report. New Delhi.<br />
FAO. 2005. Fishstat Plus: Universal s<strong>of</strong>tware <strong>for</strong> fishery statistical time series. Aquaculture<br />
production: quantities 1950–2003, Aquaculture production: values 1984–2003; Capture<br />
production: 1950-2003; Commodities production <strong>and</strong> trade: 1950–2004; Total production:<br />
1970–2003. Vers. 2.30. FAO Fisheries Department, Fishery In<strong>for</strong>mation, Data <strong>and</strong><br />
Statistics Unit, Rome (available at www.fao.org/fi/statist/FISOFT/FISHPLUS.asp).<br />
Hari, B., Kurup, B.M., Varghese, J.T., Schram, J.W. & Verdegem, M.C.J. 2004. Effects <strong>of</strong><br />
carbohydrate addition on production in extensive shrimp culture systems. Aquaculture,<br />
241:179–194.<br />
Hindu Survey <strong>of</strong> Indian Agriculture. 2004. Hindu Newspaper Group, Chennai, India.<br />
Nath, D. & Das, A.K. 2004. Present status <strong>and</strong> opportunities <strong>for</strong> the development <strong>of</strong><br />
Indian riverine, reservoir <strong>and</strong> beel fisheries. Fishing Chimes, 24 (1): 61–67.<br />
Veerina, S.S., N<strong>and</strong>eesha, M.C., Rao, K.G. & De Silva, S.S. 1993. Status <strong>and</strong> Technology<br />
<strong>of</strong> Indian major carp farming in Andhra Pradesh, India. Special Publication No. 9, Asian<br />
Fisheries Society, Indian Branch, Mangalore, India. 76 pp.<br />
Veerina, S.S., N<strong>and</strong>eesha, M.C., De Silva, S.S. & Ahmed, M. 1999. An <strong>analysis</strong> <strong>of</strong><br />
production factors in carp farming in Andhra Pradesh, India. Aquaculture Research, 30:<br />
805–814.
Development <strong>of</strong> the aquafeed industry in India 243<br />
APPENDIX<br />
Quality norms <strong>and</strong> st<strong>and</strong>ards <strong>of</strong> livestock <strong>feeds</strong> in India<br />
A.1. Quality norms (% maximum) prescribed by CLFMA <strong>for</strong> dairy <strong>feeds</strong><br />
Characteristic<br />
Dairy special<br />
feed<br />
Type I feed Type II feed Type III feed<br />
Moisture 12.0 12.0 12.0 12.0<br />
Crude protein (dry matter basis) 22.0 20.0 18.0 16.0<br />
Undegraded protein 8.0 - - -<br />
Crude lipid 3.0 2.5 2.5 2.0<br />
Crude fibre 7.0 7.0 12.0 14.0<br />
Acid-insoluble ash 3.5 4.0 4.5 5.0<br />
A.2. Quality norms (% maximum except otherwise indicated) prescribed by CLFMA <strong>for</strong> poultry<br />
<strong>feeds</strong><br />
Characteristic<br />
Chick<br />
feed<br />
Grower<br />
feed<br />
Layer<br />
feed I<br />
Layer<br />
feed II<br />
Broiler<br />
starter<br />
feed<br />
Broiler<br />
finisher<br />
feed<br />
Breeder<br />
chick<br />
feed<br />
Breeder<br />
grower<br />
feed<br />
Broiler<br />
breeder<br />
feed<br />
Layer<br />
breeder<br />
feed<br />
Broiler<br />
male<br />
breeder<br />
feed<br />
Moisture 12 12 12 12 12 12 12 12 12 12 12<br />
Crude protein 18 14 16 14 20 18 18 14 16 16 14<br />
Crude lipid 2 2 2 2 3 3 3 3 3 3 3<br />
Crude fibre 7 8 8 10 6 5 5 7 7 7 7<br />
Acid-insoluble<br />
ash<br />
4 4 4 4 4 4 4 4 4 4 4<br />
Metabolizable<br />
energy<br />
(minimum<br />
cal/kg)<br />
2 600 2 300 2 500 2 300 2 600 2 700 2 600 2 400 2 500 2 500 2 400<br />
A.3. Quality st<strong>and</strong>ards (% maximum) set by the Bureau <strong>of</strong> Indian St<strong>and</strong>ards <strong>for</strong> poultry <strong>feeds</strong><br />
Characteristic<br />
Broiler starter<br />
feed<br />
Broiler<br />
finisher feed<br />
Chick<br />
feed<br />
Growing<br />
chicken feed<br />
Laying<br />
chicken feed<br />
Breeder<br />
layer feed<br />
Moisture 11 11 11 11 11 11<br />
Crude protein<br />
(N x 6.25)<br />
23 20 20 16 18 18<br />
Crude fibre 6 6 7 8 8 8<br />
Acid-insoluble ash 3.0 3.0 4.0 4.0 4.0 4.0<br />
Salt (as NaCl) 0.6 0.6 0.6 0.6 0.6 0.6<br />
A.4. Quality st<strong>and</strong>ards set by the Bureau <strong>of</strong> Indian St<strong>and</strong>ards <strong>for</strong> vitamins, minerals, amino<br />
acids <strong>and</strong> fatty acids in poultry <strong>feeds</strong><br />
Characteristic<br />
Broiler<br />
starter feed<br />
Broiler<br />
finisher feed<br />
Chick<br />
feed<br />
Growing<br />
chicken feed<br />
Laying<br />
chicken feed<br />
Breeder<br />
layer feed<br />
Manganese (mg/kg) 90 90 90 50 55 90<br />
Iodine (mg/kg) 1 1 1 1 1 1<br />
Iron (mg/kg) 120 120 120 90 75 90<br />
Zinc (mg/kg) 60 60 60 50 75 100<br />
Copper (mg/kg) 12 12 12 9 9 12<br />
Vitamin A (IU/kg) 6 000 6 000 6 000 6 000 8 000 8 000<br />
Vitamin D3 (IU/kg) 600 600 600 600 1 200 1 200<br />
Thiamine (mg/kg) 5 5 5 3 3 3<br />
Rib<strong>of</strong>lavin (mg/kg) 6 6 6 5 5 8<br />
Pantothenic acid (mg/kg) 15 15 15 15 15 15<br />
Nicotinic acid (mg/kg) 40 40 40 15 15 15<br />
Biotin (mg/kg) 0.2 0.2 0.02 0.15 0.15 0.20<br />
Vitamin B12 (mg/kg) 0.015 0.015 0.015 0.01 0.010 0.01<br />
Folic acid (mg/kg) 1.0 1.0 1.0 0.5 0.5 0.5<br />
Choline (mg/kg) 1 400 1 000 1 300 900 800 800<br />
Vitamin E (mg/kg) 15 15 15 10 10 15<br />
Vitamin K (mg/kg) 1.0 1.0 1.0 1.0 1.0 1.0<br />
Pyridoxine (mg/kg) 5 5 5 5 5 8<br />
Linoleic acid (mg/kg) 1 1 1 1 1 1<br />
Methionine + cystine<br />
(g/100 g)<br />
0.9 0.7 0.6 0.5 0.55 0.55
Analysis <strong>of</strong> <strong>feeds</strong> <strong>and</strong> <strong>fertilizers</strong><br />
<strong>for</strong> <strong>sustainable</strong> aquaculture<br />
development in Indonesia<br />
Abidin Nur<br />
Centre <strong>for</strong> Brackishwater Aquaculture Development<br />
Jepara, Central Java<br />
Indonesia<br />
Summary 246<br />
1. General overview <strong>of</strong> aquaculture practices <strong>and</strong> farming systems 247<br />
2. Review <strong>and</strong> <strong>analysis</strong> <strong>of</strong> aquaculture feed <strong>and</strong> feeding 251<br />
3. Development <strong>of</strong> the aquafeed industry in Indonesia 260<br />
4. Problems <strong>and</strong> constraints 262<br />
5. Resource availability <strong>and</strong> the expansion <strong>of</strong> the aquafeed industry 263<br />
6. Recommendations <strong>and</strong> suggested policy guidelines 263<br />
Acknowledgements 264<br />
References 264<br />
Nur, A. 2007. Analysis <strong>of</strong> <strong>feeds</strong> <strong>and</strong> <strong>fertilizers</strong> <strong>for</strong> <strong>sustainable</strong> aquaculture development<br />
in Indonesia. In M.R. Hasan, T. Hecht, S.S. De Silva <strong>and</strong> A.G.J. Tacon (eds). <strong>Study</strong> <strong>and</strong><br />
<strong>analysis</strong> <strong>of</strong> <strong>feeds</strong> <strong>and</strong> <strong>fertilizers</strong> <strong>for</strong> <strong>sustainable</strong> aquaculture development. FAO Fisheries<br />
Technical Paper. No. 497. Rome, FAO. pp. 245–267.<br />
245
246<br />
<strong>Study</strong> <strong>and</strong> <strong>analysis</strong> <strong>of</strong> <strong>feeds</strong> <strong>and</strong> <strong>fertilizers</strong> <strong>for</strong> <strong>sustainable</strong> aquaculture development<br />
SUMMARY<br />
Aquaculture production in Indonesia makes a significant contribution to export earnings,<br />
domestic food supply <strong>and</strong> conservation. Aquaculture production in 2003 was 1.22 million<br />
tonnes valued at US$1.72 billion <strong>and</strong> in 2004 had increased to 1.47 million tonnes valued<br />
at US$2.16 billion. In 2003 around 60 percent <strong>of</strong> total aquaculture production was from<br />
finfish culture, followed by seaweed (18.9 percent), crustaceans (16.2 percent), molluscs<br />
(0.3 percent) <strong>and</strong> others (4.7 percent). In terms <strong>of</strong> value, shrimp are the most important<br />
<strong>and</strong> during 2003 shrimp export earnings amounted to US$1.1 billion, which comprised<br />
almost 50 percent <strong>of</strong> total fisheries exports. Pacific white shrimp, Litopenaeus vannamei<br />
is now the most important shrimp aquaculture species in Indonesia.<br />
Culture systems range from extensive pond culture to intensive culture <strong>of</strong> shrimp<br />
<strong>and</strong> fish in paddy fields, earthen <strong>and</strong> concrete ponds, raceways <strong>and</strong> cages. Extensive<br />
fish aquaculture is reliant on fertilization with organic <strong>and</strong> inorganic <strong>fertilizers</strong> <strong>and</strong> the<br />
use <strong>of</strong> supplementary <strong>feeds</strong>. The use <strong>of</strong> farm-made <strong>feeds</strong> in Indonesia is limited, though<br />
small-scale farmers are encouraged to use it <strong>and</strong> in particular to make better use <strong>of</strong> local<br />
ingredients. Because <strong>of</strong> transport <strong>and</strong> labour costs organic manures are more expensive<br />
to use than inorganic <strong>fertilizers</strong>. Semi-intensive milkfish culture is also dependent on<br />
organic manure <strong>for</strong> the production <strong>of</strong> natural foods. Organic fertilizer is also used in<br />
semi-intensive shrimp culture though inorganic <strong>fertilizers</strong> are now preferred to reduce<br />
the chances <strong>of</strong> disease transmission. Urea <strong>and</strong> triple super phosphate are the most widely<br />
used inorganic <strong>fertilizers</strong> in brackish-water aquaculture. In 2003, some 19 600 tonnes<br />
<strong>of</strong> organic <strong>and</strong> 7 600 tonnes <strong>of</strong> inorganic fertilizer were used in brackish-water <strong>and</strong><br />
freshwater pond aquaculture.<br />
Shrimp are fed on <strong>for</strong>mulated, industrially manufactured pellets, as are tilapia <strong>and</strong><br />
other freshwater fish species under semi-intensive <strong>and</strong> intensive culture conditions.<br />
Farm-made <strong>feeds</strong> are used mainly <strong>for</strong> low value species <strong>and</strong> consist mainly <strong>of</strong> trash fish,<br />
sun-dried fish or locally produced fishmeal as the primary protein source that is mixed<br />
with rice bran, corn meal, molasses, tapioca <strong>and</strong> other seasonally available ingredients.<br />
The availability <strong>of</strong> trash fish is decreasing <strong>and</strong> this is a major constraint facing the smallscale<br />
aquaculture sector, as well as intensive cage <strong>and</strong> pond culture <strong>of</strong> grouper. A moist<br />
pellet <strong>for</strong> grouper aquaculture has recently been developed. Seven million tonnes <strong>of</strong><br />
animal feed was produced in 2005 , <strong>of</strong> which 595 000 tonnes consisted <strong>of</strong> aqua<strong>feeds</strong>.<br />
Indonesia is highly dependent on imported fishmeal <strong>and</strong> fish oil <strong>and</strong> this, as well as the<br />
competition from the poultry sector is considered as a future constraint <strong>for</strong> the aquafeed<br />
industry. The bulk <strong>of</strong> the soybean meal, squid meal <strong>and</strong> wheat gluten used in aqua<strong>feeds</strong><br />
is also imported. Local fishmeal processing technology must be improved to reduce the<br />
country’s dependence on imports <strong>and</strong> further research is required to make better use <strong>of</strong><br />
alternative, locally available, ingredients in aqua<strong>feeds</strong>.<br />
Indonesia uses a relatively small proportion <strong>of</strong> the area that is available <strong>and</strong> or suitable<br />
<strong>for</strong> aquaculture <strong>and</strong> this together with the intensification <strong>of</strong> culture practices provides<br />
opportunity <strong>for</strong> rapid growth <strong>of</strong> the sector. Aquaculture is expected to grow at over<br />
17 percent per annum <strong>and</strong> it is projected that aquaculture production will increase to<br />
over 4 million tonnes by 2009 <strong>and</strong> it is expected that there will be a higher dependency<br />
on commercial aqua<strong>feeds</strong>. To meet the dem<strong>and</strong> the aquafeed industry needs to gear it<br />
appropriately <strong>and</strong> find alternatives to minimize the fishmeal content in aqua<strong>feeds</strong>. The<br />
high feed dem<strong>and</strong> <strong>of</strong> L.vannamei needs urgent attention. A more cost effective feed needs<br />
to be developed to improve efficiency <strong>and</strong> to reduce environmental impacts. Greater<br />
consumer awareness <strong>of</strong> food safety issues requires the feed industry to pay greater<br />
attention to traceability <strong>of</strong> feed materials <strong>and</strong> feed processing technology.
Analysis <strong>of</strong> <strong>feeds</strong> <strong>and</strong> <strong>fertilizers</strong> <strong>for</strong> <strong>sustainable</strong> aquaculture development in Indonesia 247<br />
1. GENERAL OVERVIEW OF AQUACULTURE PRACTICES AND FARMING<br />
SYSTEMS<br />
1.1 Introduction<br />
Aquaculture has a long history in Indonesia <strong>and</strong> began with the brackish-water<br />
pond culture <strong>of</strong> milkfish (Chanos chanos) on the isl<strong>and</strong> <strong>of</strong> Java. Subsequently, wild<br />
caught shrimp larvae were introduced into the ponds <strong>and</strong> grown extensively either in<br />
monoculture or polyculture with milkfish (Poernomo, 2004). The animals were not<br />
fed <strong>and</strong> relied entirely on natural food (algae, plankton <strong>and</strong> diverse benthic organisms)<br />
which grow prolifically in warm, shallow, brackish-water ponds. Initial production<br />
levels were low (200–250 kg/ha/crop), but under favourable conditions two crops<br />
could be harvested per year (Goddard, 1996). Extensive shrimp culture was initiated<br />
in eastern Indonesia (South Sulawesi) in the mid 1960s <strong>and</strong> from there spread to<br />
other isl<strong>and</strong>s with suitable environments. The first shrimp hatchery in Indonesia was<br />
commissioned in the early 1970s in Makassar (South Sulawesi) followed by another in<br />
Jepara (Central Java) (Poernomo, 2004).<br />
During the last decade the area under culture has increased significantly (Table 1)<br />
<strong>and</strong> farming practices have been intensified <strong>and</strong> this has led to substantial increases in<br />
production. The expansion was driven largely by export <strong>and</strong> local consumer dem<strong>and</strong>,<br />
consumer awareness <strong>and</strong> the ability to grow aquatic organisms year round. Moreover,<br />
capture fisheries have declined <strong>and</strong> this gave further impetus <strong>for</strong> the growth <strong>of</strong> the<br />
aquaculture sector.<br />
The government revitalization programme promotes the culture <strong>of</strong> tuna, shrimp<br />
<strong>and</strong> seaweed, primarily <strong>for</strong> export. Other species are cultured mainly <strong>for</strong> domestic<br />
consumption as well as <strong>for</strong> conservation purposes. Approximately 2.4 million people<br />
are employed in the aquaculture sector (Ditjenkan Budidaya, 2005).<br />
Aquaculture practices in Indonesia range from extensive to intensive farming <strong>of</strong><br />
fish <strong>and</strong> shrimp. Black tiger shrimp, Penaeus monodon <strong>and</strong> in particular Pacific white<br />
shrimp, Litopenaeus vannamei are the two most important species grown <strong>for</strong> the<br />
export market. L. vannamei has been farmed in East Java since 2001 <strong>and</strong> from there<br />
has distributed throughout the country (Taw, 2005a). Shrimp aquaculture production<br />
has increased significantly within the last few years. Awareness <strong>of</strong> best management<br />
practices (proper pond design <strong>and</strong> construction, stocking <strong>of</strong> high quality seed, water<br />
quality management, <strong>and</strong> good feed <strong>and</strong> best feed management practices) <strong>and</strong> market<br />
<strong>for</strong>ces have contributed to shrimp aquaculture development in Indonesia.<br />
Giant freshwater prawn, Macrobrachium rosenbergii, is a high value species<br />
<strong>and</strong> is currently produced primarily <strong>for</strong> domestic consumption. The species has<br />
been domesticated <strong>and</strong> a new variety caleed “GI-Macro” (Genetic Improvement <strong>of</strong><br />
Macrobrachium) is now used to produce high quality broodstock <strong>and</strong> seed. Several<br />
freshwater fish such as common carp, tilapia, giant gouramy, snakeskin gouramy, kissing<br />
TABLE 1<br />
Area under aquaculture in Indonesia during 2000–2003<br />
Aquaculture area (ha) 2000 2001 2002 2003 Average increase per year (%)<br />
Mariculture 1, 2 601 699 932 961 19.97<br />
Brackish-water pond 325 530 351 655 360 239 370 824 4.63<br />
Freshwater pond 77 647 85 900 94 240 97 821 8.66<br />
Cage 3 76 80 86 93 7.46<br />
Floating net cage 2,3 183 354 356 373 34.60<br />
Rice field 157 346 150 680 148 909 151 414 -1.26<br />
Total (ha) 561 383 589 368 604 762 621 486<br />
1 Mariculture include only marine cage culture <strong>and</strong> excludes area used <strong>for</strong> seaweed culture;<br />
2 Data converted into hectare from the in<strong>for</strong>mation available on the number <strong>of</strong> units <strong>of</strong> marine fish cage <strong>and</strong><br />
floating net cage;<br />
3 Cage <strong>and</strong> floating net cage include only freshwater cage culture<br />
Source: Ditjenkan Budidaya (2005)
248<br />
<strong>Study</strong> <strong>and</strong> <strong>analysis</strong> <strong>of</strong> <strong>feeds</strong> <strong>and</strong> <strong>fertilizers</strong> <strong>for</strong> <strong>sustainable</strong> aquaculture development<br />
FIGURE 1<br />
Capture fisheries <strong>and</strong> aquaculture production in Indonesia<br />
during 1995–2004<br />
Source: FAO (2006)<br />
FIGURE 2<br />
Aquaculture production by volume <strong>and</strong> value in different<br />
culture environment in Indonesia, 2003<br />
Production by volume (thous<strong>and</strong> tonnes)<br />
6 0 0<br />
5 0 0<br />
4 0 0<br />
3 0 0<br />
2 0 0<br />
1 0 0<br />
0<br />
Marine culture<br />
Brackishwater pond<br />
Freshwater pond<br />
Source: Ditjenkan Budidaya (2004)<br />
P r o d u c t i o n V a l u e<br />
Cage<br />
Floating net cage<br />
Paddy field<br />
1 400<br />
1 200<br />
1 000<br />
FIGURE 3<br />
Aquaculture production in Indonesia by major species groups<br />
in 2003<br />
Seaweeds<br />
18.95%<br />
Crustacean<br />
16.16%<br />
Others<br />
4.73%<br />
Molluscs<br />
0.29%<br />
Marine fish<br />
0.90%<br />
Brackiswater fish<br />
22.51%<br />
Source: Ditjenkan Budidaya (2004)<br />
Freshwater fish<br />
36.48%<br />
8 00<br />
6 00<br />
4 00<br />
2 00<br />
0<br />
Production by value (million US$)<br />
gouramy, catfish, snake head, java<br />
barb, river eel, s<strong>and</strong> gobies, <strong>and</strong> hows<br />
carp are also farmed <strong>and</strong> production<br />
<strong>of</strong> these species has increased yearly.<br />
Fish are farmed <strong>for</strong> export as well as<br />
<strong>for</strong> domestic consumption. Brackishwater<br />
fish aquaculture is dominated<br />
by milkfish, which is now also grown<br />
in <strong>of</strong>fshore marine cages. Other<br />
brackish-water fish species include<br />
mullet, seabass <strong>and</strong> tilapia. Mud crab<br />
is also produced in brackish-water<br />
systems. Seaweed, grouper, lobsters,<br />
colour shells <strong>and</strong> pearls are produced<br />
in the marine environment. Seaweed<br />
culture has recently been revitalized<br />
due to the rapid growth rates, low<br />
capital investment <strong>and</strong> simple culture<br />
technologies.<br />
1.2 Production<br />
In 2004 Indonesia was estimated to<br />
have produced about 6.12 million<br />
tonnes <strong>of</strong> aquatic products from<br />
capture fisheries <strong>and</strong> aquaculture<br />
(FAO, 2006). Capture fisheries<br />
contributed about 76.0 percent <strong>of</strong><br />
total production while the remaining<br />
24.0 percent was from aquaculture.<br />
Over the last ten years aquaculture<br />
production has almost doubled<br />
increasing from 0.74 million tonnes<br />
in 1995 to 1.47 million tonnes in 2004<br />
(Figure 1). Aquaculture production<br />
in 2003 was 1.22 million tonnes<br />
valued at US$1.72 billion <strong>and</strong> in 2004<br />
had increased to 1.47 million tonnes<br />
valued at US$2.16 billion (FAO,<br />
2006). Aquaculture production by<br />
volume <strong>and</strong> value in different culture<br />
environment in 2003 are shown in<br />
Figure 2. Mariculture, brackish-water<br />
pond, freshwater pond, cage culture,<br />
floating net cages <strong>and</strong> paddy field<br />
culture accounted <strong>for</strong> 20.0, 41.0, 22.9,<br />
3.3, 4.7 <strong>and</strong> 7.7 percent respectively <strong>of</strong><br />
the total aquaculture production. The<br />
contribution <strong>of</strong> the different species<br />
groups in aquaculture is shown in<br />
Figure 3.<br />
Marine aquaculture is dominated<br />
by grouper <strong>and</strong> seaweeds, which<br />
accounted <strong>for</strong> 0.7 percent <strong>and</strong>
Analysis <strong>of</strong> <strong>feeds</strong> <strong>and</strong> <strong>fertilizers</strong> <strong>for</strong> <strong>sustainable</strong> aquaculture development in Indonesia 249<br />
18.9 percent, respectively, <strong>of</strong> the<br />
total aquaculture production.<br />
Milkfish (18.6 percent) <strong>and</strong> shrimp<br />
(15.7 percent) are the main species<br />
produced in brackish-water ponds<br />
while carp, tilapia, catfish, <strong>and</strong><br />
gouramy are the major species<br />
produced in different freshwater<br />
aquaculture systems (Figure 4).<br />
In terms <strong>of</strong> value, shrimp<br />
dominate aquaculture exports. In<br />
2004, approximately 143 550 tonnes<br />
<strong>of</strong> shrimp (headless), valued <strong>of</strong><br />
US$1.1 billion were exported, which<br />
accounted <strong>for</strong> about 50 percent <strong>of</strong><br />
the total fisheries export (Ditjenkan<br />
Budidaya, 2005).<br />
In terms <strong>of</strong> area (Table 1),<br />
marine aquaculture (19.97 percent/<br />
year) <strong>and</strong> floating net cage culture<br />
(34.6 percent/year) have grown<br />
substantially faster than other<br />
systems. This is mainly because <strong>of</strong><br />
the increasing interest in grouper,<br />
seaweed, common carp, tilapia,<br />
catfish <strong>and</strong> gouramy aquaculture.<br />
The area under brackish-water<br />
ponds has decreased by 4.6 percent/<br />
year, particularly in South Sulawesi,<br />
East Java, West Java, Aceh,<br />
Lampung, East Kalimantan, North<br />
Sumatera <strong>and</strong> West Nusa Tenggara.<br />
However, the introduction <strong>of</strong><br />
L. vannamei in 2001 (Briggs et<br />
al., 2004) ensured that shrimp<br />
production did not decline as well.<br />
The introduction <strong>of</strong> L. vannamei has, in fact, made a significant impact on shrimp<br />
production in Indonesia (Table 2; Figure 5). This species was initially cultured in East<br />
Java <strong>and</strong> the first successful pond yields were 7–10 tonnes/ha, with animals reaching<br />
15 g in 90 days at survival rates <strong>of</strong> 75–90 percent <strong>and</strong> FCRs <strong>of</strong> 1.1–1.4:1. However,<br />
major losses were recorded in 2002 as a result <strong>of</strong> white spot syndrome virus (WSSV).<br />
At present with a better underst<strong>and</strong>ing <strong>of</strong> the species <strong>and</strong> the production <strong>of</strong> specific<br />
pathogen free (SPF) post larvae (PLs), L. vannamei is once again widely farmed in<br />
Indonesia (Kopot <strong>and</strong> Taw, 2004)<br />
L. vannamei has several<br />
advantages over P. monodon,<br />
such as faster growth, a wider<br />
salinity tolerance, tolerance to<br />
higher densities <strong>and</strong> a lower<br />
protein dem<strong>and</strong> (Briggs et al.,<br />
2004). High density culture<br />
<strong>of</strong> L. vannamei is commonly<br />
practised, but lower stocking<br />
Production (thous<strong>and</strong> tonnes)<br />
FIGURE 4<br />
Aquaculture production <strong>of</strong> the four major freshwater fish<br />
species in different aquaculture systems in 2003<br />
90<br />
80<br />
70<br />
60<br />
50<br />
40<br />
30<br />
20<br />
10<br />
0<br />
Carp Tilapia Catfish Gourami<br />
Pond Cage Floating net<br />
cage<br />
Source: Ditjenkan Budidaya (2004)<br />
Paddy field<br />
FIGURE 5<br />
Indonesian shrimp aquaculture production during 1980–2004<br />
Production (thous<strong>and</strong> tonnes)<br />
300<br />
250<br />
200<br />
150<br />
100<br />
50<br />
0<br />
1980<br />
1982<br />
1984<br />
1986<br />
1988<br />
Source: Ditjenkan Budidaya (2004)<br />
1990<br />
TABLE 2<br />
Shrimp aquaculture production (tonnes) in Indonesia during 2000–2004<br />
Shrimp 2000 2001 2002 2003 2004<br />
P. monodon 94 000 104 000 113 000 90 000 80 000<br />
L. vannamei 0 2 000 7 000 43 000 80 000<br />
Others* 50 000 43 000 44 000 45 000 45 000<br />
Total 144 000 149 000 164 000 178 000 205 000<br />
* Others include lobster, local white shrimp, Metapenaeus shrimp, <strong>and</strong> mysid<br />
Source: Akiyama (2004)<br />
1992<br />
1994<br />
1996<br />
1998<br />
2000<br />
2002<br />
2004
250<br />
<strong>Study</strong> <strong>and</strong> <strong>analysis</strong> <strong>of</strong> <strong>feeds</strong> <strong>and</strong> <strong>fertilizers</strong> <strong>for</strong> <strong>sustainable</strong> aquaculture development<br />
FIGURE 6<br />
High density (200 PL/m 2 ) culture <strong>of</strong> Pacific white shrimp (Litopenaeus vannamei) in<br />
concrete ponds<br />
densities <strong>of</strong> 20 animals/m 2 have recently been reported from East Java. Production after<br />
2–3 months ranges from 800–2 000 kg/ha (CP Shrimp News, 2004, 2005).<br />
The sharp increase in shrimp production over the last few years (Figure 5) is mainly<br />
due to higher stocking rates as well as the higher production capacity <strong>of</strong> L. vannamei.<br />
In intensive culture, L. vannamei are commonly stocked at over 100 PLs/m 2 <strong>and</strong><br />
production normally ranges from 10.0–15.0 tonnes/ha/year (Taw, 2005a).<br />
For example, a farm in Banyuwangi-East Java (Figure 6) using 0.4 ha <strong>of</strong> concrete<br />
ponds (stocked at 200 PLs/m 2 ) produces 8 tonnes <strong>of</strong> shrimp (80 shrimps/kg) after<br />
100 days (Nur, Arifin <strong>and</strong> Latief, 2004). Shrimp farming practices vary somewhat<br />
from region to region depending on the local conditions <strong>and</strong> financial conditions.<br />
Shrimp production also varies according to the culture technology applied (Table 3).<br />
In general, however, the introduction <strong>of</strong> SPF L. vannamei to Indonesia has prompted<br />
a move towards low water exchange, greater bio-security <strong>and</strong> the use <strong>of</strong> concrete or<br />
polyethylene lined ponds <strong>for</strong> high density culture (Taw, 2005b).<br />
In 2004, a total <strong>of</strong> 5.3 billion PLs (or 65 percent <strong>of</strong> production capacity) were<br />
produced from about 13 hatchery enterprises (Ditjenkan Budidaya, 2005). Ef<strong>for</strong>ts to<br />
domesticate the broodstock <strong>of</strong> P. monodon, P. stilyrostris <strong>and</strong> L.vannamei have been<br />
initiated at Centre <strong>for</strong> Brackishwater Aquaculture Development (CBAD), Jepara since<br />
2003 to support <strong>and</strong> provide high quality broodstock <strong>for</strong> hatcheries in Indonesia.<br />
The higher pond production capacity <strong>of</strong> L.vannamei has resulted in higher feed<br />
inputs into the systems. Excretory products <strong>and</strong> uneaten feed have potential to<br />
accumulate in the sediment <strong>and</strong> ultimately may have an adverse affect on internal pond<br />
<strong>and</strong> or surrounding waters.<br />
TABLE 3<br />
Characteristics <strong>of</strong> various shrimp culture technologies in Indonesia<br />
System <strong>and</strong> species<br />
Stocking density<br />
(PL/m 2 )<br />
Yield<br />
(tonnes/ha)<br />
Average size<br />
(g)<br />
Monoculture <strong>of</strong> L. vannamei<br />
Normal stocking density 60–80 8–10 16–20<br />
High stocking density 130–150 14–30 14–18<br />
Monoculture (partial harvest) 130–150 23–25 12–20<br />
Bacterial floc (zero water exchange) 130–150 20–24 16–20<br />
Polyculture with P. monodon<br />
280<br />
49.7<br />
P. monodon 40–50 7.5<br />
L.vannamei 20–30 3.5 -<br />
Source: Taw (2005b)<br />
Fortunately the dietary<br />
protein requirement <strong>of</strong><br />
L.vannamei is lower<br />
than that <strong>of</strong> P. monodon<br />
(Tacon, 2002; Briggs et<br />
al., 2004; Cuzon et al.,<br />
2004; Akiyama, 2004).<br />
The protein content <strong>of</strong><br />
L.vannamei <strong>feeds</strong> range<br />
from 28–42 percent. Field<br />
experience has shown that<br />
growth is impaired under
Analysis <strong>of</strong> <strong>feeds</strong> <strong>and</strong> <strong>fertilizers</strong> <strong>for</strong> <strong>sustainable</strong> aquaculture development in Indonesia 251<br />
high stocking densities (200 PL/m 2 ) at a protein content <strong>of</strong> less than 35 percent<br />
(Widyatmoko, pers. comm., 2005). While current on-farm stocking densities are 50–125<br />
PL/m 2 the 35 percent protein diet is still the most widely used feed <strong>and</strong> this is affecting<br />
pond ecosystems <strong>and</strong> the environment. It is, there<strong>for</strong>e, important that further research<br />
be undertaken on the economics <strong>and</strong> nutrient budget <strong>of</strong> L.vannamei aquaculture to<br />
evaluate its sustainability in the future.<br />
2. REVIEW AND ANALYSIS OF AQUACULTURE FEED AND FEEDING<br />
2.1 Fertilizer, feed ingredients <strong>and</strong> aqua<strong>feeds</strong><br />
The bulk <strong>of</strong> fish <strong>and</strong> shrimp production occurs in extensive <strong>and</strong> semi-intensive farming<br />
systems. In extensive pond culture, production is based on the use <strong>of</strong> organic <strong>and</strong><br />
inorganic fertilizer to promote the growth <strong>of</strong> simple plants which <strong>for</strong>m the base <strong>of</strong><br />
the pond food chain (Goddard, 1996). In semi-intensive or intensive farming systems,<br />
fertilizer is used to stimulate phytoplankton growth as a water conditioner <strong>and</strong> to<br />
create a favourable environment <strong>for</strong> optimal growth <strong>and</strong> survival <strong>of</strong> fish <strong>and</strong> shrimp.<br />
In Indonesia, the most commonly used inorganic <strong>fertilizers</strong> are urea <strong>and</strong> triple<br />
super phosphate (TSP). Other <strong>fertilizers</strong> used in aquaculture are super phosphate<br />
(SP36) (36 percent P 2O 5 <strong>and</strong> 5 percent Sulphur) <strong>and</strong> NPKS 1 (15:15:15:10). The types<br />
<strong>of</strong> <strong>fertilizers</strong> used <strong>and</strong> their application rates vary widely. Commonly used organic<br />
<strong>fertilizers</strong> are poultry <strong>and</strong> cattle manure. In 2003, some 19 600 tonnes <strong>of</strong> organic <strong>and</strong><br />
7 600 tonnes <strong>of</strong> inorganic fertilizer were used in brackish-water <strong>and</strong> freshwater pond<br />
aquaculture.<br />
Organic fertilizer is <strong>of</strong>ten more expensive than inorganic <strong>fertilizers</strong> because <strong>of</strong><br />
higher labour <strong>and</strong> transport costs. The current price <strong>of</strong> urea <strong>and</strong> TSP is US$0.13/kg<br />
<strong>and</strong> US$0.15/kg, respectively compared to chicken or cow manure at US$21.97/tonne<br />
(Sulistyo, pers. comm., 2005). Because <strong>of</strong> increasing concerns on bio-security on<br />
shrimp farms, the use <strong>of</strong> organic fertilizer is being restricted to protect the shrimp from<br />
potential disease transmissions. However, organic manure is preferred <strong>for</strong> freshwater<br />
pond <strong>and</strong> paddy field aquaculture. Milkfish production in brackish-water ponds is also<br />
largely dependent on organic <strong>fertilizers</strong>.<br />
2.1.1 Feed ingredients <strong>and</strong> <strong>feeds</strong><br />
Feed ingredients <strong>for</strong> aquaculture are sourced locally <strong>and</strong> from abroad. Ingredient choice<br />
depends on nutrient content, digestibility <strong>and</strong> bioavailability, the cost <strong>of</strong> destroying<br />
anti-nutritional factors <strong>and</strong> toxic substances, availability <strong>and</strong> cost. Animal <strong>and</strong> plant<br />
materials are the most common feed ingredients, though some wastes <strong>and</strong> by-products<br />
<strong>of</strong> the food industry are also used.<br />
Currently, around 70–80 percent <strong>of</strong> <strong>feeds</strong>tuffs <strong>for</strong> shrimp <strong>and</strong> fish <strong>feeds</strong> are imported<br />
(Yanuartin, 2004; Sukria, 2004). Production <strong>of</strong> aqua<strong>feeds</strong>, particularly <strong>for</strong> carnivorous<br />
finfish species <strong>and</strong> marine shrimp, has so far been dependent upon the use <strong>of</strong> fishmeal<br />
<strong>and</strong> fish oil as cost-efficient sources <strong>of</strong> dietary protein <strong>and</strong> fat (Coutteau et al., 2002).<br />
Fishmeal typically constitutes between 25 <strong>and</strong> 40 percent <strong>of</strong> <strong>for</strong>mulated <strong>feeds</strong> <strong>for</strong><br />
carnivorous fish <strong>and</strong> shrimp (Lee <strong>and</strong> Kim, 2001). Locally available feed ingredients are<br />
less used <strong>for</strong> shrimp diets due to inferior quality, competition <strong>for</strong> human consumption<br />
<strong>and</strong> inconsistent supplies. For instance, imported fishmeal (crude protein >65 percent<br />
is preferred over local fishmeal with protein content ranging from 33–55 percent.<br />
Moreover, the ash <strong>and</strong> lipid content <strong>of</strong> the local fishmeal were higher than the st<strong>and</strong>ards<br />
recommended <strong>for</strong> shrimp (Yanuartin, 2004).<br />
In accordance with the projected growth <strong>of</strong> the aquaculture industry, <strong>and</strong> an increased<br />
dem<strong>and</strong> <strong>for</strong> <strong>and</strong> possibly shortage <strong>of</strong> marine raw materials in the coming decade, there<br />
is a need to identify alternative protein sources <strong>for</strong> aqua<strong>feeds</strong> (Lee <strong>and</strong> Kim, 2001;<br />
1 Nitrogen, phosphorus, potassium <strong>and</strong> sulphur
252<br />
<strong>Study</strong> <strong>and</strong> <strong>analysis</strong> <strong>of</strong> <strong>feeds</strong> <strong>and</strong> <strong>fertilizers</strong> <strong>for</strong> <strong>sustainable</strong> aquaculture development<br />
Coutteau et al., 2002). Research on alternatives in Indonesia is on-going <strong>and</strong> in the<br />
recent past has focused on lupin meal (Sudaryono et al., 1999), corn meal (Nur, Latief<br />
<strong>and</strong> Kuntiyo, 2000), golden snail (Utomo, Suryana <strong>and</strong> Jusadi, 2003), shrimp head meal<br />
(Anon., 2004; Laining et al., 2004), fish <strong>and</strong> blood silage (Jusadi, Probosasongko <strong>and</strong><br />
Mokoginta, 2004; Laining et al., 2004), soybean meal cake (Suprayudi, Mokoginta <strong>and</strong><br />
Naim, 2004), golden snail (Utomo, Suryana <strong>and</strong> Jusadi, 2003) <strong>and</strong> Spirulina platensis<br />
(Panji <strong>and</strong> Suharyanto, 2003). The potential <strong>of</strong> alternative ingredients is determined by<br />
their proximate composition, availability <strong>and</strong> cost.<br />
2.1.2 Feeding practices<br />
By far the most common feeding practice in extensive <strong>and</strong> some semi-intensive<br />
aquaculture operations involves the use <strong>of</strong> organic <strong>and</strong> inorganic <strong>fertilizers</strong> <strong>and</strong> the<br />
provision <strong>of</strong> supplementary <strong>feeds</strong>. Supplementary <strong>feeds</strong> can include live or fresh<br />
natural food items, kitchen waste, <strong>and</strong> single processed <strong>feeds</strong>tuff, farm-made <strong>feeds</strong> to<br />
factory manufactured pelleted aqua<strong>feeds</strong> (Tacon <strong>and</strong> De Silva, 1997). Semi-intensive<br />
<strong>and</strong> intensive culture systems in particular, are entirely dependent on commercial<br />
<strong>feeds</strong>.<br />
The inappropriate use <strong>of</strong> <strong>feeds</strong> may have adverse effects both on the environment<br />
<strong>and</strong> the animals being farmed. Funge-Smith <strong>and</strong> Briggs (1998) reported that a high<br />
proportion <strong>of</strong> nutrients in waterways adjacent to intensive shrimp farms originate from<br />
commercial <strong>feeds</strong> due to low nitrogen retention by shrimp (see Table 4). However,<br />
in<strong>for</strong>mation on the environmental impact <strong>of</strong> shrimp farming in Indonesia is limited. The<br />
low nitrogen retention by shrimp is caused by several factors such as, suboptimal feed<br />
<strong>for</strong>mulation or quality <strong>of</strong> feed ingredients, overfeeding <strong>and</strong> poor water stability <strong>of</strong> <strong>feeds</strong>.<br />
TABLE 4<br />
Percent nitrogen in pond sediments (S) <strong>and</strong> discharge into<br />
the environment (DE) from shrimp ponds<br />
Percentage nitrogen Country<br />
Shrimp species<br />
in<br />
S DE<br />
Penaeus monodon1 57 Australia<br />
P. stylirostris2 Up to 38.4 New Caledonia<br />
P. monodon3 24 27 Thail<strong>and</strong><br />
Penaeus sp. 4 26 -<br />
P. monodon5 14–53 Thail<strong>and</strong><br />
Source: 1 Jackson et al. (2003); 2 Martin et al. (1998); 3 Funge-Smith <strong>and</strong><br />
Briggs (1998); 4 Lin <strong>and</strong> Nash (1996) cited in Avnimelech <strong>and</strong> Ritvo<br />
(2003); 5 Thakur <strong>and</strong> Lin (2003)<br />
Hence, there is considerable<br />
scope to reduce nutrient<br />
discharge from shrimp farming,<br />
by better feed management<br />
<strong>and</strong> improved feed <strong>for</strong>mulation<br />
(Bur<strong>for</strong>d <strong>and</strong> Williams, 2001).<br />
Feeding rates should be related<br />
to the estimated pond biomass<br />
<strong>and</strong> adjusted accordingly<br />
especially during cooler periods.<br />
Moreover, an average feeding<br />
rate <strong>of</strong> 2–4 percent <strong>of</strong> shrimp<br />
biomass <strong>for</strong> P. monodon stocked<br />
TABLE 5<br />
Nutritional composition (minimum <strong>and</strong>/or maximum levels) <strong>of</strong> commercial diets available in<br />
Indonesia <strong>for</strong> various aquaculture species<br />
Percentage<br />
Cultured species<br />
Shrimp<br />
Black tiger shrimp<br />
Pacific white shrimp<br />
Finfish<br />
Grouper<br />
Milkfish<br />
Tilapia<br />
Gouramy<br />
Catfish (Clarias sp)<br />
Carp<br />
Catfishes (Pangasius sp)<br />
Crude protein<br />
(min)<br />
39–42<br />
28–42<br />
50<br />
23–26<br />
24–30<br />
25–28<br />
28–32<br />
27–30<br />
28–30<br />
Crude lipid<br />
(min)<br />
5<br />
5<br />
10<br />
4–6<br />
4–6<br />
4–6<br />
5–7<br />
4–6<br />
4–6<br />
Source: In<strong>for</strong>mation obtained from different commercial feed companies (2005)<br />
Crude fibre<br />
(min) (max)<br />
3<br />
3–4<br />
2.5<br />
4<br />
3–4<br />
4<br />
4<br />
4<br />
4<br />
Moisture<br />
(max)<br />
11<br />
11<br />
10<br />
11<br />
11<br />
11<br />
11<br />
11<br />
11
Analysis <strong>of</strong> <strong>feeds</strong> <strong>and</strong> <strong>fertilizers</strong> <strong>for</strong> <strong>sustainable</strong> aquaculture development in Indonesia 253<br />
15 animals/m 2 may significantly reduce feed cost without affecting growth <strong>and</strong><br />
production (Allan, Moriarty <strong>and</strong> Maguire, 1995).<br />
Shrimp <strong>and</strong> fish aqua<strong>feeds</strong> are produced locally in several feed mills <strong>and</strong> are readily<br />
available in the market. The nutritional composition <strong>of</strong> some <strong>of</strong> the available shrimp<br />
<strong>and</strong> fish <strong>feeds</strong> is shown in Table 5 <strong>and</strong> Tables 6 <strong>and</strong> 7 illustrate factory recommended<br />
feeding rates.<br />
Shrimp feeding<br />
Shrimp eat slowly on the pond bottom; consequently feed should be distributed evenly<br />
<strong>and</strong> <strong>of</strong>ten. H<strong>and</strong> feeding is commonly practised by walking along the pond dyke,<br />
while floating mechanical devices are used to distribute feed in the middle <strong>of</strong> the pond.<br />
Feeding trays are commonly used to monitor feeding response <strong>and</strong> shrimp health <strong>and</strong><br />
to adjust the ration <strong>and</strong> feeding frequency. The number <strong>of</strong> feeding trays depends on<br />
pond size <strong>and</strong> is around 4–6 per hectare (Akiyama, 1989).<br />
Shrimp feed manufacturers recommend 3–6 meals a day. However, Smith et al.<br />
(2002) concluded that there is no benefit in feeding P. monodon more than 3 times a day<br />
when using a feed that is nutritionally complete <strong>and</strong> adequately water stable.<br />
TABLE 6<br />
Recommended feeding rates <strong>for</strong> P. monodon at a stocking density <strong>of</strong> >6 PLs/m 2 at an assumed<br />
feed FCR <strong>of</strong> 1.7–1.8 <strong>and</strong> water stability <strong>of</strong> 2–3 hours<br />
Culture<br />
duration<br />
(days)<br />
Weight<br />
(g)<br />
Feed code Quantity <strong>of</strong><br />
feed/day<br />
(g)<br />
Feeding<br />
frequency<br />
(times/day)<br />
Survival<br />
(%)<br />
Initial feed<br />
1–10 Pl 15–0.1 01 200 2 100 1 kg <strong>for</strong><br />
11–20<br />
21–30<br />
0.1–1<br />
1–3<br />
02<br />
03<br />
400<br />
600<br />
3<br />
3<br />
90<br />
80<br />
100 000<br />
PLs<br />
Culture<br />
Weight Feed code Feeding rate Feeding % feed on TC<br />
duration<br />
(g)<br />
(%)<br />
frequency tray (hours)*<br />
(days)<br />
(times/day)<br />
30–40 3–5 03-03SP 5.8–5.0 4 0.6 2.5<br />
40–60 5–9 03SP 5.0–4.2 4 0.8 2.0<br />
60–80 9–14 04S 4.2–3.6 4 0.9 2.0–1.5<br />
80–100 14–20 04S-04 3.6–3.0 5 1.0 1.5<br />
100–110 20–25 04 3.0–2.7 5–6 1.1 1.5<br />
110–120 25–30 04 2.7–2.5 5–6 1.2 1.5–1.0<br />
>120 >30 04 120 >22.0 04
254<br />
<strong>Study</strong> <strong>and</strong> <strong>analysis</strong> <strong>of</strong> <strong>feeds</strong> <strong>and</strong> <strong>fertilizers</strong> <strong>for</strong> <strong>sustainable</strong> aquaculture development<br />
Milkfish feeding<br />
The dem<strong>and</strong> <strong>for</strong> milkfish from the domestic market <strong>and</strong> as tuna bait is increasing. The<br />
species is highly suitable <strong>for</strong> aquaculture because <strong>of</strong> its efficient use <strong>of</strong> natural food<br />
(Figure 7) <strong>and</strong> rapid growth (Boonyaratpalin, 1997). Milkfish is farmed under extensive<br />
culture conditions in organically fertilized brackish-water ponds <strong>and</strong> is <strong>of</strong>ten produced<br />
without the use <strong>of</strong> supplementary <strong>feeds</strong>. Under these conditions the fish feed on lablab<br />
(klekap), plankton <strong>and</strong> lumut (filamentous green algae). With adequate organic<br />
fertilization, natural food production levels range from 2 000–3 000 kg/ha/crop. Urea<br />
<strong>and</strong> TSP can be used instead <strong>of</strong> organic manure at a rate <strong>of</strong> 100 kg <strong>and</strong> 50 kg per ha<br />
during pond preparation <strong>and</strong> there after at a rate <strong>of</strong> 25 kg <strong>and</strong> 15 kg, respectively, such<br />
that water transparency is maintained at 30–40 cm (Ahmad et al., 2005). There is no<br />
chemical treatment <strong>for</strong> pest eradication during pond preparation. Farmers simply rely<br />
on evaporation <strong>of</strong> sea water up to 100 ppt to sterilize their ponds.<br />
In semi-intensive culture systems, commercial <strong>feeds</strong> are applied when fish reach<br />
100 g (after ~ 3–4 months). From this size onwards <strong>and</strong> <strong>for</strong> about one month the fish<br />
are fed a commercial feed two times per day at a rate <strong>of</strong> 1–4 percent <strong>of</strong> biomass until<br />
FIGURE 7<br />
Natural food (lab–lab) (left) <strong>and</strong> commercial floating feed (right) <strong>for</strong> milkfish culture in<br />
brackish-water ponds<br />
TABLE 8<br />
Production parameters in extensive <strong>and</strong> semi-intensive milkfish culture systems in Indonesia<br />
Culture condition<br />
Extensive<br />
I II<br />
Semi-intensive<br />
I II<br />
Pond area (ha) 3 4 3 4<br />
Number <strong>of</strong> fish stocked 10 000 30 000 10 000 30 000<br />
Initial weight (g) 0.3 0.025 0.33 0.025<br />
Stocking density (fish/m) 0.33 0.75 0.33 0.75<br />
Amount <strong>of</strong> initial feeding (g) - - 50 100<br />
Fertilizer (kg) 1 300 1 200 300 400<br />
Culture period (days) 240 195 152 165<br />
FCR - - 1.33 1.23<br />
Period <strong>of</strong> feeding (days) - - 75 75<br />
Final weight (g) 160 150 225 285<br />
Total harvest (kg/ha) 1 300 2 350 2 100 5 130<br />
Survival (%)<br />
Economic <strong>analysis</strong><br />
70–90 40–70 70–90 40–70<br />
Total cost (US$) 456 684 1 046 2 206<br />
Cost/kg (US$) 0.35 0.29 0.50 0.43<br />
Total income (US$) 857 1 549 1 615 4 369<br />
Production cycle/year 1 1 2 2<br />
Pr<strong>of</strong>it/year (US$) 401 865 1 138 4 326<br />
Source: CP Fish News, special edition (2005)
Analysis <strong>of</strong> <strong>feeds</strong> <strong>and</strong> <strong>fertilizers</strong> <strong>for</strong> <strong>sustainable</strong> aquaculture development in Indonesia 255<br />
they reach an individual weight <strong>of</strong> 200–250 g. The fish are conditioned to sound to<br />
facilitate feeding <strong>and</strong> to improve feed utilization. A comparison between extensive <strong>and</strong><br />
semi-intensive systems (Table 8) shows that semi-intensive milkfish culture is more<br />
pr<strong>of</strong>itable.<br />
Milkfish production can be increased by using higher stocking densities <strong>and</strong><br />
reducing the production cycle, though this practice is not economically viable <strong>for</strong> most<br />
farmers. Milkfish are <strong>of</strong>ten fed with “alternative” supplementary <strong>feeds</strong> such as expired<br />
bread (or industrial bakery rejects) or rice-based crackers to reduce the feed cost.<br />
Intensive milkfish culture in <strong>of</strong>fshore cages has many advantages, viz., high<br />
density 100–300 fish/m 3 high specific growth rate (1.6 percent/day); feed is used more<br />
efficiently (FCR 1.7–2.2), high productivity (350–400 kg per 6 m 3 per 6 months); easy<br />
to harvest <strong>and</strong> there is no requirement <strong>for</strong> water quality management as in brackishwater<br />
ponds (Anon., 2005).<br />
Grouper feeding<br />
Groupers are among the most valuable species <strong>and</strong> are cultured mainly <strong>for</strong> export.<br />
Seed production technology <strong>for</strong> various species <strong>of</strong> groupers (brown-marbled grouper<br />
Epinephelus fuscogutatus, greasy grouper E. tauvina, <strong>and</strong> humpback grouper<br />
Cromileptes altivelis) was established in 1995 (Murjani, Subyakto <strong>and</strong> Sitorus, 2004).<br />
Since then seed availability has become more predictable <strong>and</strong> consistent. Groupers are<br />
cultured in either brackish-water ponds or in marine floating cages. Farmers prefer to<br />
use trash fish as a feed <strong>for</strong> grouper, though there are several limitations to its use such<br />
as inconsistent supply, variable nutrient content, difficult to h<strong>and</strong>le <strong>and</strong> store <strong>and</strong> the<br />
potential <strong>for</strong> disease transmission. Given the slow-growth <strong>of</strong> grouper the use <strong>of</strong> trash<br />
fish as a sole feed becomes problematic. For example, Akbar <strong>and</strong> Sudaryanto (2002)<br />
reported that C. altivelis in floating net cages (initial weight <strong>of</strong> 1.3 g) require 12–14<br />
months to attain 400–500 g, while E. fuscoguttatus reared in ponds take 7.5 months<br />
to grow from 39 to 311 g (Komaruddin et al., 2005). Recent research has shown that<br />
grouper respond well to moist as well as dry <strong>for</strong>mulated pellets (Martawati, 1995; Nur,<br />
Kuntiyo <strong>and</strong> Malistiyani, 2000) <strong>and</strong> prefer <strong>and</strong> per<strong>for</strong>m better on a slow sinking feed<br />
(Anon., 2004). Formulated <strong>feeds</strong> are used to wean the larvae from Artemia at 15 days<br />
after hatching.<br />
The results <strong>of</strong> a comparative study using a commercial dry feed <strong>and</strong> trash fish in<br />
floating net cages are shown in Table 9. The fish (1–3 g ) were fed 3–5 times a day at<br />
10 percent <strong>of</strong> biomass. For larger fish (>250 g) the feeding frequency <strong>and</strong> feeding rate<br />
was decreased to 0.5–1 times/day <strong>and</strong> 0.8 percent biomass, respectively. These results<br />
show the potential use <strong>of</strong> artificial diets, although the production costs were higher.<br />
Common carp feeding<br />
Common carp is one <strong>of</strong> the main freshwater fish cultured in ponds, cages, floating cages<br />
<strong>and</strong> paddy fields. Around seven strains <strong>of</strong> common carp are cultured <strong>for</strong> consumption,<br />
while another five strains are produced <strong>for</strong> the ornamental fish market. Production<br />
phases include a hatchery stage (1–3 cm), nursery phase (5–8 cm) <strong>and</strong> the grow-out<br />
phase (marketable size ca. 6–8 fish/kg).<br />
Natural food availability such as Daphnia,<br />
Moina <strong>and</strong> rotifers is important during fry<br />
<strong>and</strong> fingerling rearing <strong>and</strong> this is stimulated<br />
by using organic <strong>and</strong> inorganic <strong>fertilizers</strong><br />
in ponds. Chicken manure at between<br />
250–500 g/m 2 is commonly applied in<br />
combination with urea <strong>and</strong> TSP at 8–<br />
10 g/m 2 to enhance plankton production.<br />
Both floating <strong>and</strong> sinking pellets with a<br />
TABLE 9<br />
Survival rate (percent), daily growth rate<br />
(DGR, g/day) <strong>and</strong> food conversion ratio (FCR)<br />
<strong>of</strong> humpback grouper Cromileptes altivelis<br />
reared in floating net cages<br />
Feed type Survival rate DGR FCR<br />
Dry feed -1 98.7 2.23 1.3<br />
Dry feed -2 98.0 1.10 1.6<br />
Trash fish 95.1 1.71 6.0<br />
Source: Anon. (2004)
256<br />
)<br />
s<br />
e<br />
n<br />
n<br />
o<br />
t<br />
(<br />
e<br />
m<br />
u<br />
l<br />
o<br />
V<br />
45<br />
40<br />
35<br />
30<br />
25<br />
20<br />
15<br />
10<br />
5<br />
0<br />
2<br />
9<br />
9<br />
1<br />
<strong>Study</strong> <strong>and</strong> <strong>analysis</strong> <strong>of</strong> <strong>feeds</strong> <strong>and</strong> <strong>fertilizers</strong> <strong>for</strong> <strong>sustainable</strong> aquaculture development<br />
minimum protein content <strong>of</strong> 30 percent are commonly used <strong>and</strong> fish are fed at a rate<br />
<strong>of</strong> 3–5 percent <strong>of</strong> biomass per day divided into three meals (Khairuman, Suhenda <strong>and</strong><br />
Gunadi, 2002).<br />
Some reservoirs built <strong>for</strong> electricity generation, irrigation <strong>and</strong> flood control are<br />
now used <strong>for</strong> floating net cage culture <strong>of</strong> common carp, tilapia <strong>and</strong> gouramy. In<br />
Cirata, some 33 000 floating cage units were installed, with disastrous environmental<br />
<strong>and</strong> economic consequences (Radiarta, Prihadi <strong>and</strong> Sunarno, 2005; Trobos, 2005). In<br />
contrast, <strong>sustainable</strong> cage culture in reservoirs is conducted in Wonogori, Central Java<br />
<strong>for</strong> almost 18 years. There are a total <strong>of</strong> 400 floating net cage units <strong>and</strong> each unit (7 x 7<br />
x 1 m 3 ) requires around 3 tonnes <strong>of</strong> commercial floating feed per annum <strong>for</strong> production<br />
<strong>of</strong> tilapia <strong>and</strong> carp (Krismono, 2005).<br />
Tilapia feeding<br />
Tilapia is an alien species <strong>and</strong> was introduced from Africa in the 1940s. There are four<br />
varieties <strong>of</strong> tilapia in Indonesia: Nile tilapia Oreochromis niloticus, GIFT 2 (a genetically<br />
improved Nile tilapia strain), red tilapia (a hybrid <strong>of</strong> O. mossambicus, O. niloticus <strong>and</strong><br />
O. aureus) <strong>and</strong> blue tilapia Oreochromis aureus. The first three species/strains are more<br />
popular in Indonesia <strong>and</strong> are farmed throughout the country. Tilapia are farmed in<br />
freshwater (ponds, flow through systems, cages, floating net cages in reservoirs, lakes<br />
<strong>and</strong> rivers) <strong>and</strong> brackish-water ponds <strong>of</strong> up to 15 ppt salinity (Amri <strong>and</strong> Khairuman,<br />
2003). Sucipto <strong>and</strong> Prihartono (2005) reported that Indonesia was the third largest<br />
tilapia producer after China <strong>and</strong> the Philippines. Tilapia is exported to the United<br />
States <strong>of</strong> America in the <strong>for</strong>m <strong>of</strong> fresh <strong>and</strong> frozen fillets <strong>and</strong> whole frozen fish <strong>and</strong> the<br />
amount exported has continued to increase (Figure 8).<br />
All male tilapia fingerlings are stocked into the production systems when they reach<br />
either 15–20 g or 30–50 g body weight. Marketable size <strong>for</strong> the domestic market is 250 g<br />
<strong>and</strong> 500–600 g <strong>for</strong> the export market, which is attained after 3 or 6 months, respectively.<br />
Culture methods are diverse <strong>and</strong> range from monoculture to polyculture with carp,<br />
java barb or catfish to integrated farming systems. Per<strong>for</strong>mance parameters <strong>of</strong> tilapia<br />
under different culture conditions are summarised in Table 10<br />
A new strain <strong>of</strong> tilapia (JICA - Jambi Initiative <strong>for</strong> Commercial Aquaculture) was<br />
produced in 2004. In comparison to other tilapia this strain has a higher fecundity,<br />
growth rate <strong>and</strong> better FCRs than other strains.<br />
FIGURE 8<br />
Total volume (tonnes) <strong>of</strong> tilapia exported to the<br />
United States <strong>of</strong> America during 1992–2001<br />
3<br />
9<br />
9<br />
1<br />
4<br />
9<br />
9<br />
1<br />
5<br />
9<br />
9<br />
1<br />
6<br />
9<br />
9<br />
1<br />
7<br />
9<br />
9<br />
1<br />
8<br />
9<br />
9<br />
1<br />
9<br />
9<br />
9<br />
1<br />
0<br />
0<br />
0<br />
2<br />
2 Genetically improved farm tilapia<br />
1<br />
0<br />
0<br />
Data reported <strong>for</strong> 2001 was <strong>of</strong> seven months from January to July<br />
Source: Ditjenkan Budidaya (2004)<br />
2<br />
Catfish feeding<br />
Clariid catfish are mainly produced on<br />
Java Isl<strong>and</strong> in freshwater ponds, where it is<br />
popularly known as “Pecel Lele”. Production<br />
has increased significantly from 28 991 tonnes<br />
in 2000 to 57 740 tonnes in 2003 (Ditjenkan<br />
Budidaya, 2004). The species responds well<br />
to various food types, is an air-breather <strong>and</strong><br />
hence tolerant <strong>of</strong> poor water quality under<br />
high stocking densities <strong>and</strong> has a fast growth<br />
rate.<br />
Genetic improvement through cross<br />
breeding programmes with the North African<br />
catfish, Clarias gariepinus has resulted in<br />
better per<strong>for</strong>mance <strong>of</strong> both broodstock <strong>and</strong><br />
seed. In intensive pond culture, catfish are<br />
fed a floating or a sinking feed. Production
Analysis <strong>of</strong> <strong>feeds</strong> <strong>and</strong> <strong>fertilizers</strong> <strong>for</strong> <strong>sustainable</strong> aquaculture development in Indonesia 257<br />
TABLE 10<br />
Grow-out per<strong>for</strong>mance <strong>of</strong> tilapia in various farming systems in Indonesia<br />
Per<strong>for</strong>mance Ponds<br />
Raceway<br />
(7 x 3 x 1.8 m)<br />
is divided into two stages, viz. nursery <strong>and</strong> grow-out. The nursery phase starts from<br />
exogenous feeding larvae until the fish reach either 3–5 cm or 5–7 cm (1.0–2.6 g), where<br />
after they are stocked into ponds. During the nursery phase (28–38 days), commercial<br />
<strong>feeds</strong> are fed at a rate <strong>of</strong> 8–12 percent <strong>of</strong> biomass per day, divided into 4–7 meals.<br />
During the grow-out phase in ponds the feeding rate decreases from 6 percent at the<br />
beginning <strong>of</strong> grow-out to 2 percent <strong>of</strong> biomass per day at the end <strong>and</strong> feeding frequency<br />
is ultimately reduced to 2 meals a day. Catfish are low-value fish but there is a high local<br />
dem<strong>and</strong> <strong>for</strong> the species. Plastic-lined ponds are used <strong>for</strong> intensive catfish production.<br />
Gouramy feeding<br />
Gouramy is the most expensive freshwater fish in Indonesia (US$2/kg) <strong>and</strong> is sold as<br />
a luxury food in many restaurants (Khairuman <strong>and</strong> Amri, 2003). Gouramy is cultured<br />
in extensive systems in freshwater ponds <strong>and</strong> paddy fields <strong>and</strong> intensively in floating<br />
net cages. In extensive culture systems gouramy are mainly fed on various leaves such<br />
as taro, papaya, <strong>and</strong> cassava. Floating net cages are used <strong>for</strong> intensive gouramy culture.<br />
Initial stocking size is 100 g at a stocking rate <strong>of</strong> 100 fish/m 3 . Fish are fed a commercial<br />
diet ad libitum (4–5 times/day) with a dietary protein content <strong>of</strong> 25–28 percent. After<br />
5 months the fish attain market size <strong>of</strong> 500 g.<br />
2.2 On-farm pond <strong>and</strong> feed management strategies<br />
2.2.1 Pond management techniques<br />
Pond preparation<br />
Pond preparation is a critical aspect <strong>of</strong> shrimp production systems. Avnimelech<br />
<strong>and</strong> Ritvo (2003) noted that nutrient accumulation in shrimp ponds result in the<br />
deterioration <strong>of</strong> the pond ecosystem. Pond sediments are there<strong>for</strong>e removed at the<br />
end <strong>of</strong> the production cycle <strong>and</strong> the ponds are allowed to dry out. Tea seed cake<br />
(10–12 ppm) <strong>and</strong> pesticides are commonly used<br />
to eliminate unwanted animals in the ponds.<br />
Lime is applied to regulate soil pH at 7.5–8.5.<br />
Recommended application rates are shown in<br />
Table 11. Liming is not recommended in areas<br />
where the soil has high pyrite content.<br />
Ponds are filled with seawater <strong>and</strong> then<br />
sterilized with calcium hypochlorite (a.i<br />
60 percent) at 25–30 ppm. During sterilization,<br />
Floating net cages<br />
(7 x 7 x 3.5 m)<br />
Small cages<br />
(2 x 1 x 1 m)<br />
Stocking<br />
Initial weight 15–20 g 15–20 g 15–20 g 50 g<br />
Density 4–8 fish/m2 300 kg/pond 200 kg/cage 5 kg/m2 Feed <strong>and</strong> feeding<br />
Live food production - - Natural food from<br />
the environment.<br />
Urea 2.5 g/m2 /week<br />
TSP 1.25 g/m2 / week<br />
Manure<br />
Artificial feed<br />
250 kg/month<br />
Feeding rate 3–5% BW 5–6% BW 3% BW 2–3% BW<br />
Feeding frequency 3 times/day 3 times/day 3 times/day 3–5 times/day<br />
Crude protein Min. 25% Min.30% Min. 20% 25–35%<br />
Final weight 500–600 g 500–600 g 500–600 g 30–40 kg/m<br />
Culture period 6 months 2–3 months 5 months 6–12 month<br />
Survival rate - - 70% -<br />
TABLE 11<br />
Recommended lime application rate<br />
(tonnes/ha) <strong>for</strong> ponds<br />
Soil pH Agricultural lime Hydrated lime<br />
0.5–1.0 >6 1.0–2.0<br />
5–6 2–3 1.0–1.5<br />
258<br />
<strong>Study</strong> <strong>and</strong> <strong>analysis</strong> <strong>of</strong> <strong>feeds</strong> <strong>and</strong> <strong>fertilizers</strong> <strong>for</strong> <strong>sustainable</strong> aquaculture development<br />
the pond is oxygenated using a paddle wheel <strong>for</strong> 2–3 hours <strong>and</strong> then allowed to settle<br />
<strong>for</strong> 4–5 days, where after it is inoculated with Chlorella. Sun dried chicken manure<br />
at 300 kg/ha is sometime applied <strong>and</strong> urea <strong>and</strong> TSP are applied at a rate <strong>of</strong> 5–10 ppm.<br />
A few days after fertilization plankton blooms occur <strong>and</strong> the water becomes slightly<br />
green.<br />
Stocking<br />
High quality, uni<strong>for</strong>mly sized, PCR negative seed (>PL 15) that have undergone a<br />
<strong>for</strong>malin test (200–300 ppm <strong>for</strong> 1 hour) are stocked into the ponds. P. monodon is<br />
commonly stocked at 10–20 PLs/m 2 <strong>and</strong> P. merguensis at 40 PLs/m 2 , with a final<br />
survival rate after 150 days <strong>of</strong> 75 percent (Ariawan et al., 2004).<br />
Feed <strong>and</strong> water quality management<br />
Water <strong>and</strong> sediment quality are checked routinely such that they remain optimal<br />
(Chanratchakool et al., 1995). Feeding regimes are adjusted routinely such that the<br />
shrimp are not overfed. Feeding trays are used to observe shrimp feeding response<br />
<strong>and</strong> growth is monitored every 10 to 30 days. Paddle wheels are used to maintain<br />
dissolved oxygen levels above 4 ppm. The number <strong>of</strong> paddlewheels depends on<br />
shrimp biomass <strong>and</strong> the general rule <strong>of</strong> thumb is that a one horse power paddle wheel<br />
can support 250 kg <strong>of</strong> P. monodon biomass (Taslihan, Supito <strong>and</strong> Callinan, 2004) or<br />
circa 500 kg L.vannamei (Tirta, pers. comm., 2005) During the production cycle <strong>of</strong><br />
P.monodon, commercial <strong>feeds</strong> are applied at a decreasing rate from 20 percent at the<br />
beginning <strong>of</strong> the cycle to around 2 percent <strong>of</strong> biomass at the end <strong>of</strong> the cycle fed<br />
2–5 times per day (Hardanu et al., 2004). The feeding rate <strong>for</strong> L.vannamei is about<br />
50 percent <strong>of</strong> shrimp biomass at the beginning <strong>of</strong> the production cycle (Adiwidjaya<br />
et al., 2004).<br />
Vibrio spp. <strong>and</strong> viruses have emerged as major constraints in shrimp aquaculture. In<br />
the past, antibiotics <strong>and</strong> other chemicals were commonly used. However, this practice<br />
has been phased out in favour <strong>of</strong> probiotics that are either incorporated into the feed<br />
or applied to the pond water (Decamp, 2004). The price <strong>of</strong> probiotics ranges from<br />
US$1.5–4.0/litre <strong>and</strong> the most commonly used br<strong>and</strong>s are Super NB, Super PS <strong>and</strong><br />
Bio-Bacter. Since 2001, probiotic application is widely used <strong>and</strong> research on the use <strong>of</strong><br />
probiotics is on-going (Poernomo, 2004). In addition, the application <strong>of</strong> organic carbon<br />
rich substrates (glucose, cassava, sorghum meal or cellulose) to control the carbon/<br />
nitrogen ratio (C/N ratio) is one <strong>of</strong> the management measures applied in Indonesian<br />
shrimp ponds (Avnimelech, 1999; Hari et al., 2004).<br />
2.2.2 On-farm feed <strong>for</strong>mulation<br />
Feed is the single most expensive item <strong>of</strong> the total production cost. The use <strong>of</strong> locally<br />
available ingredients (Table 12) <strong>for</strong> farm-made <strong>feeds</strong> must there<strong>for</strong>e be encouraged<br />
as well as appropriate fertilization regimens such that vitamins <strong>and</strong> minerals may be<br />
obtained through natural food (Brown et al., 1997; Trino <strong>and</strong> Sarroza, 1995).<br />
Farm-made aqua<strong>feeds</strong> are normally manufactured using available raw material but<br />
without much regard <strong>for</strong> the composition <strong>of</strong> the ingredients <strong>and</strong> <strong>feeds</strong> are tested by<br />
trial <strong>and</strong> error. However, the number <strong>of</strong> farmers who produce their own feed is limited<br />
<strong>and</strong> most semi-intensive <strong>and</strong> intensive farmers now depend on commercial <strong>feeds</strong>. The<br />
escalating price <strong>of</strong> commercial <strong>feeds</strong> is a major constraint <strong>for</strong> farmers who produce low<br />
value fish.<br />
2.2.3 Collection, transportation <strong>and</strong> storage <strong>of</strong> feed ingredients<br />
Some feed ingredients such as soybean, corn, cassava, rice bran that are used in<br />
Indonesian aquaculture are readily available, though others such as Nereis, golden<br />
snail <strong>and</strong> Azolla are highly seasonal. Transportation <strong>of</strong> local ingredients is generally
Analysis <strong>of</strong> <strong>feeds</strong> <strong>and</strong> <strong>fertilizers</strong> <strong>for</strong> <strong>sustainable</strong> aquaculture development in Indonesia 259<br />
TABLE 12<br />
Proximate composition <strong>of</strong> locally available feed ingredients in Indonesia (percent dry matter<br />
basis except otherwise indicated)<br />
Ingredients<br />
Animal origin<br />
Moisture Crude protein Crude lipid Ash Crude fibre NFE**<br />
Fishmeal (local) 1 8.70 55.17 4.46 19.33 1.98 18.06<br />
Fishmeal (East Java) 2 8.42 59.66 7.72 26.35 2.76 3.51<br />
Fishmeal (SE Sulawesi) 2 4.66 46.55 17.11 31.93 2.94 1.48<br />
Fishmeal, sardine1 18.60 62.36 9.84 18.68 2.04 7.08<br />
Fishmeal1 5.10 46.69 3.01 29.21 2.14 18.95<br />
Krill meal1 11.90 60.89 1.91 29.42 1.43 6.35<br />
Shrimp head meal1 11.80 41.99 1.30 37.15 2.58 16.98<br />
Cow blood meal1 6.50 86.47 6.00 4.67 0.09 2.77<br />
Fish silage1 79.58 59.59 7.05 23.21 2.98 7.17<br />
Snail meal1 8.20 54.29 4.18 1.05 18.67 30.45<br />
Shrimp meal1 17.28 53.74 8.95 4.49 24.96 10.79<br />
Nereis meal2 79.08 60.06 13.96 3.58 - -<br />
Cow liver meal2 14.41 53.51 9.54 3.71 - -<br />
Carapax crab meal2 8.92 21.13 0.65 39.16 - -<br />
Golden snail3 Plant origin<br />
- 54.00 - - - -<br />
Soybean meal4 11.50 43.36 5.32 7.08 2.80 42.65<br />
Corn meal4 12.10 10.81 3.66 2.00 2.00 81.59<br />
Flour meal4 13.10 12.27 1.16 0.58 - 79.70<br />
Rice bran4 10.10 17.11 8.67 8.00 8.68 47.44<br />
Coconut cake meal2 4.28 11.85 3.14 2.37 4.45 73.91<br />
Soybean cake meal4 10.52 23.86 5.93 - 26.39 42.97<br />
**Cassava meal (fresh leaf) 4 66.70 1.00 0.40 0.50 1.40 30.00<br />
Azolla leaf meal4 8.50 25.10 3.80 23.90 12.00 35.10<br />
Cassava leaf meal4 3.80 28.69 8.00 12.16 47.40<br />
Sorghum4 10.64 13.00 2.05 12.60 13.50 47.85<br />
Leucaena leaf meal4 9.30 14.10 3.43 1.31 18.14 28.50<br />
*Fresh weight basis; **NFE: Nitrogen free extract.<br />
Source: 1Suhenda, Azwar <strong>and</strong> Djajasewaka (2003); 2In<strong>for</strong>mation obtained from PSPG-UGM Yogyakarta <strong>and</strong><br />
Environment Laboratory-CBAD, Jepara (2003); 3Utomo, Suryana <strong>and</strong> Jusadi (2003); 4Sucipto <strong>and</strong> Prihartono (2005)<br />
not a major problem since most <strong>of</strong> the areas are accessed easily. However, the aquafeed<br />
industry is mainly located in Java <strong>and</strong> Sumatera <strong>and</strong> long distance transportation<br />
<strong>of</strong> commercial <strong>feeds</strong> is sometimes problematic. Inadequate storage <strong>and</strong> h<strong>and</strong>ling <strong>of</strong><br />
feed (ingredients) can lead to nutrient losses, rancidity, mould <strong>and</strong> rodent infestation.<br />
Farmers are aware <strong>of</strong> these potential problems <strong>and</strong> store their bagged ingredients in<br />
well ventilated stores on wooden racks.<br />
2.2.4 On-farm feed processing<br />
Farm-made <strong>feeds</strong> basically consist <strong>of</strong> mixed, locally available ingredients <strong>and</strong> are made<br />
by extruding a moist cooked dough through a meat mincer. Sun-dried fish is the main<br />
source <strong>of</strong> protein, which is then normally mixed with rice bran or corn meal, molasses<br />
<strong>and</strong> tapioca meal. Farm-made <strong>feeds</strong> easily disintegrate in water <strong>and</strong> fish must be fed in<br />
such a manner that the feed is consumed quickly. Some <strong>of</strong> the larger farmers produce<br />
up to 500–600 kg feed/day using 3–5 labourers. The price <strong>of</strong> farm-made <strong>feeds</strong> ranges<br />
from US$0.15–0.18/kg. The net pr<strong>of</strong>it using farm-made <strong>feeds</strong> <strong>for</strong> milkfish (US$0.016–<br />
0.02/kg feed) is less than half <strong>of</strong> that <strong>for</strong> commercial pellet <strong>feeds</strong> (US$0.34/kg feed).<br />
The major constraint in making farm-made <strong>feeds</strong> is the seasonal availability <strong>of</strong> protein<br />
sources such as trash fish <strong>and</strong> sun dried fish. Other constraints are that the <strong>feeds</strong> can<br />
only be sun dried during the dry season <strong>and</strong> that it cannot be stored <strong>for</strong> long periods<br />
due to the non incorporation <strong>of</strong> antioxidants. The nutrient content <strong>of</strong> some farm-made<br />
<strong>feeds</strong> <strong>for</strong> milkfish are shown in Table 13.
260<br />
TABLE 13<br />
Proximate composition (percent as fed basis) <strong>of</strong> farmmade<br />
<strong>feeds</strong> <strong>for</strong> milkfish<br />
Proximate <strong>analysis</strong> Farm-A Farm-B Farm-C<br />
Moisture 3.64 3.49 17.74<br />
Crude protein 11.58 10.55 9.17<br />
Crude lipid 7.75 12.63 5.00<br />
Ash 13.46 8.64 12.15<br />
Fibre 9.79 2.38 6.84<br />
NFE 53.78 62.31 49.10<br />
Source: In<strong>for</strong>mation obtained from Environment Laboratory-CBAD,<br />
Jepara, October, 2005<br />
TABLE 14<br />
Formulation (percent fresh weight basis) <strong>and</strong> gross<br />
nutrient composition (percent dry matter basis) <strong>of</strong> four<br />
farm-made moist <strong>feeds</strong> <strong>for</strong> juvenile grouper<br />
Ingredients Formulations<br />
1 2 3 4<br />
Trash fish 50 50 60 60<br />
Fishmeal (65% crude protein) 13 12 10 11<br />
Mussel/snail meat - 7 - -<br />
Mysid meal 5 - - -<br />
Soybean meal (solvent extracted) - - 15 -<br />
Groundnut meal - - - 15<br />
Dry blood meal - 10 - -<br />
Rice bran 16 15 9 -<br />
Tapioca/cassava starch - - - 9<br />
Wheat gluten (80% crude protein) 10 - - -<br />
Fish oil 4 4 4 3<br />
Additives 2 2 2 2<br />
Total<br />
Nutrient composition (%)<br />
100 100 100 100<br />
Moisture 42 47 50 50<br />
Crude protein 29 26.5 24.5 24<br />
Lipid 7.5 7.5 7.5 7<br />
Ash 7.5 6.5 6.5 5.5<br />
Source: Usman, Laining <strong>and</strong> Ahmad (2005)<br />
FIGURE 9<br />
Indonesian aquafeed production during 1998–2003<br />
Aquafeed production<br />
(thous<strong>and</strong> tonnes)<br />
600<br />
500<br />
400<br />
300<br />
200<br />
100<br />
Source: Sukria (2004)<br />
0<br />
<strong>Study</strong> <strong>and</strong> <strong>analysis</strong> <strong>of</strong> <strong>feeds</strong> <strong>and</strong> <strong>fertilizers</strong> <strong>for</strong> <strong>sustainable</strong> aquaculture development<br />
1998 1999 2000 2001 2002 2003<br />
Years<br />
The technology <strong>for</strong> manufacturing a farmmade<br />
moist pellet (Table 14) <strong>for</strong> juvenile<br />
grouper has recently been developed by the<br />
Research Institute <strong>for</strong> Coastal Aquaculture<br />
(RICA), South Sulawesi. This <strong>of</strong>fers many<br />
advantages <strong>for</strong> small-scale grouper farmers<br />
(Usman, Laining <strong>and</strong> Ahmad, 2005) such<br />
as, being easy to prepare with simple<br />
equipment, reducing the dependency on<br />
fishmeal, using locally available ingredients,<br />
effective vitamin enrichment, reduced feed<br />
waste <strong>and</strong> the feed can also be used to wean<br />
the fish onto dry pellets. The disadvantages<br />
are that the moist pellets cannot be stored,<br />
unless the farmer has a refrigerator, such<br />
that the feed has to be made daily <strong>and</strong> this is<br />
time <strong>and</strong> labour intensive.<br />
3. DEVELOPMENT OF THE AQUAFEED<br />
INDUSTRY IN INDONESIA<br />
Indonesia currently has an installed capacity<br />
to produce 12 million tonnes <strong>of</strong> animal feed.<br />
84.5 percent <strong>of</strong> the capacity is used <strong>for</strong> the<br />
production <strong>of</strong> poultry <strong>feeds</strong> <strong>and</strong> the rest<br />
is used <strong>for</strong> the production <strong>of</strong> aqua<strong>feeds</strong>,<br />
bird <strong>and</strong> pet food (Ali Basri, pers. comm.,<br />
American Soybean Association (ASA)-<br />
United States Grain Council (USGC),<br />
September 2005). Approximately 7 million<br />
tonnes <strong>of</strong> animal feed were produced in<br />
2005, <strong>of</strong> which 595 000 tonnes (8.5 percent)<br />
comprised aqua<strong>feeds</strong>. This closely matched<br />
the estimated aquafeed requirements <strong>for</strong><br />
2005 (Table 15).<br />
Aquafeed production in Indonesia<br />
continues to increase (Figure 9) because<br />
<strong>of</strong> increasing fish <strong>and</strong> shrimp production<br />
through expansion <strong>and</strong> intensification (see<br />
future projections in Table 16), the increasing<br />
use <strong>of</strong> <strong>for</strong>mulated, industrially manufactured<br />
<strong>feeds</strong> by farmers <strong>and</strong> an increase in the<br />
number <strong>of</strong> aquaculture species that require<br />
<strong>for</strong>mulated <strong>feeds</strong>.<br />
To attain the future targets (Table 16)<br />
there will be a need <strong>for</strong> the increased use <strong>of</strong><br />
locally available <strong>feeds</strong>tuffs supplemented by<br />
imports. Some 70 percent <strong>and</strong> 30 percent <strong>of</strong><br />
the ingredients <strong>for</strong> shrimp <strong>and</strong> fish <strong>feeds</strong>,<br />
respectively are imported (Widyatmoko,<br />
pers. comm., PT. Suri Tani Pemuka,<br />
2005). Around 300 000 tonnes <strong>of</strong> aquafeed<br />
ingredients were imported in 2005. Feed ingredient imports are shown in Table 17.<br />
There was a downward trend <strong>for</strong> some ingredients <strong>and</strong> this is a consequence <strong>of</strong> the
Analysis <strong>of</strong> <strong>feeds</strong> <strong>and</strong> <strong>fertilizers</strong> <strong>for</strong> <strong>sustainable</strong> aquaculture development in Indonesia 261<br />
TABLE 15<br />
Estimation <strong>of</strong> aquafeed requirements <strong>for</strong> various cultured species in 2005 in Indonesia<br />
No. Species<br />
Estimated<br />
production (tonnes)<br />
% <strong>of</strong> production<br />
based on feed<br />
Assumed FCR<br />
Estimated use <strong>of</strong><br />
feed (tonnes)<br />
1 Black tiger shrimp 90 000 20 1.5 27 000<br />
2 Pacific white shrimp 210 000 100 1.5 315 000<br />
3 Milkfish 285 000 10 1.5 42 750<br />
4 Carp 250 000 30 1.5 111 250<br />
5 Tilapia 98 000 30 1.5 44 100<br />
6 Clariid catfish 80 000 50 1.0 40 000<br />
7 Othersa 50 000 10 2.0 10 000<br />
Total 1 063 000 590 100<br />
a Grouper, seabass, gouramy, etc.<br />
TABLE 16<br />
Projected aquaculture production (tonnes) <strong>of</strong> various species in Indonesia <strong>for</strong> the period 2005–2009<br />
Species 2005 2006 2007 2008 2009 % increase per year<br />
Shrimp 300 000 350 000 410 000 470 000 540 000 15.83<br />
Grouper 12 000 15 000 19 000 24 00 30 000 25.75<br />
Seaweed 933 000 1 120 000 1 343 700 1 612 000 1 900 000 19.46<br />
Tilapia 98 000 120 000 140 000 170 000 195 000 18.81<br />
Milkfish 285 000 320 000 360 000 400 000 475 000 13.66<br />
Asian seabass 7 200 8 200 9 500 11 000 12 500 14.79<br />
Clariid catfish 80 000 95 000 115 000 140 000 175 000 21.64<br />
Mud crab 6 600 7 200 7 900 8 800 9 600 9.82<br />
Carp 250 000 270 000 310 000 375 000 446 000 15.68<br />
Gouramy 28 400 31 300 34 400 38 000 45 000 12.25<br />
Mussels 40 000 50 000 62 500 78 000 97 000 24.79<br />
Pearl 12 13 15 16 18 10.72<br />
Pangasius sp 16 500 20 000 25 300 30 300 36 500 21.98<br />
Ornamental fishes 5 000 6 000 7 200 8 640 10 200 19.51<br />
Others 186 288 213 027 244 285 281 744 297 382 12.48<br />
Total 2 248 000 2 625 740 3 088 800 3 625 900 4 269 200 17.39<br />
Source: Ditjenkan Budidaya (2005)<br />
TABLE 17<br />
Feed ingredient imports<br />
Ingredient<br />
2002<br />
Quantity (tonnes) %<br />
2003<br />
Quantity (tonnes) %<br />
Upto June 2004<br />
Quantity (tonnes) %<br />
Fishmeal/crustacean meal/ meat<br />
& bone meal<br />
294 166 67.53 29 303 39.34 118 916 80.61<br />
Squid meal 5 776 1.32 5 182 6.96 2 631 1.78<br />
Vitamin/mineral mixture 940 0.21 2 911 3.91 1 443 0.98<br />
Wheat gluten/flour 128 665 29.54 24 310 32.64 15 025 10.19<br />
Soybean/lecithin 1 096 0.25 4 523 6.07 3 747 2.54<br />
Shrimp feed 1 283 0.29 3 865 5.19 3 063 2.08<br />
Fish/squid oil 837 0.19 1 137 1.53 604 0.41<br />
Filler - - - - 712 0.48<br />
Binder - - - - 397 0.27<br />
Others 2 795 0.64 3 263 4.38 978 0.66<br />
Total 435 558 100 74 494 100 147 516 100<br />
Source: Ditjenkan Budidaya (2004)<br />
government ban (since June 2003) on imports <strong>of</strong> certain <strong>feeds</strong>tuffs. In particular<br />
this relates to meat <strong>and</strong> bone meal from Canada <strong>and</strong> poultry by-product meal from<br />
the United States <strong>of</strong> America because <strong>of</strong> mad-cow disease <strong>and</strong> avian influenza <strong>and</strong><br />
soybeans <strong>and</strong> corn from Brazil because <strong>of</strong> foot <strong>and</strong> mouth disease.<br />
To assure that <strong>feeds</strong> are free <strong>of</strong> antibiotics such as chloramphenicol samples from<br />
feed millers, feed distributors <strong>and</strong> or farms are routinely tested (Ditjenkan Budidaya,<br />
2005).
262<br />
<strong>Study</strong> <strong>and</strong> <strong>analysis</strong> <strong>of</strong> <strong>feeds</strong> <strong>and</strong> <strong>fertilizers</strong> <strong>for</strong> <strong>sustainable</strong> aquaculture development<br />
4. PROBLEMS AND CONSTRAINTS<br />
Aquaculture production in Indonesia has increased steadily <strong>and</strong> there is a growing<br />
dependence on commercial <strong>feeds</strong> in semi-intensive <strong>and</strong> intensive aquaculture. Shrimp,<br />
particularly L.vannamei, require the most feed (around 50 percent <strong>of</strong> total estimated<br />
aquafeed production). The other 50 percent is required <strong>for</strong> semi-intensive <strong>and</strong> intensive<br />
culture <strong>of</strong> common carp, tilapia, catfish <strong>and</strong> milkfish. Production <strong>of</strong> farm-made <strong>feeds</strong><br />
is limited <strong>and</strong> is decreasing. Tacon (2002) noted that the use <strong>of</strong> farm-made aquafeed is<br />
usually restricted to resource-poor farmers in Asia, <strong>and</strong> will in all likelihood be gradually<br />
replaced by commercial aqua<strong>feeds</strong>. Another more urgent <strong>and</strong> recent incentive <strong>for</strong> the<br />
shift to industrial <strong>feeds</strong> is to avoid the introduction <strong>and</strong> or spread <strong>of</strong> diseases from<br />
unprocessed marine food organism (including trash fish, crustaceans <strong>and</strong> molluscs).<br />
In general, farmers lack basic knowledge in the selection <strong>of</strong> ingredients, methods <strong>of</strong><br />
preparation, dietary nutrient requirements <strong>of</strong> fish <strong>and</strong> the use <strong>of</strong> basic equipment <strong>for</strong><br />
the production <strong>of</strong> farm-made <strong>feeds</strong>. To support the majority <strong>of</strong> extensive <strong>and</strong> semiintensive<br />
farmers in Indonesia, there is a need <strong>for</strong> farmers to be trained in proper farmmade<br />
feed preparation methods.<br />
Industrial <strong>feeds</strong>, especially <strong>for</strong> grow-out, are available <strong>for</strong> many farmed species.<br />
Currently, there are some 20 registered feed millers in Indonesia <strong>and</strong> most <strong>of</strong> them<br />
are located in Java <strong>and</strong> Sumatra. There is a need to increase the number <strong>of</strong> feed<br />
manufacturer in Indonesia to support the increasing aquaculture activities <strong>and</strong><br />
developments (Poernomo-PT Matahari Sakti; Widyatmoko, PT. Suri Tani Pemuka,<br />
pers. comm., 2005). The major problems <strong>and</strong> constraints facing aquaculture feed <strong>and</strong><br />
feeding include:<br />
• increasing dependence <strong>of</strong> the aquafeed industry on imported feed ingredients,<br />
especially <strong>for</strong> marine protein sources <strong>and</strong> fish oil. The future increase in<br />
aquaculture production <strong>and</strong> the predicted shortage <strong>of</strong> marine resources in the<br />
coming decade will be a problem in aquafeed production (Coutteau et al., 2002);<br />
• competing use <strong>of</strong> ingredients from the poultry sector <strong>and</strong> <strong>for</strong> human use;<br />
• escalating cost <strong>of</strong> ingredients. For example, the price <strong>of</strong> fishmeal increased from<br />
US$675/tonne in January 2005 to US$710/tonne by September 2005 (Ali Basri,<br />
ASA-USGC, pers. comm., 2005). As a consequence, shrimp feed prices increased<br />
by around US$0.05/kg during the same period;<br />
• production <strong>of</strong> farm-made <strong>feeds</strong> with locally available ingredients without<br />
considering nutrient availability <strong>and</strong> the requirements <strong>of</strong> the cultured species;<br />
• general lack <strong>of</strong> knowledge with respect to production volumes, seasonal <strong>and</strong><br />
geographical availability, pre-processing requirements <strong>and</strong> amino acid composition<br />
<strong>of</strong> several local feed ingredients;<br />
• importance <strong>of</strong> role played by natural food in freshwater <strong>and</strong> brackish-water fish<br />
culture, particularly in ponds. The combined use <strong>of</strong> natural food <strong>and</strong> <strong>for</strong>mulated<br />
<strong>feeds</strong> have to be managed properly so that feeding becomes more effective;<br />
• increasing cost <strong>of</strong> organic <strong>and</strong> inorganic <strong>fertilizers</strong> <strong>and</strong> <strong>feeds</strong> as a bottleneck <strong>for</strong> the<br />
expansion <strong>of</strong> small-scale aquaculture;<br />
• the need to further study the fate <strong>of</strong> nutrients <strong>and</strong> nutrient budgets within the<br />
captive environment to optimize feeding <strong>and</strong> minimize waste discharge into the<br />
surrounding environment;<br />
• the need to better define the use <strong>and</strong> benefits <strong>of</strong> additives (immunostimulants,<br />
attractants <strong>and</strong> probiotics) in <strong>feeds</strong>;<br />
• the need to train farmers in feed preparation procedures; <strong>and</strong><br />
• the need to define the nutritional requirements <strong>of</strong> all aquaculture species in<br />
Indonesia.
Analysis <strong>of</strong> <strong>feeds</strong> <strong>and</strong> <strong>fertilizers</strong> <strong>for</strong> <strong>sustainable</strong> aquaculture development in Indonesia 263<br />
5. RESOURCE AVAILABILITY AND THE EXPANSION OF THE AQUAFEED<br />
INDUSTRY<br />
Aquaculture production is expected to increase by approximately 17.4 percent per<br />
year from 1.47 million tonnes in 2004 (FAO, 2006) to 4.3 million tonnes in 2009. Fish<br />
<strong>and</strong> shrimp will dominate aquaculture production, though it is predicted that seaweed<br />
production will also increase significantly during this period.<br />
New areas <strong>for</strong> aquaculture development are available (Table 18), especially <strong>for</strong><br />
freshwater aquaculture. Milkfish <strong>and</strong> shrimp production can be increased through<br />
intensification <strong>and</strong> rehabilitating unused ponds. Mariculture <strong>for</strong> the next few years is<br />
likely to be dominated by seaweed <strong>and</strong> finfish culture.<br />
The dem<strong>and</strong> <strong>for</strong> industrially manufactured <strong>feeds</strong> will there<strong>for</strong>e also increase.<br />
Shrimp, primarily L.vannamei, culture is likely to exp<strong>and</strong> rapidly in the country.<br />
The high feed dem<strong>and</strong> <strong>of</strong> L.vannamei need to be addressed to produce more cost<br />
effective <strong>feeds</strong> <strong>and</strong> to minimize the use <strong>of</strong> protein sources from capture fisheries. The<br />
production <strong>of</strong> other crustacean species, such as P. merguiensis, P. indicus, Portunus<br />
pelagicus will also increase <strong>and</strong> this will require speciality <strong>feeds</strong>. In extensive culture<br />
systems, the availability <strong>and</strong> cost <strong>of</strong> organic <strong>and</strong> inorganic <strong>fertilizers</strong> can constraint<br />
future developments in the small-scale farming sector.<br />
The poultry industry will require significantly more feed in future <strong>and</strong> this will no<br />
doubt impact on the availability <strong>and</strong> cost <strong>of</strong> ingredients <strong>and</strong> manufactured <strong>feeds</strong>.<br />
6. RECOMMENDATIONS AND SUGGESTED POLICY GUIDELINES.<br />
Aquaculture development in Indonesia has three main objectives, viz. to enhance<br />
export earnings <strong>and</strong> domestic fish consumption <strong>and</strong> aquatic resources conservation. To<br />
achieve this there is a need to address the following issues:<br />
• The suitability <strong>of</strong> farming systems <strong>for</strong> individual aquaculture species need to be<br />
better defined on the basis <strong>of</strong> location <strong>and</strong> natural resource availability;<br />
• Fertilizer application rates <strong>and</strong> the nutrient requirements <strong>of</strong> aquaculture species<br />
must be better defined <strong>and</strong> more in<strong>for</strong>mation must be made available to farmers;<br />
• Aquafeed production is too dependent on imported ingredients. There is a need<br />
to improve domestic fishmeal processing;<br />
• Alternative protein sources must be found to replace or reduce fishmeal in<br />
aqua<strong>feeds</strong>;<br />
• Natural food availability is important <strong>for</strong> shrimp <strong>and</strong> fish growth. Laboratory<br />
scale experiments on feed <strong>and</strong> nutrient <strong>for</strong>mulations need to tested under practical<br />
farming conditions to facilitate natural food production;<br />
• The fate <strong>of</strong> nutrients <strong>and</strong> nutrient budgets in culture systems needs to be defined<br />
to further enhance feed <strong>for</strong>mulations <strong>and</strong> minimize waste to the environment;<br />
• The use <strong>of</strong> additives (immunostimulants, attractants <strong>and</strong> probiotics) in aquaculture<br />
needs to be consolidated to improve cost efficiency; <strong>and</strong><br />
• Greater consumer awareness <strong>of</strong> food safety issues requires the feed industry to pay<br />
greater attention to traceability <strong>of</strong> feed materials <strong>and</strong> feed processing technology.<br />
TABLE 18<br />
Existing use <strong>and</strong> area available <strong>for</strong> aquaculture expansion in Indonesia<br />
Aquaculture activity<br />
Existing use (2003)<br />
Area (ha) % <strong>of</strong> total<br />
Area available <strong>for</strong> potential expansion<br />
Area (ha) % <strong>of</strong> total<br />
Mariculture1 3 780 000 84.42 8 360 000 70.78<br />
Brackish-water 450 000 10.05 1 220 000 10.33<br />
Freshwater 247 473 5.53 2 230 000 18.89<br />
Pond 97 000 2.17 526 400 4.46<br />
Paddy field 150 000 3.35 1 545 900 13.09<br />
Common water 473 0.01 158 200 1.34<br />
1 Mariculture include both marine cage culture <strong>and</strong> seaweed culture<br />
Source: Ditjenkan Budidaya (2004)
264<br />
<strong>Study</strong> <strong>and</strong> <strong>analysis</strong> <strong>of</strong> <strong>feeds</strong> <strong>and</strong> <strong>fertilizers</strong> <strong>for</strong> <strong>sustainable</strong> aquaculture development<br />
ACKNOWLEDGEMENTS<br />
The author would like to thank Dr Dean M. Akiyama, Ir Widyatmoko, Ir Purnomo<br />
<strong>and</strong> Mr Ali Basri <strong>for</strong> their valuable in<strong>for</strong>mation on commercial <strong>feeds</strong> in Indonesia as<br />
well as the numerous farmers, colleagues <strong>and</strong> feed companies <strong>for</strong> their assistance.<br />
REFERENCES<br />
Adiwidjaya, D., Ariawan, K., Sutikno, E., Soelistinarto, D. & Rahardjo, S.P. 2004.<br />
Petunjuk Teknis Budidaya Udang vanname (Litopenaeus vannamei). Dirjenkan,<br />
Departemen Kelautan dan Perikanan. Budidaya. Jepara, Indonesia, BBPBAP. 33 pp.<br />
Ahmad, T., Ratnawati, E., Jamil, M. & Yakob, R. 2005. Budidaya b<strong>and</strong>eng secara intensif.<br />
Jakarta, Penebar Swadaya, 96 pp.<br />
Akbar, S. & Sudaryanto. 2002. Pembenihan dan pembesaran kerapu bebek. Jakarta,<br />
Penebar Swadaya. 104 pp.<br />
Akiyama, D.M. 1989. Shrimp feed requirements <strong>and</strong> feed management. In D.M. Akiyama<br />
ed. Proceedings <strong>of</strong> the Southeast Asia shrimp farm management workshop, pp. 75–82.<br />
Republic <strong>of</strong> Singapore, American Soybean Association.<br />
Akiyama, D.M. 2004. Technical comparison between P. monodon <strong>and</strong> L.vannamei<br />
production. National symposium on development <strong>and</strong> scientific <strong>and</strong> technology<br />
innovation in aquaculture, Semarang, January 27–29 2004.<br />
Allan, G. L., Moriarty, D.J.W. & Maguire, G.M. 1995. Effect <strong>of</strong> pond preparation <strong>and</strong><br />
feeding rate on production <strong>of</strong> Penaeus monodon Fabricius, water quality, bacteria <strong>and</strong><br />
benthos in model farming ponds. Aquaculture, 130: 329–349.<br />
Amri, K. & Khairuman, D. 2003. Budidaya ikan nila secara intensif. Jakarta, Agro Media<br />
Pustaka. 145 pp.<br />
Anonymous. 2004. Dukungan riset nutrisi dan teknologi pakan dalam pengembangan<br />
perikanan budidaya. Makalah disampaikan pada temu bisnis pengembangan nutrisi dan<br />
pakan ikan budidaya. M<strong>and</strong>arin Oriental Hotel, Surabaya, 11 Agustus 2004.<br />
Anonymous. 2005. Ikan b<strong>and</strong>eng potensial dibudidayakan dalam KJA di laut. (available at<br />
http://www.dkp.go.id/content.php?c=2125).<br />
Ariawan, K., Puspito, D.C.L., Poniran & Hardi. 2004. Diversifikasi komoditas udang<br />
local (Penaeus merguensis) di tambak dengan sistem tertutup. Jepara, Indonesia, Laporan<br />
Tahunan BBPBAP. pp. 147–155.<br />
ASEAN Cooperation in Food, Agriculture <strong>and</strong> Forestry. Undated. Manual <strong>of</strong> ASEAN<br />
good shrimp farm management practices. Fisheries Publication Series No.1. ASEAN<br />
Cooperation in Food, Agriculture <strong>and</strong> Forestry. 35 pp. (available at http://www.aseansec.<br />
org/agr_pub/fi1.doc).<br />
Avnimelech, Y. & Ritvo, G. 2003. Shrimp <strong>and</strong> fish pond soil: process <strong>and</strong> management.<br />
Aquaculture, 220: 549–567.<br />
Avnimelech, Y. 1999. Carbon/nitrogen ratio as a control element in aquaculture systems.<br />
Aquaculture, 176: 227–235.<br />
Boonyaratpalin, M. 1997. Nutrient requirement <strong>of</strong> marine food fish cultured in Southeast<br />
Asia. Aquaculture, 151: 283–313.<br />
Briggs, M., Funge-Smith, S.J., Subasinghe, R.P. & Phillips, M.J. 2004. Introductions<br />
<strong>and</strong> movement <strong>of</strong> Penaeus vannamei <strong>and</strong> P. stilyrostis in Asia <strong>and</strong> Pacific. FAO RAP<br />
Publication 2004/10. Bangkok, Regional <strong>of</strong>ficer <strong>for</strong> Asia <strong>and</strong> Pacific, FAORAP.<br />
32 pp<br />
Brown, M.R., Jeffrey, S.W., Volkman., J.K. & Dunstan, G.A. 1997. Nutritional properties<br />
<strong>of</strong> microalgae <strong>for</strong> mariculture. Aquaculture, 151: 315–331.<br />
Bur<strong>for</strong>d, M.A. & Williams, K.C. 2001. The fate <strong>of</strong> nitrogenous waste from shrimp feeding.<br />
Aquaculture, 19: 79–93.<br />
Chanratchakool, P., Turnbull, J.F., Funge-Smith, S.J. & Limsuwan, C. 1995. Health<br />
management in shrimp pond. AAHRI, Bangkok, Department <strong>of</strong> Fisheries, Kasetsart<br />
University Campus. 111 pp.
Analysis <strong>of</strong> <strong>feeds</strong> <strong>and</strong> <strong>fertilizers</strong> <strong>for</strong> <strong>sustainable</strong> aquaculture development in Indonesia 265<br />
Coutteau, P., Ceulemans, S., Van Halteren, A. & Robles, R. 2002. Fishmeal <strong>and</strong> fish oil<br />
in aqua<strong>feeds</strong> - how narrow is the bottleneck <strong>for</strong> marine fish? Book <strong>of</strong> abstract. World<br />
Aquaculture 2002. April 23–27, 2002, Beijing, China, Beijing International Convention<br />
Center.<br />
CP Shrimp News. 2004. Up grade culture (Vannamei tradisional Plus). Edisi 5, April, 2004.<br />
CP Shrimp News. 2005. Sulawesi raksasa yang sedang bangun dari tidur. Edisi 8, Juni, 2005.<br />
Cuzon, G., Lawrence, A., Gaxiola, G., Rosas, C. & Guillaume, J. 2004. Nutrition <strong>of</strong><br />
Litopenaeus vannamei reared in tanks or in ponds. Aquaculture, 235: 531–551.<br />
Decamp, O. 2004. Probiotics in aquaculture: a commentary based <strong>of</strong> some recent<br />
observations. Aqua Feeds: Formulation & Beyond, 1 (4): 12–13<br />
Ditjenkan Budidaya. 2004. Statistik Perikanan Budidaya 2003. Jakarta, Direktorat Jenderal<br />
Perikanan Budidaya (Directorate General <strong>of</strong> Aquaculture), Departmen Kelautan dan<br />
Perikanan. 127 pp.<br />
Ditjenkan Budidaya. 2005. Memori serah terima direktur jenderal Perikanan Budidaya.<br />
Jakarta, Direktorat Jenderal Perikanan Budidaya (Directorate General <strong>of</strong> Aquaculture),<br />
Departmen Kelautan dan Perikanan. 167 pp.<br />
FAO. 2006., Data <strong>and</strong> statistics unit. Aquaculture production: quantities 1950–2004. FAO<br />
Fisheries Department, Fishery In<strong>for</strong>mation, FISHSTAT Plus. (available at http://www.<br />
fao.org/fi/statist/FISOFT/FISHPLUS.asp)<br />
Funge-Smith, S.J. & Briggs, M.R.P. 1998. Nutrient budgets in intensive shrimp ponds:<br />
implication <strong>for</strong> sustainability. Aquaculture, 164:117–133.<br />
Goddard, S. 1996. Feed management in intensive aquaculture. London, Chapman & Hall.<br />
198 pp.<br />
Hardanu, W., Adiwidjaya, D., Triyono & Supramono, A. 2004. Peningkatan produktivitas<br />
tambak udang windu sederhana sistem tertutup. Jepara, Laporan Kegiatan BBPBAP.<br />
pp.136–146.<br />
Hari, B., Kurup, B.M., Varghese, J.T., Schrama, J.W. & Verdegem, M.C.J. 2004. Effects <strong>of</strong><br />
carbohydrate addition on production in extensive shrimp culture systems. Aquaculture,<br />
241: 179–194.<br />
Jackson, C., Preston, N., Thompson, O.J. & Bur<strong>for</strong>d, M.A. 2003. Nitrogen budget <strong>and</strong><br />
effluent nitrogen components at an intensive shrimp farm. Aquaculture, 218: 387-411.<br />
Jusadi, D., Probosasongko, D.A.M. & Mokoginta, I. 2004. Pengaruh kadar silase jeroan<br />
ikan patin yang berbeda dalam pakan terhadap pertumbuhan ikan patin, Pangasius<br />
hypopthalmus ukuran sejari. Prosiding semi- Aplikasi teknologi pakan dan peranannya<br />
bagi perkembangan usaha perikanan budidaya, 9 September 2003, Loka, Bogor. PRPB,<br />
Badan Riset Kelautan dan Perikanan, Departemen Kelautan dan Perikanan ISBN 979-<br />
8186-93-1.<br />
Khairuman, D. & Amri, K. 2003. Pembenihan dan Pembesaran Gurami Secara Intensif.<br />
Jakarta, Agromedia Pustaka. 139 pp.<br />
Khairuman, D., Suhenda, N. & Gunadi. 2002. Budidaya ikan mas secara intensif. Jakarta,<br />
Agro Media Pustaka. 81 pp.<br />
Komarudin, U., Mai Soni, A.F., Supardjono & Suyoto. 2005. Budidaya terpadu ikan<br />
kerapu macan, udang windu, dan rumput laut di tambak. Laporan Kegiatan BBPBAP<br />
Tahun 2004. pp. 97-109.<br />
Kopot, R. & Taw, N. 2004. Efficiency <strong>of</strong> Pacific white shrimp culture, current issues in<br />
Indonesia. Global Aquaculture Advocate, 7(2): 40–41.<br />
Krismono. 2005. Mengapa Ikan di Waduk Wonogiri Tidak Mengalami Kematian Massal?<br />
Warta Penelitian Perikanan Indonesia Edisi Akuakultur. Badan Riset Kelautan dan<br />
Perikanan. pp. 2–7.<br />
Laining, A., Rachmansyah, A., Ahmad, T. & Williams, K.C. 2004. Apparent digestibility<br />
<strong>of</strong> selected local feed ingredients <strong>for</strong> humpback grouper (Cromileptes altivelis). In M.A.<br />
Rimmer, S. McBride & K.C. Williams eds. Advance in Grouper Aquaculture, ACIAR<br />
Monograph, 110: 85–86.
266<br />
<strong>Study</strong> <strong>and</strong> <strong>analysis</strong> <strong>of</strong> <strong>feeds</strong> <strong>and</strong> <strong>fertilizers</strong> <strong>for</strong> <strong>sustainable</strong> aquaculture development<br />
Lee, B.K. & Kim, J.K. 2001. Production <strong>of</strong> C<strong>and</strong>ida utilis biomass on mollases in different<br />
culture types. Aqua. Engineering, 21:111–124.<br />
Martawati, N.S.R. 1995. Pengaruh pemberian pakan basah (moist feed) terhadap<br />
pertumbuhan dan kelangsungan hidup ikan kerapu lumpur (Epinephelus tauvina).<br />
Skripsi, Universitas Diponegoro. 92 pp.<br />
Martin, J.l.M., Veran, Y., Guelorget, O. & Phann, D. 1998. Shrimp rearing: stocking<br />
density, growth, impact on sediment, waste output <strong>and</strong> their relationships studied<br />
through the nitrogen budget in rearing ponds. Aquaculture, 164: 135-149.<br />
Murjani, M., Subyakto, S. & Sitorus, P. 2004. Cerita sukses pembudidaya ikan kerapu<br />
di Indonesia. National symposium on development <strong>and</strong> scientific <strong>and</strong> technology<br />
innovation in aquaculture, Semarang, 27-29 January 2004.<br />
Nur, A., Arifin, Z. & Latief, M.S. 2004. Supervisi dan pembinaan petani di Jawa Timur.<br />
Jepara, Departemen Kelautan dan Perikanan, Direktorat Jenderal Perikanan Budidaya,<br />
BBPBAP. 8 pp.<br />
Nur, A., Kuntiyo & Malistiyani, W. 2000. Pengaruh pemberian pakan dengan proteinenergi<br />
rasio berbeda terhadap pertumbuhan dan sintasan ikan kerapu (Epinephelus<br />
fuscoguttatus). Makalah disampaikan pada pertemuan Lintas UPT Ditjenkan Budidaya.<br />
Lampung 10–14 Juli 2000. Jepara, BBAP. 9 pp.<br />
Nur, A., Latief, M.S. & Kuntiyo. 2000. Optimalisasi penggunaan tepung ikan dalam pakan<br />
pembesaran ikan beronang (Siganus sp). Makalah disampaikan pada pertemuan Lintas<br />
UPT Ditjenkan Budidaya. Lampung, 10–14 Juli 2000. Jepara, BBAP. 8 pp.<br />
Panji, T. & Suharyanto. 2003. Produksi Spirulina platensis dan potensinya sebagai pakan<br />
ikan. Prosiding Semi - Aplikasi teknologi pakan dan peranannya bagi perkembangan<br />
usaha perikanan budidaya, 9 September 2003, Loka, Bogor. PRPB, Badan Riset Kelautan<br />
dan Perikanan, Departemen Kelautan dan Perikanan ISBN 979-8186-93-1.<br />
Poernomo, A. 2004. Sejarah perkembangan dan pilihan teknologi budidaya udang di<br />
tambak. National Symposium on Development <strong>and</strong> Scientific <strong>and</strong> Technology.<br />
Radiarta, I.N., Prihadi, T.H. & Sunarno, M.T. 2005. Pemantauan perikanan budidaya<br />
berbasis keramba jaring apung di waduk cirata dengan menggunakan multi-temporal<br />
data l<strong>and</strong>sat 7. Warta Penelitian Perikanan Indonesia Edisi Akuakultur. Badan Riset<br />
Kelautan dan Perikanan. pp 2–7.<br />
Smith, D.M., Bur<strong>for</strong>d, M.A., Tabrett, S.J., Irvin, S.J. & Ward, L. 2002. The effect <strong>of</strong><br />
feeding frequency on water quality <strong>and</strong> growth <strong>of</strong> the balck tiger shrimp (Penaeus<br />
monodon). Aquaculture, 207: 125–136.<br />
Sucipto, A. & Prihartono, E. 2005. Pembesaran Nila Merah Bangkok. Jakarta, Penebar<br />
Swadaya. 156 pp.<br />
Sudaryono, A., Tsvetnenko, E., Hutabarat, J., Supriharyono & Evans, L.H. 1999. Lupin<br />
ingredients in shrimp (Penaeus monodon) diets: influence <strong>of</strong> lupin species <strong>and</strong> types <strong>of</strong><br />
meals. Aquaculture, 171: 121–133.<br />
Suhenda, N., Azwar, A.I., & Djajasewaka. 2003. Kontribusi penelitian nutrisi dan teknologi<br />
pakan untuk mendukung usaha perikanan budidaya. Prosiding semi - Aplikasi teknologi<br />
pakan dan peranannya bagi perkembangan usaha perikanan budidaya, 9 September 2003,<br />
Loka, Bogor. PRPB, Badan Riset Kelautan dan Perikanan, Departemen Kelautan dan<br />
Perikanan. ISBN 979-8186-93-1.<br />
Sukria, H.A. 2004. Pabrik pakan skala mini dan pola pengembangan industri pakan<br />
pedesaan. Makalah disampaikan pada temu bisnis pengembangan nutrisi dan pakan ikan<br />
budidaya. 11 Agustus 2004, Surabaya, M<strong>and</strong>arin Oriental Hotel.<br />
Suprayudi, M. A., Mokoginta, I. & Naim, M. 2004. Penggantian tepung ikan oleh tepung<br />
bungkil kedele dalam pakan benih ikan gurami. Prosiding semi - Aplikasi teknologi<br />
pakan dan peranannya bagi perkembangan usaha perikanan budidaya, 9 September 2003,<br />
Loka, Bogor. PRPB, Badan Riset Kelautan dan Perikanan, Departemen Kelautan dan<br />
Perikanan. ISBN 979-8186-93-1.
Analysis <strong>of</strong> <strong>feeds</strong> <strong>and</strong> <strong>fertilizers</strong> <strong>for</strong> <strong>sustainable</strong> aquaculture development in Indonesia 267<br />
Tacon, A.G.J. & De Silva, S.S. 1997. Feed preparation <strong>and</strong> feed management strategies<br />
within semi-intensive fish farming system in the tropics. Aquaculture, 151: 379–404.<br />
Tacon, A.G.J. 2002. Thematic review <strong>of</strong> <strong>feeds</strong> <strong>and</strong> feed management practices in shrimp<br />
aquaculture. World Bank, NACA, WWF <strong>and</strong> FAO Consortium on shrimp farming <strong>and</strong><br />
the environment. Bangkok, NACA. 69 pp.<br />
Thakur, D.P. & Lin, C.K. 2003. Water quality <strong>and</strong> nutrient budget in closed shrimp<br />
(Penaeus monodon) culture systems. Aqua. Engeneering, 27: 159-176.<br />
Taslihan, A., Supito, S.E. & Callinan, R.B. 2004. Teknik Budidaya Udang Secara Benar.<br />
Dirjenkan Budidaya, Jepara, BBPBAP. 59 pp.<br />
Taw, N. 2005a. Indonesian shrimp production. Book <strong>of</strong> Abstract. World Aquaculture 2005,<br />
9–13 May 2005. Nusa Dua Bali, Bali, Indonesia, Bali International Convention Centre.<br />
Taw, N. 2005b. Shrimp farming in Indonesia. Evolving industry responds to varied issues.<br />
Global Aquaculture Advocate, 8(4): 65–67.<br />
Trino, A.T. & Sarroza, J.C. 1995. Effect <strong>of</strong> a diet lacking vitamin <strong>and</strong> mineral supplements<br />
on growth <strong>and</strong> survival <strong>of</strong> Penaeus monodon in modified extensive culture system.<br />
Aquaculture, 136: 323–330.<br />
Trobos. 2005. Budidaya ikan melimpah tanpa membuang limbah. Edisi khusus World<br />
Aqua, 2005.<br />
Usman, R., Laining, A. & Ahmad, T. 2005. Grouper grow-out <strong>feeds</strong> research at Maros<br />
Research Institute <strong>for</strong> Coastal Aquaculture, South Sulawesi, Indonesia. Aquaculture Asia<br />
Magizine, X (1): 42–45.<br />
Utomo, N.B.P., Suryana, S.M. & Jusadi, D. 2003. Pengaruh penggunaan tepung keong<br />
mas (Pomacea sp.) sebagai pakan substitusi tepung ikan terhadap pertumbuhan ikan<br />
mas (Cyprinus carpio). Prosiding semi - Aplikasi teknologi pakan dan peranannya bagi<br />
perkembangan usaha perikanan budidaya, 9 September 2003, Loka, Bogor. PRPB, Badan<br />
Riset Kelautan dan Perikanan, Departemen Kelautan dan Perikanan ISBN 979-8186-<br />
93–1.<br />
Yanuartin, C. 2004. Bahan baku pakan, masihkah harus diimpor?. Makalah disampaikan<br />
pada temu bisnis pengembangan nutrisi dan pakan ikan budidaya., 11 Agustus 2004,<br />
Surabaya,M<strong>and</strong>arin Oriental Hotel.
Analysis <strong>of</strong> <strong>feeds</strong> <strong>and</strong> <strong>fertilizers</strong><br />
<strong>for</strong> <strong>sustainable</strong> aquaculture<br />
development in the Philippines<br />
Neila S. Sumagaysay-Chavoso<br />
University <strong>of</strong> the Philippines Aquaculture Society, Inc.<br />
College <strong>of</strong> Fisheries <strong>and</strong> Ocean Sciences, Miag-ao, Iloilo<br />
Philippines<br />
Summary 270<br />
1. Overview 271<br />
2. Review <strong>and</strong> <strong>analysis</strong> <strong>of</strong> aquaculture <strong>feeds</strong> <strong>and</strong> feeding 277<br />
3. The aquaculture feed industry 292<br />
4. Problems <strong>and</strong> constraints 297<br />
5. Resource availability <strong>and</strong> the expansion <strong>of</strong> the aquaculture industry 298<br />
6. Recommendations 302<br />
Acknowledgements 303<br />
References 304<br />
Sumagaysay-Chavoso, N.S. 2007. Analysis <strong>of</strong> <strong>feeds</strong> <strong>and</strong> <strong>fertilizers</strong> <strong>for</strong> <strong>sustainable</strong><br />
aquaculture development in the Philippines. In M.R. Hasan, T. Hecht, S.S. De Silva <strong>and</strong><br />
A.G.J. Tacon (eds). <strong>Study</strong> <strong>and</strong> <strong>analysis</strong> <strong>of</strong> <strong>feeds</strong> <strong>and</strong> <strong>fertilizers</strong> <strong>for</strong> <strong>sustainable</strong> aquaculture<br />
development. FAO Fisheries Technical Paper. No. 497. Rome, FAO. pp. 269–308.<br />
269
270<br />
<strong>Study</strong> <strong>and</strong> <strong>analysis</strong> <strong>of</strong> <strong>feeds</strong> <strong>and</strong> <strong>fertilizers</strong> <strong>for</strong> <strong>sustainable</strong> aquaculture development<br />
SUMMARY<br />
Production from fisheries <strong>and</strong> aquaculture in the Philippines has increased from 2 721 000<br />
tonnes valued at US$1 458 million in 1994 to 3 926 173 tonnes valued at US$2 777 million<br />
in 2004. In 2004, total aquaculture production reached 1 717 026 tonnes <strong>and</strong> accounted <strong>for</strong><br />
over 44 percent <strong>of</strong> total fisheries production. Seaweed production contributes 70 percent<br />
to total production, followed by milkfish (15.9 percent), tilapia (8.5 percent) <strong>and</strong> shrimps<br />
(2.1 percent). The main species produced in l<strong>and</strong>-based pond culture are milkfish, tilapia,<br />
shrimp, mudcrab <strong>and</strong> catfish.<br />
Depending on stocking density, life support systems, fertilizer <strong>and</strong> feed inputs<br />
aquaculture systems in the Philippines can be classified as extensive, semi-intensive<br />
<strong>and</strong> intensive. Inorganic <strong>and</strong> organic <strong>fertilizers</strong> are applied in extensive <strong>and</strong> semiintensive<br />
pond systems to stimulate growth <strong>of</strong> natural food. The most widely used<br />
<strong>fertilizers</strong> in aquaculture are mono-ammonium phosphate, di-ammonium phosphate,<br />
urea <strong>and</strong> ammonium sulphate. Except <strong>for</strong> di-ammonium phosphate the country is not<br />
self sufficient with respect to the supply <strong>of</strong> <strong>fertilizers</strong>. The most widely used organic<br />
fertilizer <strong>for</strong> ponds is chicken manure. Most farmers prefer low-cost unprocessed organic<br />
<strong>fertilizers</strong> <strong>and</strong> the use <strong>of</strong> compost is also becoming popular.<br />
Feeding is employed when natural food, enhanced by fertilization, becomes inadequate.<br />
The aquaculture feed industry depends on local rice, corn <strong>and</strong> copra meal <strong>and</strong> imported<br />
soybean meal <strong>and</strong> wheat by-products. Fishmeal is either imported or locally sourced.<br />
Fish farmers use commercially manufactured <strong>feeds</strong>, farm-made <strong>feeds</strong> as well as raw,<br />
unprocessed <strong>feeds</strong>tuffs. Farm-made <strong>feeds</strong> or single-feed ingredients are used as feed <strong>for</strong><br />
milkfish, shrimps, crabs <strong>and</strong> tilapia in extensive <strong>and</strong> modified extensive farming systems.<br />
Catfish are fed chopped trash fish, fresh chicken entrails <strong>and</strong> commercial swine pellets,<br />
while grouper are fed on trash fish, commercial fish pellets <strong>and</strong> live juvenile tilapia.<br />
Commercial <strong>feeds</strong> are also used in semi-intensive <strong>and</strong> intensive culture <strong>of</strong> milkfish, tilapia<br />
<strong>and</strong> shrimp.<br />
In 2004, there were 505 registered feedmills in the Philippines. Of these, 395 were<br />
commercial feed manufactures, while the remainder were smaller, non-commercial feed<br />
producers. Of the 395 commercial feed manufacturers 78 (20 percent) produce aqua<strong>feeds</strong>.<br />
The production capacity <strong>of</strong> the aquafeed milling industry is 3.81 million tonnes/year,<br />
which far exceeds the 2003 production <strong>of</strong> approximately 204 395 tonnes. The major<br />
constraints facing the aquafeed industry are the high <strong>and</strong> volatile costs <strong>of</strong> raw materials<br />
that lead to high feed costs <strong>and</strong> reduce the dem<strong>and</strong> <strong>for</strong> feed. Collectively, these factors<br />
affect fish production. Data <strong>for</strong> 2003 show that some 28 800 tonnes <strong>of</strong> commercial <strong>feeds</strong><br />
were consumed by tilapia, milkfish <strong>and</strong> tiger shrimp. However, these figures exclude<br />
farm-made <strong>feeds</strong>, imported <strong>feeds</strong> <strong>and</strong> feed sales by the smaller feed producers.<br />
There is an adequate local supply <strong>of</strong> organic manure to cater <strong>for</strong> the needs <strong>of</strong> the<br />
aquaculture sector in the future. Current chicken manure production exceeds 52 million<br />
tonnes, while the dem<strong>and</strong> by the extensive <strong>and</strong> semi-intensive aquaculture sectors in 2003<br />
<strong>and</strong> in the next 10 years is estimated at 489 998 tonnes.<br />
Fish production costs are significantly lower in extensive systems (US$0.47/kg),<br />
which rely mainly on fertilization <strong>and</strong> are highest in intensive systems (US$0.84/kg)<br />
due to high feed input <strong>and</strong> installation <strong>of</strong> life support systems. To sustain the growth <strong>of</strong><br />
the aquaculture sector in the Philippines it is recommended that greater ef<strong>for</strong>ts be made<br />
with respect to the sourcing <strong>of</strong> raw materials <strong>for</strong> the feed industry. Also, there is a very<br />
real need to enhance farm-made feed technologies <strong>for</strong> small-scale farmers, focusing in<br />
particular on the use <strong>of</strong> local raw materials. Feed <strong>for</strong>mulations must be further improved<br />
<strong>for</strong> better feed conversion efficiency <strong>and</strong> to minimize environmental impacts. Moreover,<br />
effluent volumes <strong>and</strong> composition must be regulated to minimize nutrient discharge<br />
into the environment. Government programs such as the clustering <strong>of</strong> feedmillers <strong>and</strong><br />
fish farmers, balancing the fertilizer requirements <strong>and</strong> the rapid composting programme<br />
should be more effectively promoted <strong>and</strong> implemented.
Analysis <strong>of</strong> <strong>feeds</strong> <strong>and</strong> <strong>fertilizers</strong> <strong>for</strong> <strong>sustainable</strong> aquaculture development in the Philippines 271<br />
1. OVERVIEW<br />
1.1 L<strong>and</strong> <strong>and</strong> water resources <strong>of</strong><br />
the Philippines<br />
The Philippines is a tropical country<br />
in the Pacific Ocean consisting <strong>of</strong><br />
7 107 isl<strong>and</strong>s that lie between 4.23 o<br />
<strong>and</strong> 21.25 o N / 116 o <strong>and</strong> 127 o E. The<br />
isl<strong>and</strong>s are geographically divided into<br />
three main areas: Luzon (northern<br />
Philippines), Visayas (central<br />
Philippines) <strong>and</strong> Mindanao (southern<br />
Philippines). The country is composed<br />
<strong>of</strong> 79 provinces that are grouped into<br />
17 administrative regions. These are<br />
shown in Figure 1 <strong>and</strong> referred to<br />
throughout the report. Luzon consists<br />
<strong>of</strong> eight regions: CAR (Cordillera<br />
Administrative Region), Region I<br />
(Ilocos), Region II (Cagayan Valley),<br />
Region III (central Luzon), Region<br />
IV-A (Calabarzon), Region IV-B<br />
(Mimaro), NCR (National Capital<br />
Region), <strong>and</strong> Region V (Bicol). Three<br />
regions are located in the Visayas:<br />
Region VI (western Visayas), Region<br />
VII (central Visayas) <strong>and</strong> Region VIII<br />
(eastern Visayas). Mindanao is divided<br />
into six regions: Region IX (western<br />
Mindanao), Region X (northern<br />
FIGURE 1<br />
Map <strong>of</strong> the Philippines showing the 17 administrative<br />
regions<br />
Source: NAMRIA (2005)<br />
Mindanao), Region XI (southern Mindanao), Region XII (central Mindanao), Region<br />
XIII (CARAGA), <strong>and</strong> ARMM (Autonomous Region <strong>of</strong> Muslim Mindanao).<br />
The country has a total l<strong>and</strong> area <strong>of</strong> 29 624 660 ha, <strong>of</strong> which 11 681 040 ha are<br />
cultivated. The aquatic resources <strong>of</strong> the country are summarized in Table 1. Total fish<br />
pond area, depending on the source, ranges between 219 460 ha (NAMRIA, 2005)<br />
<strong>and</strong> 253 854 ha (BFAR, 2005; BAS, 2005a). There are approximately 239 323 ha <strong>of</strong><br />
brackish-water <strong>and</strong> 14 531 ha <strong>of</strong> freshwater ponds (Table 1), while Table 2 provides a<br />
measure <strong>of</strong> the distribution <strong>of</strong> ponds by administrative region. Inl<strong>and</strong> waters including<br />
lakes, rivers <strong>and</strong> reservoirs comprise ~250 000 ha. There are approximately 102 lakes<br />
in the Philippines, with an area greater than 100 ha. The country is also endowed with<br />
240 million ha <strong>of</strong> coastal marine areas, including coral reefs, sea grass <strong>and</strong> algal beds.<br />
These aquatic resources support fisheries that provide income <strong>and</strong> employment, export<br />
earnings <strong>and</strong> the bulk <strong>of</strong> domestic fish supply.<br />
1.2 Total fish production<br />
Total fisheries production (capture fisheries <strong>and</strong> aquaculture) increased from 220 000<br />
tonnes in 1950 to 2 721 000 tonnes (US$1 458 million) in 1994 to 3 926 000 tonnes<br />
(US$2 777 million; at $1:Php 50) in 2004 (Figure 2). The annual growth rate in fisheries<br />
production between 1994 <strong>and</strong> 2003 was 3.8 percent by volume. As a whole, the<br />
fisheries sector, which is valued at US$2 214 million at current prices, accounted <strong>for</strong><br />
2.3 percent <strong>of</strong> the Philippine GDP in 2004. The sector directly <strong>and</strong> indirectly employs<br />
approximately 990 000 people. In 2004, exports <strong>of</strong> fish <strong>and</strong> fishery products were<br />
valued at US$524 million, while imports were valued at US$79 million with a positive<br />
trade balance <strong>of</strong> US$445 million (BFAR, 2005).
272<br />
<strong>Study</strong> <strong>and</strong> <strong>analysis</strong> <strong>of</strong> <strong>feeds</strong> <strong>and</strong> <strong>fertilizers</strong> <strong>for</strong> <strong>sustainable</strong> aquaculture development<br />
TABLE 1<br />
The aquatic resources <strong>of</strong> the Philippines, 2004<br />
Resources Area<br />
Marine<br />
% <strong>of</strong><br />
Inl<strong>and</strong> Country<br />
Marine resources (ha)<br />
resources resources total<br />
Coastal 26 600 000 12.1 - 12.05<br />
Oceanic 193 400 000 87.9 - 87.61<br />
Marine Total (including EEZ) (ha) 220 000 000 100.0 - 99.66<br />
Shelf area (ha)<br />
(depth, 200 m)<br />
18 460 000 8.4 - 8.36<br />
Coral reef area (ha)<br />
(within 10–20 fathoms where reef fisheries occur)<br />
2 700 000 1.2 - 1.22<br />
Coast length (km)<br />
Inl<strong>and</strong> resources (ha)<br />
17 460 - - -<br />
Freshwater 106 328 - 14.2 0.05<br />
Brackish water 139 735 - 18.6 0.06<br />
Total swampl<strong>and</strong>s 246 063 - 32.8 0.11<br />
Freshwater 14 531 - 1.9 0.01<br />
Brackish water 239 323 - 31.9 0.11<br />
Total existing fish pond 253 854 - 33.8 0.12<br />
Lakes 200 000 - 26.7 0.09<br />
Rivers 31 000 - 4.1 0.01<br />
Reservoirs 19 000 - 2.5 0.01<br />
Total other inl<strong>and</strong> resources 250 000 - 33.3 0.11<br />
Inl<strong>and</strong> Total 749 917 - 100.0 0.34<br />
Country Total (ha) 220 749 917 - - 100.00<br />
Source: BFAR (2006); BAS (2005a)<br />
TABLE 2<br />
The distribution <strong>of</strong> fish ponds <strong>and</strong> inl<strong>and</strong> water<br />
resources in the Philippines by region<br />
Region Total area (ha) Fishponds<br />
(ha)<br />
Inl<strong>and</strong> waters<br />
(ha)<br />
CAR 1 807 680 - 6 970<br />
I 1 256 420 21 550 12 170<br />
II 2 646 060 100 19 310<br />
III 2 088 640 48 980 23 390<br />
NCR 72 590 2 900 7 700<br />
IV-A 1 683 750 5 850 106 660<br />
IV-B 2 686 760 7 690 11 440<br />
V 7 733 050 15 870 8 330<br />
VI 1 996 950 58 720 6 850<br />
VII 1 416 840 9 030 1 260<br />
VIII 2 084 280 2 340 3 540<br />
IX 1 455 430 25 010 1 770<br />
X 1 727 020 4 150 1 620<br />
XI 1 828 360 6 710 5 270<br />
XII 1 928 430 3 260 10 740<br />
XIII 1 867 470 5 830 23 640<br />
ARMM 1 244 930 1 470 47 880<br />
Total 29 624 660 219 460 298 640<br />
Source: NAMRIA (2005)<br />
1.3 Aquaculture<br />
Total aquaculture production reached<br />
1 714 860 tonnes in 2004 <strong>and</strong> continued<br />
to be the leading growth industry in the<br />
fisheries sector (BAS, 2005b). Aquaculture<br />
accounted <strong>for</strong> 32 percent <strong>of</strong> total fisheries<br />
production in 1994 <strong>and</strong> 44 percent in 2004.<br />
The substantial increases in the contribution<br />
by aquaculture to total fisheries production<br />
is largely ascribed to the rapid expansion <strong>of</strong><br />
seaweed farming, which now contributes<br />
approximately 70 percent to total aquaculture<br />
production.<br />
Of the 16 reported aquaculture species in<br />
the Philippines, milkfish (Chanos chanos),<br />
Nile tilapia (Oreochromis niloticus) <strong>and</strong><br />
tiger shrimp (Penaeus monodon) are the<br />
three most important. Milkfish, which are<br />
mainly produced in brackish-water ponds,<br />
contributed 15.9 percent to total aquaculture<br />
production, while tilapia accounted <strong>for</strong><br />
8.5 percent, followed by tiger shrimp<br />
(2.1 percent) from brackish-water ponds (Table 3). Analysis <strong>of</strong> production by culture<br />
systems revealed that seaweed culture (mariculture) contributed the highest proportion<br />
(70 percent), followed by brackish-water ponds (14.8 percent) <strong>and</strong> freshwater ponds<br />
(4.4 percent). Freshwater cage <strong>and</strong> pen culture contributed 3.2 <strong>and</strong> 2.9 percent,<br />
respectively, while other minor sectors (oysters, mussels, crabs etc.) collectively
Analysis <strong>of</strong> <strong>feeds</strong> <strong>and</strong> <strong>fertilizers</strong> <strong>for</strong> <strong>sustainable</strong> aquaculture development in the Philippines 273<br />
TABLE 3<br />
Aquaculture production (tonnes) by species <strong>and</strong> production system in 2004<br />
% <strong>of</strong> total<br />
production<br />
Total production<br />
(tonnes)<br />
Production System<br />
Pond Pen Cage Mariculture<br />
Species<br />
BW FW BW FW Marine BW FW Marine<br />
Milkfish (Chanos chanos) 200 531 - 4 388 25 685 14 173 4 056 1 581 23 179 - 273 593 15.9<br />
Nile tilapia (Oreochromis niloticus) 9 046 71 831 97 11 769 - 116 53 010 - 145 869 8.5<br />
Tiger shrimp (Penaeus monodon) 35 916 - - - - - - - - 35 196 2.1<br />
Carp (bighead carp, Aristichthys nobilis <strong>and</strong><br />
- 378 - 12 541 - - 805 - - 13 724 0.8<br />
common carp, Cyprinus carpio)<br />
White shrimp (Penaeus setiferus) <strong>and</strong><br />
2 030 - - - - - - - - 2 030 0.1<br />
endeavor prawn (Metapenaeus endeavori)<br />
Catfishes (waliking catfish, Clarias batrachus<br />
- 1 930 - - - - - - - 1 930 0.1<br />
<strong>and</strong> North African catfish, Clarias gariepinus)<br />
Snakehead murrel (Channa striata) 1 272 1 272 0.1<br />
Grouper (Epinephelus sp.). - - - 34 - - 136 - 170 < 0.1<br />
Others* 6 326 73 14 - 88 34 - 227 - 6 762 0.4<br />
Oysters (slipper cupped oyster Crassostrea<br />
- - - - - - - - 15 915 15 915 0.9<br />
iredale, Saccostrea spp.)<br />
Mussel (green mussel Perna viridis) - - - - - - - - 15 038 15 038 0.9<br />
Seaweeds (Kappaphycus <strong>and</strong> Eucheuma spp.) - - - - - - - - 1 204 808 1 204 808 70.2<br />
Total 253 849 75 484 4 499 49 995 14 295 4 206 55 396 23 542 1 235 761 1 717 027 100<br />
Note: BW = Brackish water , FW = Freshwater; *Others include Mozambique tilapia (Oreochromis mossambicus), giant gourami (Osphronemus goramy), Asian seabass/barramundi (Lates calcarifer), orangespotted<br />
spinefoot (Siganus guttatus), vermiculated spinefoot (Siganus vermiculatus), spotted scat (Scatophagus argus), Indian white prawn (Fenneropenaeus Indicus), banana prawn (Fenneropenaeus<br />
merguiensis), greasyback shrimp (Metapenaeus ensis), mud crab (Scylla serrata, Scylla oceanica), giant freshwater prawn (Macrobrachium rosenbergii) <strong>and</strong> lobsters (Panulirus spp.).<br />
Source: BFAR (2006)
274<br />
Production (thous<strong>and</strong> tonnes)<br />
4 500<br />
4 000<br />
3 500<br />
3 000<br />
2 500<br />
2 000<br />
1 500<br />
1 000<br />
<strong>Study</strong> <strong>and</strong> <strong>analysis</strong> <strong>of</strong> <strong>feeds</strong> <strong>and</strong> <strong>fertilizers</strong> <strong>for</strong> <strong>sustainable</strong> aquaculture development<br />
500<br />
Source: BFAR (2006)<br />
0<br />
FIGURE 2<br />
Fish production in the Philippines from 1994 to 2004<br />
Aquaculture Capture Total<br />
1994 1995 1996 1997 1998 1999 2000 2001 2002 2003 2004<br />
TABLE 4<br />
Aquaculture production (tonnes) by systems in the Philippines during 2000-2004<br />
Production system<br />
Pond<br />
2000 2001 2002 2003 2004<br />
Brackish water 235 729 268 120 254 167* 254 744* 253 849<br />
Freshwater 45 909 57 678 70 250 71 970 75 484<br />
Pond sub-total<br />
Cage<br />
281 638 325 798 324 417 326 714 329 333<br />
Brackish water 2 485 - - - 4 206<br />
Freshwater 38 595 42 061 49 657 52 832 55 396<br />
Marine 2 900 4 582 8 665 12 120 23 542<br />
Cage sub-total<br />
Pen<br />
43 980 46 643 58 322 64 952 83 144<br />
Brackish water 3 241 - - - 4 500<br />
Freshwater 27 529 23 927 27 468 35 876 49 995<br />
Marine 6 296 5 738 9 113 14 294<br />
Pen sub-total 37 066 29 665 36 581 45 949 68 789<br />
Mariculture 738 218 818 350 919 073 1 016 888 1 235 761<br />
Total 1 100 902 1 220 456 1 338 393 1 454 503 1 717 027<br />
*Includes production in brackish-water cages <strong>and</strong> pens<br />
contributed about 4.7 percent. Table 4 shows the trends in aquaculture production by<br />
systems in the Philippines during the period 2000 to 2004.<br />
The percent contribution by production systems has remained fairly constant over<br />
this five year period. Excluding seaweeds, Region III recorded the highest production<br />
among the administrative regions <strong>and</strong> this is attributable to milkfish <strong>and</strong> tiger shrimp<br />
production in brackish-water ponds <strong>and</strong> tilapia in freshwater ponds. Region IV-A<br />
ranked second mainly due to tilapia from freshwater fish cages <strong>and</strong> pens, while milkfish<br />
production in brackish-water ponds placed Region VI in the third position.<br />
1.4 Culture systems<br />
Farming <strong>of</strong> fish in brackish-water ponds is a centuries old tradition in the Philippines,<br />
while freshwater ponds, as well as pen <strong>and</strong> cage culture in the freshwater, brackishwater<br />
<strong>and</strong> marine environments are later innovations. Mussels <strong>and</strong> oysters are cultured<br />
on stakes <strong>and</strong> lines are used <strong>for</strong> seaweed culture. The majority <strong>of</strong> milkfish, tilapia,<br />
shrimp, mudcrab <strong>and</strong> catfish are farmed in l<strong>and</strong>-based pond systems enclosed either<br />
Year
Analysis <strong>of</strong> <strong>feeds</strong> <strong>and</strong> <strong>fertilizers</strong> <strong>for</strong> <strong>sustainable</strong> aquaculture development in the Philippines 275<br />
TABLE 5<br />
Overview <strong>of</strong> freshwater <strong>and</strong> brackish-water systems in the Philippines, extensive system<br />
Yield<br />
(kg/ha)<br />
Harvest size<br />
(g)<br />
Fertilization <strong>and</strong> feeding Rearing period<br />
(months)<br />
Stocking density<br />
(fish/ha)<br />
System Culture species Area (ha) or<br />
volume (m3 )<br />
Organic/inorganic fertilizer, supplemental<br />
4 250<br />
600–800<br />
feed<br />
30<br />
120–240<br />
Organic/inorganic fertilizer, trash fish 4–5 200–400 800–4 800<br />
250<br />
200–600<br />
Organic/inorganic fertilizer,<br />
5–7 400–800 1 600–3 200<br />
tilapia fingerlings, trash fish<br />
1 3 000–3 500<br />
5 000–10 000<br />
200 5 000–15 000<br />
1 000–2 500<br />
0.5–1.0 5 000<br />
5 000–10 000<br />
Milkfish<br />
Shrimp<br />
Crab<br />
Milkfish<br />
Grouper<br />
Tilapia<br />
Polyculture<br />
Brackish-water<br />
pond<br />
Milkfish 1 1 000–4 000 Organic/inorganic <strong>fertilizers</strong>, supplemental<br />
4 200–300 400–1 000<br />
feed, commercial feed<br />
Tilapia 1 3 000–5 000 Organic/inorganic fertilizer 4 100–200 300–800<br />
Monoculture<br />
Brackish-water<br />
pond<br />
Shrimp<br />
Extensive<br />
>5<br />
>10 000 Organic/inorganic <strong>fertilizers</strong>, supplemental<br />
3–4<br />
>40<br />
200–300<br />
modified<br />
2–5<br />
20 000–50 000 feed, commercial feed<br />
3–4<br />
28–32<br />
500–900<br />
Mangrove areas Mudcrab 200 5 000–7 000 Organic/inorganic fertilizer trash fish 3–5 150–400 800–1600<br />
Mudcrab<br />
200 5 000–20 000 Organic/inorganic fertilizer, trash fish 1 350–400 1 400–6 400<br />
fattening<br />
Mudcrab 5 000 Trash fish 275 1 200<br />
Mudcrab<br />
200 5 000–20 000 Trash fish 1 350–400 1 400–6 400<br />
fattening<br />
Freshwater pond Catfish >0.1–0.5 50 000–60 000 Inorganic fertilizer, supplemental feed 4 100 3 000–4 000<br />
Freshwater pen Bighead carp >1 5 000–10 000 No fertilizer, no feed 6 1 500 4 500–9 000
276<br />
TABLE 5. CONTINUED<br />
Overview <strong>of</strong> freshwater <strong>and</strong> brackish-water systems in the Philippines, semi-intensive <strong>and</strong> intensive systems<br />
Yield<br />
(kg/ha)<br />
Harvest size<br />
(g)<br />
Fertilization <strong>and</strong> feeding Rearing period<br />
(months)<br />
Stocking density<br />
(fish/ha)<br />
System Culture species Area (ha) or volume<br />
(m3 )<br />
Semi-intensive<br />
Polyculture<br />
Brackish-water pond Milkfish<br />
Shrimp<br />
<strong>Study</strong> <strong>and</strong> <strong>analysis</strong> <strong>of</strong> <strong>feeds</strong> <strong>and</strong> <strong>fertilizers</strong> <strong>for</strong> <strong>sustainable</strong> aquaculture development<br />
2 250<br />
840<br />
4 250<br />
30<br />
Organic/inorganic fertilizer,<br />
supplemental feed, commercial feed<br />
10 000<br />
35 000<br />
Monoculture<br />
Brackish-water pond Milkfish 0.5–1 8000–15 000 Organic/inorganic <strong>fertilizers</strong>,<br />
4 200–-300 1 500–3 500<br />
commercial feed<br />
Shrimp 1–2 100 000–150 000 Commercial feed 4–5 28–35 2 000–3 000<br />
Brackish-water cage Grouper 75 m3 7/m3 Trash fish, mussel meal, etc. 5–7 450 2.5/m3 Freshwater pond Tilapia 0.25–1 10 000–50 000 Organic/inorganic fertilizer, commercial<br />
3–4 150–250 1 300–7 000<br />
feed<br />
Catfish 0.05 100 000–150 000 4 100 6 000–15 000<br />
Freshwater cage Tilapia 100 m3 15–25/m3 Supplemental feed, commercial feed 3–4 250–300 2.7–7.0<br />
Freshwater pen Milkfish >1 1/m3 Supplemental feed 4 300 2 700<br />
Iintensive<br />
Monoculture<br />
Brackish-water pond Milkfish 0.5 >20 000 Commercial feed 4 200–300 >4 000<br />
Shrimp 200 000 Commercial feed 5–6 25–30 >3 000<br />
Freshwater pond Tilapia 0.5–1.0 50 000–100 000 Commercial feed 4–5 250 7 000–15 000<br />
Freshwater cage Tilapia 100–400 m3 50–250/m3 Commercial feed 3–5 150–250 5–37/m3 Milkfish 400 12.5–25/m 3 Commercial feed 3–5 300 3–6/m 3<br />
Tanks Tilapia >0.5 100–200/m 3 Commercial feed 4–5 300 20–50/m 3<br />
Source: milkfish - Bagarinao (1997), Sumagaysay-Chavoso (2003), author’s survey (2005); tilapia - Guerrero (2002), Aldon (1998), Corpuz-Uy, pers. comm., author’s survey (2005); shrimp - Regalado (2001),<br />
author’s survey (2005); mudcrab - Baliao, de los Santos <strong>and</strong> Franco (1999), Rodriguez (2001), Triño et al. (1999); catfish - Tan-Fermin <strong>and</strong> Coniza (2003), Bombeo (2001), Surtida <strong>and</strong> Buendia (2000); grouper -<br />
Baliao et al. (1998), Baliao et al. (2000), Toledo (2001); carp - Frio (1999), Eguia (2003)
Analysis <strong>of</strong> <strong>feeds</strong> <strong>and</strong> <strong>fertilizers</strong> <strong>for</strong> <strong>sustainable</strong> aquaculture development in the Philippines 277<br />
with earthen or cement dykes, provided with a sluice gate <strong>for</strong> water exchange. Fish pens<br />
are large enclosures made <strong>of</strong> stakes <strong>and</strong> netting material <strong>and</strong> these are set in lakes, rivers<br />
or sheltered bays <strong>and</strong> in which the fish have access to natural benthic <strong>and</strong> planktonic<br />
food. The primary pen culture species are milkfish (marine <strong>and</strong> brackish water), tilapia<br />
(fresh <strong>and</strong> brackish water ) <strong>and</strong> carp (freshwater). Fish cages are relatively small <strong>and</strong> are<br />
staked in shallow waters or set in deeper waters with appropriate floats <strong>and</strong> anchors.<br />
Tilapia, milkfish, groupers <strong>and</strong> siganids are the main cage culture species.<br />
Table 5 provides an overview <strong>of</strong> the various freshwater <strong>and</strong> brackish-water<br />
aquaculture systems in the Philippines <strong>and</strong> their mode <strong>of</strong> operation. The data clearly<br />
show how stocking density, fertilization, feeding intensity <strong>and</strong> the complexity in life<br />
support systems increase with systems intensification.<br />
2. REVIEW AND ANALYSIS OF AQUACULTURE FEEDS AND FEEDING<br />
2.1 Fertilizer <strong>and</strong> feed resources <strong>of</strong> the Philippines<br />
2.1.1 Fertilizers<br />
Inorganic <strong>fertilizers</strong><br />
The most widely used <strong>fertilizers</strong> in aquaculture are mono-ammonium phosphate (16-<br />
20-0) <strong>and</strong> di-ammonium phosphate (18-46-0) as nitrogen <strong>and</strong> phosphorus sources, urea<br />
(46-0-0) as a nitrogen source <strong>and</strong> ammonium sulphate (21-0-0). Ammonium sulphate<br />
in combination with lime is used to kill unwanted species in ponds prior to stocking.<br />
Though some <strong>fertilizers</strong> are produced locally the bulk is imported. Table 6 shows the<br />
2003/04 supply <strong>and</strong> dem<strong>and</strong> <strong>for</strong> inorganic <strong>fertilizers</strong> commonly used in aquaculture.<br />
Urea dominated the country’s fertilizer imports averaging 35.4 percent in 2003 <strong>and</strong><br />
2004 followed by 21-0-0 (22.8 percent) <strong>and</strong> 18-46-0 (8.1percent). Fertilizer exports, on<br />
the other h<strong>and</strong>, decreased from 456 636 tonnes in 1997 to 21 356 tonnes in 2004, due to<br />
a decrease in domestic dem<strong>and</strong> (Cipriano, 2002).<br />
Average sales in 2003 <strong>and</strong> 2004 were dominated by 14-14-14 (30.0 percent), urea<br />
(25.1 percent), 16-20-0 (17.3 percent) <strong>and</strong> 21-0-0 (11.9 percent). Since 2002 there<br />
have been five companies that produce <strong>fertilizers</strong> <strong>and</strong> which have blending facilities.<br />
These are Philphos, AFC Fertilizer <strong>and</strong> Chemical Inc., International Chemical Corp<br />
(INCHEM), Farmix Fertilizer Corp., <strong>and</strong> Soiltech Agricultural Products Corp.<br />
(Cipriano 2002; FADINAP, 2002)<br />
Government support <strong>for</strong> the fertilizer industry is historically strong. The<br />
deregulation <strong>of</strong> the fertilizer industry in 1986 encouraged the entry <strong>of</strong> more traders.<br />
This fostered competition to the benefit <strong>of</strong> consumers (ADB, 2002). Quality<br />
assurance <strong>and</strong> monitoring systems are being institutionalized. Government support is<br />
TABLE 6<br />
Domestic supply <strong>and</strong> dem<strong>and</strong> (tonnes) <strong>of</strong> inorganic <strong>fertilizers</strong> commonly used in aquaculture<br />
Grade<br />
2003<br />
Import Production Sale Export<br />
Urea 733 683 - 466 413 1 600<br />
21-0-0 398 620 116 656 212 053 58 176<br />
16-20-0 63 170 203 755 252 621 19 390<br />
18-46-0 163 911 65 820 32 000 36 500<br />
14-14-14 43 200 368 543 416 980 -<br />
Total<br />
2004<br />
1 640 386 1 059 315 1 540 179 334 944<br />
Urea 426 190 - 172 333 -<br />
21-0-0 348 206 33 780 86 568 500<br />
16-20-0 91 106 83 106 158 666 -<br />
18-46-0 103 193 43 937 18 087 15 096<br />
14-14-14 58 455 122 730 286 946 -<br />
Total 1 639 752 371 404 869 513 21 356<br />
Source: FPA (unpublished report)
278<br />
g<br />
a<br />
b<br />
g<br />
k<br />
0<br />
5<br />
/<br />
$<br />
S<br />
U<br />
g<br />
a<br />
b<br />
g<br />
k<br />
0<br />
5<br />
/<br />
$<br />
S<br />
U<br />
18.00<br />
15.00<br />
12.00<br />
18<br />
15<br />
12<br />
0.00<br />
2002 2003 2004<br />
9<br />
6<br />
3<br />
0<br />
9.00<br />
6.00<br />
3.00<br />
<strong>Study</strong> <strong>and</strong> <strong>analysis</strong> <strong>of</strong> <strong>feeds</strong> <strong>and</strong> <strong>fertilizers</strong> <strong>for</strong> <strong>sustainable</strong> aquaculture development<br />
FIGURE 3<br />
Average retail prices <strong>of</strong> major fertilizer grades<br />
Source: FPA (unpublished report)<br />
Year<br />
manifested through price control<br />
<strong>and</strong> incentives (ADB, 2002). A<br />
tariff <strong>of</strong> 3 percent is set on 21-<br />
0-0, 18-46-0, <strong>and</strong> 16-20-0, <strong>and</strong><br />
1 percent on urea <strong>for</strong> MFNs <strong>and</strong><br />
free <strong>for</strong> ASEAN member countries<br />
(Philippine Tariff Commission<br />
2004). A 10 percent value-added<br />
tax exemption is also granted to<br />
direct users (cooperatives, farmer’s<br />
associations, partnership <strong>and</strong><br />
other entities directly involved in<br />
agriculture or fisheries) by way<br />
<strong>of</strong> value-added tax exemption<br />
certificates approved by the FPA.<br />
This incentive is in line with the<br />
R.A. (Republic Act) 8435, otherwise known as the Agriculture <strong>and</strong> Fisheries<br />
Urea<br />
Modernization Act (Arboleda, 1998).<br />
21-0-0<br />
In 2003/04, 18-46-0 was the most expensive (US$199–242/tonne), followed by urea<br />
16-20-0<br />
(US$171–240/tonne). World prices <strong>and</strong> currency exchange rate fluctuations influence<br />
18-46-0<br />
the domestic prices <strong>of</strong> inorganic <strong>fertilizers</strong>. Between 1995 <strong>and</strong> 2001, inorganic fertilizer<br />
14-14-14<br />
retail prices increased annually by 4.0–5.5 percent. However, at real or constant prices,<br />
the retail price actually declined by 6.7–7.6 percent during this period. (Real or constant<br />
prices are determined after the effects <strong>of</strong> inflation have been eliminated. Nominal prices<br />
refer to the current Year value <strong>of</strong> a good or commodity during a particular period or year.)<br />
However, between 2002 <strong>and</strong> 2004 the retail price <strong>of</strong> 16-20-0 increased by 64 percent<br />
<strong>and</strong> by 97 percent <strong>for</strong> 21-0-0 (Figure 3). It is <strong>for</strong> this reason that farmers are now<br />
seeking alternatives <strong>and</strong> are looking more towards organic <strong>fertilizers</strong>.<br />
2002 2003 2004<br />
UREA<br />
21-0-0<br />
16-20-0<br />
18-46-0<br />
14-14-14<br />
Organic fertilizer (manures <strong>and</strong> compost)<br />
The FPA <strong>of</strong> the Department <strong>of</strong> Agriculture has recently <strong>for</strong>mulated guidelines on good<br />
agricultural practices to optimize fertilizer use. In particular, the guidelines advocate<br />
the use <strong>of</strong> organic <strong>fertilizers</strong> to promote <strong>sustainable</strong> production <strong>and</strong> development. The<br />
most widely used organic fertilizer in ponds is chicken manure at prices ranging from<br />
US$16–22/tonne. Other livestock manures, mudpress (agricultural waste from sugar<br />
mills) <strong>and</strong> rice bran are also used but to a much lesser extent. Fish farmers usually<br />
apply organic <strong>fertilizers</strong> during pond preparation, although some apply manure during<br />
the production cycle to maintain plankton growth. It was estimated that between 56.8<br />
million <strong>and</strong> 107.8 million tonnes <strong>of</strong> manure was produced in 2004 (Table 7).<br />
TABLE 7<br />
Estimated animal manure production<br />
Animals (tonnes live weight) 1 Dry manure production (tonne/year)<br />
Year 2003 2004 2003 2004<br />
Carabaoa 132 384 138 048 174 868–347 926 182 350–362 812<br />
Beef cattleb 129 225 127 990 170 695–339 624 169 064–336 378<br />
Dairy cattlec 129 255 127 990 320 790–528 415 317 651–523 244<br />
Swined 1 733 087 1 709 404 3 767 346–7 155 146 3 715 864–7 057 369<br />
Chickene 1 188 738 1 231 794 50 557 544–96 021 604 52 388 734–99 499 499<br />
Total 54 991 243–104 392 716 56 773 663–107 779 303<br />
a b Manure production based on assumption <strong>for</strong> beef cattle; Total solids in waste: 1 643–3 269 g/day/454 kg animal;<br />
c d e Total solids in waste: 3 087–5 085 g/day/454 kg animal; Total solids in waste: 268–509 g/day/45 kg animal; Total<br />
solids in waste: 268–509 g/day/2.3 kg animal<br />
1 Total production by region <strong>and</strong> by quarter, 1999-2004<br />
Source: BAS, unpublished report
Analysis <strong>of</strong> <strong>feeds</strong> <strong>and</strong> <strong>fertilizers</strong> <strong>for</strong> <strong>sustainable</strong> aquaculture development in the Philippines 279<br />
TABLE 8<br />
Distribution <strong>of</strong> fishponds <strong>and</strong> livestock in the Philippines in 2004<br />
Region Fishpond area1 Animals (tonnes live weight) 2<br />
(ha) Carabao Cattle Swine Chicken<br />
CAR none 4 766 6 492 40 588 7 478<br />
I 21 550 9 062 30 505 77 235 51 082<br />
II 100 13 889 15 390 96 714 53 520<br />
III 48 980 5 216 17 575 267 095 384 072<br />
IV-A 5 850 5 019 19 706 213 742 283 725<br />
IV-B 7 690 8 081 10 580 55 086 7 330<br />
V 15 870 9 968 13 700 95 132 29 874<br />
VI 58 720 17 326 25 106 139 351 63 711<br />
VII 9 030 5 305 31 086 130 564 81 185<br />
VIII 2 340 7 912 3 598 112 410 38 305<br />
IX 25 010 9 947 16 343 93 659 28 027<br />
X 4 150 7 423 28 103 102 000 57 782<br />
XI 6 710 10 289 11 091 128 112 88 777<br />
XII 3 260 14 127 14 511 91 581 32 943<br />
XIII 5 830 3 644 1 482 59 251 15 310<br />
ARMM 1 470 6 074 10 713 6 884 6 884<br />
Source: 1 NAMRIA (2005); 2 total production by region <strong>and</strong> by quarter, 1999-2004 (BAS, unpublished report)<br />
TABLE 9<br />
Specifications <strong>for</strong> organic <strong>fertilizers</strong> <strong>and</strong> compost/soil conditioners<br />
Pure organic fertilizer Compost/soil conditioner Fortified organic fertilizer<br />
Total NPK 5–7% 3–4% 8% minimum<br />
C:N 12:1 12:1 12:1<br />
Moisture content 20%<br />
Source: FPA (unpublished report)<br />
The dem<strong>and</strong> <strong>for</strong> chicken manure by tilapia farmers in Central Luzon (Region III)<br />
<strong>and</strong> by milkfish farmers in Region IV is particularly high (Table 8) (ADB, 2002). As<br />
mentioned earlier, most farmers prefer low-cost unprocessed organic <strong>fertilizers</strong> <strong>of</strong><br />
animal origin, but the use <strong>of</strong> compost is also becoming popular. Compost is commonly<br />
made from rice hulls, rice straw, grasses, hog <strong>and</strong> chicken manures, leucaena leaves or<br />
other leguminous material. Bacteria or fungi are usually added as activators (Cuevas,<br />
1997). Other techniques include vermicomposting (Dugeno 2005). All commercially<br />
produced composts must also con<strong>for</strong>m to regulatory st<strong>and</strong>ards (Table 9).<br />
Production <strong>of</strong> composted organic <strong>fertilizers</strong> began in 1974 (Cuevas, 1997). Highest<br />
production levels were attained in 1992<br />
when some 75 000 tonnes were produced<br />
but by 2003 had decreased to less than<br />
5 000 tonnes per annum. Production<br />
again increased to 19 000 tonnes in 2004<br />
(Figure 4).<br />
Marketing <strong>of</strong> <strong>fertilizers</strong>. The market<br />
chain <strong>for</strong> inorganic <strong>fertilizers</strong> starts<br />
with the producers or importers to the<br />
distributors (wholesalers) in regional or<br />
provincial sale <strong>of</strong>fices. The distributors<br />
transfer the products to local dealers <strong>and</strong><br />
retailers who sell directly to farmers.<br />
Dealers are distributed throughout the<br />
country <strong>and</strong> in isolated areas play a<br />
particularly important role. Fertilizer<br />
Tonnes<br />
FIGURE 4<br />
Domestic organic fertilizer supply <strong>and</strong> dem<strong>and</strong><br />
90 000<br />
75 000<br />
60 000<br />
45 000<br />
30 000<br />
15 000<br />
0<br />
1991 1993 1995 1997 1999 2001 2003<br />
Source: FPA (unpublished report)<br />
Year<br />
Production<br />
Sales
280<br />
<strong>Study</strong> <strong>and</strong> <strong>analysis</strong> <strong>of</strong> <strong>feeds</strong> <strong>and</strong> <strong>fertilizers</strong> <strong>for</strong> <strong>sustainable</strong> aquaculture development<br />
companies advertise their products through sponsorship <strong>of</strong> related activities <strong>and</strong><br />
distribution <strong>of</strong> promotional items (ADB, 2002).<br />
Several importers are also distributors, giving them an advantage in terms <strong>of</strong> direct<br />
access to retailers. At the wholesale level, some distributors are authorized dealers<br />
themselves <strong>and</strong> sell directly to plantations <strong>and</strong>/or farmers in areas where local dealers<br />
may be absent. In some instances, traders access cooperatives to distribute <strong>fertilizers</strong><br />
to their farmer-members. The geographical isolation <strong>of</strong> most Philippine isl<strong>and</strong>s adds<br />
to the marketing <strong>and</strong> distribution costs (ADB, 2002). Organic <strong>fertilizers</strong>, on the other<br />
h<strong>and</strong>, are usually sold in the area where they are produced.<br />
2.1.2 Availability <strong>of</strong> <strong>feeds</strong>tuffs <strong>and</strong> their use in aquaculture<br />
Most <strong>of</strong> the high quality feed ingredients are imported, though ef<strong>for</strong>ts are being made<br />
to partially or fully replace these with locally produced materials. There are many<br />
locally available raw materials that are either used or have potential as ingredients<br />
<strong>for</strong> aqua<strong>feeds</strong> (Table 10). The major <strong>feeds</strong>tuffs used are fishmeal, rice bran, soybean<br />
meal, copra meal, wheat flour, coconut oil, soybean oil <strong>and</strong> fish oil. Rice, corn <strong>and</strong><br />
copra meal are produced locally, while soybean meal <strong>and</strong> wheat by-products are<br />
imported. Fishmeal is either imported or locally sourced. Import <strong>and</strong> export figures <strong>of</strong><br />
agricultural products <strong>and</strong> by-products used by the animal feed industry are shown in<br />
Tables 11 <strong>and</strong> 12.<br />
To foster efficiency <strong>and</strong> global competitiveness, individual farmers as well as farmer<br />
associations or cooperatives are eligible <strong>for</strong> exemption from value-added tax on all types<br />
<strong>of</strong> agricultural products including feed ingredients like fishmeal, wheat, <strong>and</strong> soybeans.<br />
To be eligible, the imported products must be exclusively consumed by the enterprise<br />
<strong>and</strong> may not be sold. Eligibility <strong>for</strong> the certificate <strong>of</strong> exemption is determined <strong>and</strong><br />
approved by the Department <strong>of</strong> Agriculture (DA). Exporters from MFN are charged<br />
a 1 percent tariff <strong>for</strong> fishmeal, starch residues, <strong>and</strong> shrimp <strong>feeds</strong>; 3 percent <strong>for</strong> rice<br />
bran, wheat <strong>and</strong> soya; <strong>and</strong> 10 percent <strong>for</strong> copra, corn bran <strong>and</strong> corn germ. ASEAN<br />
member countries are exempted from paying tariff duties (CEPT - Common Effective<br />
Preferential Tariff <strong>for</strong> ASEAN countries) except <strong>for</strong> the export <strong>of</strong> some products<br />
such as rice bran (3 percent), corn bran (5 percent), corn germ (5 percent), <strong>and</strong> copra<br />
(3 percent) (Philippine Tariff Commission, 2004).<br />
Fishmeal<br />
The country is heavily dependent on imported fishmeal especially from the United<br />
States <strong>of</strong> America, Peru <strong>and</strong> Chile. Imports decreased from 84 546 tonnes in 2001 to<br />
44 567 tonnes in 2003. Most <strong>of</strong> the local fishmeal is obtained from Mindanao <strong>and</strong> is<br />
preferred by feedmills because <strong>of</strong> the lower cost.<br />
Agricultural by-products<br />
The availability <strong>and</strong> use <strong>of</strong> domestic agricultural by-products <strong>for</strong> animal feed is<br />
increasing. This is due to increased agricultural output, particularly <strong>of</strong> rice <strong>and</strong> corn<br />
(Table 13). However, seasonal supply <strong>and</strong> price fluctuations are substantial. After<br />
rice, corn is the second most important agricultural product in the Philippines. About<br />
43 percent <strong>of</strong> the world copra production is produced in the Philippines. Copra meal<br />
<strong>and</strong> oil are used in aqua<strong>feeds</strong>.<br />
Livestock<br />
By-products <strong>of</strong> slaughtered livestock <strong>and</strong> poultry dressing such as blood meal, poultry<br />
by-product meal <strong>and</strong> feather meal are potential components <strong>for</strong> animal <strong>feeds</strong>. Meat<br />
<strong>and</strong> bone meal is already used in the <strong>for</strong>mulation <strong>of</strong> some commercial aqua<strong>feeds</strong>.<br />
Slaughtered livestock <strong>and</strong> poultry (Table 14) registered a positive average growth per<br />
year from 2000-2004, except <strong>for</strong> cattle <strong>and</strong> goats.
Analysis <strong>of</strong> <strong>feeds</strong> <strong>and</strong> <strong>fertilizers</strong> <strong>for</strong> <strong>sustainable</strong> aquaculture development in the Philippines 281<br />
TABLE 10<br />
Available <strong>and</strong> potential aquaculture feed ingredients in the Philippines<br />
Ingredients <strong>and</strong> recommended<br />
inclusion levels<br />
Animal by-products<br />
Fishmeal<br />
Carnivorous fish: 50%; omnivorous/<br />
herbivorous fish: 25%; penaeid shrimps:<br />
25%<br />
Description<br />
A high quality protein <strong>feeds</strong>tuff; excellent source <strong>of</strong> amino acids;<br />
high ash content; rich in water soluble vitamins but low in fat soluble<br />
vitamins. High cost is limiting its use <strong>and</strong> local fishmeal is <strong>of</strong> low quality.<br />
Blood meal:
282<br />
Live food<br />
No st<strong>and</strong>ard <strong>for</strong>mula; varies with species,<br />
density <strong>and</strong> larval stage<br />
<strong>Study</strong> <strong>and</strong> <strong>analysis</strong> <strong>of</strong> <strong>feeds</strong> <strong>and</strong> <strong>fertilizers</strong> <strong>for</strong> <strong>sustainable</strong> aquaculture development<br />
TABLE 10 CONTINUED<br />
Available <strong>and</strong> potential aquaculture feed ingredients in the Philippines<br />
Several live <strong>feeds</strong> (phytoplankton <strong>and</strong> zooplankton) are cultured <strong>and</strong><br />
used in Philippines <strong>and</strong> include Chlorella, rotifers, Daphnia, Moina,<br />
copepods <strong>and</strong> Artemia (imported).<br />
Leaf <strong>and</strong> leaf meal<br />
Cassava leave Potential source <strong>of</strong> low cost plant protein, high lysine content but low<br />
in methionine; can supplement cereals in fish diets that are deficient in<br />
lysine. Good per<strong>for</strong>mance by milkfish at inclusion <strong>of</strong> 13%.<br />
Leucaena leaf meal (ipil-ipil)<br />
5–10% only <strong>for</strong> herbivorous <strong>and</strong><br />
omnivorous species<br />
Processed dried leaves <strong>of</strong> tropical legume; fresh leaves contain<br />
mimosine, a toxic glycoside, which can be reduced <strong>and</strong> removed<br />
through soaking, sun-drying <strong>and</strong> heat treatment; good quality protein<br />
(29%); Nile tilapia <strong>and</strong> tiger prawn respond better to soaked than<br />
unsoaked leaves.<br />
Oil<br />
Fish oil: 3–6% Crude fish oil is obtained from manufacture <strong>of</strong> fishmeal.<br />
Beef tallow: 5–10% An energy source with high levels <strong>of</strong> saturated fatty acids (48.2%) <strong>and</strong><br />
unsaturated fatty acids (46.6%); cholesterol content is 1 000 mg/kg.<br />
Incorporated into milkfish diets.<br />
Coconut oil Milkfish per<strong>for</strong>mance improved with equal amounts <strong>of</strong> coconut oil (5%)<br />
<strong>and</strong> fish oil (5%).<br />
Soybean oil Combination <strong>of</strong> fish oil <strong>and</strong> soybean oil at 1:1 ratio is best <strong>for</strong> milkfish<br />
<strong>and</strong> seabass; practical diets <strong>for</strong> tiger shrimp may contain 2.5% soybean<br />
oil <strong>and</strong> 2.5% fish oil <strong>for</strong> good per<strong>for</strong>mance in grow-out systems.<br />
Source: Devendra (1985); Sumagaysay <strong>and</strong> Borlongan (1995); Hertrampf <strong>and</strong> Piedad-Pascual (2000); Eusebio, Coloso <strong>and</strong> Mamauag<br />
(2004)<br />
TABLE 11<br />
Volume <strong>of</strong> imported agricultural products used by the animal feed industry, 2004<br />
Commodity description Quantity (tonnes)<br />
Flours, meals <strong>and</strong> pellets <strong>of</strong> fish, unfit <strong>for</strong> human consumption 44 125<br />
Flour, meals <strong>and</strong> pellets <strong>of</strong> crustaceans, unfit <strong>for</strong> human consumption 1 215<br />
Flour, meal <strong>and</strong> pellet <strong>of</strong> meal, meat <strong>of</strong>fal, unfit <strong>for</strong> human consumption 11 281<br />
Wheat used as feed 198 581<br />
Wheat, corn, rye, rice <strong>and</strong> other cereal flours 15 488<br />
Groats (hulled grain) <strong>and</strong> meal <strong>of</strong> maize <strong>and</strong> other cereals 192<br />
Tapioca <strong>and</strong> substitutes prepared from starch 1 193<br />
Bran <strong>and</strong> other residues from maize, rice <strong>and</strong> wheat 47 190<br />
Oil cake <strong>and</strong> other solid residues (except dregs1 ), pellet <strong>for</strong>m 1 213 827<br />
Soybean 284 139<br />
Sunflower, sesame, rape/colza, mustard, copra, palm <strong>and</strong> kernels, linseed, other oil<br />
seeds <strong>and</strong> oleaginous fruits<br />
49 840<br />
Flour <strong>and</strong> meal <strong>of</strong> soybeans, non-/partially-/wholly defatted 2 149<br />
Flour <strong>and</strong> meal <strong>of</strong> oil seed/oleaginous fruits 37<br />
Residues <strong>of</strong> starch manufacture <strong>and</strong> similar residues 61 785<br />
Wheat, maize, potato, manioc (cassava), <strong>and</strong> other starches 108 654<br />
Wheat gluten; casein <strong>and</strong> casein derivatives <strong>and</strong> the casein derivatives; protein<br />
isolates<br />
5 330<br />
Dextrin, soluble or roasted starch; esterified or etherified starches; other modified<br />
starches<br />
24 139<br />
Cod liver oil, fats <strong>and</strong> oils <strong>of</strong> fish other than liver oils 170<br />
Lard, poultry <strong>and</strong> pig fat; pig fat free <strong>of</strong> lean meat; animal tallow 23 318<br />
Other fats <strong>of</strong> bovine animals, sheep <strong>and</strong> goats, raw/rendered; lard-/oleo-strearin, lard<br />
tallow oils; animal oils <strong>and</strong> fats <strong>and</strong> their fractions, refined or not<br />
9 498<br />
Soybean oil <strong>and</strong> its fractions, crude <strong>and</strong> refined 14 481<br />
Active natural <strong>and</strong> inactive yeasts, other single-cell microorganisms 4 699<br />
Bagasse <strong>and</strong> other waste <strong>of</strong> sugar manufacturing 21<br />
Brewing <strong>and</strong> distilling dregs <strong>and</strong> wastes 506<br />
Brine shrimp eggs 7<br />
Prawn <strong>feeds</strong> 34 890<br />
Feed additives 19 822<br />
Feed supplements 1 984<br />
Other preparation used <strong>for</strong> animal food 3 365<br />
1 Product <strong>of</strong> processing, precipitate
Analysis <strong>of</strong> <strong>feeds</strong> <strong>and</strong> <strong>fertilizers</strong> <strong>for</strong> <strong>sustainable</strong> aquaculture development in the Philippines 283<br />
TABLE 12<br />
Volume <strong>of</strong> exports <strong>of</strong> agricultural products, 2004<br />
Commodity Description Quantity (tonnes)<br />
Flours, meals <strong>and</strong> pellets <strong>of</strong> fish, unfit <strong>for</strong> human consumption 267<br />
Rice, semi- or wholly-milled 983<br />
Maize seed (not including sweet corn), un-milled 137<br />
Flour <strong>of</strong> wheat, enriched or not 1 785<br />
Rice flour, other cereal flour, flour <strong>and</strong> meal <strong>of</strong> potatoes 82<br />
Tapioca <strong>and</strong> substitutes, prepared from starch 112<br />
Flour, meal <strong>and</strong> powder <strong>of</strong> dried leguminous vegetables 0.02<br />
Meal <strong>and</strong> powder <strong>of</strong> cassava, vam, sago pith <strong>and</strong> other roots <strong>and</strong> tubers 44<br />
Flour, meal <strong>and</strong> powder <strong>of</strong> coconut 816<br />
Maize, cassava, <strong>and</strong> other starches 13<br />
Wheat used as feed 63<br />
Wheat gluten 502<br />
Desiccated coconut 105 829<br />
Copra 38<br />
Soybean 0.15<br />
Cotton, sesame seeds 616<br />
Oilcake <strong>and</strong> other solid residues from extraction <strong>of</strong> oil from coconut/copra 364 245<br />
Oilcake <strong>and</strong> meal <strong>of</strong> other solid residues (except dregs), ground or pelleted 566<br />
Corn cobs after removal <strong>of</strong> grain; corn stalks <strong>and</strong> leaves, hydrolyzed 4 168<br />
Waste fruit (peel <strong>and</strong> cores) <strong>and</strong> fruit pomace (pulpy residue) 6 682<br />
Other vegetable residues <strong>and</strong> by-products, vegetables materials <strong>and</strong> wastes 552<br />
Bran, <strong>and</strong> other residues <strong>of</strong> maize, rice, other cereals 1 649<br />
Tobacco refuse 2 268<br />
Bagasse <strong>and</strong> other waste <strong>of</strong> sugar manufacturing 710<br />
Brewing <strong>and</strong> distilling dregs <strong>and</strong> waste 6<br />
Shark liver oil <strong>and</strong> fats; oils <strong>of</strong> marine mammals, <strong>and</strong> their fractions 34<br />
Lard; other pig <strong>and</strong> poultry fat; animal tallow 22<br />
Soybean oil <strong>and</strong> its fractions, refined 7 049<br />
Coconut (copra) oil, crude, refined <strong>and</strong> its fractions 959 400<br />
Preparations <strong>for</strong> making complete/supplementary <strong>feeds</strong> (premixes) 1 393<br />
Prawn <strong>feeds</strong> 138<br />
Feed additives 0.66<br />
Other preparation used <strong>for</strong> animal food 4 572<br />
The available agricultural by-product<br />
resources <strong>for</strong> use in aqua<strong>feeds</strong> in 2004 <strong>and</strong><br />
a <strong>for</strong>ecast <strong>of</strong> requirements <strong>for</strong> 2014 are<br />
presented in Table 15. The <strong>for</strong>ecasts were<br />
estimated from current production rate<br />
increases <strong>and</strong> the average percent by-product.<br />
The data suggest that the Philippines have<br />
adequate resources <strong>of</strong> energy-rich <strong>feeds</strong>tuffs<br />
to cope with the future expansion <strong>of</strong> the<br />
sector.<br />
TABLE 14<br />
Livestock <strong>and</strong> poultry production<br />
Number <strong>of</strong> heads<br />
Animal<br />
2002 2003 2004<br />
TABLE 13<br />
Major crop production in the Philippines (tonnes)<br />
% annual average<br />
Crop 1999 2004 growth over 5 year<br />
period (1999-2004)<br />
Rice 11 786 625 14 496 784 4.25<br />
Corn 4 584 593 5 413 386 3.66<br />
Soybean NA 974 0.72<br />
Coconut 11 589 010 14 336 618 4.42<br />
Sugar cane 23 777 828 25 579 214 1.77<br />
Cassava 1 890 315 1 640 520 -2.74<br />
NA: data not available<br />
Source: BAS (unpublished report; 2006)<br />
Production<br />
(tonnes) (2004)<br />
% annual average<br />
growth over 5 year<br />
period (1999-2004)<br />
Carabao 281 189 277 138 280 960 40 626 5.0<br />
Cattle 660 136 649 079 595 717 78 068 -3.3<br />
Horse 2 974 4 822 11 284 1 571 54.2<br />
Swine 8 522 092 8 944 878 9 118 437 502 841 4.9<br />
Goat 97 599 89 872 87 813 1 197 -2.5<br />
Chicken 228 145 975 186 747 121 221 743 933 255 119 7.1<br />
Source: BAS (unpublished report)
284<br />
<strong>Study</strong> <strong>and</strong> <strong>analysis</strong> <strong>of</strong> <strong>feeds</strong> <strong>and</strong> <strong>fertilizers</strong> <strong>for</strong> <strong>sustainable</strong> aquaculture development<br />
TABLE 15<br />
Available feed resources (raw materials <strong>and</strong> by-products) in the Philippines in 2004 <strong>and</strong> <strong>for</strong>ecasts <strong>of</strong> byproduct<br />
availability in 2014 (tonnes)<br />
Feedstuffs<br />
Raw material<br />
(2004)<br />
By-product<br />
(%)*<br />
By-product<br />
(2004)<br />
Growth <strong>of</strong> raw<br />
material (%/year)<br />
By-product<br />
(2014)*<br />
Common <strong>feeds</strong>tuffs<br />
Rice bran 14 496 784 10 1 449 678 4.2e 2 058 543<br />
Corn bran 5 413 386 21 1 136 811 3.7e 1 557 431<br />
Corn starch 5 413 386 69 3 735 236 3.7 5 117 274<br />
Cassava flour 1 677 564 62 1 040 090 3.7e 1 424 923<br />
Total (energy sources) 27 001 120 7 361 815 10 158 171<br />
Coconut oil 14 366 184 10 1 436 618 4.4e 2,068,730<br />
Soybean oil 974 19 185 0.7 e 198<br />
Total (oils) 14 367 158 1 436 803 2 112 027<br />
Copra meal/cake 14 366 184 4.9 703 943 4.4 1 013 678<br />
Soybean meal 974 82 799 0.7 855<br />
Shrimp head meal 17 958a 40 7 183 -0.8 6 609<br />
Meat <strong>and</strong> bone meal 624 303b 39 243 478 2.3f 299 478<br />
Fishmeal (local)<br />
Potential <strong>feeds</strong>tuffs<br />
no record <strong>of</strong> local production<br />
Poultry by-product meal 255 119c 18 45 921 7.1g 78 526<br />
Feather meal 255 119c 9 22 961 7.1g 39 263<br />
Blood meal 624 303b 7.5 46 823 2.3f 57 592<br />
Leucaena leaf meal 2 907d 19.8 576 11.8h 1 255<br />
Cassava leaves 1 677 564 12 201 308 -2.7 146 955<br />
*Amount <strong>of</strong> raw material x % by-product<br />
a b Assuming that 50% <strong>of</strong> shrimp production (35 916 tonnes) is processed, shrimp production growth from 1998-2004; Total weight<br />
<strong>of</strong> slaughtered livestock (cattle, carabao, horse, hog, goat) in abbatoirs; c Weight <strong>of</strong> slaughtered chicken in poultry processing<br />
plants; d Log production in 2003 (Philippine Forestry Statistics, FMB-DENR); e Based on increase crop production, 1994-2004; f Based<br />
on the increase number <strong>of</strong> slaughtered livestock (carabao, cattle, swine, goat) in abbatoirs, 1994-2004; g Based on the increase<br />
number <strong>of</strong> slaughtered chicken in poultry processing plants, 1994-2004; hBased on log production from 1999-2003 (Philippine<br />
Forestry Statistics, FMB-DENR), no available data yet <strong>for</strong> 2004<br />
Source: (<strong>for</strong> estimates <strong>of</strong> % by-products <strong>of</strong> raw materials): Blair (1990) (leucaena leaves); Devendra (1985) (cassava leaves);<br />
Hertrampf <strong>and</strong> Piedad-Pascual (2000) (other <strong>feeds</strong>tuffs)<br />
2.1.3 Nutritional value <strong>of</strong> <strong>feeds</strong>tuffs<br />
The choice <strong>of</strong> ingredients <strong>for</strong> feed <strong>for</strong>mulation depends on their nutrient content,<br />
digestibility, presence or absence <strong>of</strong> anti-nutritional factors, availability <strong>and</strong> price.<br />
The proximate composition <strong>of</strong> some feed ingredients is shown in Table 16. Feedstuffs<br />
containing protein with a good amino acid pr<strong>of</strong>ile are usually expensive <strong>and</strong> their<br />
use is constrained by price. The bio-availability <strong>and</strong> digestibility <strong>of</strong> nutrients present<br />
in <strong>feeds</strong>tuffs vary between species <strong>and</strong> influences the level <strong>of</strong> inclusion in feed<br />
<strong>for</strong>mulations. The digestibility <strong>of</strong> various <strong>feeds</strong>tuffs by Philippine aquaculture species<br />
are listed in Table 17. Fishmeal <strong>and</strong> soybean meal digestibility in milkfish varies with<br />
salinity (Ferraris et al., 1986).<br />
2.1.4 Nutrient requirements<br />
Tables 18, 19, <strong>and</strong> 20 list some <strong>of</strong> the known nutrient, vitamin, <strong>and</strong> mineral requirements<br />
<strong>of</strong> fish <strong>and</strong> crustaceans cultured in the Philippines. These data are used as a guide by<br />
commercial <strong>and</strong> non-commercial feed manufacturers in <strong>for</strong>mulating <strong>feeds</strong>.<br />
2.1.5 Commonly used <strong>feeds</strong>tuffs<br />
Omnivorous fish. Milkfish larvae in hatcheries are fed flaked microbound diets<br />
in combination with Brachionus (zooplankton) <strong>and</strong> copepod (Acartia <strong>and</strong><br />
Pseudodiaptomus) nauplii. In extensive grow-out systems, milkfish are only fed on<br />
commercial <strong>feeds</strong> or on single, energy rich ingredients such as rice bran, corn bran <strong>and</strong><br />
/ or biscuit <strong>and</strong> noodle factory rejects during the last month <strong>of</strong> culture.<br />
Tilapia broodstock, larvae <strong>and</strong> fry are fed on rice bran or a combination <strong>of</strong> rice bran<br />
<strong>and</strong> fishmeal. Locally available <strong>feeds</strong>tuffs such as rice bran, wheat pollard, copra meal,
Analysis <strong>of</strong> <strong>feeds</strong> <strong>and</strong> <strong>fertilizers</strong> <strong>for</strong> <strong>sustainable</strong> aquaculture development in the Philippines 285<br />
TABLE 16<br />
Proximate composition (percent dry matter) <strong>of</strong> selected feed ingredients available in the Philippines<br />
Feed ingredients <strong>of</strong> animal origin<br />
Moisture Crude protein Crude lipid Crude fibre NFE** Ash<br />
Fishmeal (local) 10.3 64.1 6.5 0.8 8.5 20.1<br />
Fishmeal, Chilean 8.4 70.1 8.5 0.5 4.1 16.8<br />
Fishmeal, Danish 9.5 73.9 9.4 0.3 2.4 14.0<br />
Fishmeal, Peruvian 7.7 68.1 8.0 1.1 5.9 17.0<br />
Fishmeal, tuna 9.4 65.4 8.0 0.8 8.8 17.0<br />
Fishmeal, white 7.2 69.0 7.6 0.6 4.8 18.0<br />
Meat soluble 4.2 76.5 1.2 0.2 10.3 11.8<br />
Poultry feather meal 4.8 70.9 17.7 0.6 8.3 2.5<br />
Prawn head meal 6.5 51.2 5.2 13.3 5.3 25.0<br />
Shrimp meal, Acetes sp. 8.2 68.6 3.9 3.6 7.6 16.3<br />
Squid meal 6.9 78.5 5.5 1.3 6.7 8.0<br />
Squid meal, scrap 5.5 74.1 7.1 0.9 8.1 9.8<br />
Blood meal 6.3 87.7 3.0 0.4 3.3 5.6<br />
Meat <strong>and</strong> bone meal 5.6 46.8 9.6 2.0 7.5 34.1<br />
Feed ingredients <strong>of</strong> plant origin<br />
Corn germ meal 4.5 47.4 8.5 6.4 36.9 0.8<br />
Corn gluten meal 8.0 60.6 7.0 3.4 27.8 1.2<br />
Leucaena leaf meal, giant 7.8 25.1 6.8 10.6 44.0 13.5<br />
Leucaena leaf meal, native 10.3 29.3 8.8 11.5 43.5 6.9<br />
Copra meal 7.9 22.0 6.7 17.3 44.3 9.7<br />
Corn meal 8.4 7.8 4.7 2.6 83.1 1.8<br />
Corn starch 11.9 0.4 0.2 1.1 98.2 0.1<br />
Flour, bread 12.1 12.9 1.2 0.3 84.9 0.7<br />
Flour, whole wheat 11.3 15.3 1.7 0.8 81.1 1.1<br />
Germ, wheat 6.0 27.8 4.3 3.4 59.6 4.9<br />
Gluten, corn 7.3 62.6 7.7 2.2 25.9 1.6<br />
Gluten, wheat 8.9 80.7 1.4 0.4 16.4 1.1<br />
Rice bran 9.2 13.3 14.1 8.5 53.4 10.7<br />
Rice bran, tiki-tiki 10.7 18.0 2.0 8.0 62.4 9.6<br />
Rice hull 7.0 3.3 2.0 32.4 41.6 20.7<br />
Soybean meal, full fat 5.6 35.8 19.8 4.9 33.9 5.6<br />
Soybean meal, defatted 8.4 43.6 1.5 5.5 41.7 7.7<br />
Soy protein concentrate 5.7 56.9 1.0 5.1 28.7 8.3<br />
Wheat flour 13.2 10.9 1.1 0.6 86.9 0.5<br />
Wheat, pollard 9.5 15.4 4.5 10.3 64.0 5.8<br />
Feed ingredients <strong>of</strong> other sources<br />
Casein 7.2 89.7 0.1 0.3 8.9 1.0<br />
Crab meal 4.2 37.9 4.1 10.7 8.9 38.4<br />
Gelatin 7.9 94.4 0 0.1 5.1 0.4<br />
Frog meal 7.6 62.5 1.7 1.2 4.7 29.9<br />
Mussel meal, green 5.9 64.6 8.6 3.0 12.5 11.8<br />
Oyster meal 4.4 54.6 9.4 4.0 20.1 11.9<br />
Scallop meal 7.3 65.2 10.9 1.4 8.8 13.7<br />
Snail meal, kuhol 4.0 52.1 1.8 2.1 15.7 28.3<br />
Yeast, Brewers 7.2 49.4 1.6 2.4 34.5 12.1<br />
Yeast, C<strong>and</strong>ida 8.3 55.2 0.8 1.7 35.1 7.4<br />
Natural food<br />
Acartia sp. 7.8 71.2 8.3 5.4 9.9 5.2<br />
Artemia 8.0 55.5 6.8 11.3 15.0 11.4<br />
Azolla 8.0 27.2 3.4 12.9 36.5 20.0<br />
Brachionus sp. 8.1 51.9 10.4 3.5 15.3 18.9<br />
Chaetoceros calcitrans 7.6 24.4 7.1 2.5 26.7 39.3<br />
Chlorella, marine 10.1 35.1 4.2 5.6 27.7 27.4<br />
Isochrysis galbana 10.4 33.6 18.1 4.4 23.0 20.9<br />
Moina macrocopa 8.5 57.8 7.6 8.4 17.2 9.0<br />
Sargassum 10.4 9.0 0.8 9.6 36.4 34.2<br />
Skeletonema sp. 10.4 24.7 2.6 0.7 20.2 51.8<br />
Spirulina 8.0 55.7 2.8 0.6 28.1 11.8
286<br />
TABLE 16 CONTINUED<br />
<strong>Study</strong> <strong>and</strong> <strong>analysis</strong> <strong>of</strong> <strong>feeds</strong> <strong>and</strong> <strong>fertilizers</strong> <strong>for</strong> <strong>sustainable</strong> aquaculture development<br />
Natural food<br />
Tetraselmis sp. 5.5 49.1 10.7 2.1 19.0 19.1<br />
Digman 9.8 20.6 3.3 16.4 35.9 23.8<br />
Enteromorpha (lumot) 15.2 13.8 1.9 9.3 36.9 38.1<br />
Gracilaria sp. 7.0 10.2 0.4 5.8 44.8 38.8<br />
Kappaphycus sp. 6.1 5.4 0.8 6.1 57.3 30.4<br />
** Nitrogen-free extract<br />
Source: Catacutan (2002a); Eusebio, Coloso <strong>and</strong> Mamauag (2004); Millamena et al. (2000); Centralized Analytical<br />
Laboratory, SEAFDEC<br />
bread <strong>and</strong> biscuit rejects <strong>and</strong> commercial poultry <strong>feeds</strong> are sometimes provided as<br />
supplemental <strong>feeds</strong>. Commercial <strong>feeds</strong> are only used in intensive tank culture, earthen<br />
ponds or floating cages. Commercial <strong>feeds</strong> <strong>for</strong> milkfish <strong>and</strong> tilapia contain high levels <strong>of</strong><br />
plant material, such as rice bran, soybean meal <strong>and</strong> low levels <strong>of</strong> fishmeal (see Table 21).<br />
Catfish are also omnivorous but have a higher protein dem<strong>and</strong> <strong>and</strong> they fed on decaying<br />
organic matter supplemented with kitchen waste, blanched chicken entrails <strong>and</strong> rice<br />
bran. Catfish cultured in net pens are fed a commercially <strong>for</strong>mulated feed.<br />
Carnivorous fish. Raw fish <strong>and</strong> chopped shrimp (Acetes sp.) is generally fed to<br />
carnivorous species such as grouper <strong>and</strong> red snapper in cages or pens. An alternative<br />
feeding strategy employed in brackish-water pond culture <strong>of</strong> grouper is to use tilapia<br />
fry as live food, together with chopped trash fish. To decrease the dependence on<br />
trash fish, <strong>for</strong>mulated <strong>feeds</strong> have now also been developed <strong>for</strong> carnivorous marine<br />
species.<br />
Herbivorous fish <strong>and</strong> plankton feeders. Herbivorous species like rabbitfish are<br />
grown in brackish-water ponds <strong>and</strong> fed on filamentous algae such as Enteromorpha.<br />
Crustaceans. Shrimps cultured in extensive systems feed mostly on detritus, diatoms,<br />
Cyanobacteria <strong>and</strong> green algae. In semi-intensive systems shrimp are given commercial<br />
<strong>feeds</strong> (Table 21).<br />
Mudcrabs. Raw fish <strong>and</strong> freshly ground mussel meat are typical <strong>feeds</strong> <strong>for</strong> mud crab<br />
in ponds or pens installed in tidal flats. If available, Acetes, green filamentous algae,<br />
animal hides <strong>and</strong> entrails <strong>and</strong> snails are also given to mud crabs. A mud crab diet has<br />
been developed but has not yet been commercialized. The <strong>for</strong>mulation contains high<br />
levels <strong>of</strong> fishmeal <strong>and</strong> brown mussel meat (Table 21).<br />
2.2 Feeding strategies <strong>and</strong> pond management<br />
2.2.1 Milkfish<br />
Pond culture. Culture practices <strong>for</strong> milkfish in brackish-water ponds range from<br />
extensive, modified extensive, semi-intensive to intensive. Most milkfish farmers use<br />
extensive <strong>and</strong> modified extensive farming practices. The practices differ with respect<br />
to stocking density, feeding strategy <strong>and</strong> water management (Table 22 <strong>and</strong> 23). Under<br />
extensive conditions, ponds are prepared to produce adequate quantities <strong>of</strong> natural food.<br />
Chicken manure is applied at 1–2 tonnes/ha, 16-20-0 at 50 kg/ha <strong>and</strong> 46-0-0 at 15 kg/<br />
ha. To maintain natural food productivity throughout the production cycle, inorganic<br />
<strong>fertilizers</strong> are applied after water exchanges that occur every 15 days at equal or half <strong>of</strong><br />
the application rates applied <strong>for</strong> pond preparation. Lab-lab (bacterial/algal floc) <strong>and</strong><br />
plankton are the two preferred natural <strong>feeds</strong>.<br />
Feed is only provided in the last month <strong>of</strong> the cycle when natural food cannot<br />
sustain fish growth. Fertilization alone can only support fish biomass <strong>of</strong> around<br />
600 kg/ha (Sumagaysay, Marquez <strong>and</strong> Chiu-Chern, 1991). A small number <strong>of</strong> fish<br />
farmers practice the ‘kitchen pond method’, which entails growing <strong>and</strong> transferring<br />
<strong>of</strong> natural food from a small pond (kitchen pond) to rearing ponds. Polyculture<br />
<strong>of</strong> milkfish with shrimp is also practised in extensive systems, with or without<br />
supplemental feeding.
Analysis <strong>of</strong> <strong>feeds</strong> <strong>and</strong> <strong>fertilizers</strong> <strong>for</strong> <strong>sustainable</strong> aquaculture development in the Philippines 287<br />
Under semi-intensive conditions,<br />
ponds are prepared <strong>and</strong> fertilized as<br />
above. Feeding with commercial <strong>feeds</strong><br />
commences one month after stocking.<br />
Water exchange is more frequent <strong>and</strong><br />
<strong>for</strong> which a pump is normally required.<br />
Aeration is employed when biomass<br />
reaches 1 tonne/ha. Milkfish in ponds<br />
was reportedly to effectively use only<br />
about 12 percent <strong>of</strong> the feed provided<br />
(Luckstädt, 2003). Rice bran may<br />
there<strong>for</strong>e not directly contribute to fish<br />
growth but plays an important role in<br />
natural food production.<br />
Marine pen <strong>and</strong> cage culture. The<br />
stocking density <strong>of</strong> milkfish in pens is<br />
between 5–20 fish/m 2 . For floating <strong>and</strong><br />
stationary cages, total biomass is between<br />
10–30 fish/m 3 . In <strong>of</strong>fshore cages, stocking<br />
density is increased to 35–100 fish/m 3<br />
<strong>and</strong> fish are given commercial <strong>feeds</strong>. The<br />
average FCR in pens <strong>and</strong> cages is 2.5:1<br />
<strong>and</strong> this needs further improvement.<br />
Pen culture <strong>of</strong> milkfish is also practiced<br />
in lakes, particularly in Laguna de Bay<br />
where some 12 000 ha are used <strong>for</strong> pen<br />
culture (Santiago, 2001; Filart, 2005).<br />
The feeding scheme <strong>for</strong> grow-out<br />
culture <strong>of</strong> milkfish in shown in Figure 5.<br />
With the high dem<strong>and</strong> <strong>for</strong> milkfish fry,<br />
hatcheries have been established all over<br />
the country <strong>and</strong> feeding protocols are<br />
well established (Borlongan, Marte <strong>and</strong><br />
Nocillado, 2000).<br />
2.2.2 Tilapia<br />
Tilapias in the Philippines are reared in<br />
cages, tanks <strong>and</strong> ponds under mono- or<br />
polyculture conditions with other fish.<br />
Culture techniques may be extensive,<br />
semi-intensive or intensive <strong>and</strong> these<br />
differences are summarized in Table 23.<br />
Cage culture. Tilapia cage culture is<br />
TABLE 17<br />
Apparent protein digestibility coefficients (APDC) <strong>of</strong><br />
<strong>feeds</strong>tuffs by Philippine aquaculture species<br />
Species Feedstuffs<br />
APDC<br />
(%)<br />
Milkfish Fishmeal 45–81*<br />
Soybean meal, defatted 45–94*<br />
Tiger shrimp Fishmeal 61<br />
Soybean meal, defatted 93<br />
Squid meal 96<br />
Shrimp meal 95<br />
Shrimp head meal 89<br />
Meat <strong>and</strong> bone meal 74<br />
Yeast, C<strong>and</strong>ida sp. 93<br />
Copra meal 75<br />
Carp White fishmeal, mechanically extracted 95<br />
Soybean meal, solvent extracted 81–96<br />
Grouper Fishmeal, Chilean 98<br />
Fishmeal, white 99<br />
Fishmeal, tuna 76<br />
Shrimp meal, Acetes sp. 95<br />
Squid meal 94<br />
Soy protein 86<br />
Meat soluble 98<br />
Meat <strong>and</strong> bone meal, Philippines 84<br />
Meat <strong>and</strong> bone meal, Australia 99<br />
Poultry feather meal 81<br />
Blood meal 15<br />
Rice bran 43<br />
Wheat flour 83<br />
Cowpea meal, white 94<br />
Lupin seed meal 97<br />
Corn gluten meal 99<br />
Corn germ meal 83<br />
Leucaena leaf meal 79<br />
Mud crab Fishmeal, Peruvian 95<br />
Squid meal 98<br />
Shrimp meal, Acetes sp. 95<br />
Meat <strong>and</strong> bone meal 95<br />
Copra meal 94<br />
Bread flour 95<br />
Rice bran 94<br />
Corn meal 96<br />
Soybean meal, defatted 96<br />
* Tested at different salinities (Ferraris et al., 1986)<br />
Source: Milkfish - Ferraris et al. (1986); tiger shrimp – Catacutan (1997);<br />
carp – NRC (1977); grouper – Eusebio, Coloso <strong>and</strong> Mamauag (2004);<br />
mudcrab – Catacutan, Eusebio <strong>and</strong> Teshima (2003)<br />
well established in Luzon <strong>and</strong> Mindanao. The proliferation <strong>of</strong> fish cages in most<br />
lakes has severely depleted natural food resources <strong>and</strong> has <strong>for</strong>ced farmers to rely on<br />
commercial pellets. Sinking or floating commercial pellets are used as feed <strong>and</strong> fish are<br />
fed to satiation two to three times a day. FCRs vary widely (1.8–3:1) <strong>and</strong> are affected<br />
by water quality. Feeds are either broadcast or applied on feeding trays. Aeration is also<br />
employed in lakes regardless <strong>of</strong> biomass or fish size.<br />
Pond culture. The management <strong>of</strong> tilapia in ponds is similar to milkfish. Lab-lab<br />
<strong>and</strong> plankton are grown in extensive <strong>and</strong> semi-intensive systems. In addition, sacks <strong>of</strong><br />
fertilizer are suspended in the water column (Aldon, 1998). Chicken manure or hog<br />
manure is applied at 500–1 000 kg/ha per week, while inorganic <strong>fertilizers</strong>, 16-20-0 or
288<br />
<strong>Study</strong> <strong>and</strong> <strong>analysis</strong> <strong>of</strong> <strong>feeds</strong> <strong>and</strong> <strong>fertilizers</strong> <strong>for</strong> <strong>sustainable</strong> aquaculture development<br />
FIGURE 5<br />
FIGURE 5<br />
Feed management ���� ���������� protocols ��������� ��� <strong>for</strong> �������� milkfish �������� grow-out �� ��������� in different ������� systems<br />
Commercial feed; 3-5% BW; Continuous feeding; Automatic feeder<br />
Commercial feed; 2-4% BW; 3x feeding/day;<br />
Automatic or dem<strong>and</strong> feeder or h<strong>and</strong> feeding<br />
Natural food Commercial feed; 3-4% BW; 2x feeding/day; H<strong>and</strong> feeding<br />
Natural food<br />
Natural food<br />
0 1 2 3 4<br />
Culture Month<br />
Single feed ingredients<br />
2-3% BW<br />
2x feeding/day<br />
������ ���� ��� �����<br />
��������� �����<br />
�������������� �����<br />
�������� ��������� �����<br />
��������� �����<br />
TABLE 18<br />
Nutritional requirements <strong>of</strong> some species cultured in the Philippines<br />
Species Crude protein (%) Crude lipid (%) Carbohydrate (%) Digestible energy (kcal/kg)<br />
Milkfish 30–401 /24 (pond) 2 7–1011 2514 2 500–3 50017 Nile tilapia 28–303 6–1012 2515 2 500–4 30018 Tiger shrimp 404 8–1213 2016 2 850–3 70019 White shrimp 28–325 - - -<br />
Mud crab 32–406 - - -<br />
Common carp 31–387 - - -<br />
Grouper 40–508 - - -<br />
Asian seabass 439 -<br />
Red snapper 4410 - - -<br />
Species Essential fatty acid (%) Lecithin (%) Cholesterol (%)<br />
Milkfish 1–1.5 n-3 PUFA20 - -<br />
Nile tilapia 0.5 18:2n-6 PUFA21 - -<br />
Tiger shrimp 2.6 n-3 PUFA22 1-225 126
Analysis <strong>of</strong> <strong>feeds</strong> <strong>and</strong> <strong>fertilizers</strong> <strong>for</strong> <strong>sustainable</strong> aquaculture development in the Philippines 289<br />
TABLE 19<br />
Vitamin requirements <strong>of</strong> some important species cultured in the Philippines (values in mg/kg<br />
diet unless otherwise indicated)<br />
Vitamins Tilapia Tiger shrimp Common carp Seabass North African catfish<br />
Thiamine 60<br />
Rib<strong>of</strong>lavin 25 7–14<br />
Pyridoxine 5–6<br />
Cobalamin 0.2<br />
Pantothenic acid 75 or 101–139 30–50<br />
Nicotonicacid 40 28<br />
Biotin 2.0–2.4 1<br />
Inositol 400 440<br />
Choline 600 4000<br />
Folic acid 10<br />
Ascorbic acid 200 700 0.1–0.7 g ASA/100 g<br />
<strong>for</strong> wound healing<br />
Vitamin A 5 000 IU 10 000 IU<br />
Vitamin E 50–100 100 1 000 IU<br />
Vitamin D 0.1<br />
Vitamin K 5<br />
Source: Erazo-Pagador (2001); Millamena (2002); Shiau <strong>and</strong> Chin (1998); Shiau <strong>and</strong> Hsu (1998)<br />
consumers. The introduction<br />
<strong>of</strong> the North African catfish,<br />
Clarias gariepinus, in the early<br />
1990’s, has helped to revive the<br />
catfish culture industry. Catfish<br />
are cultured in freshwater<br />
ponds or in cages (Surtida <strong>and</strong><br />
Buendia, 2000). A <strong>for</strong>mulated<br />
feed <strong>for</strong> catfish grow-out is<br />
available (Table 21). Smaller<br />
catfish farms use ponds <strong>of</strong><br />
around 1 000 m 2 at a stocking<br />
TABLE 20<br />
Mineral requirements <strong>of</strong> some species cultured in the Philippines<br />
Minerals Nile tilapia Tiger shrimp Common carp Milkfish<br />
Ca 1:1 (Ca:P)<br />
P 0.8–-1.0% 0.6–-0.7% 0.85<br />
Mg 0.05–-0.07% 0.04–-0.05%<br />
Cu 3–-4 ug/g<br />
Fe 150 ug/g<br />
Mn 12 ug/g 13 ug/g<br />
Zn 10 ug/g 15–-30 ug/g<br />
Source: Borlongan <strong>and</strong> Satoh (2001); Watanabe, Satoh <strong>and</strong> Takeuchi (1988); Bautista<br />
<strong>and</strong> Baticados, (1990); Millamena (2002)<br />
density <strong>of</strong> 5–6/m 2 <strong>and</strong> use the water from the ponds to grow vegetables. In these<br />
systems, swine pellets are fed twice daily at 1–3 percent <strong>of</strong> body weight per day. Semiintensive<br />
catfish farmers use ponds <strong>of</strong> up to 5000m 2 , stock their ponds at 10/m 2 <strong>and</strong><br />
feed the fish on trash fish, processed chicken entrails or swine pellets <strong>and</strong> change water<br />
twice weekly.<br />
2.2.4 Grouper<br />
Grouper culture in the Philippines is still dependent on the use <strong>of</strong> fry <strong>and</strong> juveniles<br />
caught from the wild or produced from the hatchery. Fish are reared either in ponds or<br />
in cages (Baliao et al., 1998; Baliao et al., 2000). Detailed feeding <strong>and</strong> water management<br />
protocols <strong>for</strong> larval <strong>and</strong> early juvenile grouper are described by Duray, Estudillo <strong>and</strong><br />
Alpasan (1997).<br />
Pond culture. Pond preparation procedures <strong>for</strong> growing natural food (lab-lab <strong>and</strong><br />
plankton) are similar to milkfish culture. Adult tilapia are stocked in the ponds at<br />
5 000–10 000 fish/ha to breed <strong>and</strong> the fry <strong>and</strong> early juveniles serve as prey <strong>for</strong> the<br />
grouper. Juvenile grouper are stocked at 5 000 fish/ha, one month after the release <strong>of</strong><br />
the adult tilapia. Trash fish is also provided at 5 percent <strong>of</strong> biomass per day. If trash fish<br />
is the only feed then the ration is increased to 10 percent <strong>of</strong> biomass per day. Water is<br />
changed twice weekly. A <strong>for</strong>mulated feed <strong>for</strong> grouper is now available (Table 21).<br />
Cage culture. Net cages are installed in sheltered lagoons, coves, bays, behind an isl<strong>and</strong><br />
or in river mouths. For the nursery phase the fish are stocked at 10–20/m 3 . Feeds include<br />
mysids, shrimps or finely chopped trash fish at a ration <strong>of</strong> 10 percent body weight per
290<br />
<strong>Study</strong> <strong>and</strong> <strong>analysis</strong> <strong>of</strong> <strong>feeds</strong> <strong>and</strong> <strong>fertilizers</strong> <strong>for</strong> <strong>sustainable</strong> aquaculture development<br />
TABLE 21<br />
Practical diet <strong>for</strong>mulation <strong>for</strong> milkfish, tilapia, waliking catfish, grouper, mud crab <strong>and</strong> tiger<br />
shrimp (g/kg as fed basis)<br />
Ingredient composition Milkfish1 Tilapia2 Catfish3 Grouper4 Mud crab5 Shrimp6 Fishmeal (local) 182.5 200 - -<br />
Chilean/Peruvian fishmeal 110 - - 200 250 250<br />
Meat <strong>and</strong> bone meal 200<br />
Brown mussel meat - - - 250<br />
Blood meal 80<br />
Squid meal - - - 10 -<br />
Shrimp meal (Acetes sp.) - - - 100 - 150<br />
Soybean meal 308 250 300 60 - 250<br />
Copra meal - 100 -<br />
Rice bran 492 60 310 70 125 69.5<br />
Corn bran - - - 100<br />
Cassava flour - 364.2 - -<br />
Bread flour 50 - 90 - 130<br />
Wheat flour - - - 150 170<br />
Seaweed (Gracilaria sp.) - - - 50 50<br />
Cod liver oil 20 - - 60 25 25<br />
Soybean oil 20 - 50 25 25<br />
Vitamin mix - - - 40 - 20<br />
Mineral mix - - 10 30 - 10<br />
Vitamin-mineral mix - 43.3 10 -<br />
Dicalcium phosphate - - 30 - 20<br />
Ethoxyquin - - - 5 0.5<br />
Proximate composition (% dry matter)<br />
Crude protein 26.7 28.1 34.2 44.0 40.1 41.7<br />
Crude lipid 10.9 3.8 9.5 11.5 11.9 8.8<br />
Crude fibre 8.4 3.6 5.8 1.8 1.4 5.9<br />
Nitrogen-free extract 45.1 54.6 36.3 25.8 38 29.2<br />
Ash 8.9 9.9 14.2 16.9 8.6 14.4<br />
Cost (US $/tonnes)** 375 559 402 1 300 781 806<br />
* Cost <strong>of</strong> feed calculated based on average retail cost <strong>of</strong> ingredients<br />
Source: 1Sumagaysay (1998); 2Santiago, Aldaba <strong>and</strong> Reyes (1987); 3Coniza, Catacutan <strong>and</strong> Tan-Fermin (2001);<br />
4 5 6 Millamena et al. (2001) in Alava (2002); Triño, Millamena <strong>and</strong> Keenan (2001); Millamena <strong>and</strong> Triño (1994)<br />
day, fed twice a day. A 50 Watt inc<strong>and</strong>escent bulb is sometimes installed above the<br />
cages to attract live food (mysids, copepods <strong>and</strong> other juvenile fish). In grow-out cages,<br />
chopped trash fish is provided twice daily at 5 percent <strong>of</strong> body weight per day.<br />
2.2.5 Mudcrab<br />
Mudcrab are farmed in bamboo fenced brackish-water ponds. Net enclosures are<br />
installed along the inner side <strong>of</strong> the pond dykes to prevent escape. Prior to stocking,<br />
the pond is prepared by liming, application <strong>of</strong> 21-0-0 <strong>and</strong> organic <strong>and</strong> inorganic<br />
<strong>fertilizers</strong>. In polyculture with milkfish the ponds are modified to suit the needs <strong>of</strong> the<br />
two species. Peripheral <strong>and</strong> central canals are constructed where crabs can seek refuge<br />
in deeper water when temperature rises above 32 o C, while lab-lab as food <strong>for</strong> milkfish<br />
can still grow in the shallow parts <strong>of</strong> the pond. Mudcrab are also reared in mangrove<br />
areas or on tidal flats in net pens (1–2 cm mesh size). Stocking density less than 5 000<br />
crabs/ha is recommended to attain bigger size <strong>and</strong> higher survival.<br />
Crabs are fed on fresh or frozen trash fish or in combination with brown mussel<br />
meat (75 percent brown mussel <strong>and</strong> 25 percent trash fish). Animal hides or entrails,<br />
snails, Acetes <strong>and</strong> green filamentous algae are also used as feed. Crabs are fed at<br />
10 percent <strong>of</strong> body weight when carapace length is less than 6 cm <strong>and</strong> at 5 percent<br />
when carapace length is 6 cm or more. A dry <strong>for</strong>mulated feed (Table 21) is also used at<br />
5 percent <strong>of</strong> biomass daily when carapace length is < 6 cm <strong>and</strong> at 2 percent <strong>of</strong> biomass<br />
when carapace length is > 6 cm (Alava, 2002).
Analysis <strong>of</strong> <strong>feeds</strong> <strong>and</strong> <strong>fertilizers</strong> <strong>for</strong> <strong>sustainable</strong> aquaculture development in the Philippines 291<br />
TABLE 22<br />
Different milkfish culture systems in brackish water<br />
Culture System<br />
Extensive polyculture<br />
Optimum stocking<br />
density/ha<br />
Yield<br />
(kg/ha/crop)<br />
Food supply<br />
management<br />
Water management<br />
Milkfish<br />
3 000–3 500<br />
600–800 Natural food + Tidal<br />
Shrimp<br />
Extensive monoculture<br />
5 000–10 000<br />
120–240 supplemental feed<br />
Traditional 1 000–2 000 500–600 Natural food + Tidal; water depth,<br />
freshwater<br />
filamentous algae<br />
60 cm or less<br />
Improved 2 000–3 000 700–1 000 Lab-lab (high Water depth, 50 cm<br />
salinity)<br />
or less<br />
Modified extensive monoculture<br />
Modified<br />
4 000 1 000 Mainly natural food Tidal; water depth<br />
stright-run<br />
+ supplemental feed 80 cm<br />
Modular<br />
Semi-intensive polyculture<br />
3 000 2 000 Natural food<br />
(lab-lab <strong>and</strong><br />
plankton)<br />
Tidal<br />
Milkfish<br />
10 000<br />
2 250 Natural food + Tidal:<br />
Shrimp<br />
Semi-intensive monoculture<br />
35 000<br />
840 supplemental or<br />
commercial feed<br />
supplemental<br />
pumping<br />
8 000–15 000 1 500–3 500 Natural food + Tidal: supplemental<br />
supplemental or pumping; water<br />
commercial feed depth, 50-100cm<br />
Intensive<br />
≥20 000 ≥4 000 Commercial feed Pumping with<br />
aeration; water<br />
depth, 12 cm<br />
Source: Bagarinao (1997); Sumagaysay-Chavoso (2003); author’s survey (2005)<br />
TABLE 23<br />
Tilapia culture systems in the Philippines<br />
Parameters Extensive Semi-intensive Intensive<br />
Ponds Cages Ponds Cages Ponds Tanks<br />
Culture period 4–5 months 4–6 months 4–6 months 4–5 months 4–5 months 4–5 months<br />
Size at stocking 10–20 g 10–20 g 10–20 g 10–20 g 10–20 g 10–20 g<br />
Stocking density 3 000–5 000/ha 15–25/m3 10 000–50 000/ha 50–250/m3 50 000–100 000/ha 100–200/m3 Water<br />
management<br />
50% water<br />
change after 2<br />
months<br />
Fertilization 2 weeks<br />
after pond<br />
preparation<br />
Feeding None Natural food +<br />
supplemental feed<br />
None Frequent water<br />
change<br />
None Applied in first two<br />
months<br />
Natural food +<br />
supplemental feed<br />
None 5–10% daily Flow-through<br />
None Only at stocking None<br />
Commercial<br />
feed<br />
Commercial<br />
feed<br />
2.2.6 Tiger shrimp<br />
Broodstock conditioning. Broodstock shrimp are fed with a variety <strong>of</strong> live, fresh or<br />
frozen marine worms, mussel meat, squid, clam meat <strong>and</strong> other mollusc meat. Brown<br />
mussel meat <strong>and</strong> squid are chopped into small pieces, while marine worms are fed<br />
alive. A <strong>for</strong>mulated feed is also used but is supplemented with fresh wet <strong>feeds</strong> to ensure<br />
nutrient balance (Alava, 2002). Broodstock tanks are operated on a flow through basis<br />
or water is changed daily.<br />
Larval rearing. The protocols described by Bautista, et al., (1991) are generally<br />
used <strong>for</strong> larval <strong>and</strong> PL rearing up to PL 5. From PL 6 onwards, postlarvae are gradually<br />
introduced to minced mussel meat, raw fish <strong>and</strong> shrimp meal or crumbled artificial<br />
feed. Shrimp larval diets are readily available <strong>and</strong> are easy to use (Alava, 2002).<br />
Commercial<br />
feed<br />
Use <strong>of</strong> aerator No No Optional Optional Yes Yes<br />
Size at harvest 100–200 g 250–300 g 150–200 g 150–250 g 250 g >300 g<br />
Survival rate 80–100% 70–90% 60–85% 60% 60% 70–85%<br />
Yield 300–800 kg/ha 2.7–7.0 kg/m3 1 000–3 000 kg/ha 4–40 kg/m3 7 000–15 000 kg/ha 20–50 kg/m3 Source: Guerrero (2002); Aldon (1998); Corpuz-Uy (pers. com.); author’s survey (2005)
292<br />
<strong>Study</strong> <strong>and</strong> <strong>analysis</strong> <strong>of</strong> <strong>feeds</strong> <strong>and</strong> <strong>fertilizers</strong> <strong>for</strong> <strong>sustainable</strong> aquaculture development<br />
Grow-out culture in ponds. Extensive shrimp farming at densities <strong>of</strong> 30 000-50 000<br />
shrimp/ha can attain production <strong>of</strong> 0.8-1.1 tonnes/ha/crop (Bordeos, 2004). Pond<br />
preparation involves sun drying <strong>of</strong> pond bottom, excavation <strong>of</strong> peripheral canals,<br />
scraping <strong>of</strong> black soil, liming, <strong>and</strong> application <strong>of</strong> tea seed powder as pesticide. Algal<br />
growth is stimulated by seeding green water from the river or adjacent ponds <strong>and</strong><br />
by fertilization. These techniques were developed to prevent occurrence <strong>of</strong> diseases<br />
<strong>and</strong> to remove organic matter from the pond bottom. Feeding with commercial feed<br />
commences 5 days after stocking until harvest. Stocking density in semi-intensive <strong>and</strong><br />
intensive systems is recommended not to exceed 250 000/ha <strong>for</strong> sustainability (Corre<br />
et al., 1999). Like in extensive system, farmers follow the feeding scheme suggested by<br />
feed manufacturers or developed their own.<br />
3. THE AQUACULTURE FEED INDUSTRY<br />
Fifteen years ago, pelleted animal <strong>feeds</strong> in the Philippines were rarely available <strong>and</strong><br />
used (Solalela, 2001). Today, approximately 80 percent <strong>of</strong> animal <strong>feeds</strong> are in pellet or<br />
crumble <strong>for</strong>m. Mash is used as a poultry feed <strong>and</strong> by cost conscious fish farmers. The<br />
animal feed industry (including aqua<strong>feeds</strong>) is now sophisticated <strong>and</strong> well established<br />
<strong>and</strong> all types <strong>of</strong> <strong>feeds</strong> are available, either produced locally or imported.<br />
3.1 Cost <strong>of</strong> raw materials <strong>and</strong> <strong>feeds</strong><br />
Raw material comprises approximately 85 percent <strong>of</strong> the feed production cost, hence<br />
is considered as the primary concern by feed manufacturers. The balance <strong>of</strong> 15 percent<br />
covers all other production costs including amortization (Solalela, 2001). The cost<br />
<strong>of</strong> feed ingredients varies widely depending on quality, source <strong>and</strong> time <strong>of</strong> purchase<br />
(Table 24). For various reasons the cost <strong>of</strong> animal <strong>feeds</strong> is higher in the Philippines than<br />
many other countries (Solalela, 2001). The country is highly dependent on imported<br />
fishmeal, corn <strong>and</strong> soybean meal <strong>and</strong> this is compounded by the poor quality <strong>of</strong> locally<br />
produced corn, fishmeal <strong>and</strong> rice bran. The supply <strong>of</strong> corn in the country is regulated<br />
<strong>and</strong> monitored by the NFA (AFSD-BAI, 2005).<br />
3.2 Available aqua<strong>feeds</strong><br />
Over 60 br<strong>and</strong>s <strong>of</strong> milkfish <strong>feeds</strong>, 65 tilapia <strong>feeds</strong> <strong>and</strong> 9 shrimp <strong>feeds</strong> where available on<br />
the market in December 2004. The cost <strong>of</strong> feed depends on the nutrient composition,<br />
quality, manufacturing process <strong>and</strong> competition between milling companies <strong>and</strong><br />
distributors. Average prices <strong>of</strong> the available aqua<strong>feeds</strong> are presented in Table 24.<br />
Generally, fish <strong>feeds</strong> are available in mash <strong>for</strong>m <strong>for</strong> fry (pre-starter), crumble (starter)<br />
<strong>for</strong> small juveniles <strong>and</strong> pellets (grower <strong>and</strong> finisher) <strong>for</strong> later stages. The protein content<br />
<strong>of</strong> the available commercial <strong>feeds</strong> <strong>for</strong> different species are: milkfish, 35–26 percent (fry<br />
to 500 g weight); tilapia, 31–23 percent (0.01 g fry to 1000 g); catfish, 34–29 percent<br />
(80 g); grouper, 48–42 percent (300 g); shrimp, 45–37 percent<br />
(15 g). All <strong>of</strong> the reputable manufacturers provide a guaranteed<br />
composition <strong>of</strong> their various feed <strong>and</strong> also provide farmers with a feeding guides <strong>for</strong><br />
each feed type. Three examples <strong>of</strong> feed composition <strong>and</strong> feeding schedules are provided<br />
in Tables 25 (a-f). These data exist <strong>for</strong> all species specific <strong>feeds</strong>. Specific <strong>for</strong>mulations<br />
are also available <strong>for</strong> different culture systems <strong>and</strong> conditions. The survey revealed<br />
that floating/extruded pellets are between 6–25 percent (average = 14 percent) more<br />
expensive than sinking pellets with similar nutrient composition.<br />
Feed companies are required to register with the Bureau <strong>of</strong> Animal Industry (BAI)<br />
<strong>and</strong> comply with feed st<strong>and</strong>ard regulations (Table 26). The government sets nutrient<br />
st<strong>and</strong>ards <strong>for</strong> different species according to feeding habits <strong>and</strong> life stages, though<br />
discrepancies between the st<strong>and</strong>ards <strong>and</strong> the nutrient specifications provided by<br />
manufacturers do sometimes exist.
Analysis <strong>of</strong> <strong>feeds</strong> <strong>and</strong> <strong>fertilizers</strong> <strong>for</strong> <strong>sustainable</strong> aquaculture development in the Philippines 293<br />
3.3 Marketing <strong>of</strong> aqua<strong>feeds</strong><br />
Aqua<strong>feeds</strong> (except in mash <strong>for</strong>m) are usually<br />
sold in st<strong>and</strong>ard 25-kg polypropylene bags.<br />
These are distributed <strong>and</strong> sold together with<br />
livestock <strong>and</strong> poultry <strong>feeds</strong> by agricultural<br />
supply stores. The marketing chain <strong>for</strong><br />
aqua<strong>feeds</strong> is well organized <strong>and</strong> begins with<br />
the manufacturer who distributes products<br />
either to a wholesaler or to an authorized<br />
area distributor. Wholesalers sell to dealers<br />
who have their own set <strong>of</strong> retailers <strong>for</strong><br />
final distribution to end-users. Authorized<br />
dealers sell directly to farmers. Some major<br />
feed companies have their own distribution<br />
warehouses in key areas. In such cases,<br />
the company deals directly with large<br />
customers. Feed manufacturers provide sales<br />
incentives to wholesalers <strong>and</strong>/or dealers<br />
depending on the volume <strong>of</strong> their total<br />
sales. Technical <strong>and</strong> sales agents provide<br />
technical services <strong>and</strong> promotional activities<br />
to boost feed sales. Promotions are done<br />
through sponsorship <strong>of</strong> community <strong>and</strong><br />
industry activities (e.g. exhibits, seminars),<br />
feed trials <strong>and</strong> distribution <strong>of</strong> promotional<br />
items (ADB, 2002 study).<br />
TABLE 24<br />
Approximate cost <strong>of</strong> selected ingredients <strong>and</strong> aqua<strong>feeds</strong><br />
Ingredient Cost (US$/tonnes)<br />
Fishmeal, Peruvian 855–1 000<br />
Fishmeal, local (sardine, tuna, various species) 236–536<br />
Prawn head meal 300<br />
Squid meal 11 212<br />
Soybean meal 345–527<br />
Copra meal/cake 58–236<br />
Rice bran 55–175<br />
Wheat (whole) 148–218<br />
Bread flour 444<br />
Corn starch 409<br />
Corn bran 58<br />
Soybean oil 727<br />
Cod liver oil 2 273<br />
Fish oil 509<br />
Crude coconut oil 600–618<br />
Used oil from fast foods 444<br />
Vitamins/minerals 2 182–8 335<br />
Dicalcium phosphate<br />
Species/feed type<br />
Milkfish<br />
509<br />
Mash 431–1051<br />
Starter crumble 417–464<br />
Starter pellet 407–445<br />
Grower/juvenile 379–465<br />
Finisher/adult<br />
Shrimp<br />
373–455<br />
Pre starter crumble 1 298<br />
Starter pellet 931–1 022<br />
Grower 895–967<br />
Finisher 876–931<br />
3.4 Status <strong>of</strong> commercial feedmills<br />
Capacity <strong>and</strong> production. The total rated Catfish<br />
capacity <strong>of</strong> all registered commercial<br />
animal feedmills is approximately 23 470<br />
tonnes per eight-hour shift, <strong>of</strong> which the 78<br />
Grouper<br />
aquafeed milling companies have a capacity<br />
<strong>of</strong> 10 451 tonnes per eight-hour shift<br />
(Table 27). Approximately 61.8 percent <strong>of</strong><br />
all registered manufacturers are small-scale<br />
producers with a rated capacity <strong>of</strong> less than<br />
25 tonnes per 8-hr shift, while 25.6 percent Tilapia<br />
are large-scale producers with a capacity <strong>of</strong><br />
50 tonnes or more per 8-hr shift. The largescale<br />
millers manufacture approximately<br />
80 percent <strong>of</strong> the total animal feed produced<br />
in the country. To improve efficiency <strong>and</strong> to Source: Feed distributors <strong>and</strong> manufacturers<br />
save costs feedmillers have <strong>for</strong>med several<br />
industry associations, <strong>of</strong> which the Philippine Association <strong>of</strong> Feedmillers, Inc. is at the<br />
<strong>for</strong>efront.<br />
Total animal feed production (including aqua<strong>feeds</strong>) in 2003 was 2.6 million tonnes,<br />
<strong>of</strong> which 8 percent (204 396 tonnes) comprised aqua<strong>feeds</strong> (Table 28). Shrimp feed<br />
production declined from 50 000 tonnes in the late 1980s to 11 472 tonnes in 2003.<br />
The growth <strong>of</strong> finfish aquaculture has contributed to the expansion <strong>of</strong> the aquafeed<br />
industry. Fish <strong>feeds</strong> now comprise between 94–96 percent <strong>of</strong> all aqua<strong>feeds</strong>. Aquafeed<br />
production increased by an average <strong>of</strong> 10 percent per annum from 1996-2003 (Solalela<br />
2001). The overall production capacity <strong>of</strong> aquaculture feedmills based on the 8-hr rated<br />
Starter 432<br />
Grower 407<br />
Finisher 400<br />
Fry mash 949<br />
Crumble 958<br />
Starter 912<br />
Grower 876<br />
Finisher 849<br />
Mash 469<br />
Starter crumble 458<br />
Starter pellet 451<br />
Grower/juvenile 429<br />
Finisher/adult 418
294<br />
<strong>Study</strong> <strong>and</strong> <strong>analysis</strong> <strong>of</strong> <strong>feeds</strong> <strong>and</strong> <strong>fertilizers</strong> <strong>for</strong> <strong>sustainable</strong> aquaculture development<br />
TABLE 25A<br />
Guaranteed <strong>analysis</strong> <strong>of</strong> several commercial milkfish <strong>feeds</strong><br />
Feed type Crude protein<br />
% (min)<br />
Crude lipid<br />
% (min)<br />
Crude fibre %<br />
(max)<br />
Ash % (max) Moisture<br />
% (max)<br />
B-MEG Bangus<br />
Fry mash 31 8 7 16 13<br />
Starter crumble 31 8 7 16 13<br />
Starter pellet 31 8 7 16 13<br />
Grower pellet 31 8 7 16 13<br />
Finisher pellet 29 8 7 16 13<br />
HP Premium Bangus Feeds<br />
Fry mash 32–35 7 4 12 12<br />
Starter crumble 30 7 4 12 12<br />
Starter pellet 30 7 4 12 12<br />
Juvenile 28 7 4 12 12<br />
Adult 26 7 4 12 12<br />
HP Regular Bangus Feeds<br />
Juvenile 27 6 5 11 12<br />
Adult 25 6 5 11 12<br />
TABLE 25B<br />
Recommended feeding schedules <strong>for</strong> milkfish provided by feed manufacturers<br />
Feed type Average body Feeding rate Growth rate Feeding frequency Feeding duration<br />
B-MEG Bangus<br />
weight (g) (% BW/day) (g/day)<br />
(x/day)<br />
(days)<br />
Fry mash 0.01–2.00 12.5–20.0 0.15±0.02 - -<br />
Starter crumble 2.1–25.0 7.2–10.0 0.77±0.12 - -<br />
Starter pellet 26.0–70.0 5.1–6.9 2.30±0.34 - -<br />
Grower pellet 71.0–170 3.5–4.8 2.90±0.58 - -<br />
Finisher pellet 171.0 <strong>and</strong> above 1.5–3.2 3.20±0.80 - -<br />
HP Premium <strong>and</strong> Regular Bangus Feed<br />
Fry mash fry - 15 8.5–10.0 - 5 30<br />
Starter crumble 15–30 5–7 - 4 20<br />
Starter pellet 30–100 4.0–4.5 - 4 45<br />
Juvenile 2.4a 100–200 3–4 - 3 30<br />
Juvenile 3.0a 200 –- 400 2.8–3.0 - 3 30<br />
Adult 2.4 & 3.0 400 –- 500 2.5–3 - 3 30<br />
aNumber refers to pellet diameter<br />
Source: San Miguel Foods, Inc (B-MEG); Hoc Po Feeds Corp (HP)<br />
TABLE 25C<br />
Guaranteed <strong>analysis</strong> <strong>of</strong> various commercial tilapia <strong>feeds</strong><br />
Feed type Crude protein<br />
% (min)<br />
B-MEG Tilapia<br />
Crude lipid<br />
% (min)<br />
Crude fibre<br />
% (max)<br />
Ash<br />
% (max)<br />
Moisture<br />
% (max)<br />
Fry mash 30 8 7 16 13<br />
Starter crumble 30 8 7 16 13<br />
Starter pellet 30 8 7 16 13<br />
Grower pellet 30 8 7 16 13<br />
Finisher pellet 28 8 7 16 13<br />
Vitarich<br />
Premium<br />
Fry mash >31 >4 4 8 8 8 4 4 6 6 4 4
Analysis <strong>of</strong> <strong>feeds</strong> <strong>and</strong> <strong>fertilizers</strong> <strong>for</strong> <strong>sustainable</strong> aquaculture development in the Philippines 295<br />
TABLE 25D<br />
Recommended feeding schedules <strong>for</strong> tilapia provided by feed manufacturers<br />
Feed type Average body<br />
weight (g)<br />
Feeding rate<br />
(% BW/day)<br />
Growth rate<br />
(g/day)<br />
Feeding duration<br />
(weeks)<br />
B-MEG Tilapia<br />
Fry mash 0.01–2.00 15–20 0.02±0.01 -<br />
Starter crumble 2–15 7–10 0.35±0.05 -<br />
Starter pellet 16–37 5.9–7.0 0.47±0.07 -<br />
Grower pellet 38–83 4.4–5.8 0.86±0.20 -<br />
Finisher pellet 91–1 000 1.5–4.1 1.8±0.40 -<br />
Vitarich<br />
Fry mash 3–15 6–13 - 1–3<br />
Fry crumble 2262 5–6 - 4–7<br />
Extru-edge aqua float juvenile a 62–130 3–5 - 7–10<br />
Extruded juvenile pellet 77–105 3–4 - 8–9<br />
Extruded adult pellet 130–250 2–3 - 10–14<br />
Extru-edge aqua float adult a 160–250 2.0–2.5 - 11–14<br />
Extruded adult pellet with molasses 16–250 2.0–2.5 - 11–14<br />
a Refers to extruded floating pellet<br />
Source: San Miguel Foods, Inc (B-MEG); Vitarich Corp. (Vitarich)<br />
TABLE 25E<br />
Guaranteed <strong>analysis</strong> <strong>of</strong> various commercial shrimp <strong>feeds</strong><br />
Feed type Crude protein<br />
% (min)<br />
Crude lipid<br />
% (min)<br />
Crude fibre<br />
% (max)<br />
Ash<br />
% (max)<br />
Moisture<br />
% (max)<br />
B-MEG CE 90<br />
Pre-starter/PL 38.5 4.0 2.5 13 10<br />
Starter 38.0 4.0 3.0 13 10<br />
Grower 37.0 4.0 3.0 14 10<br />
Finisher 37.0 3.5 4.0 15 10<br />
Tateh Shrimp Feed<br />
Pre-starter (mash) 45.0 8.0 4.0 16 12<br />
Pre-starter (crumble) 45.0 8.0 4.0 16 12<br />
Starter (pellet) 42.0 6.0 4.0 16 12<br />
Grower (pellet) 40.0 6.0 4.0 17 12<br />
Finisher (pellet) 38.0 6.0 4.0 17 12<br />
TABLE 25F<br />
Recommended feeding guide <strong>for</strong> shrimp provided by feed manufacturers<br />
Feed typ<br />
Average body<br />
weight (g)<br />
Feeding rate<br />
(% BW/day)<br />
Feed distribution per feeding (%) Tray allocation<br />
(%) a<br />
6 am 10 am 2 pm 6 pm 10 pm<br />
B-MEG CE-90<br />
PL/Pre-starter PL15-DOC14 b 30 - - 35 35 -<br />
Starter DOC15-DOC21 6.0–4.0 20 20 - 30 30 2.4 a<br />
Starter DOC22-DOC30 3.7–-3.4 20 15 15 30 20 2.7<br />
Starter 2.0–5.0 3.7–-3.4 20 15 15 30 20 2.7<br />
Grower 6.0–8.0 3.7–3.4 20 15 15 30 20 2.7<br />
Grower 9.0–12.0 3.2–3.0 20 15 15 30 20 3<br />
Grower/finisher 13.0–19.0 2.9–2.6 20 15 15 30 20 3.3<br />
Finisher 20.0–28.0 2.6–2.4 20 15 15 30 20 3.6<br />
Finisher 29.0–34.0 2.4–2.3 20 15 15 30 20 3.9<br />
Finisher 35.0–60.0’ 2.3–1.8 20 15 15 30 20 4.1–4.9<br />
Tateh Shrimp Feed<br />
Pre-starter (mash, crumble)
296<br />
<strong>Study</strong> <strong>and</strong> <strong>analysis</strong> <strong>of</strong> <strong>feeds</strong> <strong>and</strong> <strong>fertilizers</strong> <strong>for</strong> <strong>sustainable</strong> aquaculture development<br />
TABLE 26<br />
National nutrient st<strong>and</strong>ard <strong>for</strong> aquaculture <strong>feeds</strong><br />
Type <strong>of</strong> feed Crude protein<br />
% (min)<br />
Prawn<br />
Crude lipid<br />
% (min)<br />
Crude fibre<br />
% (max)<br />
Moisture<br />
% (max)<br />
Ash<br />
% (max)<br />
Pre-starter, pellet/crumble 38 4 4 12 16<br />
Starter, pellet/crumble 37 4 4 12 16<br />
Grower, pellet/crumble 35 4 4 12 17<br />
Finisher, pellet/crumble<br />
Omnivore fishes<br />
30 4 5 12 17<br />
Pre-start mash, pellet/crumble 35 4 4 12 15<br />
Starter mash, pellet/crumble 29 4 6 12 15<br />
Grower mash, pellet/crumble 27 4 9 12 16<br />
Finisher mash, pellet/crumble<br />
Carnivore fishes<br />
35 4 9 12 16<br />
Pre-start mash, pellet/crumble 45 4 4 12 15<br />
Starter mash, pellet/crumble 40 4 6 12 15<br />
Grower mash, pellet/crumble 35 4 9 12 16<br />
Finisher mash, pellet/crumble 30 4 9 12 16<br />
Source: Department <strong>of</strong> Agriculture (1996)<br />
TABLE 27<br />
Distribution <strong>of</strong> commercial feed millers in the<br />
Philippines <strong>and</strong> production capacity <strong>of</strong> feedmills in<br />
tonnes per 8-hour shift<br />
Region Total registered feed mills Registered aquafeed mills<br />
No.<br />
Total rated<br />
capacity<br />
No.<br />
Total rated<br />
capacity<br />
NCR 53 4 665 11 3 034<br />
I 9 1 496 3 885<br />
II 8 938 0 0<br />
III 115 8 051 28 4 247<br />
IV 93 4 037 15 1 271<br />
V 14 505 0 0<br />
VI 13 469 6 272<br />
VII 32 1 461 9 295<br />
VIII 3 110 0 0<br />
IX 6 96 0 0<br />
X 11 533 1 10<br />
XI 14 488 1 108<br />
XII 21 613 3 326<br />
XIII 3 8 1 3<br />
Total 395 23 470 78 10 451<br />
Source: AFSD-BAI (2005)<br />
capacity is 3.8 million tonnes/year.<br />
Given the estimated production <strong>of</strong><br />
204 396 tonnes <strong>of</strong> aquafeed in 2003<br />
suggests that only 5.4 percent <strong>of</strong><br />
the installed capacity is effectively<br />
used. Never the less, in recent<br />
years the aquafeed industry<br />
has improved enormously in<br />
manufacturing processes, quality<br />
control, feed <strong>for</strong>mulation <strong>and</strong> in<br />
keeping costs as low as possible.<br />
Distribution <strong>and</strong> storage<br />
capacity. The national distribution<br />
<strong>of</strong> feedmillers is presented in<br />
Table 27. Luzon (including<br />
NCR, Region III, Region IV)<br />
contributes 90.3 percent (3 444 505<br />
tonnes/year) to total animal feed<br />
production in the country. The<br />
dem<strong>and</strong> <strong>for</strong> compounded <strong>and</strong> or<br />
mixed animal <strong>feeds</strong> is regionally<br />
unequal <strong>and</strong> the concentration <strong>of</strong> feedmill capacity in Luzon has had negative impact<br />
on marketing, distribution <strong>and</strong> feed cost.<br />
Because <strong>of</strong> the seasonal nature <strong>of</strong> domestic raw material supply millers have found it<br />
more economical to channel the procurement <strong>of</strong> raw materials to dealers <strong>and</strong> thus, free<br />
themselves <strong>of</strong> maintaining large year-round storage facilities. However, the shortage<br />
<strong>and</strong> rising prices <strong>of</strong> raw materials in recent years has <strong>for</strong>ced the industry to exp<strong>and</strong> its<br />
storage facilities (AFSD-BAI, 2005). Some companies <strong>for</strong>ward buy in expectation <strong>of</strong><br />
low supply <strong>and</strong> high price. There seems to be no problem with the storage capacity to<br />
warehouse the finished products.<br />
3.5 Consumption <strong>of</strong> aqua<strong>feeds</strong><br />
Of the 204 396 tonnes <strong>of</strong> aquafeed produced, 144 356 tonnes were unspecified <strong>feeds</strong><br />
(AFSD-BAI, 2003) (see Table 30). Based on several assumptions, it was possible to<br />
calculate a breakdown <strong>of</strong> the consumption <strong>of</strong> domestically produced aqua<strong>feeds</strong> by
Analysis <strong>of</strong> <strong>feeds</strong> <strong>and</strong> <strong>fertilizers</strong> <strong>for</strong> <strong>sustainable</strong> aquaculture development in the Philippines 297<br />
species groups (Table 28).<br />
From these data it is clear<br />
that the aquafeed industry<br />
only provides a fraction <strong>of</strong> the<br />
total feed requirements <strong>of</strong> the<br />
aquaculture industry in the<br />
Philippines. The difference<br />
is made up by the use <strong>of</strong><br />
single ingredient <strong>feeds</strong> such<br />
as rice bran, trash fish, other<br />
farm-made <strong>feeds</strong> <strong>and</strong> imports<br />
(Table 12) <strong>of</strong> manufactured<br />
<strong>feeds</strong>.<br />
TABLE 28<br />
Consumption <strong>of</strong> domestically produced commercial aqua<strong>feeds</strong> by major<br />
species groups<br />
Feed<br />
Quantity<br />
(tonnes)<br />
3.6 Economics <strong>of</strong> feeding<br />
The cost <strong>of</strong> production varies<br />
with the level <strong>of</strong> intensification.<br />
The cost <strong>of</strong> production is lowest in extensive system (US$0.47/kg) <strong>and</strong> highest in<br />
intensive systems (US$0.84/kg) <strong>and</strong> this is related to high feed inputs <strong>and</strong> installation<br />
<strong>of</strong> life support systems (Table 29). Pr<strong>of</strong>its can still be made intensive milkfish culture<br />
as long as the higher production costs are compensated <strong>for</strong> by high yields <strong>and</strong> a high<br />
fish price. However, if the cost <strong>of</strong> fish is low then extensive systems, without feeding,<br />
are more pr<strong>of</strong>itable. This implies that farming practices may change periodically (e.g.<br />
extensive to semi-intensive, feeding to no feeding) to maximise income <strong>and</strong> pr<strong>of</strong>its<br />
depending on environmental factors (e.g., season, natural food production) <strong>and</strong> fish<br />
price (affected by supply <strong>and</strong> dem<strong>and</strong> <strong>and</strong> price <strong>of</strong> other commodities).<br />
4. PROBLEMS AND CONSTRAINTS<br />
The increasing cost <strong>of</strong> raw material is the main problem that impacts on aquaculture <strong>and</strong><br />
its associated feed industry. Because <strong>of</strong> the high cost <strong>of</strong> raw materials the Philippines is<br />
currently uncompetitive with respect to fish <strong>and</strong> shrimp production.<br />
Availability <strong>of</strong> feed ingredients. The perennial shortage <strong>of</strong> key raw materials, such as<br />
fishmeal <strong>and</strong> soybean meal is highly problematic to feed manufacturers <strong>and</strong> feedmills<br />
that are unable to cope with the problem are <strong>for</strong>ced to shutdown (AFSD-BAI, 2005).<br />
However, procurement is a greater problem <strong>for</strong> the smaller rather than the larger<br />
manufacturers in that they are better able to benefit from the National Food Authority<br />
procurement system, because <strong>of</strong> their bulk purchasing power. Clearly, there is a need<br />
<strong>for</strong> the smaller producers to cooperate such that they can also benefit from the NFA<br />
system.<br />
High cost <strong>of</strong> feed. Feed prices are highly dependent on availability <strong>of</strong> local ingredients<br />
(rice bran, copra) <strong>and</strong> the cost <strong>of</strong> imported materials (especially fishmeal). Depreciation<br />
<strong>of</strong> the Philippine peso against <strong>for</strong>eign currencies has increased the domestic cost <strong>of</strong><br />
imported ingredients. For example, the average cost <strong>of</strong> producing tilapia feed in 2003<br />
was US$236–309/tonne, <strong>of</strong> which 70–90 percent <strong>of</strong> the cost was attributed to imported<br />
feed ingredients such as fishmeal, wheat, soybean meal, vitamins <strong>and</strong> minerals. The<br />
price <strong>of</strong> local ingredients is also volatile because <strong>of</strong> the seasonal nature <strong>of</strong> supply.<br />
Low price <strong>of</strong> fish <strong>and</strong> a reduced dem<strong>and</strong> <strong>for</strong> feed. The price <strong>of</strong> fish is largely dictated<br />
by the price <strong>of</strong> other market commodities <strong>and</strong> not necessarily related to the cost <strong>of</strong><br />
production. Aquaculture products must compete with other meat <strong>and</strong> food. Intensive<br />
farmers are sometimes pressured to accept low prices due to large volume that have to<br />
be sold at harvest. If the pr<strong>of</strong>it margins are too low then farmers are discouraged to use<br />
feed <strong>and</strong> may revert to the more traditional culture methods. The effect <strong>of</strong> this is drop<br />
in the dem<strong>and</strong> <strong>for</strong> manufactured <strong>feeds</strong>.<br />
Actual or<br />
calculated<br />
Total aquafeed production 204 396 Actual<br />
Shrimp feed 11 472 Actual<br />
Catfish feed 1 685 Actual<br />
Tilapia feed 96 066 Calculated<br />
Total milkfish feed 95 173 Calculated<br />
Milkfish in cages <strong>and</strong> pens 54 543 Calculated<br />
Milkfish <strong>and</strong> other species in ponds (e.g. grouper) 40 630 Calculated<br />
Assumptions:<br />
Tilapia feed = 47% <strong>of</strong> total aqua<strong>feeds</strong> (ADB, 2002)<br />
Shrimp = 5.6% <strong>of</strong> total aquaculture feed<br />
Catfish = 0.8% <strong>of</strong> total aquaculture feed<br />
Total Milkfish (Total feed – Tilapia feed – Shrimp feed – Catfish feed) = 46.6%<br />
Milkfish in cages <strong>and</strong> pens (production in 2003 at FCR = 2.5:1)
298<br />
TABLE 29<br />
Comparison <strong>of</strong> production costs (US$) under different<br />
culture conditions<br />
Inputs<br />
Cost (US$/ha)<br />
Extensive<br />
Culture Systems<br />
Semi-intensive Intensive<br />
Fertilizer 185.84 83.83 3.36<br />
Feed - 1 134.00 3 402.00<br />
Other expenses 165.45 560.18 1 217.27<br />
Total<br />
Cost (US$/fish)<br />
351.30 1 788.01 4 622.64<br />
Fertilizer 0.07 0.01 -<br />
Feed - 0.14 0.17<br />
Other expenses 0.07 0.07 0.06<br />
Total<br />
Cost (US$/kg fish)<br />
0.14 0.22<br />
0.23<br />
Fertilizer 0.25 0.04 -<br />
Feed - 0.51 0.62<br />
Other expenses 0.22 0.25 0.22<br />
Total 0.47 0.80 0.84<br />
Stocking density (fish/ha): extensive, 2 500; semi-intensive, 8 000;<br />
intensive, 20 000<br />
Fertilizer includes chicken manure <strong>and</strong> inorganic <strong>fertilizers</strong> (21-0-0,<br />
46-0-0, 16-20-0)<br />
Cost <strong>of</strong> feed, US$0.38/lkg; assumed FCR: semi-intensive, 1.6, intensive,<br />
1.8<br />
Other expenses include cost <strong>of</strong> lime, fish seed/fry, labour, salaries,<br />
electricity, <strong>and</strong> diesel in semi-intensive <strong>and</strong> intensive systems<br />
US$1.00 = 55.00 Pesos<br />
<strong>Study</strong> <strong>and</strong> <strong>analysis</strong> <strong>of</strong> <strong>feeds</strong> <strong>and</strong> <strong>fertilizers</strong> <strong>for</strong> <strong>sustainable</strong> aquaculture development<br />
Delay or non-payment <strong>of</strong> feed purchases.<br />
Because <strong>of</strong> low pr<strong>of</strong>its farmers will <strong>of</strong>ten<br />
delay payment <strong>for</strong> feed or not pay at all.<br />
This has a cascading effect back to the<br />
manufacturer, which in turn may lead to<br />
higher feed prices or may result in the<br />
closure <strong>of</strong> feedmills.<br />
Underutilized feedmilling capacity.<br />
The animal feedmilling capacity in the<br />
Philippines is underutilized <strong>and</strong> yet many<br />
livestock <strong>and</strong> poultry feed manufacturers<br />
are switching to aquafeed production. This<br />
may lead to the demise <strong>of</strong> many small-scale<br />
manufacturers. The under-utilised capacity<br />
may be attributed to the price <strong>of</strong> feed,<br />
which <strong>for</strong>ces the farmers to use other <strong>feeds</strong><br />
such as trash fish <strong>and</strong> / or rice bran.<br />
Preparation <strong>of</strong> farm-made <strong>feeds</strong>. The<br />
use <strong>of</strong> farm-made <strong>feeds</strong> <strong>and</strong> single-feed<br />
ingredients is an alternative way by which<br />
to reduce feed cost. However, on-farm<br />
feed manufacturing has not developed<br />
substantially in most areas because <strong>of</strong> the<br />
high capital requirements <strong>and</strong> the high cost<br />
<strong>and</strong> erratic supply <strong>of</strong> raw materials. Small<br />
farmers cannot compete with large feedmillers in the purchase <strong>of</strong> raw materials when<br />
these are in short supply. Large millers may receive 20–30 percent discounts <strong>for</strong> bulk<br />
purchase <strong>of</strong> ingredients<br />
Nutritive value <strong>of</strong> <strong>feeds</strong>. The currently observed FCRs need to be reduced to<br />
improve income <strong>and</strong> pr<strong>of</strong>its.<br />
Distribution <strong>and</strong> use <strong>of</strong> inorganic fertilizer. Fertilizers are frequently used in<br />
pond preparation but are not routinely used during the production cycle. Adequate<br />
fertilization protocols must be promoted to maximize the benefits <strong>of</strong> natural food.<br />
The cost <strong>of</strong> fertilizer distribution is high due to transport <strong>and</strong> inefficient port h<strong>and</strong>ling<br />
facilities (Aristorenas, 2000). There are malpractices in fertilizer trading such as<br />
under-weighing <strong>and</strong> adulteration, which the Fertilizer <strong>and</strong> Pesticide Authority cannot<br />
continuously monitor due to lack <strong>of</strong> funding.<br />
Use <strong>of</strong> organic <strong>fertilizers</strong> <strong>and</strong> manure. Collection <strong>of</strong> manure from poultry <strong>and</strong><br />
livestock in small-scale farms is seldom feasible because the animals are not usually<br />
confined. The use <strong>of</strong> compost in ponds could reduce production costs, though farmers<br />
are unenthusiastic about using compost because <strong>of</strong> high labour input requirements.<br />
Other problems. The government does not have a national inventory <strong>of</strong> aquaculture<br />
systems <strong>and</strong> this precludes appropriate planning.<br />
The problems <strong>and</strong> constraints that face the sector in the Philippines are schematically<br />
summarized in Figure 6.<br />
5. RESOURCE AVAILABILITY AND THE EXPANSION OF THE AQUACULTURE<br />
INDUSTRY<br />
Aquaculture production increased at an average <strong>of</strong> 7.2 percent per year during the period<br />
1994 to 2004 with the highest growth registered in 2003-2004. Further expansion <strong>of</strong> the<br />
industry will depend on the availability <strong>of</strong> feed <strong>and</strong> fertilizer resources, allocation <strong>of</strong><br />
suitable areas <strong>for</strong> expansion <strong>and</strong> technological advances in feed manufacturing <strong>and</strong> life<br />
support systems. The future requirements <strong>for</strong> feed <strong>and</strong> fertilizer are presented below
Analysis <strong>of</strong> <strong>feeds</strong> <strong>and</strong> <strong>fertilizers</strong> <strong>for</strong> <strong>sustainable</strong> aquaculture development in the Philippines 299<br />
FIGURE 6<br />
FIGURE 6<br />
Problems <strong>and</strong> constraints <strong>of</strong> the aquaculture sector in the Philippines<br />
Problems <strong>and</strong> constraints <strong>of</strong> the aquaculture sector in the Philippines<br />
Shutdown <strong>of</strong><br />
feedmills<br />
Under utilization <strong>of</strong><br />
feedmilling capacity<br />
Suspend financing <strong>of</strong><br />
future crops<br />
Delayed payment to<br />
feed suppliers<br />
•<br />
•<br />
•<br />
Low price <strong>of</strong> fish due<br />
to competition with<br />
meat <strong>and</strong> poultry<br />
Lack <strong>of</strong> farmer’s<br />
capital<br />
Distance <strong>of</strong> farms<br />
Source: FPA (unpublished report)<br />
High cost / volatile prices<br />
<strong>of</strong> raw materials<br />
High cost <strong>of</strong> feed<br />
Low fish production<br />
Feedmills<br />
stock more<br />
supplies<br />
Reduced feed dem<strong>and</strong><br />
Inadequate storage<br />
facilities<br />
Additional rental <strong>and</strong><br />
transport cost<br />
Less / no<br />
feeding<br />
High cost <strong>of</strong><br />
imported ingredients<br />
Seasonal availability<br />
<strong>of</strong> local materials<br />
Use <strong>of</strong> farm-made <strong>feeds</strong><br />
• High capital requirements<br />
• Lack <strong>of</strong> equipment <strong>for</strong> smallscale<br />
farmers<br />
• Erratic supply <strong>of</strong> raw materials<br />
• Non-priority in the purchased <strong>of</strong><br />
raw materials<br />
Lack knowledge in preparation<br />
Slow acceptance<br />
<strong>of</strong> technology<br />
Nutritive value <strong>of</strong> feed<br />
High FCR<br />
Water pollution<br />
Adulteration <strong>of</strong> ingredients<br />
<strong>and</strong> are based on projected fish production <strong>and</strong> FCRs. Fertilizer requirements were<br />
predicted based on pond area <strong>and</strong> recommended application rates.<br />
5.1 Feed requirements<br />
The projected feed requirements are based on available commercial feed consumption<br />
data. The average increase in the rate <strong>of</strong> production <strong>of</strong> various species over the past<br />
four to ten years in different culture systems was used to predict fish production<br />
<strong>and</strong> consequently the feed requirement <strong>of</strong> the industry (Table 30). It is predicted that<br />
milkfish pond culture will show the highest dem<strong>and</strong>. Tilapia in ponds <strong>and</strong> cages will<br />
rank second, followed by milkfish in marine cages <strong>and</strong> pens, followed by tiger shrimp.<br />
Other species like catfish, grouper <strong>and</strong> mudcrab will eventually require substantial<br />
amounts <strong>of</strong> artificial <strong>feeds</strong> because <strong>of</strong> increasing production. Trash fish, as elsewhere<br />
in SE Asia, is becoming a limiting resource <strong>and</strong> every ef<strong>for</strong>t must be made to replace<br />
its use by artificial <strong>feeds</strong> in coming years. Assuming a linear increase in production <strong>of</strong><br />
all species, the total feed requirement in 2014 is projected to be in the range <strong>of</strong> 1.34<br />
million tonnes. This estimate could be the upper maximum as not all fish farmers will<br />
use manufactured <strong>feeds</strong> <strong>and</strong> FCRs will decrease.<br />
•<br />
•<br />
•<br />
•<br />
•<br />
•
300<br />
<strong>Study</strong> <strong>and</strong> <strong>analysis</strong> <strong>of</strong> <strong>feeds</strong> <strong>and</strong> <strong>fertilizers</strong> <strong>for</strong> <strong>sustainable</strong> aquaculture development<br />
TABLE 30<br />
Current aquafeed production <strong>and</strong> future requirements (tonnes)<br />
Species<br />
Average growth<br />
during 1994-2004<br />
(%/year)<br />
Aquaculture<br />
production<br />
2004 2014a Estimated feed<br />
production in 2003 b FCR<br />
Feed requirement<br />
in 2014 c<br />
Milkfish<br />
Brackish-water &<br />
freshwater pond 6.0 200 531 320 850 - 2.0<br />
641 699<br />
Brackish-water fish cage 6.0 4 056 6 490 - 2.0 12 979<br />
Marine fish cage 6.0 23 179 37 086 - 2.5 92 716<br />
Marine fish pen 6.0 14 173 22 677 - 2.5 56 692<br />
Sub-total<br />
Tilapia<br />
Brackish-water <strong>and</strong><br />
16 974 804 086<br />
freshwater pond 6.0 80 877 129 403 - 2.0 258 806<br />
Freshwater cage <strong>and</strong> pen 6.0 64 779 103 646 - 2.0 207 293<br />
Sub-total 29 908 466 099<br />
Catfish 13.4 1 930 4 516 1 685 2.3 10 387<br />
Grouper 5.5 170 264 - 2.3 606<br />
Tiger shrimp -0.8 35 916 33 043 11 472 1.8 59 477<br />
Unspecified feed 114 356<br />
Total 204 396 1 340 656<br />
a b Predicted based on average growth rate <strong>of</strong> all species per year from 1994-2004, except <strong>for</strong> shrimp (1998-2004); No available data<br />
<strong>for</strong> 2004; cProjected production x FCR<br />
To establish whether the raw material supply can meet the dem<strong>and</strong> <strong>of</strong> future aquafeed<br />
requirements an <strong>analysis</strong> was undertaken in which the requirements (Table 31) where<br />
juxtaposed with the projected available resources (Table 15). Energy sources like rice<br />
bran, corn bran <strong>and</strong> cornstarch are the most abundant <strong>feeds</strong>tuffs. If the requirement<br />
<strong>for</strong> energy sources in 2014 will amount to some 717 000 tonnes (Table 31) then the<br />
projected available energy sources (10 158 171 tonnes, Table 15) will be adequate to<br />
cater <strong>for</strong> the needs <strong>of</strong> aquaculture. Coconut oil is the next most available resource but<br />
its use in aqua<strong>feeds</strong> is minimal. The total coconut oil requirement is only 3.6 percent<br />
<strong>of</strong> the projected total amount available. Other sources <strong>of</strong> oils such as soybean <strong>and</strong> fish<br />
oil must be developed to supply the need <strong>for</strong> n-3 <strong>and</strong> n-6 fatty acids in combination<br />
with coconut oil. The availability <strong>of</strong> copra meal <strong>and</strong> cake is adequate <strong>for</strong> all animal<br />
feed requirements. This commodity is only used in tilapia <strong>feeds</strong> such that the total<br />
aquaculture requirement <strong>for</strong> this material is low (4.2 percent <strong>of</strong> the total animal feed<br />
requirement). Because <strong>of</strong> the abundance <strong>of</strong> copra meal there is a real <strong>and</strong> urgent need<br />
<strong>for</strong> research <strong>and</strong> development to increase its use in aqua<strong>feeds</strong>. Domestic production<br />
<strong>of</strong> meat <strong>and</strong> bone meal can satisfy the needs <strong>of</strong> aquaculture. However, because <strong>of</strong> the<br />
requirements <strong>for</strong> swine feed the total supply will not be able to meet the dem<strong>and</strong>s <strong>of</strong> the<br />
animal feed industry as a whole. Soybean meal, which is the second most commonly<br />
used ingredient in aqua<strong>feeds</strong> (36 percent <strong>of</strong> total feed inputs), must be partially replaced<br />
by other legumes. All crustacean meal products are imported <strong>and</strong> this will not change.<br />
Some locally abundant ingredients are still underutilized <strong>and</strong> these are poultry byproduct<br />
meal, feather meal <strong>and</strong> blood meal. These materials, if properly processed,<br />
could replace other <strong>feeds</strong>tuffs that are in short supply <strong>and</strong> would assure the availability<br />
<strong>of</strong> feed ingredients <strong>for</strong> the future expansion <strong>of</strong> the aquaculture industry.<br />
5.2 Fertilizer requirement<br />
Fertilizers are needed in extensive <strong>and</strong> semi-intensive pond culture to promote<br />
natural productivity. The requirement <strong>for</strong> fertilizer depends on fishpond area. Given<br />
that the expansion <strong>of</strong> aquaculture in brackish waters is now prohibited this variable<br />
will be assumed to remain stable <strong>for</strong> the next 10 years. The medium term Philippine<br />
Development Plan 2004-2010, however, has allocated new areas <strong>for</strong> agribusiness that<br />
provides an additional 11 390 ha <strong>for</strong> milkfish <strong>and</strong> tilapia culture (NEDA, 2004). At an
Analysis <strong>of</strong> <strong>feeds</strong> <strong>and</strong> <strong>fertilizers</strong> <strong>for</strong> <strong>sustainable</strong> aquaculture development in the Philippines 301<br />
TABLE 31<br />
Estimated future requirements <strong>of</strong> feed ingredients <strong>for</strong> aquafeed production in the Philippines (tonnes)<br />
Blood meal<br />
Shrimp meal/<br />
shrimp head meal<br />
Oils<br />
(fish/soybean/coconut)<br />
Copra meal/cake Soybean meal Fishmeal<br />
Energy sources<br />
(rice bran/corn bran/wheat flour)<br />
Species Feed requirement<br />
2003*<br />
Omnivore<br />
Milkfish 95 173 51 393 - 28 552 10 469 3 807 - -<br />
Tilapia 96 067 40 348 9 607 24 017 17 292 - - -<br />
Catfish 1 685 - - - - - - -<br />
Carnivore<br />
Grouper minimal - - - - - - -<br />
Crustaceans<br />
Tiger shrimp 11 472 2 294 - 2 868 2 868 574 1 721 -<br />
Total 204 397 94 036 9 607 55 437 30 629 4 381 1 721 -<br />
2014<br />
Omnivore<br />
Milkfish 804 086 434 207 - 241 226 88 449 32 163 - -<br />
Tilapia 466 099 195 762 46 610 116 525 83 898 - - -<br />
Catfish 10 387 4 155 3 116 234 519 - -<br />
Carnivore<br />
Grouper 606 133 - 36 121 36 61 121<br />
Crustaceans<br />
Tiger shrimp 59 477 11 895 - 14 869 14 869 2 974 8 921 -<br />
Total 1 340 656 646 152 46 610 375 773 187 572 35 693 8 982 121<br />
% <strong>of</strong> total feed requirement 48.2 3.5 28.0 14.0 2.7 0.7 < 0.1<br />
*No available data <strong>for</strong> 2004<br />
Total inclusion levels (%): Energy sources - milkfish, 54; tilapia, 42; catfish, 40; grouper, 22; tiger shrimp, 20; mud crab, 27; copra meal/cake - tilapia, 10; soybean meal - milkfish, 30; tilapia, 25; catfish, 30;<br />
grouper, 6; tiger shrimp, 25; mud crab, 11; fishmeal - milkfish, 11; tilapia, 18; catfish, 20; grouper, 20; tiger shrimp, 25; mud crab, 25; oils - milkfish, 4; catfish, 5; grouper, 6; tiger shrimp, 5; mud crab, 5; shrimp<br />
meals - grouper, 10; tiger shrimp 15; meat <strong>and</strong> bone meal <strong>and</strong> blood meal - grouper, 20 (Based on st<strong>and</strong>ard <strong>for</strong>mulations, in: Alava, 2002)
302<br />
<strong>Study</strong> <strong>and</strong> <strong>analysis</strong> <strong>of</strong> <strong>feeds</strong> <strong>and</strong> <strong>fertilizers</strong> <strong>for</strong> <strong>sustainable</strong> aquaculture development<br />
TABLE 32<br />
Estimated fertilizer requirement <strong>for</strong> extensive <strong>and</strong> semi-intensive brackish-water pond culture<br />
in the Philippines<br />
Region Fishpond area (ha) a Organic fertilizer<br />
requirement (tonnes) b<br />
Inorganic fertilizer requirement (tonnes) c<br />
16-20-0 18-46-0 46-0-0 21-0-0<br />
CAR -<br />
I 21 550 43 100 10 775 4 310 3 233 431<br />
II 100 200 50 20 15 2<br />
III 48 980 97 960 24 490 9 796 7 347 980<br />
NCR 2 900 5 800 1 450 580 435 58<br />
IV-A 5 850 11 700 2 925 1 170 878 117<br />
IV-B 7 690 15 380 3 845 1 538 1 154 154<br />
V 15 870 31 740 7 935 3 174 2 381 317<br />
VI 58 720 117 440 29 360 11 744 8 808 1 174<br />
VII 9 030 18 060 4 515 1 806 1 355 181<br />
VIII 2 340 4 680 1 1 70 468 351 47<br />
IX 25 010 50 020 12 505 5 002 3 752 500<br />
X 4 150 8 300 2 075 830 623 83<br />
XI 6 710 13 420 3 355 1 342 1 007 134<br />
XI 3 260 6 520 1 630 652 489 65<br />
XIII 5 830 11 660 2 915 1 166 875 117<br />
ARRM 1 470 2 940 735 294 221 29<br />
Total 219 460 489 998 109 730 43 892 32 919 4 389<br />
Total production/ import<br />
(2003/2004)<br />
52 388 734d 266 925 229 731 733 683 515 276<br />
% <strong>of</strong> total production/import 0.9e 41.1 19.1 4.5 0.9<br />
aAssuming no expansion in fishpond area; area <strong>for</strong> each region was determined by L<strong>and</strong>sat Image (NAMRIA, 2005)<br />
while total area is from Philippines Fisheries Statistics 2001-2003 (BAS, 2005a) <strong>and</strong> Philippines Fisheries Pr<strong>of</strong>ile<br />
(BFAR, 2005).<br />
bAssumed application rate: 1.5 tonne/ha in first cropping <strong>and</strong> 0.5 tonne/ha in second cropping.<br />
cAssumed application rate: 50 kg/ha 16-0-0 or 20 kg/ha 18-46-0, 15 kg/ha 46-0-0, <strong>and</strong> 10 kg 21-0-0 applied during<br />
pond preparation <strong>and</strong> 1/2 <strong>of</strong> these rates every 15 days during four-month culture period; 21-0-0 is applied only<br />
during pond preparation; 2 crops/year (total inorganic fertilizer/year, 500 kg 16-20-0 or 200 kg 18-46-0, 150 kg<br />
46-0-0, 20 kg 21-0-0).<br />
dProduction <strong>of</strong> chicken manure at 268g/day/2.3 kg animal (Whetsone 1974 in: Nash <strong>and</strong> Brown 1980)<br />
e (Total requirement / Total production <strong>and</strong> import) x 100.<br />
application rate <strong>of</strong> 1.5 tonnes manure/ha <strong>for</strong> the first annual crop <strong>and</strong> 0.5 tonnes manure/<br />
ha <strong>for</strong> the second crop, the total aquaculture manure requirement in the Philippines is<br />
estimated to be 489 998 tonnes in 2003 <strong>and</strong> in the next 10 years (Table 32). A comparison<br />
<strong>of</strong> the data in Table 7 <strong>and</strong> 32 suggest that future manure supply will be adequate to meet<br />
the dem<strong>and</strong>s <strong>of</strong> pond aquaculture. The calculated requirement <strong>of</strong> inorganic <strong>fertilizers</strong> in<br />
2004 based on recommended application rates <strong>and</strong> pond surface area is shown in Table<br />
32. Most <strong>of</strong> the fertilizer requirements <strong>of</strong> the country will be imported.<br />
6. RECOMMENDATIONS<br />
On the basis <strong>of</strong> this review the following recommendations can be made <strong>for</strong> the future<br />
<strong>sustainable</strong> development <strong>of</strong> the sector in the Philippines. Several <strong>of</strong> the recommendations<br />
are considered to be <strong>of</strong> a general nature, while others specifically pertain to the more<br />
effective implementation <strong>of</strong> government programmes.<br />
6.1 General<br />
1. National research <strong>and</strong> development programmes on the use <strong>of</strong> other readily<br />
available raw materials <strong>for</strong> use in aqua<strong>feeds</strong> such as copra oilseed cake, legumes<br />
(e.g. cowpeas) <strong>and</strong> the promotion <strong>of</strong> soybean production should be established.<br />
2. Strategies should be developed to monitor the quality <strong>and</strong> composition <strong>of</strong><br />
available feed ingredients such as local fishmeal, rice bran, copra meals <strong>and</strong> oils<br />
such that farmers get better value <strong>for</strong> money.
Analysis <strong>of</strong> <strong>feeds</strong> <strong>and</strong> <strong>fertilizers</strong> <strong>for</strong> <strong>sustainable</strong> aquaculture development in the Philippines 303<br />
3. The manufacture <strong>and</strong> use <strong>of</strong> farm-made <strong>feeds</strong> using locally available materials<br />
is recommended <strong>for</strong> small-scale fish farmers especially in remote areas <strong>and</strong><br />
extension services <strong>and</strong> training programmes on feed preparation should be<br />
intensified in areas needing assistance.<br />
4. Reducing feed costs through efficient feed conversion is the key to increasing<br />
returns. This requires further research on the nutrient requirements <strong>of</strong> aquaculture<br />
species.<br />
5. There is a need to shift from using trash fish to cost-effective <strong>for</strong>mulated feed.<br />
6. Greater emphasis has to be given to the environmental impact <strong>of</strong> aquaculture.<br />
It is recommended that the environmental carrying capacity <strong>of</strong> major receiving<br />
waters in the country be established <strong>and</strong> that this should guide the expansion <strong>of</strong><br />
the sector.<br />
7. Nutrient discharge from shrimp farms should be minimized. Some shrimp farms<br />
already practice low-discharge techniques. There is a need to further refine <strong>and</strong><br />
disseminate this technology to fish farmers.<br />
8. According to the regional guidelines (SEAFDEC, 2005), a research-based<br />
quality st<strong>and</strong>ard <strong>for</strong> <strong>feeds</strong> <strong>and</strong> feed additives <strong>and</strong> guidelines <strong>for</strong> their proper<br />
selection <strong>and</strong> use should be established.<br />
The recommendations made above <strong>of</strong>fer significant opportunities <strong>for</strong> public/<br />
private partnerships involving farmers, feed manufacturers, private research institutes,<br />
universities <strong>and</strong> statutory institutions.<br />
6.2 Effective implementation <strong>of</strong> government programmes<br />
9. The further clustering <strong>of</strong> fish <strong>and</strong> shrimp farms <strong>and</strong> feedmills should be strongly<br />
promoted. The Department <strong>of</strong> Science <strong>and</strong> Technology (DOST), BFAR <strong>and</strong> the<br />
Department <strong>of</strong> Trade <strong>and</strong> Industry (DTI) have initiated such a program in some<br />
parts <strong>of</strong> the country.<br />
10. The Balanced Fertilization Strategy (BFS) is an innovative <strong>and</strong> cost efficient<br />
approach <strong>for</strong> the use <strong>and</strong> management <strong>of</strong> location-specific combinations <strong>of</strong><br />
inorganic <strong>and</strong> organic <strong>fertilizers</strong>. The BFS likewise aims to correct the declining<br />
rice production caused by fertilizer misuse <strong>and</strong> impact <strong>of</strong> urea overuse. This<br />
programme requires active support by all aquaculture stakeholders. The<br />
Department <strong>of</strong> Agriculture through the FPA has agreed to establish regional<br />
bulk blending facilities in strategic regional sites in the Philippines. This<br />
strategy is also applicable to <strong>and</strong> must be developed <strong>for</strong> the aquaculture<br />
sector.<br />
11. The manufacture <strong>and</strong> use <strong>of</strong> compost must be promoted. The National Rapid<br />
Composting Programme should be strongly supported by all stakeholders <strong>and</strong><br />
extension services must promote the programme among fish <strong>and</strong> shrimp farmers.<br />
Government should establish <strong>and</strong> disseminate guidelines <strong>for</strong> the appropriate<br />
selection <strong>and</strong> use <strong>of</strong> organic compost.<br />
ACKNOWLEDGEMENTS<br />
The author wishes to thank the following institutions <strong>and</strong> individuals <strong>for</strong> providing<br />
valuable in<strong>for</strong>mation without which this report could not have been produced.<br />
Aquaculture Department, Southeast Asian Fisheries Development Center<br />
Animal Feed St<strong>and</strong>ard Division, Bureau <strong>of</strong> Animal Industry, Department <strong>of</strong> Agriculture<br />
Bureau <strong>of</strong> Agricultural Statistics<br />
Bureau <strong>of</strong> Customs<br />
Bureau <strong>of</strong> Fisheries <strong>and</strong> Aquatic Resources (Region III, IV-B, VI, VII, XIII, CAR)<br />
Department <strong>of</strong> Environment <strong>and</strong> Natural Resources<br />
Fertilizer <strong>and</strong> Pesticide Authority<br />
National Mapping <strong>and</strong> Resource In<strong>for</strong>mation Authority
304<br />
<strong>Study</strong> <strong>and</strong> <strong>analysis</strong> <strong>of</strong> <strong>feeds</strong> <strong>and</strong> <strong>fertilizers</strong> <strong>for</strong> <strong>sustainable</strong> aquaculture development<br />
National Meat Inspection Service<br />
National Statistics Office<br />
Feed manufacturers <strong>and</strong> distributors<br />
Ms Emerald Corpuz-Uy<br />
Mr Philip Cruz<br />
Mr Teodoro Cruz<br />
Ms Arlene de la Vega<br />
Mr Nelson Jardeleza<br />
Mr Philip Ong<br />
Mr Jun Toreda<br />
REFERENCES<br />
ADB (Asian Development Bank). Case study 4: overview <strong>of</strong> freshwater aquaculture <strong>of</strong><br />
tilapia in the Philippines (2002 study), pp. 48–70. Retrieved 23 June 2005 (available at<br />
http://www.asi<strong>and</strong>evbank.org/).<br />
AFSD-BAI (Animal Feed St<strong>and</strong>ard Division-Bureau <strong>of</strong> Animal Industry). 2005. Pr<strong>of</strong>ile<br />
<strong>of</strong> the feedmilling industry. Quezon City, Philippines, Animal Feed St<strong>and</strong>ard Division,<br />
Bureau <strong>of</strong> Animal Industry, Department <strong>of</strong> Agriculture.<br />
Alava, V.R. 2002. Management <strong>and</strong> feeding <strong>of</strong> tropical aquaculture species. In O.M.<br />
Millamena, R.M. Coloso &. F.P. Pascual, eds. Nutrition in tropical aquaculture: essentials<br />
<strong>of</strong> fish nutrition, <strong>feeds</strong>, <strong>and</strong> feeding <strong>of</strong> tropical aquatic species, p. 169–208. Iloilo,<br />
Philippines, SEAFDEC. 221 pp.<br />
Alava, V.R. & Lim, C. 1983. The quantitative dietary protein requirement <strong>of</strong> Penaeus<br />
monodon juveniles in a controlled environment. Aquaculture, 30: 53–61.<br />
Aldon, E.T. 1998. The culture <strong>of</strong> tilapia. SEAFDEC Asian Aquaculture, 22: 15–17.<br />
Arboleda, G. 1998. General description <strong>of</strong> the fertilizer sector. Retrieved 2 August 2005,<br />
(available at http:// www.fadinap.org/ Philippines/ newsdevt.html/).<br />
Aristorenas, R. 2000. Inorganic industry developments. Bayan na Sagana-The FPA<br />
quarterly. Retrieved 1 September 2005 (available at http:// www.fadinap.org/aristorenas.<br />
html/).<br />
Bagarinao, T. 1997. Ecological limits <strong>of</strong> high density milkfish farming. SEAFDEC Asian<br />
Aquaculture, 14: 9–11.<br />
Baliao, D.D., De los Santos, M.A. & Franco, N.M. 1999. Penculture <strong>of</strong> mudcrab in<br />
mangroves. Aquaculture Extension Manual No. 26. Tigbauan, Iloilo, Philippines,<br />
SEAFDEC. 10 pp.<br />
Baliao, D.D., De los Santos, M.A., Franco, N.M. & Jamon, N.R.S. 2000. Grouper<br />
culture in floating net cages. Aquaculture Extension Manual No. 29. Tigbauan, Iloilo,<br />
Philippines, SEAFDEC. 10 pp.<br />
Baliao, D.D., De los Santos, M.A., Rodriguez, E.M. & Ticar, R.B. 1998. Grouper culture<br />
in brackish-water ponds. Aquaculture Extension Manual No. 34. Tigbauan, Iloilo,<br />
Philippines, SEAFDEC. 17 pp.<br />
BAS (Bureau <strong>of</strong> Agricultural Statistics). 2004. Crops statistics <strong>of</strong> the Philippines 1990–2003.<br />
Quezon City, Philippines, Bureau <strong>of</strong> Agricultural Statistics, Department <strong>of</strong> Agriculture.<br />
79 pp.<br />
BAS (Bureau <strong>of</strong> Agricultural Statistics). 2005a. Fisheries statistics <strong>of</strong> the Philippines 2001–<br />
2003, Vol. 12. Quezon City, Philippines, Bureau <strong>of</strong> Agricultural Statistics, Department<br />
<strong>of</strong> Agriculture. 91 pp.<br />
BAS (Bureau <strong>of</strong> Agricultural Statistics). 2005b. Per<strong>for</strong>mance <strong>of</strong> Philippine agriculture,<br />
January – December 2004. Quezon City, Philippines, Bureau <strong>of</strong> Agricultural Statistics,<br />
Department <strong>of</strong> Agriculture.<br />
BAS (Bureau <strong>of</strong> Agricultural Statistics). 2006. Crops statistics <strong>of</strong> the Philippines 2000-2005.<br />
Quezon City, Philippines, Bureau <strong>of</strong> Agricultural Statistics, Department <strong>of</strong> Agriculture.<br />
88 pp.
Analysis <strong>of</strong> <strong>feeds</strong> <strong>and</strong> <strong>fertilizers</strong> <strong>for</strong> <strong>sustainable</strong> aquaculture development in the Philippines 305<br />
Bautista, M.N. 1986. The response <strong>of</strong> Penaeus monodon juveniles to varying protein/<br />
energy ratios in test diets. Aquaculture, 53: 229–242.<br />
Bautista, M.N. & Baticados, M.C.L. 1990. Dietary manipulation to control the chronic s<strong>of</strong>tshell<br />
syndrome in tiger prawn, Penaeus monodon fabric us. In R. Hirano & I. Hanyu, eds.<br />
The Second Asian Fisheries Forum, p 341–344. Tokyo, Asian Fisheries Society. 991 pp.<br />
Bautista, M.N., Parado-Estefa, F., Millamena, O.M. & Borlongan E.C. 1991. Large scale<br />
hatchery production <strong>of</strong> Penaeus monodon using natural food <strong>and</strong> artificial diets. Isr. J.<br />
Aquaculture - Bamidgeh, 43: 137–144.<br />
BFAR (Bureau <strong>of</strong> Fisheries <strong>and</strong> Aquatic Resources). 2005. Philippine fisheries pr<strong>of</strong>ile,<br />
2003. Quezon City, Philippines, Bureau <strong>of</strong> Fisheries <strong>and</strong> Aquatic Resources, Department<br />
<strong>of</strong> Agriculture. 63 pp.<br />
BFAR (Bureau <strong>of</strong> Fisheries <strong>and</strong> Aquatic Resources). 2006. Philippine fisheries pr<strong>of</strong>ile,<br />
2004. Quezon City, Philippines, Bureau <strong>of</strong> Fisheries <strong>and</strong> Aquatic Resources, Department<br />
<strong>of</strong> Agriculture. 62 pp.<br />
Bombeo, R.F. 2001. Hatchery, nursery <strong>and</strong> grow-out management <strong>of</strong> the Asian catfish<br />
Clarias macrocephalus. Seminar on FISHLINK 2001, Iloilo City. Miag-ao, Iloilo,<br />
Philippines, University <strong>of</strong> the Philippines Aquaculture Society, Inc.<br />
Blair, G.J. 1990. The diversity <strong>and</strong> potential value <strong>of</strong> shrubs <strong>and</strong> tree fodders. In C.<br />
Devendra, ed. Shrubs <strong>and</strong> tree fodders <strong>for</strong> farm animals, pp. 2–9. Proceedings <strong>of</strong><br />
Workshop in Indonesia, July 1989. Ottawa, Ontario, Canada, IDRC. 349 pp.<br />
Bordeos, A.O. 2004. Extensive shrimp culture experience: Magallanes, Agusan del Norte, p.<br />
112–114. Proceedings <strong>of</strong> the 3 rd National Shrimp Industry Congress (Shrimp Conference<br />
2002), Bacolod City, Philippines. Tigbauan, Iloilo, SEAFDEC/DTI. 152 pp.<br />
Borlongan, I.G. 1992. Essential fatty acid requirements <strong>of</strong> milkfish (Chanos chanos<br />
Forsskal) juveniles. Fish Physiol. <strong>and</strong> Biochem, 9: 401–407.<br />
Borlongan, I.G., Marte, C.L. & Nocillado, J.N. 2000. Development <strong>of</strong> larval diets <strong>for</strong><br />
milkfish (Chanos chanos). J. Appl. Ichthyol., 14: 68–72.<br />
Borlongan, I.G. &. Parazo, M.M. 1991. Effect <strong>of</strong> dietary lipid sources on growth, survival,<br />
<strong>and</strong> fatty acid composition <strong>of</strong> sea bass (Lates calcarifer Bloch) fry. Israeli J. Aquacult.-<br />
Bamidgeh, 43: 95–102.<br />
Borlongan, I.G. & Satoh, S. 2001. Dietary phosphorus requirement <strong>of</strong> juvenile milkfish<br />
Chanos chanos (Forsskal). Aquaculture Research, 32: 1–8.<br />
Catacutan, M.R. 1991. Growth <strong>and</strong> fatty acid composition <strong>of</strong> Penaeus monodon juveniles<br />
fed various lipids. Israeli J. Aquacult.-Bamidgeh, 43: 47–56.<br />
Catacutan, M.R. 1997. Protein <strong>and</strong> dry matter digestibility <strong>of</strong> <strong>feeds</strong>tuffs in complete diets<br />
<strong>for</strong> Penaeus monodon. In Y. Zhou, H. Zhou, C. Yao, Y. Lu, F. Hu, H. Cui <strong>and</strong> F. Din,<br />
eds. Proceedings <strong>of</strong> the fourth Asian fisheries <strong>for</strong>um. Beijing, China, 16–20 October 1997.<br />
754 pp.<br />
Catacutan, M.R. 2002a. Formulation <strong>of</strong> aqua<strong>feeds</strong>. In O.M. Millamena, R.M. Coloso <strong>and</strong><br />
F.P. Pascual, eds. Nutrition in tropical aquacultur: essentials <strong>of</strong> fish nutrition, <strong>feeds</strong>, <strong>and</strong><br />
feeding <strong>of</strong> tropical aquatic species, pp. 99–123. Iloilo, Philippines, SEAFDEC. 221 pp.<br />
Catacutan, M.R. 2002b. Growth <strong>and</strong> body composition <strong>of</strong> juvenile mudcrab, Scylla serrata,<br />
fed different dietary protein <strong>and</strong> lipid levels <strong>and</strong> protein to energy ratios. Aquaculture,<br />
208: 113–123.<br />
Catacutan, M.R. & Coloso, R.M. 1994. Effect <strong>of</strong> dietary protein to energy ratios on<br />
growth, survival, <strong>and</strong> body composition <strong>of</strong> juvenile Asian seabass, Lates calcarifer.<br />
Aquaculture, 131: 124–133.<br />
Catacutan, M.R., Eusebio, P.S. &. Teshima, S. 2003. Apparent digestibility <strong>of</strong> selected<br />
<strong>feeds</strong>tuffs by mudcrab (Scylla serrata). Aquaculture, 216: 253–261.<br />
Catacutan M.R., Pagador, G.E & Teshima, S. 2001. Effect <strong>of</strong> dietary protein <strong>and</strong> lipid<br />
levels <strong>and</strong> protein to energy ratios on growth, survival <strong>and</strong> body composition <strong>of</strong> the<br />
mangrove snapper, Lutjanus argentimaculatus (Forsskal 1775). Aquaculture Research,<br />
32: 811–818.
306<br />
<strong>Study</strong> <strong>and</strong> <strong>analysis</strong> <strong>of</strong> <strong>feeds</strong> <strong>and</strong> <strong>fertilizers</strong> <strong>for</strong> <strong>sustainable</strong> aquaculture development<br />
Cipriano, V. 2002. Recent agricultural <strong>and</strong> fertilizer developments in the Philippines. IFA<br />
Regional Conference <strong>for</strong> Asia <strong>and</strong> the Pacific, Singapore. Retrieved 2 August 2005,<br />
(available at http://www.fertilizer.org/).<br />
Coniza, E.B., Catacutan, M.R. & Tan-Fermin, J.D. 2001. Pen culture <strong>of</strong> Asian catfish<br />
Clarias macrocephalus juveniles fed four different diets in the Philippines. Sixth Asian<br />
Fisheries Forum, 25–30 November 2001, Kaoshiung, Taiwan Province <strong>of</strong> China, Asian<br />
Fisheries Society.<br />
Corre, V.L., Janeo, R.L., Caipang, C.M.A. & Calpe, A.T. 1999. Sustainable shrimp culture<br />
techniques: use <strong>of</strong> probiotics <strong>and</strong> reservoirs with “green water”. Los Baños, Laguna,<br />
Philippine Council <strong>for</strong> Aquatic <strong>and</strong> Marine Research <strong>and</strong> Development, Miag-ao, Iloilo,<br />
University <strong>of</strong> the Philippines in the Visayas. 32 pp.<br />
Cuevas, V.C. 1997. Rapid composting technology in the Philippines: its role in producing<br />
good-quality organic <strong>fertilizers</strong>. Retrieved August 2, (available at http://www.agnet.org/<br />
library/article/eb444.html/).<br />
DA (Department <strong>of</strong> Agriculture). 1996. Revised nutrient st<strong>and</strong>ards <strong>for</strong> aquaculture <strong>feeds</strong>.<br />
Quezon City, Philippines, Department <strong>of</strong> Agriculture.<br />
Devendra, C. 1985. Non-conventional feed resources in Asia <strong>and</strong> the Pacific. Bangkok,<br />
FAO/APHCA Publication. 140 pp.<br />
Dugeno, M.S.O. 2005. Vermicomposting: the buro-buro experience. Agriculture, IX(1): 8–13.<br />
Duray, M.N., Estudillo, C.B. &. Alpasan, L.G. 1997. Larval rearing <strong>of</strong> the grouper<br />
Epinephelus suillus under laboratory conditions. Aquaculture, 150: 63–76.<br />
Eguia, R.V. 2003. Prospects <strong>of</strong> bighead carp culture in the Philippines. Seminar on business<br />
opportunities in aquaculture, July 2003, Iloilo City. Tigbauan, Iloilo City, Philippines,<br />
SEAFDEC Aquaculture Department.<br />
Erazo-Pagador, G. 2001. Rapid wound healing in African catfish, Clarias gariepinus, fed<br />
diets supplemented with ascorbic acid. Israeli J. Aquacult. - Bamidgeh, 53: 69–79.<br />
Eusebio, P.S., Coloso, R.M. &. Mamauag, R.E.P. 2004. Apparent digestibility <strong>of</strong> selected<br />
feed ingredients in diets <strong>for</strong> grouper (Epinephelus coioides) juveniles. In M.A. Rimmer,<br />
S. McBride & K.C. Williams, eds. Advances in grouper aquaculture, pp. 75–78. ACIAR<br />
Monograph 110. Canberra, Australian Centre <strong>for</strong> International Agricultural Research.<br />
FADINAP (Fertilizer Advisory, Development <strong>and</strong> In<strong>for</strong>mation Network <strong>for</strong> Asia <strong>and</strong><br />
the Pacific). 2002. Fertilizer production facilities <strong>and</strong> capacities. Retrieved 1 September<br />
2005 (available at http://www.fadinap.org/).<br />
Ferraris, R.P., Catacutan, M.R., Mabelin, R.L. & Jazul, A.P. 1986. Digestibility <strong>of</strong> milkfish<br />
Chanos chanos (Forsskal): effects <strong>of</strong> protein source, fish size <strong>and</strong> salinity. Aquaculture,<br />
59: 93–105.<br />
Filart, M.D.L. 2005. Philippine industry situation. The 2 nd national Bangus congress.<br />
Dagupan City, Philippines.<br />
Frio, A.S. 1999. Bighead carp grow-out in Laguna de Bay. SEAFDEC Asian Aquaculture,<br />
XXI(5):31.<br />
Guerrero, R.D. 2002. Tilapia farming in the Asia-Pacific region. In R.D. Guerrero <strong>and</strong> R.<br />
Guerrero-del Castillo, eds. Tilapia Farming in the 21st Century, pp. 42–50. Proceedings<br />
<strong>of</strong> the International Forum on Tilapia Farming in the 21 st Century (Tilapia Forum 2002).<br />
Los Baños, Laguna, Philippines, Philippine Fisheries Asso., Inc. 184 pp.<br />
Hertrampf, J.W. & Piedad-Pascual, F. 2000. H<strong>and</strong>book on ingredients <strong>for</strong> aquaculture<br />
<strong>feeds</strong>. Netherl<strong>and</strong>s, Kluwer Academic Publishers. 573 pp.<br />
Jauncey, K. & Ross, B. 1982. A guide to tilapia <strong>feeds</strong> <strong>and</strong> feeding. Scotl<strong>and</strong>, Institute <strong>of</strong>`<br />
Aquaculture, University <strong>of</strong> Sterling. 111 pp.<br />
Lim, C., Suchawongs, S. & Pascual, F.P. 1979. A preliminary study on the protein requirements<br />
<strong>of</strong> Chanos chanos (Forsskal) fry in a controlled environment. Aquaculture, 17: 195–201.<br />
Luckstädt, C. 2003. Feed intake <strong>and</strong> feed utilization <strong>of</strong> juvenile milkfish (Chanos chanos<br />
(Forsskal, 1775)). In Commercially managed ponds in the Philippines. Germany, Shaker<br />
Verlag. 174 pp.
Analysis <strong>of</strong> <strong>feeds</strong> <strong>and</strong> <strong>fertilizers</strong> <strong>for</strong> <strong>sustainable</strong> aquaculture development in the Philippines 307<br />
Millamena, O.M. 2002. The essential nutrients. In O.M. Millamena, R.M. Coloso <strong>and</strong><br />
F.P. Pascual, eds. Nutrition in tropical aquaculture: essentials <strong>of</strong> fish nutrition, <strong>feeds</strong>, <strong>and</strong><br />
feeding <strong>of</strong> tropical aquatic species, pp. 7–75. Iloilo, Philippines, SEAFDEC. 221 pp.<br />
Millamena, O.M. & Golez, N.V. 1998. Essential fatty acid requirement <strong>of</strong> juvenile grouper<br />
Epinephelus coioides. Fifth Asian Fisheries Forum, 11–14 November 1998, Chiangmai,<br />
Thail<strong>and</strong>, Asian Fisheries Society.<br />
Millamena O.M., Golez, N.V., Janssen, J.A.J. & Peschcke-Koedt, M. 2000. Processed<br />
meat solubles, Protamino Aqua, used as an ingredient in juvenile shrimp <strong>feeds</strong>. Israeli J.<br />
Aquacult. - Bamidgeh, 52: 91–97.<br />
Millamena O.M. & Triño, A.T. 1994. Evaluation <strong>of</strong> fish protein concentrate <strong>and</strong> lactic yeast<br />
as potential protein sources <strong>for</strong> shrimp <strong>feeds</strong>. In L.M. Chou, A.D. Munro, T.J. Lam, T.W.<br />
Chen, L.K.K. Cheong, J.K. Ding, K.K. Hooi, H.W. Khoo, V.P.E. Phang, K.F. Shim <strong>and</strong> C.H.<br />
Tan, eds. The third Asian fisheries <strong>for</strong>um, pp. 676–677. Manila, Asian Fisheries Society.<br />
Nalzaro, G.G. 1982. Quantitative dietary cholesterol requirement <strong>of</strong> Penaeus monodon<br />
juveniles. University <strong>of</strong> the Philippines in the Visayas. 47 pp. (MSc thesis)<br />
NAMRIA (National Mapping <strong>and</strong> Resource In<strong>for</strong>mation Authority). 2005. L<strong>and</strong>/Forest<br />
Cover Status <strong>of</strong> the Philippines, 2003. A joint Project <strong>of</strong> NAMRIA <strong>and</strong> FMB.<br />
NRC (National Research Council). 1977. Nutrient requirements <strong>of</strong> warmwater fishes.<br />
Washington DC, National Academy <strong>of</strong> Sciences. 78 pp.<br />
Nash, C.E. & Brown, C.M. 1980. A theoretical comparison <strong>of</strong> waste treatment processing<br />
plants <strong>and</strong> fish production ponds receiving animal wastes. In R.S.V. Pullin, & Z.H.<br />
Shehadeh, eds. Intergrated agriculture-aquaculture farming systems, pp. 87–97. ICLARM<br />
Proceedings No. 4. Los Baños, Laguna, Philippines, ICLARM, Manila <strong>and</strong> Southeast<br />
Asian Center <strong>for</strong> Graduate <strong>Study</strong> <strong>and</strong> Research in Agriculture College. 258 pp.<br />
NEDA (National Economic Development Authority). 2004. Medium-Term Development<br />
Plan. Manila, Philippines, NEDA. 277 pp.<br />
Pascual, F.P. 1989a. The effect <strong>of</strong> various levels <strong>of</strong> protein, fat, carbohydrates <strong>and</strong> energy on<br />
growth, survival <strong>and</strong> body composition <strong>of</strong> Chanos chanos fingerlings. In E.A. Huisman,<br />
N. Zonnerveld <strong>and</strong> A.H.M. Bouwman, eds. Aquaculture research in Asia management<br />
techniques <strong>and</strong> nutrition, pp. 228–236. Proceedings <strong>of</strong> the Asian seminar on aquaculture,<br />
Malang, Indonesia, 14–18 November 1988. Wageningen, Pudoc.<br />
Pascual, F.P. 1989b. Nutrition <strong>and</strong> feeding <strong>of</strong> Penaeus monodon. Aquaculture Extension<br />
Manual No. 3. Iloilo, Philippines, SEAFDEC Aquaculture Department. 24 pp.<br />
Philippine Tariff Commission. 2004. Tariff <strong>and</strong> customs code <strong>of</strong> the Philippines. The<br />
ASEAN harmonized tariff nomenclature (AHTN). Vol. 1. Quezon City, Philippines,<br />
Philippine Tariff Commission. 1137 pp.<br />
Regalado, G.R. 2001. Prawn culture systems in the Philippines. Seminar on FISHLINK<br />
2001, Iloilo City. Miag-ao, Iloilo, Philippines, University <strong>of</strong> the Philippines Aquaculture<br />
Society, Inc.<br />
Rodriguez, E.M. 2001. Mud crab pond <strong>and</strong> pen culture. Paper presented during the<br />
seminar on FISHLINK 2001, Iloilo City. Miag-ao, Iloilo, Philippines, University <strong>of</strong> the<br />
Philippines Aquaculture Society, Inc.<br />
Santiago, A. 2001. Pen <strong>and</strong> cage culture in Philippine lakes. In IIRR, IDRC, FAO, NACA<br />
<strong>and</strong> ICLARM, eds. Utilizing different aquatic resources <strong>for</strong> livelihood in Asia: a resource<br />
book, pp. 309–314. International Institute <strong>for</strong> Rural Reconstruction, International<br />
Development Research Center, Food <strong>and</strong> Agriculture Organization <strong>of</strong> the United<br />
Nations, Network <strong>of</strong> Aquaculture Centers in Asia-Pacific <strong>and</strong> International Center <strong>for</strong><br />
Living Aquatic Resources Management. 416 pp.<br />
Santiago, C.B., Aldaba, M.B. & Reyes, O.S. 1987. Influence <strong>of</strong> feeding rate <strong>and</strong> diet <strong>for</strong>m<br />
on the growth <strong>and</strong> survival <strong>of</strong> Nile Tilapia (Oreochromis niloticus) fry. Aquaculture, 64:<br />
277–282.<br />
Santiago, C.B., Reyes, O.S., Aldaba, M.B. <strong>and</strong> Laron, M.A. 1986. An evaluation <strong>of</strong><br />
<strong>for</strong>mulated diets <strong>for</strong> Nile tilapia fingerlings. Fish. Res. J. Philipp., 11: 5–12.
308<br />
<strong>Study</strong> <strong>and</strong> <strong>analysis</strong> <strong>of</strong> <strong>feeds</strong> <strong>and</strong> <strong>fertilizers</strong> <strong>for</strong> <strong>sustainable</strong> aquaculture development<br />
SEAFDEC. 2005. Regional guidelines <strong>for</strong> responsible fisheries in Southeast Asia - responsible<br />
aquaculture. Tigbauan, Iloilo, Philippines, SEAFDEC Aquaculture Department. 43 pp.<br />
Sedgewick, R.W. 1979. Influence <strong>of</strong> dietary protein <strong>and</strong> energy on growth, food<br />
consumption <strong>and</strong> food conversion efficiency <strong>of</strong> Penaeus merguienses de Man.<br />
Aquaculture, 16: 64–67.<br />
Shiau, S.Y. & Chin, Y.H. 1998. Dietary biotin requirement <strong>for</strong> maximum growth <strong>of</strong><br />
juvenile grass shrimp, P. monodon. J. Nutr., 128: 2494–2497.<br />
Shiau, S.Y. & Hsu, C.W. 1998. Dietary panthothenic acid requirement <strong>of</strong> juvenile grass<br />
shrimp, Penaeus monodon. J. Nutr., 129: 718–721<br />
Solalela, B.C. 2001. An outlook <strong>for</strong> the feedmilling industry in the Philippines today <strong>and</strong><br />
beyond 2003. International <strong>feeds</strong> <strong>and</strong> veterinary drugs congress, 31 May 2001, Pasay<br />
City, Philippines, World Trade Center.<br />
Sumagaysay-Chavoso, N.S. 2003. Milkfish culture in ponds. Seminar on business<br />
opportunities in aquaculture, July 2003. Tigbauan, Iloilo, Philippines, SEAFDEC<br />
Aquaculture Department.<br />
Sumagaysay, N.S. 1998. Milkfish (Chanos chanos) production <strong>and</strong> water quality in<br />
brackish-water ponds at different feeding levels <strong>and</strong> frequencies. J. Appl. Ichthyol., 14:<br />
81–85.<br />
Sumagaysay, N.S. & Borlongan, I.G. 1995. Growth <strong>and</strong> production <strong>of</strong> milkfish<br />
(Chanos chanos) in brackish-water ponds: effects <strong>of</strong> dietary protein <strong>and</strong> feeding levels.<br />
Aquaculture, 132: 273–283.<br />
Sumagaysay, N.S., Marquez, F.E. & Chiu-Chern, Y.N. 1991. Evaluation <strong>of</strong> supplemental<br />
<strong>feeds</strong> <strong>for</strong> milkfish (Chanos chanos) reared in brackish-water ponds. Aquaculture, 93:<br />
177–189.<br />
Surtida, M.B. & Buendia, R.Y. 2000. Growing catfish in the Philippines. SEAFDEC Asian<br />
Aquaculture, 22: 22–24, 33.<br />
Takeuchi, T., Satoh, S. & Watanabe, T. 1983. Requirement <strong>of</strong> Tilapia nilotica <strong>for</strong> essential<br />
fatty acids. Bull. Jap. Soc. Sci. Fish., 49: 1127–1134.<br />
Takeuchi, T., Watanabe, T. & Ogino, C. 1979. Optimum energy to protein <strong>for</strong> carp. Bull.<br />
Jpn. Soc. Sci. Fish., 45: 983–987.<br />
Tan-Fermin, J.D. & Coniza, E.B. 2003. Catfish seed production <strong>and</strong> grow-out ventures.<br />
Seminar on business opportunities in aquaculture, July 2003, Iloilo City. Tigbauan,<br />
Iloilo, Philippines, SEAFDEC Aquaculture Department.<br />
Teng, S.K., Chua, T.E. & Lim, P.E. 1978. Preliminary observation on the dietary protein<br />
requirement <strong>of</strong> estuary grouper, Ephinephelus salmoides Maxwell cultured in floating net<br />
cages. Aquaculture, 15: 257–271.<br />
Toledo, J.D. 2001. Culture <strong>of</strong> grouper, sea bass <strong>and</strong> red snapper. Seminar on FISHLINK<br />
2001, Iloilo City. Miag-ao, Iloilo, Philippines, University <strong>of</strong> the Philippines Aquaculture<br />
Society, Inc.<br />
Triño, A.T., Millamena, O.M. & Keenan, C. 2001. Pond culture <strong>of</strong> mud crab Scylla serrata<br />
(Forskal) fed <strong>for</strong>mulated diet with or without vitamin <strong>and</strong> mineral supplements. Asian<br />
Fish. Sci., 14: 191–200.<br />
Triño, A.T., Rodríguez, E.M., Coniza, E.B. &. Juanga, B.P. 1999. Mudcrab. Aquaculture<br />
Extension Manual No. 27. Tigbauan, Iloilo, Philippines, SEAFDEC. 33 pp.<br />
Wang, W., Takeuchi, T. & Watanabe, T. 1985. Effect <strong>of</strong> dietary protein <strong>and</strong> digestible<br />
energy levels on growth <strong>of</strong> Tilapia nilotica. Bull. Jpn. Soc. Sci. Fish., 51: 133–140.<br />
Watanabe T., Satoh, S. & Takeuchi, T. 1988. Availability <strong>of</strong> minerals in fishmeal to fish.<br />
Asian Fish. J., 1: 175–195.
Analysis <strong>of</strong> <strong>feeds</strong> <strong>and</strong> <strong>fertilizers</strong><br />
<strong>for</strong> <strong>sustainable</strong> aquaculture<br />
development in Thail<strong>and</strong><br />
S. Thongrod<br />
Coastal Aquatic Feed Research Institute<br />
41/14 Moo 9, Bangphra Sub-district, Sriracha District, Chonburi Province 20110<br />
Thail<strong>and</strong><br />
Summary 310<br />
1. Introduction 311<br />
2. General overview <strong>of</strong> aquaculture practices <strong>and</strong> farming systems 311<br />
3. Review <strong>and</strong> <strong>analysis</strong> <strong>of</strong> aquaculture <strong>feeds</strong> <strong>and</strong> feeding 317<br />
4. Feed management strategies 322<br />
5. Review <strong>of</strong> the development <strong>of</strong> the aquafeed industry 324<br />
6. Problems <strong>and</strong> constraints 326<br />
7. Conclusion <strong>and</strong> recommendations 327<br />
Acknowledgements 328<br />
References 328<br />
Appendix 330<br />
Thongrod, S. 2007. Analysis <strong>of</strong> <strong>feeds</strong> <strong>and</strong> <strong>fertilizers</strong> <strong>for</strong> <strong>sustainable</strong> aquaculture<br />
development in Thail<strong>and</strong>. In M.R. Hasan, T. Hecht, S.S. De Silva <strong>and</strong> A.G.J. Tacon (eds).<br />
<strong>Study</strong> <strong>and</strong> <strong>analysis</strong> <strong>of</strong> <strong>feeds</strong> <strong>and</strong> <strong>fertilizers</strong> <strong>for</strong> <strong>sustainable</strong> aquaculture development.<br />
FAO Fisheries Technical Paper. No. 497. Rome, FAO. pp. 309–330.<br />
309
310<br />
<strong>Study</strong> <strong>and</strong> <strong>analysis</strong> <strong>of</strong> <strong>feeds</strong> <strong>and</strong> <strong>fertilizers</strong> <strong>for</strong> <strong>sustainable</strong> aquaculture development<br />
SUMMARY<br />
Fisheries play an important role in the national economy <strong>of</strong> Thail<strong>and</strong>. The export volume<br />
<strong>and</strong> value <strong>of</strong> fishery products in 2004 amounted to 1.66 million tonnes, valued at US$4<br />
413 million. The total area under inl<strong>and</strong> aquaculture in 2004 was 143 500 ha with a total<br />
production <strong>of</strong> approximately 523 709 tonnes. Over 50 percent <strong>of</strong> aquaculture production<br />
can be attributed to the central region <strong>of</strong> the country. The most important culture species<br />
are Nile tilapia (160 241 tonnes), hybrid clariid catfish (159 314 tonnes), Java barb (66<br />
821 tonnes), snakeskin gourami, Trichogaster pectoralis (35 294 tonnes), giant freshwater<br />
prawn (32 583 tonnes) <strong>and</strong> sutchi catfish, Pangasius hypophthalmus (30 626 tonnes).<br />
Marine aquaculture on the other h<strong>and</strong> has posted a rapid growth, particularly<br />
because <strong>of</strong> significant increases in shrimp <strong>and</strong> shellfish production. The most important<br />
mariculture species are black tiger shrimp Penaeus monodon <strong>and</strong> Pacific white shrimp<br />
(Litopenaeus vannamei), shellfish (green mussel, oysters <strong>and</strong> cockle), seabass <strong>and</strong><br />
grouper.<br />
Feed <strong>and</strong> feeding practices vary depending on the farming system <strong>and</strong> species as well<br />
as the destination (domestic market or export) <strong>of</strong> the final product. In the past, chopped<br />
trash fish was the feed <strong>of</strong> choice. However, because <strong>of</strong> the low farm-gate value, higher<br />
transport <strong>and</strong> fuel costs <strong>and</strong> the declining supply <strong>of</strong> trash fish, farmers have switched over<br />
to poultry by-products or other industrial food wastes. Industrial <strong>and</strong> agricultural byproducts<br />
are either used as single or mixed <strong>feeds</strong>. Industrially manufactured, nutritionally<br />
complete <strong>feeds</strong> are generally used in intensive culture systems, especially in cages. These<br />
<strong>feeds</strong> are expensive <strong>and</strong> not always cost effective. However they are preferred due to<br />
their superior nutritive <strong>and</strong> physical properties. Farm-made <strong>feeds</strong> are less stable in water<br />
<strong>and</strong> are nutritionally inconsistent. This is largely due to the highly variable quality <strong>and</strong><br />
nutritive composition <strong>of</strong> the raw materials. Farmers have limited knowledge <strong>of</strong> feed<br />
preparation <strong>and</strong> have no control over the quality <strong>of</strong> the ingredients they use as feed.<br />
Although, the government promotes the use <strong>of</strong> commercial aqua<strong>feeds</strong>, farm-made <strong>feeds</strong><br />
are still widely used throughout the country. Extension support with respect to raw<br />
material selection, storage, processing <strong>of</strong> raw materials, feed <strong>for</strong>mulation <strong>and</strong> preparation<br />
<strong>of</strong> farm-made aqua<strong>feeds</strong> must be improved.<br />
The use <strong>of</strong> organic <strong>fertilizers</strong> in aquaculture has declined because <strong>of</strong> the increasing<br />
competition from agriculture. Moreover, the price <strong>of</strong> chicken manure is increasing <strong>and</strong><br />
not as freely available as in the past because <strong>of</strong> the outbreak <strong>of</strong> bird flu in 2003. This has<br />
seriously affected integrated chicken or duck/fish farming.<br />
Aquaculture in Thail<strong>and</strong>, including the industrial aquafeed industry, is a regulated<br />
activity <strong>and</strong> HACCP is implemented to ensure the quality <strong>of</strong> inputs <strong>and</strong> outputs. At<br />
the farm level, two quality assurance guidelines have been developed <strong>and</strong> adopted, viz.,<br />
“Good Aquaculture Practice” (GAP) <strong>and</strong> a “Code <strong>of</strong> Conduct” (CoC) <strong>for</strong> shrimp<br />
farming. GAP emphasizes product freshness, cleanliness, freedom from drugs <strong>and</strong><br />
chemicals <strong>and</strong> freedom from disease. CoC guidelines have been developed based on the<br />
philosophy <strong>of</strong> <strong>sustainable</strong> <strong>and</strong> environmentally responsible shrimp culture, hygiene <strong>and</strong><br />
food safety.
Analysis <strong>of</strong> <strong>feeds</strong> <strong>and</strong> <strong>fertilizers</strong> <strong>for</strong> <strong>sustainable</strong> aquaculture development in Thail<strong>and</strong> 311<br />
1. INTRODUCTION<br />
Thail<strong>and</strong> is bound by the Gulf <strong>of</strong><br />
Thail<strong>and</strong> in the east <strong>and</strong> the Andaman<br />
Sea in the west <strong>and</strong> has a coastline<br />
<strong>of</strong> 2 614 km, with many sheltered<br />
bays <strong>and</strong> lagoons. Inl<strong>and</strong> water bodies<br />
include 66 rivers, 10 233 lakes <strong>and</strong><br />
swamps <strong>and</strong> 685 reservoirs constituting<br />
a total water surface area <strong>of</strong> 566 400 ha<br />
(Tavaratmaneegul, 2001).<br />
Fisheries continue to play an<br />
important role in the national<br />
economy <strong>of</strong> Thail<strong>and</strong>, which since<br />
1997 has ranked among the top<br />
ten fish producing countries in the<br />
world. In 2004, the export <strong>of</strong> fishery<br />
products amounted to 1.66 million<br />
tonnes, valued at US$4 413 million, <strong>of</strong><br />
which shrimp products accounted <strong>for</strong><br />
US$1 683 million.<br />
Aquaculture in Thail<strong>and</strong> has been practiced<br />
<strong>for</strong> more than 70 years <strong>and</strong> started with<br />
freshwater pond culture <strong>of</strong> snakeskin gourami<br />
(Trichogaster pectoralis). It continues to<br />
exp<strong>and</strong> over the years, although the most<br />
rapid advances have been made in the last<br />
decade (Figure 1). Freshwater aquaculture<br />
continues to exp<strong>and</strong>, while the area <strong>for</strong> coastal<br />
aquaculture has remained more or less the<br />
same (Table 1). For certain species, culture<br />
systems have changed from extensive to<br />
semi-intensive to intensive. Since 1998, inl<strong>and</strong><br />
aquaculture production has surpassed the<br />
inl<strong>and</strong> wild catch (Table 2).<br />
FIGURE 1<br />
Capture fisheries <strong>and</strong> aquaculture production in Thail<strong>and</strong><br />
during 1995-2004<br />
Source: Fishery In<strong>for</strong>mation Technology Center (2006)<br />
TABLE 1<br />
Total area (ha) under inl<strong>and</strong> <strong>and</strong> coastal aquaculture<br />
from 1999–2004<br />
Year Total Freshwater Coastal<br />
1998 159 007 82 989 76 019<br />
1999 168 580 91 036 77 544<br />
2000 177 265 96 145 81 120<br />
2001 177 494 100 553 76 941<br />
2002 176 333 101 952 74 381<br />
2003 193 921 111 902 82 019<br />
2004 227 419 143 500 83 919<br />
Source: Fishery In<strong>for</strong>mation Technology Center (2006)<br />
TABLE 2<br />
Capture fisheries <strong>and</strong> aquaculture production (thous<strong>and</strong><br />
tonnes) in Thail<strong>and</strong> during 1992–2004<br />
Year<br />
Total<br />
production<br />
Capture fisheries<br />
Marine Inl<strong>and</strong><br />
Aquaculture<br />
Coastal Inl<strong>and</strong><br />
1992 3 240 2 736 132 229 142<br />
1993 3 385 2 753 175 296 162<br />
1994 3 523 2 804 203 346 170<br />
1995 3 573 2 827 192 358 196<br />
1996 3 549 2 786 208 326 229<br />
1997 3 384 2 680 205 300 200<br />
1998 3 506 2 709 202 368 227<br />
1999 3 626 2 725 207 442 253<br />
2000 3 713 2 774 202 467 271<br />
2001 3 648 2 632 203 535 280<br />
2002 3 797 2 644 199 660 295<br />
2003 3 914 2 651 198 703 361<br />
2004 4 100 2 636 204 736 524<br />
2. GENERAL OVERVIEW OF<br />
AQUACULTURE PRACTICES AND FARMING<br />
SYSTEMS<br />
Aquaculture practices in Thail<strong>and</strong> originated<br />
from traditional rice culture, from which wild<br />
fish were harvested as a by-product. This led<br />
to the proactive stocking <strong>of</strong> fish into ponds<br />
with improved fertilization regimens. The<br />
stocking density <strong>of</strong> fish in extensive culture<br />
systems is low at 500 fish/rai (1 rai = 0.16 ha)<br />
The most important extensive culture species<br />
are tilapia, common carp, rohu <strong>and</strong> Chinese<br />
carps. Some fish farms are integrated with<br />
poultry <strong>and</strong>/or pigs, <strong>and</strong> this is widely practiced in rural areas. The integrated culture<br />
<strong>of</strong> tilapia, sutchi catfish <strong>and</strong> chicken was very pr<strong>of</strong>itable. However, since the outbreak<br />
<strong>of</strong> bird flu in 2003/04, this practice is no longer well accepted as a farming system.<br />
Chicken farms have become bio-secure operations, such that any future outbreaks <strong>of</strong><br />
the virus can be controlled.<br />
Source: Fishery In<strong>for</strong>mation Technology Center (2006)
312<br />
<strong>Study</strong> <strong>and</strong> <strong>analysis</strong> <strong>of</strong> <strong>feeds</strong> <strong>and</strong> <strong>fertilizers</strong> <strong>for</strong> <strong>sustainable</strong> aquaculture development<br />
Extensive aquaculture is still practiced in paddy fields, especially in Chachoengsao,<br />
Samut Prakan <strong>and</strong> Samut Sakhon provinces (Fishery Statistic Analysis <strong>and</strong> Research<br />
Group, 2005), though this practice is also decreasing, except in Samut Prakarn Province<br />
where snakeskin gourami is commonly grown in rice fields.<br />
Semi-intensive polyculture is practiced in fertilized ponds in which fish are fed<br />
kitchen waste, slaughterhouse by-products or simple farm-made <strong>feeds</strong> consisting <strong>of</strong><br />
rice bran, soybean oilseed cake <strong>and</strong> trash fish. Semi-intensive aquaculture is <strong>of</strong>ten<br />
integrated with poultry or pig farming. Nile tilapia <strong>and</strong> hybrid catfish are the two<br />
most common species cultured in these systems. The disadvantage <strong>of</strong> this practice is<br />
the low farm-gate price <strong>of</strong> fish in comparison to marine or freshwater carnivorous<br />
fish. Fish in these systems are mainly produced <strong>for</strong> local consumption using low-cost<br />
<strong>feeds</strong>. Formulated pellet <strong>feeds</strong> are generally not used in semi-intensive aquaculture.<br />
The farm gate value <strong>of</strong> tilapias cultured in ponds is US$0.63/kg. Stocking densities in<br />
semi-intensive systems vary between 50 000 <strong>and</strong> 62 500 fingerling/ha <strong>and</strong> production<br />
varies from 3 125–6 250 kg/ha. The pond size varies widely <strong>and</strong> ranges between 0.8<br />
<strong>and</strong> 4.8 ha.<br />
Intensive aquaculture is practiced in ponds <strong>and</strong> cages. The ponds are smaller <strong>and</strong><br />
vary between 0.16–0.8 ha. The most commonly cultured species are hybrid catfish,<br />
Nile tilapia, hybrid tilapia/red tilapia (hybrid between Nile tilapia <strong>and</strong> Mozambique<br />
tilapia), snakehead <strong>and</strong> prawns. Although among tilapias, Nile tilapia is the species <strong>of</strong><br />
choice, intensive culture <strong>of</strong> red tilapia is exp<strong>and</strong>ing because <strong>of</strong> its high market value<br />
(Figures 2 <strong>and</strong> 3). Feeds include poultry by-products, farm-made <strong>feeds</strong> or commercial<br />
FIGURE 2<br />
Culture <strong>of</strong> hybrid tilapia in cages in Mae Khong River, Nongkhai Province<br />
FIGURE 3<br />
Culture <strong>of</strong> hybrid tilapia in earthen ponds, Nakorn Rachasrima Province
Analysis <strong>of</strong> <strong>feeds</strong> <strong>and</strong> <strong>fertilizers</strong> <strong>for</strong> <strong>sustainable</strong> aquaculture development in Thail<strong>and</strong> 313<br />
pellets (floating or sinking). Stocking density <strong>of</strong> fish in intensive culture systems<br />
varies between 187 500–312 500 fingerlings/ha <strong>and</strong> reported yields vary from 9 375–<br />
50 000 kg/ha/crop <strong>for</strong> fish <strong>and</strong> 1 250–2 500 kg/ha/crop <strong>for</strong> prawns. The farm-gate value<br />
<strong>of</strong> cage-cultured fish is usually higher than pond-reared fish.<br />
During the period 1992-2004, freshwater aquaculture production increased from<br />
142 100 to 523 709 tonnes <strong>and</strong> in value from US$86.96 million to US$482.82 million.<br />
During the same period, the volume <strong>of</strong> coastal aquaculture production increased from<br />
229 300 to 736 271 tonnes <strong>and</strong> in value from US$655.86 million to US$1 231.25 million<br />
(Fishery In<strong>for</strong>mation Technology Center, 2006).<br />
2.1 Freshwater aquaculture<br />
Over 20 species <strong>of</strong> freshwater fish are farmed in Thail<strong>and</strong>. The most important<br />
freshwater aquaculture species, with high export potential, are hybrid catfish (Clarias<br />
gariepinus x C. macrocephalus), Nile tilapia (Oreochromis niloticus), Java barb<br />
(Barbonymus gonionotus), snakeskin gourami (sepat siam in Thai) (Trichogaster<br />
pectoralis) <strong>and</strong> sutchi catfish (Pangasius hypophthalmus). Production <strong>of</strong> some <strong>of</strong> the<br />
more important freshwater fish from aquaculture <strong>and</strong> capture fisheries <strong>and</strong> their total<br />
value in 2004 are shown in Table 3.<br />
The total area used <strong>for</strong> freshwater fish culture in 2004 was 143 501 ha (Table 4) with<br />
a reported production <strong>of</strong> 523 709 tonnes. Total production <strong>of</strong> freshwater fish by culture<br />
system <strong>and</strong> by species over the last five years (1999-2004) is shown in Tables 5, 6 <strong>and</strong><br />
7. In 2004, over 87 percent <strong>of</strong> total aquaculture production was from pond culture<br />
systems, while the outputs from paddy field, ditch <strong>and</strong> cage culture were 6.68, 1.08 <strong>and</strong><br />
5.17 percent, respectively (Table 5). Percent production <strong>of</strong> important freshwater species<br />
by intensity <strong>of</strong> aquaculture is shown in Table 8.<br />
TABLE 3<br />
Freshwater aquaculture production (tonnes) <strong>and</strong> inl<strong>and</strong> capture fisheries <strong>and</strong> value<br />
(US$ million) in 2004<br />
Total production<br />
Species<br />
Aquaculture<br />
Production Value<br />
Capture<br />
fisheries<br />
Nile tilapia (Oreochromis niloticus) 203 100 157 160 241 42 859<br />
Common carp (Cyprinus carpio) 13 800 11 6 092 7 708<br />
Java barb (Barbonymus gonionotus) 106 800 82 66 821 39 979<br />
Snakeskin gourami/sepat siam (Trichogaster pectoralis) 37 800 38 35 294 2 506<br />
Hybrid catfish (Clarias macrocephalus x C. gariepinus) 166 100 128 159 314 6 786<br />
Snakehead murrel (Channa striata) 29 800 44 10 226 19 574<br />
Sutchi catfish (Pangasius hypophthalmus) 33 700 21 30 626 3 074<br />
Giant freshwater prawn (Macrobrachium rosenbergii) 33 000 97 32 583 417<br />
Source: Fishery In<strong>for</strong>mation Technology Center (2006)<br />
TABLE 4<br />
Total area (ha) <strong>of</strong> productive fish farms <strong>and</strong> area under aquaculture during 1998–2004<br />
Year 1998 1999 2000 2001 2002 2003 2004<br />
Pond Culture 64 776 70 821 68 516 73 916 75 495 86 968 118 002<br />
Paddy field 16 703 18 175 25 244 24 466 24 245 23 066 23 432<br />
Ditch culture1 1 482 2 001 2 350 2 135 2 184 1 811 2 007<br />
Cage culture 28 39 38 15 27 57 59<br />
Total area 82 989 91 036 96 145 100 553 101 952 111 903 143 501<br />
1 Ditch is a man made waterway in plantations. Its width is normally less than 5 m. All ditches in plantation are<br />
connected to increase the space <strong>for</strong> cultured fish.<br />
Source: Fishery In<strong>for</strong>mation Technology Center (2006)
314<br />
TABLE 6<br />
Production (tonnes) <strong>of</strong> freshwater species during 2000–2004<br />
<strong>Study</strong> <strong>and</strong> <strong>analysis</strong> <strong>of</strong> <strong>feeds</strong> <strong>and</strong> <strong>fertilizers</strong> <strong>for</strong> <strong>sustainable</strong> aquaculture development<br />
TABLE 5<br />
Total production (tonnes) <strong>of</strong> freshwater fish <strong>and</strong> yield (kg/ha) by culture system during 1998–2004<br />
Year<br />
Pond culture<br />
Production Yield<br />
Paddy field<br />
Production Yield<br />
Ditch culture<br />
Production Yield<br />
Cage culture<br />
Production Yield<br />
Total<br />
production<br />
1998 206 738 3 190 13 151 790 5 406 3 650 1 629 58 510 226 923<br />
1999 229 428 3 240 16 618 910 5 118 2 560 1 448 37 240 252 612<br />
2000 240 907 3 520 19 936 790 6 707 2 850 3 462 90 910 271 012<br />
2001 251 995 3 410 20 371 830 4 406 2 060 2 924 194 410 279 696<br />
2002 266 461 3 530 20 602 850 4 113 1 880 3 325 123 700 294 501<br />
2003 319 150 3 670 31 582 1 370 4 296 2 370 6 097 107 640 361 125<br />
2004 455 981 3 864 34 967 1 492 5 659 2 820 27 102 459 359 523 709<br />
Source: Fishery In<strong>for</strong>mation Technology Center (2006)<br />
Cultured species 2000 2001 2002 2003 2004<br />
Nile tilapia (Oreochromis niloticus) 82 363 84 480 83 780 98 336 160 241<br />
Mozambique tilapia (O. mossambicus) 26 30 27 19 149<br />
Common carp (Cyprinus carpio) 5 539 4 773 5 046 4 457 6 092<br />
Java barb (Barbonymus gonionotus) 46 276 42 152 44 242 49 066 66 821<br />
Snakeskin gourami/sepat siam (Trichogaster<br />
pectoralis)<br />
21 577 22 519 24 179 34 123 35 294<br />
Chinese carps 438 202 202 200 286<br />
Hybrid catfish (Clarias macrocephalus x C. gariepinus) 76 000 77 905 86 475 101 606 159 314<br />
Snakehead murrel (Channa striata) 4 446 6 830 5 483 4 060 10 266<br />
Giant snakehead (C. micropeltes) 81 87 95 145 193<br />
Sutchi catfish (Pangasius hypophthalmus) 13 226 14 638 14 837 23 085 30 626<br />
Marble goby (Oxyeleotris marmorata) 5 6 7 9.5 26<br />
Giant gourami (Osphronemus goramy) 1 488 1 182 1 555 2 130 2 849<br />
Rohu (Labeo rohita) 1 172 1 595 2 125 4 224 4 952<br />
Bronze feather back (Notopterus notopterus) 5 4 5 66 1<br />
Swamp eel (Monopterus albus) 38 38 25 43 50<br />
Moon light gourami (Trichogaster microlepis) 169 154 165 290 538<br />
Climbing perch (Anabas testudineus) 470 403 519 2 399 2 360<br />
Small scale mud carp (Cirrhinus microlepis) 1 058 798 985 619 1 009<br />
Giant freshwater prawn (Macrobrachium rosenbergii) 9 917 13 311 15 393 28 151 32 583<br />
Frog (Rana sp.) 1 033 1 046 835 866 1 944<br />
S<strong>of</strong>t-shelled turtle (Trionyx cartilageneus) 367 22 523 3 143 3 124 2 800<br />
Others 5 313 5 012 5 373 4 095 5 332<br />
Total production <strong>of</strong> cultured species<br />
Source: Fishery In<strong>for</strong>mation Technology Center (2006)<br />
271 012 279 696 294 501 361 125 523 709<br />
TABLE 7<br />
Aquaculture production (tonnes) by species <strong>and</strong> culture system in 2004<br />
Species Pond culture Paddy field Ditch culture Cage culture<br />
Nile tilapia (Oreochromis niloticus)<br />
Common carp (Cyprinus carpio)<br />
Java barb (Barbonymus gonionotus)<br />
Snakeskin gourami/sepat siam (Trichogaster pectoralis)<br />
Chinese carps<br />
Hybrid catfish (C. macrocephalus x C. gariepinus)<br />
Snakehead murrel (Channa striata)<br />
Giant snakehead (Channa micropeltes)<br />
Sutchi catfish (Pangasius hypophthalmus)<br />
Giant freshwater prawn (Macrobrachium rosenbergii)<br />
Marble goby (Oxyeleotris marmorata)<br />
Giant gourami (Osphronemus goramy)<br />
Rohu (Labeo rohita)<br />
Swamp eel (Monopterus albus)<br />
Moon light gourami (Trichogaster microlepis)<br />
Climbing perch (Anabas testudineus)<br />
Frog (Rana sp.)<br />
S<strong>of</strong>t-shelled turtle (Trionyx cartilageneus)<br />
Others<br />
131 181<br />
5 101<br />
62 123<br />
13 905<br />
265<br />
153 658<br />
8 250<br />
183<br />
30 082<br />
32 583<br />
10<br />
2 282<br />
4 862<br />
50<br />
70<br />
1 164<br />
1 931<br />
2 797<br />
4 381<br />
6 572<br />
945<br />
2 395<br />
21 353<br />
19<br />
316<br />
1 953<br />
0<br />
6<br />
-<br />
0<br />
-<br />
37<br />
-<br />
467<br />
868<br />
1<br />
-<br />
33<br />
1 777<br />
42<br />
2 221<br />
35<br />
2<br />
783<br />
22<br />
0<br />
32<br />
-<br />
0<br />
50<br />
53<br />
-<br />
1<br />
327<br />
-<br />
3<br />
249<br />
20 711<br />
4<br />
82<br />
1<br />
-<br />
4 557<br />
1<br />
10<br />
506<br />
-<br />
16<br />
517<br />
0<br />
-<br />
-<br />
1<br />
12<br />
0<br />
669<br />
Total production 455 981 34 967 5 659 27 102<br />
% <strong>of</strong> total production<br />
Source: Fishery In<strong>for</strong>mation Technology Center (2006)<br />
87.07 6.68 1.08 5.17
Analysis <strong>of</strong> <strong>feeds</strong> <strong>and</strong> <strong>fertilizers</strong> <strong>for</strong> <strong>sustainable</strong> aquaculture development in Thail<strong>and</strong> 315<br />
TABLE 8<br />
Proportion (Percent) <strong>of</strong> total production by species <strong>and</strong> culture intensity in 2004<br />
Species Intensive system Semi-intensive system Extensive system<br />
Nile tilapia 12.9 87.1 -<br />
Common carp - 84.4 15.5<br />
Java barb 0.1 96.3 3.6<br />
Sepat siam - 99.9 0.1<br />
Hybrid catfish 99.3 0.7 -<br />
Snakehead - 99.8 0.2<br />
Sutchi catfish 99.9 - 0.1<br />
Prawn 100.0 - -<br />
Source: Fishery In<strong>for</strong>mation Technology Center (2006)<br />
2.2 Coastal aquaculture<br />
In 2004, the production from coastal aquaculture (736 271 tonnes) accounted <strong>for</strong><br />
approximately 58 percent <strong>of</strong> total aquaculture production (1 259 970 tonnes) (Table 2).<br />
The most important species are shrimps (Penaeus sp.), shellfish, mostly mussels, oysters<br />
<strong>and</strong> cockles, <strong>and</strong> fish such as Asian seabass/barramundi (Lates calcarifer) <strong>and</strong> grouper<br />
(Epinephelus sp.). Shrimp culture is the largest by volume <strong>and</strong> value.<br />
2.2.1 Marine finfish farming<br />
Seabass <strong>and</strong> groupers are the main cultured species in cages <strong>and</strong> earthen ponds. The<br />
production <strong>of</strong> marine finfish (Table 9) from cages (13 823 tonnes, 80.54 percent) exceeds<br />
that from ponds (3 339 tonnes, 19.46 percent) (Fishery In<strong>for</strong>mation Technology Center,<br />
2006). Trash fish is used as a single feed <strong>and</strong> fed once a day in cages. Commercial pellet<br />
<strong>feeds</strong> <strong>for</strong> seabass are now available. However, trash fish is preferred as farmers are<br />
uncertain <strong>of</strong> pr<strong>of</strong>it margins using pelleted <strong>feeds</strong>. Moreover, the weaning <strong>of</strong> fingerlings<br />
<strong>of</strong> marine fishes on <strong>for</strong>mulated <strong>feeds</strong> has not yet been perfected in Thail<strong>and</strong>.<br />
Cage sizes <strong>for</strong> seabass <strong>and</strong> grouper culture vary from 20–50 m 3 , with an average<br />
depth <strong>of</strong> 2 m. Seabass fingerlings are<br />
produced in hatcheries <strong>and</strong> stocked<br />
in cages at densities between 65–<br />
80 fish/m 3 . Trash fish is used as food<br />
once a day at 3–5 percent <strong>of</strong> body weight<br />
(Sakaras, 1986). The grow-out period is<br />
6–8 months, depending on the stocking<br />
size <strong>and</strong> the size at harvest varies from<br />
600–800 g. Average feed conversion ratio<br />
is 7.5:1. Most seabass cages are familyowned<br />
businesses (Figures 4 <strong>and</strong> 5).<br />
TABLE 9<br />
Total production <strong>of</strong> marine finfish <strong>and</strong> the<br />
contribution from cages <strong>and</strong> ponds in 2004<br />
Species<br />
Total<br />
production<br />
(tonnes)<br />
Cage<br />
culture<br />
(tonnes)<br />
Pond<br />
culture<br />
(tonnes)<br />
Seabass 13 588 10 615 2 973<br />
Grouper 3 574 3 208 366<br />
Total 17 162 13 823 3 339<br />
% contribution 80.54 19.46<br />
Source: Fishery In<strong>for</strong>mation Technology Center (2006)<br />
FIGURE 4<br />
Seabass reared in cages <strong>and</strong> fed on chopped trash fish once a day
316<br />
<strong>Study</strong> <strong>and</strong> <strong>analysis</strong> <strong>of</strong> <strong>feeds</strong> <strong>and</strong> <strong>fertilizers</strong> <strong>for</strong> <strong>sustainable</strong> aquaculture development<br />
Seabass <strong>and</strong> grouper production data, value <strong>and</strong> feed use are presented in Tables 10<br />
<strong>and</strong> 11.<br />
FIGURE 5<br />
Seabass cages in Chachoengsao Province.<br />
Cage-reared seabass are usually harvested when they reach marketable size <strong>of</strong> 600–800 g.<br />
TABLE 10<br />
Seabass <strong>and</strong> grouper production (tonnes) <strong>and</strong> feed consumption (tonnes)<br />
Year<br />
Production<br />
Seabass<br />
Feed consumed<br />
Grouper<br />
Total feed<br />
1 Production Feed consumed1 1999 6 056 54 120 1 143 7 339 61 459<br />
2000 7 752 70 040 1 312 8 299 78 339<br />
2001 8 003 72 750 1 443 9 507 82 257<br />
2002 11 032 97 300 1 170 7 794 112 894<br />
2003 12 230 101 300 2 338 15 068 116 368<br />
2004 13 588 108 700 3 574 23 231 131 931<br />
1 Trash fish consumption was calculated by using the average FCRs <strong>of</strong> 7.5 <strong>for</strong> seabass <strong>and</strong> 5.5:1 <strong>for</strong> grouper.<br />
Source: Fishery In<strong>for</strong>mation Technology Center (2006)<br />
TABLE 11<br />
Total value (US$ million) <strong>of</strong> marine finfish culture<br />
Year 1998 1999 2000 2001 2002 2003 2004<br />
Grouper 9 8 9 10 7 12 30<br />
Pond culture 1 2 2 1 1 2 3<br />
Cage culture 8 6 7 9 6 10 27<br />
Seabass 17 16 19 19 26 29 31<br />
Pond culture 3 3 3 3 2 6 76<br />
Cage culture 14 13 16 16 24 23 24<br />
Total value 26 24 28 29 33 41 61<br />
Source: Fishery In<strong>for</strong>mation Technology Center (2006)<br />
2.2.2 Shrimp farming<br />
Shrimp farming in Thail<strong>and</strong> started some 30 years ago with black tiger shrimp (Penaeus<br />
monodon) <strong>and</strong> banana shrimp (P. merguiensis). Shrimp were cultured in large rice<br />
fields <strong>of</strong> more than 4 ha using the traditional methods <strong>of</strong> tidal water exchange via a<br />
sluice gate <strong>and</strong> natural seed supply. Sluice gates were opened during the high tide to<br />
facilitate the entry <strong>of</strong> wild shrimp fry <strong>and</strong> nutrient rich water. Production from these<br />
extensive systems was unreliable <strong>and</strong> this gave rise to the current semi-intensive <strong>and</strong><br />
intensive farming systems. Since the mid-1980s shrimp farming has spread to every<br />
coastal province in the country. In 2003, production from extensive systems was a mere<br />
657 tonnes (0.02 percent <strong>of</strong> total shrimp production), while that from semi-intensive<br />
<strong>and</strong> intensive systems amounted to <strong>and</strong> accounted <strong>for</strong> 4 843 tonnes (1.07 percent) <strong>and</strong><br />
325 225 tonnes (98.34 percent), respectively.
Analysis <strong>of</strong> <strong>feeds</strong> <strong>and</strong> <strong>fertilizers</strong> <strong>for</strong> <strong>sustainable</strong> aquaculture development in Thail<strong>and</strong> 317<br />
The success <strong>of</strong> shrimp farming was<br />
supported by technological breakthroughs in<br />
shrimp hatchery <strong>and</strong> nursery technology <strong>and</strong><br />
feed development. Total shrimp production<br />
has increased from 12 800 tonnes in 1982 to<br />
360 289 tonnes in 2004 (Fishery In<strong>for</strong>mation<br />
Technology Center, 2006). The size <strong>of</strong> ponds<br />
under intensive farming conditions varies from<br />
0.16–1.00 ha <strong>and</strong> these are stocked at densities<br />
ranging from 50–100 PLs/m 2 , usually with<br />
black tiger shrimp. Shrimp are fed at least 4–5<br />
times a day with high-quality commercial <strong>feeds</strong><br />
<strong>and</strong> FCRs vary between 1.25–1.7:1, depending<br />
TABLE 12<br />
Cost <strong>of</strong> shrimp production in 0.16 ha ponds (Thai baht)<br />
Item Fixed Variable Total cost<br />
cost cost<br />
Shrimp PL (100 000 fry) 11 000<br />
Feed cost (40.7% <strong>of</strong> total cost) 52 210<br />
Energy cost (20% <strong>of</strong> total cost) 25 656<br />
Manpower (1 person) 12 000<br />
Maintenance 27 389<br />
Total cost 23 000 105 255 128 255<br />
Stocking density 66 fry/m2 ; survival rate = 45.14%; average<br />
production per 0.16 ha pond = 780 kg;<br />
US$1.00 = Thai baht 40.00<br />
Source: Tookwinas (2001)<br />
on the quality <strong>of</strong> feed <strong>and</strong> efficiency <strong>of</strong> feed management. A typical cost calculation<br />
<strong>for</strong> a shrimp farm is shown in Table 12. Shrimp ponds are normally aerated by paddle<br />
wheels or air/oxygen injectors are employed to maintain oxygen levels above 5 mg/l.<br />
To address environmental problems culture systems have now evolved to zero<br />
discharge systems (Tunsutapanit et al., 1996), in which wastewater is treated <strong>and</strong> reused in<br />
the grow-out ponds. Regulations have also been introduced <strong>for</strong> shrimp farm registration<br />
<strong>and</strong> effluent regulation to mitigate against negative effects <strong>of</strong> shrimp farms on the<br />
coastal environment. The Department <strong>of</strong> Fisheries (DoF), Thail<strong>and</strong> has also introduced<br />
several programs to promote the production <strong>of</strong> quality shrimp to safeguard consumers<br />
<strong>and</strong> to prevent export rejections (Tookwinas <strong>and</strong> Keerativiriyaporn, 2004), namely the<br />
“Guideline <strong>for</strong> Good Aquaculture Practice” (GAP) <strong>and</strong> the Code <strong>of</strong> Conduct (CoC).<br />
GAP emphasizes the production <strong>of</strong> shrimp that are fresh, clean, drug residue free <strong>and</strong><br />
not contaminated with disease <strong>and</strong> dirt. The CoC guidelines were developed on the<br />
philosophy <strong>of</strong> environmentally <strong>sustainable</strong> shrimp culture <strong>and</strong> the hygienic production<br />
<strong>of</strong> shrimp that are safe <strong>for</strong> consumers, in accordance with CODEX, ISO14001/(EMS)<br />
<strong>and</strong> the FAO Code <strong>of</strong> Conduct <strong>for</strong> Responsible Fisheries. These initiatives have been<br />
implemented to increase consumer confidence in the quality <strong>and</strong> safety <strong>of</strong> Thai shrimp,<br />
to promote environmentally responsible shrimp farming in Thail<strong>and</strong> <strong>and</strong> <strong>for</strong> the benefit<br />
<strong>and</strong> protection <strong>of</strong> farmers (Songsangjinda <strong>and</strong> Tatttanon, 2004).<br />
The CoC guidelines are also a strategic development to comply with international<br />
requirements <strong>of</strong> the world shrimp market. These development programs have been<br />
effectively monitored through HACCP throughout the country (Tookwinas, 2002).<br />
Residues in cultured shrimp are also monitored be<strong>for</strong>e harvesting <strong>and</strong> certified <strong>for</strong> both<br />
export <strong>and</strong> local consumption.<br />
The followings measures are taken <strong>for</strong> controlled <strong>and</strong> safe shrimp production in<br />
Thail<strong>and</strong>.<br />
1. Registration <strong>of</strong> farms<br />
2. Technical assistance <strong>for</strong> the controlled use <strong>of</strong> <strong>feeds</strong>/antibiotics<br />
3. Monitoring <strong>of</strong> residues in farmed shrimp<br />
4. Mobile control unit to monitor diseases <strong>and</strong> the use <strong>of</strong> antibiotics <strong>and</strong> <strong>feeds</strong><br />
5. Monitoring water quality <strong>of</strong> both inlet <strong>and</strong> outlet <strong>of</strong> farms<br />
6. Inspection <strong>of</strong> farm hygiene <strong>and</strong> post-harvest h<strong>and</strong>ling practices<br />
7. Training farmers on GAP, safe uses <strong>of</strong> chemotherapeutic agents <strong>and</strong> h<strong>and</strong>ling<br />
practices<br />
3. REVIEW AND ANALYSIS OF AQUACULTURE FEEDS AND FEEDING<br />
Thail<strong>and</strong> produces <strong>for</strong>mulated <strong>feeds</strong> <strong>for</strong> herbivorous fish, carnivorous fish <strong>and</strong><br />
shrimp. Commercial pellet <strong>feeds</strong> are commonly used in shrimp aquaculture, but are<br />
not well accepted by fish farmers who still largely rely on farm-made <strong>feeds</strong>. This is<br />
mainly due to the low value <strong>of</strong> most fish. However, recent fuel price increases have
318<br />
<strong>Study</strong> <strong>and</strong> <strong>analysis</strong> <strong>of</strong> <strong>feeds</strong> <strong>and</strong> <strong>fertilizers</strong> <strong>for</strong> <strong>sustainable</strong> aquaculture development<br />
affected the price <strong>of</strong> trash fish <strong>and</strong> other feed ingredients normally used in farm-made<br />
<strong>feeds</strong>. Hence, farmers are trying to develop new <strong>for</strong>mulations <strong>and</strong> feed management<br />
practices to reduce the cost <strong>of</strong> production. For herbivorous fish, pond fertilization<br />
with animal manures is practiced to increase natural food production. However, the<br />
high competition <strong>for</strong> organic <strong>fertilizers</strong> from agriculture has reduced the availability <strong>of</strong><br />
<strong>fertilizers</strong> <strong>for</strong> fish farming.<br />
3.1 Feed <strong>and</strong> feed ingredients<br />
In Thail<strong>and</strong>, feed ingredients <strong>and</strong> commercial <strong>feeds</strong> are expensive. Feed generally<br />
accounts <strong>for</strong> more than 60 percent <strong>of</strong> the total production cost, especially <strong>for</strong><br />
freshwater fish. In the past, chopped trash fish was the principal feed ingredient <strong>of</strong><br />
choice (Jantrarotai <strong>and</strong> Jantrarotai, 1994; Sitasit, 1994; Thongrod, Jintasataporn <strong>and</strong><br />
Boonyaratpalin, 2004). However, because <strong>of</strong> the low farm gate value <strong>of</strong> fish <strong>and</strong> the<br />
escalating price <strong>of</strong> trash fish farmers have changed to poultry by-products or other<br />
TABLE 13<br />
Nutritional value <strong>of</strong> some feed ingredients used in aquafeed in Thail<strong>and</strong><br />
Nutritional value (% dry matter)<br />
Ingredients<br />
Moisture<br />
Crude<br />
protein<br />
Crude lipid Ash Crude fibre NFE * Source <strong>of</strong><br />
in<strong>for</strong>mation<br />
Feed ingredients <strong>of</strong> animal origin<br />
Fishmeal (Thai origin) 50%<br />
crude protein (CP)<br />
10.0 49.1 - - - - 1<br />
Fishmeal 55% CP 8.0 55.0 8.0 26.0 1.0 2.2 1<br />
Fishmeal 60% CP 8.0 60.0 10.0 19.0 - 3.0 1<br />
Squid by-product 8.1 74.8 8.8 3.4 - 4.9 3<br />
Shrimp head meal 10.0 41.8 4.3 34.0 9.9 - 1<br />
Mackerel viscera 69.0 16.0 12.0 - - - 3<br />
Chicken by-product meal 6.5 57.5 15.0 15.6 2.3 3.1 3<br />
Chicken head 38.8 26.9 26.4 7.6 0.3 - 3<br />
Chicken viscera 73.7 13.9 11.2 1.2 - - 3<br />
Poultry feather meal 10.0 83.5 2.5 2.5 1.5 - 1<br />
Meat <strong>and</strong> bone meal 7.4 49.1 10.3 29.9 2.6 0.7 3<br />
Blood meal<br />
Feed ingredients <strong>of</strong> plant origin<br />
10.4 81.5 1.0 4.8 0.7 1.6 3<br />
Rice hull 10.0 12.2 11.8 13.1 12.3 40.6 3<br />
Defatted rice hull 9.0 13.9 1.0 15.0 13.0 48.1 1<br />
Rice bran 12.0 8.0 0.9 0.7 1.0 77.4 1<br />
Soybean meal, full fat 5.9 36.2 19.8 4.6 5.5 28.0 2<br />
Soybean meal, defatted 11.8 44.6 1.5 5.8 6.1 30.3 2<br />
Soybean protein concentrate 9.3 61.3 0.4 5.5 5.6 17.9 2<br />
Soybean hull (grade 1) 10.0 42.0 4.7 5.7 6.7 30.9 3<br />
Soybean hull (grade 2) 10.0 44.0 1.0 6.0 7.0 32.0 1<br />
Soybean hull (grade 3) 10.0 48.5 1.0 6.0 3.5 31.0 1<br />
Spirulina meal 6.0 66.4 0.4 6.4 9.4 11.5 2<br />
Mung bean hull 10.8 18.4 1.7 3.4 17.8 47.8 2<br />
Palm oil kernel 10.0 18.5 1.5 3.6 14.2 52.2 1<br />
Peanut hull 7.0 48.0 5.8 5.1 7.0 27.1 3<br />
Cassava 13.5 2.2 0.5 5.0 3.0 75.8 3<br />
Cassava leaf 12.0 19.0 5.6 7.0 26.0 30.4 1<br />
Corn grain 12.2 9.6 3.9 1.5 2.0 70.8 1<br />
Corn meal 11.2 9.4 0.2 1.2 0.8 77.2 3<br />
Coconut by-product 10.0 21.0 6.0 7.0 12.0 44.0 1<br />
Lupin leaf 10.0 20.2 3.5 8.8 18.0 39.5 1<br />
Distiller waste<br />
Green fodders<br />
10.0 26.0 6.0 4.0 12.0 42.0 1<br />
Duckweed 91.9 1.7 0.5 0.9 0.9 4.0 3<br />
Water lettuce (Pistia stratiotes) 91.9 1.2 0.4 - 1.8 2.9 3<br />
Alligator weed (Alternanthera sp.) 77.5 3.2 0.8 - 2.6 11.6 3<br />
Water hyacinth (Eichhornia sp.) 94.9 1.0 0.2 - 0.9 1.8 1<br />
*Nitrogen-free extract<br />
Source: 1 Kasetsart University (1999); 2 Boonyaratpalin et al. (2003); 3 Sitasit et al. (1982)
Analysis <strong>of</strong> <strong>feeds</strong> <strong>and</strong> <strong>fertilizers</strong> <strong>for</strong> <strong>sustainable</strong> aquaculture development in Thail<strong>and</strong> 319<br />
industrial food wastes. Many ingredients are used <strong>for</strong> farm-made <strong>feeds</strong> <strong>and</strong> commercial<br />
<strong>feeds</strong>. Except <strong>for</strong> soybean meal, these ingredients are locally available. Soybean meal<br />
is imported from the United States <strong>of</strong> America <strong>and</strong> China <strong>and</strong> is used mainly <strong>for</strong><br />
the production <strong>of</strong> nutritionally complete commercial <strong>feeds</strong>. The nutritional value <strong>of</strong><br />
selected feed ingredients commonly used in Thail<strong>and</strong> is presented in Table 13. For<br />
marine fish farming, trash fish is still used as a single feed <strong>for</strong> both the nursery stage<br />
<strong>and</strong> <strong>for</strong> grow-out. The DoF is presently promoting the replacement <strong>of</strong> trash fish with<br />
commercial <strong>feeds</strong> <strong>for</strong> the rearing <strong>of</strong> marine fish species.<br />
3.2 Freshwater fish feeding practices<br />
3.2.1 Herbivorous fish<br />
Most herbivorous fish are cultured in extensive or semi-intensive systems, except <strong>for</strong><br />
tilapia. Aquaculture <strong>of</strong> herbivorous fish in extensive culture system primarily depends<br />
upon natural food produced by fertilization with organic manure, inorganic fertilizer<br />
or a combination <strong>of</strong> both. Commonly used pond fertilization practices are presented<br />
in Table 14.<br />
Chicken manure is expensive <strong>and</strong> is now <strong>of</strong>ten unavailable <strong>for</strong> fish farming. This<br />
is due to the bird flu (Highly Pathogenic Avian Influenza) disease outbreak in 2003.<br />
This has negatively affected integrated fish farming. Chicken manure is currently only<br />
available from large industrial farms in Thail<strong>and</strong> <strong>and</strong> these are bio-secure systems.<br />
Feeds such as rice bran are evenly distributed over the pond or put in feeding bags.<br />
Under semi-intensive <strong>and</strong> intensive farming conditions compound <strong>feeds</strong> that consist<br />
<strong>of</strong> aquatic plants, rice bran, broken rice, trash fish or poultry by-product are provided<br />
in feeding bags. The mixtures are also<br />
cooked <strong>and</strong> processed into wet dough,<br />
extruded through a meat mincer <strong>and</strong><br />
fed in a moist <strong>for</strong>m or sun dried.<br />
Tilapia cage culture<br />
Tilapia cage-culture systems are<br />
described by Sihapitakgiat et al (2000).<br />
Cage volumes vary from 25–40 m 3<br />
with an average depth <strong>of</strong> 2 m. Tilapia<br />
fingerlings are stocked into the cages at<br />
between 25–100 g. The rearing period<br />
varies from 3–5 months, depending<br />
on size. Fish are fed with floating<br />
catfish pellets twice per day. A feeding<br />
schedule <strong>for</strong> tilapia is illustrated in<br />
Table 15.<br />
The average weight <strong>of</strong> tilapia at<br />
harvest varies between 800 g <strong>and</strong> 1.2 kg<br />
<strong>and</strong> FCRs range from 1.24–1.5:1,<br />
depending on feed quality. The farmgate<br />
value <strong>of</strong> tilapia depends on fish<br />
size <strong>and</strong> type <strong>of</strong> culture (Table 16). The<br />
price <strong>of</strong> cage-cultured tilapia is double<br />
that <strong>of</strong> fish reared in ponds. FCRs in<br />
pond culture are between 1.7–1.8:1.<br />
The difference in FCR is a consequence<br />
<strong>of</strong> the protein levels, which under pond<br />
farming conditions are lower than that<br />
<strong>of</strong> the <strong>feeds</strong> fed to fish in cages.<br />
TABLE 14<br />
Pond fertilization practices in Thail<strong>and</strong><br />
Type <strong>of</strong> fertilizer Rate <strong>of</strong> application<br />
Lime (Ca(OH) 2) 200 g/m2 Organic fertilizer<br />
- chicken, duck or<br />
125–250 g/m<br />
buffalo manure<br />
2<br />
Crop waste, rice straw 5 truck<br />
container/ha<br />
Inorganic fertilizer<br />
- urea 2–3 g/m2 Source: farmer interview<br />
TABLE 15<br />
Feeding schedule <strong>for</strong> tilapia cage culture<br />
Stocking<br />
size<br />
Rearing<br />
period<br />
Feed no. Protein<br />
content<br />
(%)<br />
Average<br />
weight (g) at<br />
harvest<br />
25 g 1 month 1 32<br />
2–3 months 2 30<br />
4–5 months 3 25 800–1 200 1.24–1.5<br />
40 g 57 days 3 25 200<br />
130 days 3 25 625<br />
100 g 3 month 3 25 600<br />
Source: farmer interview<br />
TABLE 16<br />
Farm-gate price <strong>of</strong> tilapia reared in cages <strong>and</strong> in<br />
ponds<br />
Size <strong>of</strong> fish (g) Cage culture<br />
(US$/kg)<br />
Pond culture<br />
(US$/kg)<br />
Less than 600 g 0.75 0.38<br />
600–800 0.95 0.63<br />
800–1200 1.00–1.05 0.75<br />
Source: farmer interview<br />
FCR
320<br />
<strong>Study</strong> <strong>and</strong> <strong>analysis</strong> <strong>of</strong> <strong>feeds</strong> <strong>and</strong> <strong>fertilizers</strong> <strong>for</strong> <strong>sustainable</strong> aquaculture development<br />
Climbing perch (Anabas sp.) culture<br />
Pond culture <strong>of</strong> climbing perch (Anabas spp.) is becoming increasingly popular. It is easy<br />
to manage in small ponds, ranging between 400–1 600 m 2 . Advantages <strong>of</strong> climbing perch<br />
culture include a short culture period <strong>of</strong> three months, high production <strong>and</strong> high value.<br />
Fry are stocked at 1 cm in length at about 20 fingerlings/m 2 . They are fed with catfish<br />
feed <strong>for</strong> three months <strong>and</strong> reach 70–150 g with a total production <strong>of</strong> 700–800 kg/400 m 2<br />
pond. Feed conversion ratio varies between 1.4–1.5:1 <strong>and</strong> the farm-gate price depends<br />
on size, ranging from US$0.63 <strong>for</strong> 75 g fish to US$1.75/kg <strong>for</strong> 170 g fish. It is likely that<br />
aquaculture <strong>of</strong> climbing perch will increase substantially in the near future.<br />
3.2.2 Carnivorous <strong>and</strong> omnivorous fish<br />
The most important carnivorous <strong>and</strong> omnivorous freshwater fish are hybrid clariid<br />
catfish, snakehead <strong>and</strong> sutchi catfish. Culture systems vary according to the intensity <strong>of</strong><br />
inputs <strong>and</strong> stocking density <strong>and</strong> the type <strong>of</strong> culture system adopted (e.g. monoculture,<br />
polyculture or integrated fish culture) depends on the chosen species. Omnivorous<br />
species like tilapia, Java barb, common carp, Chinese carp <strong>and</strong> mrigal are polycultured,<br />
while carnivorous species like clariid catfish, snakehead, sutchi catfish, freshwater<br />
prawns <strong>and</strong> s<strong>and</strong> goby are generally chosen <strong>for</strong> monoculture (Dey, Paraguguas <strong>and</strong><br />
Alam, 2001).<br />
Catfish grow-out ponds are between 300–2 000 m 2 <strong>and</strong> 1–1.5 m deep. Fingerlings<br />
<strong>of</strong> 2–3 cm are stocked at 40–100 fish/m 2 , depending upon availability <strong>and</strong> price, as well<br />
as the intended production practice (Jantrarotai <strong>and</strong> Jantrarotai, 1994). Juvenile fish<br />
are fed mainly on <strong>for</strong>mulated pellet, whereafter farmers switch to cheaper farm-made<br />
<strong>feeds</strong>. These consist <strong>of</strong> trash fish, cooked broken rice <strong>and</strong> rice bran or <strong>of</strong> chicken viscera,<br />
chicken head <strong>and</strong> bones <strong>and</strong> rice ban (Kosutarak, 1999). The composition <strong>of</strong> typical<br />
farm-made <strong>feeds</strong> is shown in Table 17. Thongutai (1969) reported superior growth <strong>of</strong><br />
fish fed with farm-made <strong>feeds</strong> containing trash fish <strong>and</strong> rice bran (9:1) in comparison to<br />
those fed on pelleted feed only, in which fishmeal <strong>and</strong> soybean meal were used as protein<br />
sources. Na-nakorn (1995) recommended that fresh feed should be used as a supplement<br />
TABLE 17<br />
Typical <strong>for</strong>mulation <strong>of</strong> a farm-made hybrid clariid catfish feed (perecent as fed basis)<br />
Ingredients (%) Nutritional value (%)<br />
Formula<br />
Distillers<br />
waste<br />
Chicken<br />
bone<br />
Chicken<br />
head<br />
Chicken<br />
viscera<br />
By-product<br />
from soy<br />
sauce<br />
Crude protein<br />
(%)<br />
Crude lipid<br />
(%)<br />
Cost <strong>of</strong> feed<br />
(baht/kg)<br />
1 12 - - 80 8 17.4 6.1 2.13<br />
2 8 - 4 80 8 17.6 6.8 2.21<br />
3 8 - 8 76 8 18.0 7.6 2.34<br />
4 8 - 12 72 8 18.4 8.4 2.47<br />
5 8 - 16 68 8 18.8 9.3 2.60<br />
6 16 - - 76 8 17.6 6.2 2.18<br />
7 12 - 4 76 8 17.8 6.9 2.26<br />
8 12 - 8 72 8 18.2 7.7 2.39<br />
9 12 - 12 68 8 18.6 8.5 2.52<br />
10 12 - 16 64 8 19.0 9.3 2.65<br />
11 20 - - 72 8 17.8 6.2 2.23<br />
12 8 12 - 72 8 17.6 6.1 2.35<br />
13 8 16 - 68 8 17.7 6.2 2.44<br />
14 8 20 - 64 8 17.8 6.2 2.53<br />
15 12 12 - 68 8 17.8 6.2 2.40<br />
16 12 16 - 64 8 17.9 6.2 2.49<br />
17 12 20 - 60 8 18.0 6.3 2.58<br />
18 - 20 - 72 8 17.4 6.0 2.43<br />
19 - - 20 72 8 18.8 9.9 2.63<br />
20 - 16 12 64 8 18.5 8.4 2.73<br />
Source: Surasak farm, Nakhon Ratchasima Province
Analysis <strong>of</strong> <strong>feeds</strong> <strong>and</strong> <strong>fertilizers</strong> <strong>for</strong> <strong>sustainable</strong> aquaculture development in Thail<strong>and</strong> 321<br />
to floating pellets. A <strong>for</strong>mulated pellet feed <strong>for</strong><br />
catfish (NIFI 12), containing 56 percent fishmeal,<br />
12 percent dehulled peanut meal, 12 percent rice<br />
bran, 14 percent starch, 4 percent fish oil, 1 percent<br />
vitamin <strong>and</strong> mineral premix <strong>and</strong> 0.4 percent binder<br />
is available on the market (Sitasit, 1985). The average<br />
FCR obtained on <strong>for</strong>mulated pellets ranges from<br />
1.5–2:1. The rearing period is between 3 <strong>and</strong> 6<br />
months depending on the intended harvest size,<br />
which ranges between 100 <strong>and</strong> 300g <strong>and</strong> production<br />
TABLE 18<br />
Rearing costs <strong>of</strong> hybrid clariid<br />
catfish in a 0.8 ha pond<br />
Total production 5 000 kg<br />
Survival rate 80%<br />
Average fish size 250 g<br />
Farm-gate price US$0.7/kg<br />
Total farm gate value US$3 500<br />
Total feed cost US$2 045<br />
Pr<strong>of</strong>it US$1 456<br />
Source: farmer interview<br />
TABLE 19<br />
Feed <strong>and</strong> feeding practices <strong>for</strong> a typical 1 rai sutchi catfish pond stocked with 10 000 fingerlings<br />
Age Feeding duration Type <strong>of</strong> feed Amount <strong>of</strong> feed<br />
1–15 days 2 weeks Floating pellet 5–10 kg in total (2 weeks)<br />
2 weeks Chicken bone 50 kg/day<br />
2 months 1 month Chicken bone 50 kg/day<br />
Commercial feed 5 kg every other day<br />
3 months 1 month Chicken bone 100 kg/day<br />
Commercial feed 5 kg every other day<br />
4 months 1 month Chicken bone 150 kg every other day<br />
Commercial feed 5 kg every other day<br />
5 months 1 month Chicken bone 200 kg every other day<br />
Commercial feed 5 kg every other day<br />
6 months 1 month Chicken bone 200 kg every other day<br />
Commercial feed 5 kg every other day<br />
Source: farmers’ interview<br />
TABLE 20<br />
Feed use <strong>and</strong> cost <strong>for</strong> a 1 rai sutchi catfish pond stocked with 10 000 fingerlings<br />
Feeding duration<br />
Chicken bone<br />
Amount (kg) Price (US$)<br />
Commercial feed<br />
Amount (kg) Price (US$)<br />
1st month 1 500 150 5–10 2.5–4.5<br />
2nd month 3 000 300 75 33.75<br />
3rd month 3 000 300 75 33.75<br />
4th month 2 250 225 75 33.75<br />
5th month 3 000 300 75 33.75<br />
6th month 3 000 300 75 33.75<br />
Total 15 750 1 575 450 171–173.25<br />
Source: farmers’ interview<br />
levels <strong>of</strong> between 10–14 tonnes/rai are normally achieved. A catfish feeding schedule has<br />
been developed by the DoF that farmers have adapted according to their experiences.<br />
Generally the fish are fed twice a day on a ration that decreases from around 40 percent<br />
biomass per day to between 3 <strong>and</strong> 4 percent <strong>of</strong> biomass at the end <strong>of</strong> the growing<br />
period. Summary in<strong>for</strong>mation including total production, feed cost <strong>and</strong> farm gate value<br />
is presented in Table 18.<br />
Sutchi catfish (Pangasius hypophthalmus) farming<br />
Sutchi catfish culture is widely practiced in central Thail<strong>and</strong>. The fingerlings (3 cm<br />
average length) are stocked in 0.16 ha (1 rai), 2 m deep earthen ponds, at a density<br />
<strong>of</strong> 6.25 fingerlings/m 2 . Feed type <strong>and</strong> feeding practices <strong>and</strong> feed use <strong>and</strong> costs are<br />
described in Tables 19 <strong>and</strong> 20, respectively. The average FCR obtained on poultry byproduct<br />
is 3.33:1, average size at harvest after 6 months is 1.5–2 kg <strong>and</strong> total production<br />
is about 5 tonnes/rai. The average farm-gate price in 2005 was US$0.55/kg. Ponds are<br />
<strong>of</strong>ten fertilized with pig manure at 1 200 l (wet weight) per week.
322<br />
TABLE 21<br />
Ingredient composition <strong>and</strong> nutrient content <strong>of</strong> feed<br />
commonly used <strong>for</strong> larvae <strong>of</strong> clariid catfish 1 <strong>and</strong> tilapia fry<br />
(percent as fed basis)<br />
Ingredients Catfish<br />
larvae<br />
<strong>Study</strong> <strong>and</strong> <strong>analysis</strong> <strong>of</strong> <strong>feeds</strong> <strong>and</strong> <strong>fertilizers</strong> <strong>for</strong> <strong>sustainable</strong> aquaculture development<br />
Catfish<br />
larvae<br />
Catfish /<br />
tilapia<br />
larvae<br />
15<br />
10<br />
0<br />
65<br />
7<br />
1<br />
2<br />
-<br />
Tilapia<br />
larvae<br />
Cassava starch<br />
Rice bran<br />
Wheat gluten<br />
Fishmeal<br />
Fish oil<br />
Di-calcium phosphate<br />
Premix2 Binder3 - 15<br />
15<br />
- 3<br />
30<br />
25 0<br />
0<br />
50 72<br />
47<br />
7 7<br />
5<br />
1 1<br />
1<br />
2 2<br />
2<br />
15 -<br />
-<br />
Total 100 100 100 100<br />
Calculated nutritional composition<br />
Crude protein<br />
45.0 40.0 37.5 30.0<br />
Crude lipid<br />
10.9 12.5 12.0 10.0<br />
Ash<br />
12.1 18.3 17.6 16.3<br />
Crude fibre<br />
0.7 1.6 2.2 3.8<br />
NFE<br />
24.9 19.6 22.2 31.6<br />
Energy (kcal/kg) 3 000 3 000 3 000 2 800<br />
Feed cost (baht/kg) 39.96 19.15 18.13 15.1<br />
1 Both walking catfish <strong>and</strong> hybrid catfish<br />
2 Vitamin <strong>and</strong> mineral premix <strong>for</strong> freshwater fish are commercially<br />
produced <strong>and</strong> sold in the market<br />
3 Binder included primarily cassava starch <strong>and</strong> rice flour.<br />
Source: Thongrod, Jintasataporn <strong>and</strong> Boonyaratpalin (2004)<br />
4. FEED MANAGEMENT STRATEGIES<br />
In both semi-intensive <strong>and</strong> intensive<br />
farming, feed is the most important<br />
<strong>and</strong> expensive input. The production<br />
<strong>and</strong> supply <strong>of</strong> poultry by-products has<br />
been constrained by the changes that<br />
the industry has had to make after the<br />
outbreak <strong>of</strong> bird flu in 2003. This has also<br />
influenced aquaculture as the dem<strong>and</strong> <strong>for</strong><br />
poultry <strong>of</strong>fal is increasing in response to<br />
the declining availability <strong>and</strong> increasing<br />
price <strong>of</strong> trash fish in many parts <strong>of</strong> the<br />
country.<br />
The major problems surrounding the<br />
use <strong>of</strong> farm-made <strong>feeds</strong> are associated<br />
with the quality <strong>and</strong> supply <strong>of</strong> primary<br />
ingredients. Farmers find it extremely<br />
difficult to control the quality <strong>of</strong> the<br />
<strong>feeds</strong> they produce, which results<br />
in unpredictable production <strong>and</strong><br />
environmental pollution. Farm-made<br />
<strong>feeds</strong> consist <strong>of</strong> trash fish or poultry <strong>of</strong>fal<br />
or both, cooked broken rice, rice bran,<br />
soybean meal, agricultural by-products<br />
<strong>and</strong> vitamin <strong>and</strong> mineral premixes. Most<br />
farmers now use poultry by-products as the primary ingredient, which in most<br />
instances has to be delivered on a daily basis, as they do not have appropriate cold<br />
storage facilities. Farmers can also choose from a number <strong>of</strong> different fishmeal based<br />
<strong>for</strong>mulations developed by the DoF <strong>and</strong> other research institutions. Some <strong>of</strong> these<br />
are shown in Tables 21, 22 <strong>and</strong> 23. Catfish fingerling <strong>feeds</strong> are <strong>of</strong>ten <strong>for</strong>tified with<br />
mackerel viscera, which acts as an attractant resulting in improved FCRs. Feed bags<br />
TABLE 22<br />
Farm-made practical feed <strong>for</strong>mulation <strong>for</strong> clariid catfish1 (percent as fed basis)<br />
Ingredient composition/ fish size<br />
Ingredients<br />
Dried cassava meal<br />
Coconut by-product<br />
Rice bran<br />
Soybean meal<br />
Fishmeal<br />
Lupin leaf<br />
Fish oil<br />
Di-calcium phosphate<br />
Vitamin <strong>and</strong> mineral premix<br />
Fingerling<br />
(1st 3 months)<br />
26<br />
-<br />
-<br />
41<br />
25<br />
-<br />
5<br />
1<br />
2<br />
Grow-out 1<br />
(2nd 3 months)<br />
22<br />
-<br />
15<br />
32<br />
20<br />
5<br />
3<br />
1<br />
2<br />
Grow-out 2<br />
(3rd 3 months)<br />
22<br />
20<br />
-<br />
32<br />
20<br />
-<br />
3<br />
1<br />
2<br />
Total<br />
Nutritional composition<br />
100 100 100<br />
Protein<br />
32.00<br />
28.00<br />
28.00<br />
Lipid<br />
8.02<br />
6.28<br />
6.66<br />
Ash<br />
11.69<br />
11.93<br />
10.73<br />
Fibre<br />
3.62<br />
5.44<br />
5.28<br />
Gross energy (kcal/kg)<br />
2 800<br />
2 700<br />
2 600<br />
Feed cost (Baht/kg)<br />
11.86<br />
10.18<br />
9.78<br />
1 Both walking catfish <strong>and</strong> hybrid catfish<br />
Source: Thongrod, Jintasataporn <strong>and</strong> Boonyaratpalin (2004)
Analysis <strong>of</strong> <strong>feeds</strong> <strong>and</strong> <strong>fertilizers</strong> <strong>for</strong> <strong>sustainable</strong> aquaculture development in Thail<strong>and</strong> 323<br />
TABLE 23<br />
Farm made practical feed <strong>for</strong>mula <strong>for</strong> tilapia <strong>and</strong> other herbivorous fish (percent as fed basis)<br />
Ingredient composition/ fish size<br />
Ingredients<br />
Dried cassava meal<br />
Coconut meal<br />
Rice bran<br />
Soybean meal<br />
Fishmeal<br />
Lupin leaf<br />
Fish oil<br />
Di-calcium phosphate<br />
Vitamin <strong>and</strong> mineral premix<br />
are also used to reduce wastage, particularly<br />
in tilapia culture. Two recommended feed<br />
<strong>for</strong>mulations <strong>for</strong> seabass <strong>and</strong> marine shrimp<br />
are shown in Tables 24 <strong>and</strong> 25, respectively.<br />
TABLE 24<br />
Recommended feed <strong>for</strong>mulae <strong>for</strong> seabass<br />
(Lates calcarifer) (percent as fed basis)<br />
Ingredients Percentage composition<br />
Formula 1 Formula 2<br />
Thai fishmeal 63.0 70.0<br />
Rice bran - 9.0<br />
Shrimp head meal 6.8 -<br />
Soybean meal 11.9 -<br />
Alpha starch/wheat gluten 6.0 12.4<br />
Tuna oil 4.5 1.5<br />
Soybean oil 4.5 3.0<br />
Trace mineral premix 2.0 2.0<br />
Vitamin premix 1.0 2.0<br />
Vitamin C 0.1 0.1<br />
Sodium monophosphate 0.2 -<br />
Total<br />
Proximate composition (%)<br />
100.0 100.0<br />
Moisture 7.40 6.48<br />
Crude protein 44.23 41.8<br />
Crude lipid 13.91 9.64<br />
Ash 18.57 16.66<br />
Crude fibre 2.19 0.87<br />
NFE 13.71 24.56<br />
Source: Boonyaratpalin (1991)<br />
Fingerling<br />
to 2-4 months<br />
23<br />
-<br />
15<br />
30<br />
25<br />
-<br />
4<br />
1<br />
2<br />
Grow-out<br />
(cage)<br />
23<br />
-<br />
20<br />
25<br />
25<br />
-<br />
4<br />
1<br />
2<br />
Grow-out 1<br />
(pond)<br />
35<br />
-<br />
15<br />
25<br />
20<br />
-<br />
2<br />
1<br />
2<br />
Grow-out 2<br />
(pond)<br />
22<br />
30<br />
-<br />
25<br />
20<br />
-<br />
-<br />
1<br />
2<br />
Total<br />
Nutritional composition<br />
100 100 100 100<br />
Crude protein<br />
31.00<br />
30.00<br />
26.80<br />
29.86<br />
Crude lipid<br />
7.44<br />
7.53<br />
5.01<br />
4.11<br />
Ash<br />
12.57<br />
12.76<br />
11.40<br />
10.67<br />
Crude fibre<br />
4.25<br />
4.40<br />
4.20<br />
6.05<br />
NFE<br />
35.80<br />
36.30<br />
42.88<br />
40.22<br />
Gross energy (kcal/kg)<br />
2 700<br />
2 700<br />
2 500<br />
2 500<br />
Feed cost (Baht/kg)<br />
11.30<br />
10.65<br />
9.36<br />
8.50<br />
Source: Thongrod, Jintasataporn <strong>and</strong> Boonyaratpalin (2004)<br />
TABLE 25<br />
Recommended feed <strong>for</strong>mulae <strong>for</strong> grow out <strong>of</strong> black<br />
tiger shrimp (Penaeus monodon) (percent as fed basis)<br />
Ingredients<br />
Percentage composition<br />
Formula 1 Formula 2<br />
Thai fishmeal 28.0 33.0<br />
Shrimp head meal 10.0 10.0<br />
Squid visceral meal 4.0 4.0<br />
Soybean meal 20.0 16.0<br />
Wheat gluten 5.0 7.0<br />
Wheat flour 20.0 -<br />
Tuna oil 2.5 0.5<br />
Vitamin Premix 2.0 2.0<br />
Trace Mineral Premix 2.0 2.5<br />
Vitamin C 0.48 0.1<br />
BHT 0.02 -<br />
Lecithin 1.0 -<br />
Binder - 1.5<br />
Rice bran 5.0 23.4<br />
Total<br />
Calculated proximate composition (%)<br />
100.0 100.0<br />
Moisture 10.49 9.24<br />
Crude protein 37.02 43.29<br />
Crude lipid 7.53 5.77<br />
Ash 10.47 14.39<br />
Crude fibre 2.46 4.38<br />
NFE 32.04 22.93<br />
Source: Manual <strong>for</strong> feed preparation, Department <strong>of</strong> Fisheries,<br />
adopted from Boonyaratpalin <strong>and</strong> New (1994)
324<br />
<strong>Study</strong> <strong>and</strong> <strong>analysis</strong> <strong>of</strong> <strong>feeds</strong> <strong>and</strong> <strong>fertilizers</strong> <strong>for</strong> <strong>sustainable</strong> aquaculture development<br />
TABLE 26<br />
Nutritional value (%) <strong>of</strong> <strong>feeds</strong> under legislative control in Thail<strong>and</strong><br />
Feed Form <strong>of</strong> feed<br />
Marine shrimp feed<br />
- Zoea – Mysis stage<br />
- Mysis stage<br />
- Post larvae 1–5 (P1– P5)<br />
- Post larvae 5–15 (P 5–P 15)<br />
- Juvenile (1.2–2.5 cm)<br />
- Juvenile (2.5–3.5 cm)<br />
- Juvenile (1–3 g)<br />
- Fingerling (3–12 g)<br />
- Medium shrimp (12–30 g)<br />
- Large shrimp (> 30 g)<br />
Powder<br />
Flake<br />
Powder<br />
Flake<br />
Powder<br />
Flake<br />
Flake<br />
Crumble<br />
Pellet<br />
Pellet<br />
Pellet<br />
Pellet<br />
Pellet<br />
Pellet<br />
Size <strong>of</strong> feed<br />
particle<br />
38<br />
>38<br />
>38<br />
>36<br />
>35<br />
>35<br />
Supplementary shrimp feed Pellet Not defined >32 >3 300 g fish<br />
Crumble<br />
Pellet<br />
Pellet<br />
Pellet<br />
Pellet<br />
Pellet<br />
Pellet<br />
Powder<br />
Pellet<br />
Pellet<br />
Pellet<br />
Powder<br />
Crumble/pellet<br />
Pellet<br />
Not defined<br />
Not defined<br />
Not defined<br />
Not defined<br />
Not defined<br />
Not defined<br />
Not defined<br />
>37<br />
>30<br />
>25<br />
>25<br />
>28<br />
>25<br />
>20<br />
Not defined >35<br />
>35<br />
>30<br />
>28<br />
>24<br />
Powder Sinking feed<br />
Crumble/PelletSinking<br />
feed<br />
Pellet<br />
>40<br />
>37<br />
>35<br />
>30<br />
>42<br />
>40<br />
>38<br />
>35<br />
>6<br />
>6<br />
>6<br />
>6<br />
>5<br />
>5<br />
>5<br />
>4<br />
>4<br />
>3<br />
>5<br />
>4<br />
>3<br />
>3<br />
>3<br />
>3<br />
>3<br />
>5<br />
>4<br />
>4<br />
>3<br />
>3<br />
>3<br />
>4<br />
>4<br />
>4<br />
>5<br />
>5<br />
>5<br />
>5<br />
Analysis <strong>of</strong> <strong>feeds</strong> <strong>and</strong> <strong>fertilizers</strong> <strong>for</strong> <strong>sustainable</strong> aquaculture development in Thail<strong>and</strong> 325<br />
water stability. Legal quality controls <strong>for</strong> marine shrimp, freshwater prawn, catfish<br />
<strong>and</strong> herbivorous fish <strong>feeds</strong> that requires the industry to manufacture <strong>feeds</strong> according<br />
to certain quality st<strong>and</strong>ards <strong>and</strong> to register <strong>and</strong> license their <strong>feeds</strong> were introduced in<br />
1991 (Agriculture <strong>and</strong> Cooperatives Ministry Regulation 1991). Similarly, all imported<br />
<strong>feeds</strong> have to be registered <strong>and</strong> licensed by the Department <strong>of</strong> Livestock Development.<br />
Further details <strong>of</strong> the regulations are provided by Sitasit (1995) <strong>and</strong> the Aquafeed<br />
Quality Control <strong>and</strong> Development Division (2002). The nutritional value <strong>of</strong> <strong>feeds</strong> has<br />
to be clearly indicated <strong>and</strong> <strong>feeds</strong> are regularly sampled <strong>and</strong> tested. Feed factories may<br />
not produce medicated <strong>feeds</strong>. Similarly, wholesalers <strong>and</strong> retailers <strong>of</strong> aqua<strong>feeds</strong> must also<br />
be registered <strong>and</strong> licensed. In 1999 the legislation was amended to include commercial<br />
<strong>feeds</strong> <strong>for</strong> carnivorous marine <strong>and</strong> freshwater fish, s<strong>of</strong>t-shell turtles <strong>and</strong> frogs. The<br />
average shelf life <strong>of</strong> commercial <strong>feeds</strong> is three months; hence the manufacture <strong>and</strong><br />
expiration date must be stated. Factories are inspected regularly to maintain st<strong>and</strong>ards<br />
as laid down by law. The nutritional value <strong>of</strong> <strong>feeds</strong> under legislative control in Thail<strong>and</strong><br />
<strong>and</strong> the current prices <strong>of</strong> <strong>feeds</strong> are given in Table 26.<br />
5.2 Aquafeed production <strong>and</strong> import <strong>and</strong> export <strong>of</strong> feed ingredients<br />
There is a high degree <strong>of</strong> competition among feed manufacturers in Thail<strong>and</strong>. This<br />
has been to the advantage <strong>of</strong> farmers who, as a consequence, have access to highquality<br />
<strong>feeds</strong> at a competitive price. Estimated total production <strong>of</strong> compounded feed<br />
<strong>for</strong> livestock <strong>and</strong> aquaculture <strong>and</strong> utilization <strong>of</strong> major feed ingredients during 2000-<br />
2004 are shown in Table 27. Aquafeed production <strong>and</strong> consumption have increased<br />
substantially over the years (Table 28). In 2001, Aquafeed consumption was 660 000<br />
tonnes, which increased to 1.07 million tonnes in 2005. Table 28 also illustrates the<br />
TABLE 27<br />
Estimated total feed production (animal <strong>and</strong> aquafeed) <strong>and</strong> ingredient utilization during<br />
2000–2004 (in thous<strong>and</strong> tonnes)<br />
2000 2001 2002 2003 2004<br />
Total feed production 9 311.1 9 734.2 10 515.3 10 720.0 9 858.5<br />
Fishmeal 493.2 465.3 482.4 582.5 611.4<br />
Corn 4 186.0 4 164.0 4 263 4 151.0 4 000.0<br />
Full fat SBM 249.2 325.7 329.7 348.1<br />
Defatted SBM 1 722.0 1 961.0 2 064.0 2 632.0 2 281.8<br />
Broken rice 455.7 735.0 381.8 398.6 981.0<br />
Source: Thai Animal Feed Manufacturing Association (2004)<br />
TABLE 28<br />
Aquafeed production <strong>and</strong> ingredient use during 2001–2005<br />
Shrimp/fish<br />
Production<br />
(tonnes)<br />
Feed<br />
consumption<br />
(tonnes)<br />
% in<br />
feed<br />
Fishmeal Soybean meal Corn<br />
Amount<br />
(tonnes)<br />
% in<br />
feed<br />
Amount<br />
(tonnes)<br />
% in<br />
feed<br />
Amount<br />
(tonnes)<br />
2001 Shrimp 240 000 480 000 35 168 000 12 57 600 0<br />
Fish 279 700 180 000 20 36 000 22 39 600 35 63 000<br />
Total 519 700 660 000 204 000 972 200 63 000<br />
2002 Shrimp 315 000 630 000 35 220 500 12 75 600 0 0<br />
Fish 294 500 217 350 20 43 470 30 65 205 30 65 205<br />
Total 609 500 847 350 263 970 140 805 65 205<br />
2003 Shrimp 280 000 560 000 35 196 000 12 67 200 0 0<br />
Fish 321 000 262 500 20 52 500 30 78 750 30 78 750<br />
Total 601 000 822 500 248 500 145 950 78 750<br />
2004 Shrimp 260 000 520 000 35 182 000 12 62 400 0 0<br />
Fish 262 500 20 52 500 30 78 750 30 78 750<br />
Total 782 500 234 500 141 150 78 750<br />
2005 Shrimp 400 000 672 000 107 200 121 600 0<br />
Fish - 402 000 20 80 400 30 120 600 30 120 600<br />
Total 1 074 000 187 600 242 200 120 600<br />
Source: Thai Animal Feed Manufacturing Association (2004)
326<br />
<strong>Study</strong> <strong>and</strong> <strong>analysis</strong> <strong>of</strong> <strong>feeds</strong> <strong>and</strong> <strong>fertilizers</strong> <strong>for</strong> <strong>sustainable</strong> aquaculture development<br />
TABLE 29<br />
Average price <strong>of</strong> local <strong>and</strong> imported feed ingredients during the last 2 years (baht/kg)<br />
Local ingredients 2004 2005 Imported 2004 2005<br />
Cassava 3 4 Wheat bran 4.28 4.49<br />
Corn 6 6 Wheat gluten 47.11 42.06<br />
Rice bran 5 5 Soybean grain 12.96 11.89<br />
Broken rice 8 8 Wheat flour 15.85 13.88<br />
Defatted soybean 14 12 Defatted soybean 14.61 11.51<br />
Shrimp head meal 16 16<br />
Fishmeal 23 22 Fishmeal 31.58 32.79<br />
Squid oil 44 40 Squid oil 44.35 40.40<br />
Squid liver meal 73 61 Squid liver powder 26.72 29.70<br />
Fish oil 35.08 37.92<br />
Source: Thai Animal Feed Manufacturing Association (2004)<br />
type <strong>and</strong> volume <strong>of</strong> some <strong>of</strong> the ingredients used in aquafeed production. Feedmillers<br />
in Thail<strong>and</strong> are faced with high ingredient import tariffs, which range between 5-<br />
20 percent <strong>for</strong> the most important ingredients. There are no restrictions regarding<br />
import volumes <strong>and</strong> time frames <strong>for</strong> fishmeal, although only fishmeal with a protein<br />
content <strong>of</strong> 60 percent <strong>and</strong> above may be imported. A tariff <strong>of</strong> 15 percent is imposed<br />
on fishmeal imported from outside the ASEAN alliance, <strong>and</strong> 5 percent on fishmeal<br />
imported from ASEAN. However, there are rather severe import restrictions on corn.<br />
While tariff rates on corn imports have been liberalized, the benefit <strong>of</strong> this reduction<br />
has been <strong>of</strong>fset by the requirement that corn should only be imported between March<br />
<strong>and</strong> June. Corn is subjected to a tariff-rate quota: in-quota corn imports (54 440 tonnes)<br />
are subjected to a 20 percent tariff rate, while out-<strong>of</strong>-quota corn imports are subject<br />
to a 73.8 percent tariff. There are unlimited import quotas <strong>for</strong> soybean, <strong>for</strong> which<br />
the import duty is five percent. However, Thail<strong>and</strong> requires that importers purchase<br />
a certain amount <strong>of</strong> domestically produced soybean product be<strong>for</strong>e being granted a<br />
license to import product. The price <strong>of</strong> some imported ingredients, such as squid <strong>and</strong><br />
squid liver meal, is cheaper than the domestic product, because soybean meal is added<br />
to reduce the moisture content, while the local product is pure. The average prices <strong>of</strong><br />
local <strong>and</strong> imported aquafeed ingredients are shown in Table 29.<br />
About 10 000 tonnes <strong>of</strong> fishmeal is imported per year from three countries:<br />
Peru (76.2 percent), Denmark (9.5 percent) <strong>and</strong> Chile (4.2 percent). To protect the<br />
local industry, the government only allows importation <strong>of</strong> high-protein fishmeal<br />
(>60 percent). This fishmeal is mainly used <strong>for</strong> shrimp feed production. Soybean<br />
production in Thail<strong>and</strong> is low (269 300 tonnes in 2003) in comparison to the<br />
requirement <strong>of</strong> 1.95 million tonnes. Corn production (4.2 million tonnes in 2003)<br />
approximately matches the current requirements <strong>of</strong> the animal feed industry.<br />
6. PROBLEMS AND CONSTRAINTS<br />
Trash fish based farm-made feed is considered as one <strong>of</strong> the most suitable <strong>feeds</strong> <strong>for</strong> many<br />
fish species. However, the price <strong>of</strong> trash fish has increased to such an extent that its<br />
use as a primary feed ingredient is declining rapidly. This is mainly due to competition<br />
from fishmeal manufacturers <strong>for</strong> the by-catch, fuel price hikes <strong>and</strong> a decline in by-catch<br />
l<strong>and</strong>ings. Consequently, farmers now use slaughterhouse by-products (mainly chicken<br />
<strong>of</strong>fal – intestines, heads, feet, bones) as the primary ingredient <strong>for</strong> farm-made <strong>feeds</strong>.<br />
The outbreak <strong>of</strong> bird flu in 2003 was a disaster <strong>and</strong> has constrained the use <strong>of</strong> farmmade<br />
<strong>feeds</strong>. It is estimated that there were over 333 500 fish farms in 2003 (Fishery<br />
In<strong>for</strong>mation Technology Center, 2005), many <strong>of</strong> which previously relied on trash fish<br />
<strong>and</strong> latterly on chicken <strong>of</strong>fal. This has placed an enormous strain on the sub-sector <strong>and</strong><br />
competition <strong>for</strong> fresh trash fish <strong>and</strong> slaughterhouse by-products has become intense.<br />
There are no st<strong>and</strong>ard farm-made feed <strong>for</strong>mulations. In general, the composition<br />
<strong>of</strong> the feed depends on the availability <strong>and</strong> price <strong>of</strong> local raw materials. Hence, the
Analysis <strong>of</strong> <strong>feeds</strong> <strong>and</strong> <strong>fertilizers</strong> <strong>for</strong> <strong>sustainable</strong> aquaculture development in Thail<strong>and</strong> 327<br />
nutritional values <strong>of</strong> the <strong>feeds</strong> are highly variable, resulting in unpredictable production.<br />
Moreover, most farmers cannot store adequate quantities <strong>and</strong> have to purchase small<br />
quantities. Improper storage results in spoilage, poor fish growth <strong>and</strong> water pollution.<br />
In view <strong>of</strong> escalating costs this has become a major constraint <strong>for</strong> many farmers.<br />
Farm-made <strong>feeds</strong> are generally made using simple equipment such as meat mincers<br />
<strong>and</strong> most <strong>of</strong>ten fed in a moist <strong>for</strong>m. This causes water pollution <strong>and</strong> increases the risk<br />
<strong>of</strong> disease in comparison to manufactured commercial pellets. Farmers with adequate<br />
cash flow can af<strong>for</strong>d to acquire additional equipment such as a hammer mill, mixer <strong>and</strong><br />
cookers <strong>and</strong> are thus able to improve feed quality.<br />
Feed management practices are largely inadequate. Many farmers simply dump<br />
the mixed raw materials into the fish pond once a day. This leads to feed losses, water<br />
quality problems <strong>and</strong> reduces the pr<strong>of</strong>itability <strong>of</strong> the enterprise.<br />
The increasing price <strong>of</strong> organic manure is becoming problematic <strong>for</strong> fish farmers.<br />
Price escalation is related mainly to competition <strong>for</strong> chicken manure from agriculture<br />
<strong>and</strong> reduced availability because <strong>of</strong> bird flu. Poor farmers <strong>and</strong> those in rural areas are<br />
most affected, while those with a good cash flow can af<strong>for</strong>d to purchase adequate<br />
quantities.<br />
In Thail<strong>and</strong>, industrially manufactured feed is used mainly <strong>for</strong> shrimp farming <strong>and</strong><br />
in intensive fish- cage <strong>and</strong> pond-culture systems, <strong>and</strong> especially <strong>for</strong> those fish that are<br />
primarily destined <strong>for</strong> export. If manufactured <strong>feeds</strong> are to be used to feed fish destined<br />
<strong>for</strong> local consumption, then it is incumbent upon feed manufacturers to invest in<br />
research on the nutritional requirements <strong>of</strong> all life-history stages <strong>of</strong> these species, such<br />
that low-cost <strong>feeds</strong> can be produced. It is anticipated that the dem<strong>and</strong> <strong>for</strong> imported<br />
feed ingredients such as fishmeal, soybean meal <strong>and</strong> corn meal will increase. Although<br />
rice bran <strong>and</strong> broken rice are locally available there is likely to be shortage. The use<br />
<strong>of</strong> manufactured <strong>feeds</strong> is also constrained by farmer perceptions that the <strong>feeds</strong> are too<br />
expensive. Hence there is a need to educate farmers to calculate production costs <strong>and</strong><br />
pr<strong>of</strong>it margins. This would go a long way towards assisting the farmers to adopt best<br />
feeding practices.<br />
7. CONCLUSIONS AND RECOMMENDATIONS<br />
Feed <strong>and</strong> feeding constraints in inl<strong>and</strong> aquaculture vary depending on the farming<br />
systems (semi-intensive or intensive), type <strong>of</strong> feed used (farm-made <strong>feeds</strong> or commercial<br />
<strong>feeds</strong>) <strong>and</strong> species as well as whether the fish are produced <strong>for</strong> local consumption or<br />
<strong>for</strong> export. Feed manufacturers are still increasing production volumes, suggesting that<br />
the dem<strong>and</strong> <strong>for</strong> aqua<strong>feeds</strong> is increasing. It is predicted that manufactured <strong>feeds</strong> will be<br />
the only viable option to ensure the <strong>sustainable</strong> development <strong>of</strong> freshwater <strong>and</strong> coastal<br />
aquaculture in the future, especially <strong>for</strong> products destined <strong>for</strong> export.<br />
There is a need <strong>for</strong> government to set up extension projects to compare complete<br />
<strong>feeds</strong> with farm-made <strong>feeds</strong>. Simultaneously feed manufacturers must pay greater<br />
attention to the use <strong>of</strong> alternative <strong>and</strong> cheaper ingredients. The use <strong>of</strong> <strong>for</strong>mulated <strong>feeds</strong><br />
would also reduce the use <strong>of</strong> organic manures.<br />
Farm-made <strong>feeds</strong> are less stable in water <strong>and</strong> inconsistent in nutritional value in<br />
comparison to commercial <strong>feeds</strong> <strong>and</strong> this leads variable fish production. Farmers have<br />
little knowledge <strong>of</strong> feed preparation <strong>and</strong> processing technology <strong>and</strong> <strong>of</strong> raw material<br />
quality control. While the government promotes the use <strong>of</strong> commercial <strong>feeds</strong>, farm<br />
made-<strong>feeds</strong> are still indispensable in some areas, especially where fish are produced<br />
primarily <strong>for</strong> domestic consumption. Hence, there is a need <strong>for</strong> government to provide<br />
extension support to farmers on the selection, storage <strong>and</strong> processing <strong>of</strong> raw materials<br />
<strong>and</strong> on the <strong>for</strong>mulation <strong>and</strong> preparation <strong>of</strong> farm-made <strong>feeds</strong>. Such support should be<br />
adequately backed up by on-farm action with respect to sourcing <strong>and</strong> testing <strong>of</strong> new<br />
raw materials, <strong>for</strong>mulation <strong>and</strong> feed processing, <strong>and</strong> research on the development <strong>of</strong><br />
low-cost equipment to produce farm-made aqua<strong>feeds</strong>. In this regard, government <strong>and</strong>
328<br />
<strong>Study</strong> <strong>and</strong> <strong>analysis</strong> <strong>of</strong> <strong>feeds</strong> <strong>and</strong> <strong>fertilizers</strong> <strong>for</strong> <strong>sustainable</strong> aquaculture development<br />
the feed industry should make better use <strong>of</strong> farmer associations <strong>and</strong> feed distributors to<br />
disseminate in<strong>for</strong>mation <strong>and</strong> new technologies. In addition, there is a need <strong>for</strong> training<br />
workshops, demonstration ponds <strong>and</strong> study tours, particularly <strong>for</strong> rural small-scale<br />
farmers.<br />
ACKNOWLEDGEMENTS<br />
The author gratefully acknowledges comments <strong>and</strong> contributions received from Dr<br />
M. Hasan (FAO <strong>of</strong> UN), M. Trupsooksumran (Nongkhai Inl<strong>and</strong> Fisheries Research<br />
<strong>and</strong> Development Center), T. Wattanamahad (Nakorn Rachasima Inl<strong>and</strong> Fisheries<br />
Research <strong>and</strong> Development Center), T. Yotaanat (Tanom farm, Saraburi Province),<br />
S. Wanichkit (Surasak farm, Nakorn Rachasima Province), S. Nasa-aad (Nakorn<br />
Rachasima Province), S. Dosuntia (Nakorn Rachasima Province),S. Sontim (Sakda fish<br />
farm, Sukhotai Province), P. Vorakunha (Vorakunha farm, Saraburi Province).<br />
REFERENCES<br />
Aquafeed Quality Control <strong>and</strong> Development Division. 2002. Aquafeed quality control.<br />
Thai Fisheries Gazette, 55: 267–272.<br />
Boonyaratpalin, M. & New, M.B. 1994. On farm feed preparation <strong>and</strong> feeding strategies<br />
<strong>for</strong> marine shrimp <strong>and</strong> freshwater prawns. pp. 120–134. In: M.B. New, A.G.J. Tacon &<br />
I. Csavas eds. Farm-made aqua<strong>feeds</strong>. FAO Fisheries Technical Paper No. 343. Rome,<br />
FAO.<br />
Boonyaratpalin, M. 1991. Nutritional studies on seabass (Lates calcarifer). In S.S. De Silva<br />
ed. Finfish nutrition research in Asia, pp. 33–41. Proceedings <strong>of</strong> the Fourth Asian fish<br />
nutrition workshop. Manila, Asian Fisheries Society.<br />
Boonyaratpalin, M., Roachanasarumpakit, T., Chairat, C., Thongrod, S., Saengpradub,<br />
S., Poomtong, T., Tamtin, M., Chaimongkol, A. & Borisuthi, C. 2003. Development<br />
<strong>of</strong> complete feed <strong>for</strong> commercial culture <strong>of</strong> abalone, Haliotis asinine (Linne). Thail<strong>and</strong>,<br />
National Research Council. 205 pp.<br />
Dey, M.M., Paraguas, F.J. & Alam, F.M. 2001. Cross-country synthesis production<br />
accessibility, marketing <strong>and</strong> consumption patterns <strong>of</strong> freshwater products in Asia: a crosscountry<br />
comparison. FAO Fisheries Circular No. 973. Rome, FAO. 275 pp.<br />
Fishery In<strong>for</strong>mation Technology Center. 2005. Statistic <strong>of</strong> marine fish farms survey,<br />
2003. Technical paper No. 9/2005. Department <strong>of</strong> Fisheries, Ministry <strong>of</strong> Agriculture <strong>and</strong><br />
Cooperatives. 28 pp.<br />
Fishery In<strong>for</strong>mation Technology Center. 2006. Fisheries Statistics <strong>of</strong> Thail<strong>and</strong> 2004.<br />
Technical paper No. 4/2006. Department <strong>of</strong> Fisheries, Ministry <strong>of</strong> Agriculture <strong>and</strong><br />
Cooperatives, Technical paper 91 pp.<br />
Fishery Statistics Analysis <strong>and</strong> Research Group. 2005. Freshwater fish farms production<br />
survey 2003. Technical paper No. 16. Department <strong>of</strong> Fisheries, Ministry <strong>of</strong> Agriculture<br />
<strong>and</strong> Cooperatives. 67 pp.<br />
Jantrarotai, W. & Jantrarotai, P. 1994. On-farm feed preparation <strong>and</strong> feeding strategies<br />
<strong>for</strong> catfish <strong>and</strong> snakehead. FAO Fisheries Technical Paper No. 343. Rome, FAO. pp<br />
101–119.<br />
Kasetsart University. 1999. Lecture note <strong>for</strong> fish farmers; under the project <strong>of</strong> improving<br />
efficiency <strong>of</strong> fish farmers in reducing total cost <strong>and</strong> an increasing total production. Fisheries<br />
Faculty, Kasetsart University. 185 pp.<br />
Kosutarak, P. 1999. Use <strong>of</strong> chicken-head silaged <strong>for</strong> diet <strong>of</strong> hybrid Clarias catfish (Clarias<br />
macrocephalus x Clarias gariepinus). Technical paper No. 1/1999. Division <strong>of</strong> Aquafeed<br />
Quality Control <strong>and</strong> Development, Department <strong>of</strong> Fisheries. 13 pp.<br />
Na-nakorn, U. 1995. Catfish: seed propagation <strong>and</strong> aquaculture. Bangkok, Aquaculture<br />
section, Fisheries Faculty, Kasetsart University, V.B. Book Center (K.U.). 132 pp.<br />
Sakaras, W. 1986. Cage culture <strong>of</strong> seabass Lates calcarifer (Bloch) in Thail<strong>and</strong>. Technical<br />
paper. Rayong Brackishwater Fisheries Station. 10 pp.
Analysis <strong>of</strong> <strong>feeds</strong> <strong>and</strong> <strong>fertilizers</strong> <strong>for</strong> <strong>sustainable</strong> aquaculture development in Thail<strong>and</strong> 329<br />
Sihapitakgiat, P., Sricharoentham, B., Kittivorachate, R., Ingthamjitr, S. &<br />
Chittapalpong, T. 2000. Growth per<strong>for</strong>mance, production model, environmental impact<br />
<strong>and</strong> economics <strong>of</strong> commercial Nile tilapia cage culture in the Northeast <strong>of</strong> Thail<strong>and</strong>.<br />
Technical Paper No. 204. Bangkok, National Inl<strong>and</strong> Fisheries Institute, Department <strong>of</strong><br />
Fisheries. 86 pp.<br />
Sitasit, P. 1985. Comparison between production <strong>of</strong> catfish fed artificial feed (NIFI No. 12)<br />
<strong>and</strong> trash fish supplemented with vitamin <strong>and</strong> mineral mixture. Technical paper, National<br />
Inl<strong>and</strong> Fisheries Institute. 9 pp.<br />
Sitasit, P. 1995. Feed ingredients <strong>and</strong> quality control. In M. B. New, A.G.J. Tacon <strong>and</strong> I.<br />
Csavas eds. Farm-made aqua<strong>feeds</strong>, pp. 75–86. Proceedings <strong>of</strong> the FAO/AADCP Regional<br />
Expert Consultation on Farm-Made Aqua<strong>feeds</strong>, 14-18 December 1992. Bangkok, FAO-<br />
RAPA/AADCP.<br />
Sitasit, P., Boonyaratpalin, M <strong>and</strong> Unprasert, N. 1982. Fish feed <strong>and</strong> feeding method.<br />
Training Manual <strong>of</strong> National Inl<strong>and</strong> Fisheries Institute. 59 pp.<br />
Songsangjinda P. & Tattanon, T. 2004. Code <strong>of</strong> conduct <strong>for</strong> responsible shrimp asquaculture<br />
(CoC): good practices <strong>and</strong> benefits to pond cultured shrimp farmers in Thail<strong>and</strong>. Proceeding<br />
<strong>of</strong> the JSPS-NRCT International Symposium Joint Seminar 2004, Management <strong>of</strong><br />
Food Safety in Aquaculture <strong>and</strong> HACCP. 20–21 December 2004. Thail<strong>and</strong>, Kasetsart<br />
University, ISBN 974-537-623-8: 126–134.<br />
Tavaratmaneegul, P. 2001. Overview <strong>of</strong> the fisheries sector in the Southeast Asian region<br />
<strong>and</strong> Thail<strong>and</strong>. Third country training programme on freshwater aquaculture, June<br />
3–August 3 2001. Department <strong>of</strong> Fisheries. pp. 1–20.<br />
Thai Animal Feed Manufacturing Association. 2004. Animal Feed Business. ISSN 0857-<br />
1244. 80 pp.<br />
Thongrod, S., Jintasataporn, O & Boonyaratpalin, M. 2004. Feed <strong>and</strong> feeding constraints<br />
in inl<strong>and</strong> aquaculture in Thail<strong>and</strong>. In P. Edwards <strong>and</strong> G. Allan, eds. Feeds <strong>and</strong> feeding<br />
<strong>for</strong> inl<strong>and</strong> aquaculture in Mekong region countries, pp. 62–72. ACIAR Technical Reports<br />
No. 56.<br />
Thongutai, K. 1969. <strong>Study</strong> on growth rate <strong>of</strong> Pla Duk in different stocking rate. Annual<br />
report <strong>of</strong> the pond <strong>and</strong> experimental culture section. Bangkok, Department <strong>of</strong> Fisheries.<br />
pp. 114–128.<br />
Tookwinas, S & Keerativiriyaporn, S. 2004. Possibility <strong>for</strong> application <strong>of</strong> HACCP in<br />
aquaculture with emphasizing on marine shrimp farming industry. Proceeding <strong>of</strong> the<br />
JSPS-NRCT international symposium joint seminar 2004, Management <strong>of</strong> food safety in<br />
aquaculture <strong>and</strong> HACCP, 20-21 December 2004. Thail<strong>and</strong>, Kasetsart University, ISBN<br />
974-537-623-8: 1–11.<br />
Tookwinas, S. 2001. Shrimp culture in Thail<strong>and</strong> – present status <strong>and</strong> future direction <strong>for</strong><br />
research. Chatuchak, Bangkok, Coastal Aquaculture Division, Department <strong>of</strong> Fisheries.<br />
10 pp.<br />
Tookwinas, S. 2002. Auditing system <strong>for</strong> quality cultured shrimp by the department <strong>of</strong><br />
fisheries. Thai Fisheries Gazzette, 55: 227–243.<br />
Tunsutapanit, A., Sangontangit, T., Thongrod, S. & Omanee, S. 1996. <strong>Study</strong> on an<br />
elimination <strong>of</strong> pollutants in closed culture system (from 2nd crop) <strong>for</strong> giant tiger shrimp<br />
(Penaeus monodon) culture. Thai Fisheries Gazette. 14 pp.
330<br />
APPENDIX<br />
Inl<strong>and</strong> aquaculture systems in Thail<strong>and</strong><br />
A.1. Characteristics <strong>of</strong> inl<strong>and</strong> aquaculture systems <strong>and</strong> practices in Thail<strong>and</strong><br />
<strong>Study</strong> <strong>and</strong> <strong>analysis</strong> <strong>of</strong> <strong>feeds</strong> <strong>and</strong> <strong>fertilizers</strong> <strong>for</strong> <strong>sustainable</strong> aquaculture development<br />
Production<br />
(kg/ha)<br />
Harvest size<br />
(g/kg)<br />
Rearing period<br />
(days/months)<br />
Feed <strong>and</strong> feeding<br />
Stocking density<br />
(nos./ ha)<br />
Average size <strong>of</strong> pond<br />
(ha)<br />
System Aquaculture species<br />
Sepat siam >1 Fertilization / natural food 1 250 kg/ ha<br />
Extensive<br />
Paddy field<br />
culture<br />
Polyculture Tilapia <strong>and</strong> sutchi catfish 1 21 000-28 000 Vegetable waste <strong>and</strong><br />
fertilization<br />
Tilapia <strong>and</strong> hybrid catfish 0.8 50 000 -62 500 Chicken by-product 6-8 months Nile tilapia 500 g, 3 125 – 6 250<br />
Hybrid catfish 250 g kg/0.8 ha<br />
Nile tilapia <strong>and</strong> sutchi catfish 0.3 5 000 + 5 000 Chicken by-product 6-8 months Tilapia 0.5- 1 kg; 5 000 kg /0.3 ha<br />
sutchi catfish 1.5-2 kg<br />
Intensive culture<br />
Pond Tilapia, Java barb, catfish <strong>and</strong><br />
Fertilization / commercial feed /<br />
common carp<br />
kitchen waste / poultry<br />
by-product<br />
Cage Climbing perch 400 m2 8 000/cage Commercial catfish feed 3 months 70-150 g 700-800 kg/400 m2 Tilapia 25-40 g 25-40 m3 Commercial feed 3-5 months 800g – 1.2 kg<br />
Tilapia 40g each 12.4 m3 60/m3 Floating pellet 57 – 130 days 200 – 625 g 43.6 kg/m3 Semi-intensive<br />
Polyculture in<br />
pond<br />
Sutchi catfish Commercial feed<br />
All male tilapia 28.8 m3 2 000/cage Herbivorous fish feed (30% CP) 4.5 months 700 g 1500 kg/cage<br />
All male tilapia<br />
62.5 m<br />
(25 g)<br />
3 (5x5x2.5 m) 1 500/cage Herbivorous fish feed 4 months 350- 500 g 600-650 kg/cage<br />
Stocking density is expressed in number per ha unless otherwise indicated.
Analysis <strong>of</strong> <strong>feeds</strong> <strong>and</strong> <strong>fertilizers</strong><br />
<strong>for</strong> <strong>sustainable</strong> aquaculture<br />
development in Viet Nam<br />
Le Thanh Hung <strong>and</strong> Huynh Pham Viet Huy<br />
Faculty <strong>of</strong> Fisheries<br />
Nong Lam University, Ho Chi Minh City<br />
Viet Nam<br />
Summary 332<br />
1. General overview <strong>of</strong> aquaculture practices <strong>and</strong> farming systems 333<br />
2. On farm feeding practices <strong>and</strong> feed management strategies 336<br />
3. Review <strong>of</strong> the aquafeed industry 342<br />
4. Fertilizers, feed ingredients <strong>and</strong> <strong>feeds</strong> in aquaculture 346<br />
5. Problems <strong>and</strong> constraints 352<br />
6. Recommendations 355<br />
References 356<br />
Appendix 358<br />
Hung, L.T. <strong>and</strong> Huy, H.P.V. 2007. Analysis <strong>of</strong> <strong>feeds</strong> <strong>and</strong> <strong>fertilizers</strong> <strong>for</strong> <strong>sustainable</strong><br />
aquaculture development in Viet Nam. In M.R. Hasan, T. Hecht, S.S. De Silva <strong>and</strong><br />
A.G.J. Tacon (eds). <strong>Study</strong> <strong>and</strong> <strong>analysis</strong> <strong>of</strong> <strong>feeds</strong> <strong>and</strong> <strong>fertilizers</strong> <strong>for</strong> <strong>sustainable</strong> aquaculture<br />
development. FAO Fisheries Technical Paper. No. 497. Rome, FAO. pp. 331–361.<br />
331
332<br />
<strong>Study</strong> <strong>and</strong> <strong>analysis</strong> <strong>of</strong> <strong>feeds</strong> <strong>and</strong> <strong>fertilizers</strong> <strong>for</strong> <strong>sustainable</strong> aquaculture development<br />
SUMMARY<br />
Aquaculture in Viet Nam has become an important economic activity. Total production<br />
in 2004 exceeded 1.22 million tonnes, accounting <strong>for</strong> approximately 40 percent <strong>of</strong> the<br />
country’s total fisheries output. Seaweed, fish, crustaceans <strong>and</strong> molluscs are produced in<br />
a wide array <strong>of</strong> freshwater <strong>and</strong> marine culture systems at various levels <strong>of</strong> intensity under<br />
mono or polyculture conditions.<br />
Extensive aquaculture is practiced in ponds, rice fields <strong>and</strong> reservoirs. Chinese,<br />
Indian <strong>and</strong> common carp are the preferred fish in these systems <strong>and</strong> animal manure is the<br />
principal input. Improved extensive <strong>and</strong> semi-intensive aquaculture is practised in ponds<br />
with higher levels <strong>of</strong> nutrient <strong>and</strong> feed inputs. Integrated livestock/fish farming is being<br />
promoted to optimise the use <strong>of</strong> on-farm nutrient resources. Intensive aquaculture is<br />
undertaken mainly in smaller ponds, cages <strong>and</strong> tanks. Snakeheads, pangasiid catfish <strong>and</strong><br />
red tilapia are main species produced in intensive freshwater systems. Trash fish is the<br />
most important feed or feed ingredient <strong>for</strong> snakeheads <strong>and</strong> pangasiid catfish, while pellets<br />
<strong>and</strong> farm-made <strong>feeds</strong> are the main inputs in intensive catfish <strong>and</strong> red tilapia aquaculture<br />
systems.<br />
Coastal aquaculture is dominated by black tiger shrimp (Penaeus monodon) farming,<br />
particularly in the Mekong Delta <strong>and</strong> coastal provinces <strong>of</strong> Central Viet Nam. There<br />
have been significant advances in the intensification <strong>of</strong> shrimp farming in Viet Nam.<br />
Most shrimp farms are now operated on a semi-intensive scale, while intensive shrimp<br />
farming is making rapid advances. Shrimp in intensive systems are fed on commercially<br />
manufactured pellet <strong>feeds</strong>, while semi-intensive <strong>and</strong> improved extensive system employ<br />
trash fish as the major feed ingredient. Other marine species farmed in Viet Nam include<br />
eight grouper species, Asian seabass/barramundi (Lates calcarifer), cobia (Rachycentron<br />
canadum), yellowtail/greater amberjack (Seriola dumerili), seabream <strong>and</strong> snapper <strong>and</strong><br />
four species <strong>of</strong> lobster <strong>of</strong> the genus Panulirus. Trash fish is the principal feed <strong>for</strong> all <strong>of</strong> the<br />
above marine species.<br />
The aquafeed industry in Viet Nam started in 1998. In 2004, the industry<br />
produces 300 000–350 000 tonnes <strong>of</strong> pelleted feed <strong>for</strong> fish <strong>and</strong> 150 000–200 000<br />
tonnes <strong>of</strong> shrimp feed. Despite these developments farm-made <strong>feeds</strong> still play a vital<br />
<strong>and</strong> major role in Vietnamese aquaculture. Trash fish is the major component <strong>of</strong><br />
farm-made <strong>feeds</strong>. However, the supply <strong>of</strong> trash fish is limiting the development <strong>of</strong><br />
the sector, unless rapid advances are made to reduce the cost <strong>of</strong> manufactured <strong>feeds</strong>.<br />
Bulk <strong>of</strong> fishmeal, soybean meal, wheat flour <strong>and</strong> marine by-products used by feed<br />
manufacturers are imported.<br />
Aquaculture in Viet Nam is targeted to grow at over 20 percent per annum to 2010.<br />
To attain this national goal it is essential that aquaculture becomes more intensive. It also<br />
means that more feed <strong>and</strong> nutrient inputs are needed <strong>and</strong> this poses several challenges that<br />
have to be met. The challenges revolve particularly around the availability <strong>and</strong> supply<br />
<strong>of</strong> feed ingredients <strong>and</strong> the dwindling supply <strong>of</strong> trash fish. For the sector to develop in<br />
a <strong>sustainable</strong> manner there is a need to focus on alternatives to fishmeal <strong>and</strong> trash fish,<br />
farmer education <strong>and</strong> <strong>for</strong> government to <strong>for</strong>mulate enabling policy <strong>and</strong> legislation to<br />
facilitate the development <strong>of</strong> the aquatic feed industry.
Analysis <strong>of</strong> <strong>feeds</strong> <strong>and</strong> <strong>fertilizers</strong> <strong>for</strong> <strong>sustainable</strong> aquaculture development in Viet Nam 333<br />
1. GENERAL OVERVIEW OF<br />
AQUACULTURE PRACTICES AND<br />
FARMING SYSTEMS<br />
1.1 Current status <strong>of</strong> aquaculture<br />
The inl<strong>and</strong> <strong>and</strong> marine aquatic<br />
resources <strong>of</strong> Viet Nam are ideally<br />
suited <strong>for</strong> aquaculture development.<br />
The country has a coastline <strong>of</strong> around<br />
3 260 km, 12 lagoons, straits <strong>and</strong> bays,<br />
112 estuaries <strong>and</strong> thous<strong>and</strong>s <strong>of</strong> isl<strong>and</strong>s<br />
in the China Sea. Inl<strong>and</strong> waters include<br />
a network <strong>of</strong> rivers, canals, irrigation<br />
systems <strong>and</strong> reservoirs amounting to<br />
about 1.7 million ha that consists <strong>of</strong><br />
120 000 ha <strong>of</strong> ponds, lakes <strong>and</strong> canals,<br />
340 000 ha <strong>of</strong> reservoirs, 580 000 ha<br />
<strong>of</strong> paddy fields in which aquaculture<br />
is integrated with rice farming <strong>and</strong><br />
660 000 ha <strong>of</strong> tidal waters.<br />
FIGURE 1<br />
Fisheries <strong>and</strong> aquaculture production in Viet Nam during<br />
1990 <strong>and</strong> 2004<br />
3 500 000<br />
3 000 000<br />
2 500 000<br />
2 000 000<br />
1 500 000<br />
1 000 000<br />
500 000<br />
The total fisheries production <strong>of</strong> Viet Nam reached about 2.53 million tonnes in<br />
2002 <strong>and</strong> increased to more than 3.1 million tonnes in 2004, <strong>of</strong> which more than 1.22<br />
million tonnes was from aquaculture (FAO, 2006). Figure 1 shows the development <strong>of</strong><br />
aquaculture in Viet Nam between 1990 <strong>and</strong> 2004. Freshwater aquaculture is the largest<br />
contributor to total aquaculture production (57.3 percent), followed by brackishwater<br />
aquaculture with 27.6 percent <strong>and</strong> mariculture with 15.1 percent. Since 1990<br />
aquaculture production has been increasing continuously over the years <strong>and</strong> Viet Nam<br />
is currently acknowledged as having the fastest aquaculture growth rate in Asia. The<br />
target <strong>of</strong> the national fisheries development plan is <strong>for</strong> Viet Nam to produce 2.0 million<br />
tonnes <strong>of</strong> aquaculture produce in 2010 (Table 1) (MOFI, 2004).<br />
Capture fisheries seem to be reaching a plateau. Fortunately the rapid increase in<br />
aquaculture production has compensated <strong>for</strong> the production gap such that the country<br />
can meet the increasing dem<strong>and</strong> <strong>of</strong> its domestic <strong>and</strong> international markets.<br />
1.2 Inl<strong>and</strong> Aquaculture<br />
Inl<strong>and</strong> aquaculture in Viet Nam is well developed <strong>and</strong> in 2004 accounted <strong>for</strong> 57 percent<br />
<strong>of</strong> national aquaculture production (FAO, 2006). The sections below describe the<br />
various systems that are in use <strong>and</strong> the species that are cultured in them.<br />
Pond culture is the most common aquaculture practice in the country. The<br />
main aquaculture species include common carp (Cyprinus carpio), silver carp<br />
(Hypophthalmichthys molitrix), bighead carp (Aristichthys nobilis), grass carp<br />
(Ctenopharyngodon idella), Indian major carps (Labeo rohita, Cirrhinus cirrhosus),<br />
tilapias (Mozambique tilapia Oreochromis mossambicus <strong>and</strong> Nile tilapia O. niloticus),<br />
Production (tonnes)<br />
0<br />
1990<br />
Source: FAO (2006)<br />
Aquaculture<br />
Capture fisheries<br />
Total production<br />
% contribution by aquaculture<br />
TABLE 1<br />
Fisheries <strong>and</strong> aquaculture production (tonnes) <strong>and</strong> their export value (thous<strong>and</strong> US$) during<br />
2002, 2003 <strong>and</strong> 2004 <strong>and</strong> target <strong>for</strong> 2010<br />
Sectors 2002 2003 2004 2010<br />
Total fisheries production 2 530 639 2 823 607 3 108 105 -<br />
Aquaculture production 728 041 967 502 1 228 617 2 000 000<br />
- Inl<strong>and</strong> aquaculture 441 827 547 931 703 827 946 000<br />
- Brackish & marine 286 214 419 571 524 790 1 054 000<br />
Export value <strong>of</strong> fisheries <strong>and</strong> aquaculture<br />
production<br />
- 2 199 577 2 397 000 -<br />
Source: Production data from FAO (2006) <strong>and</strong> export value data from MOFI (2004)<br />
1991<br />
1992<br />
1993<br />
1994<br />
1995<br />
1996<br />
1997<br />
Year<br />
1998<br />
1999<br />
2000<br />
2001<br />
2002<br />
2003<br />
2004<br />
45<br />
40<br />
35<br />
30<br />
25<br />
20<br />
15<br />
10<br />
5<br />
0
334<br />
<strong>Study</strong> <strong>and</strong> <strong>analysis</strong> <strong>of</strong> <strong>feeds</strong> <strong>and</strong> <strong>fertilizers</strong> <strong>for</strong> <strong>sustainable</strong> aquaculture development<br />
TABLE 2<br />
Catfish area <strong>and</strong> production trends in the Mekong Delta<br />
Category 1997 1999 2001 2003 Estimated<br />
2004<br />
Growth rate<br />
%/year<br />
Culture area (ha) 1 290 2 253 2 305 2 717 3 200 24.6<br />
- Pond (ha) 1 290 2 253 2 288 2 652 2 991 21.9<br />
- Cage (unit) 1 300 1 621 2 539 2 271 1 872 7.3<br />
Production (tonnes) 40 250 86 775 114 289 162 778 255 044 88.9<br />
- Pond 22 550 50 330 66 660 109 105 178 624 115.3<br />
- Cage 700 19 005 37 418 48 068 45 748 -<br />
*Culture area includes both ponds <strong>and</strong> pens <strong>and</strong> so the values in some cases slightly differ from that <strong>of</strong> pond area.<br />
Cage area have not been included in the culture area.<br />
Source: MOFI (2004)<br />
hybrid clariid catfish (Clarias macrocephalus x C. gariepinus), <strong>and</strong> Mekong catfish (tra<br />
catfish Pangasius hypophthalmus <strong>and</strong> basa catfish P. bocourti). Pond culture is practiced<br />
at different levels <strong>of</strong> intensity. At the household level most small-scale farmers practice<br />
extensive polyculture in fertilized ponds, in which the fish rely entirely on natural<br />
food. Cyprinids <strong>and</strong> tilapias are the most commonly used species in these systems.<br />
Semi-intensive <strong>and</strong> intensive practices are geared more towards the production <strong>of</strong><br />
high value fish <strong>and</strong> freshwater prawns, such as hybrid clariid catfish, pangasiid catfish,<br />
giant snakehead (Channa micropeltes), red tilapia (hybrid between Nile tilapia <strong>and</strong><br />
Mozambique tilapia), kissing gourami (Helostoma temmincki) <strong>and</strong> giant freshwater<br />
prawn (Macrobrachium rosenbergii).<br />
Cage culture is practised along the Mekong River, its tributaries (the Tien <strong>and</strong> the<br />
Hau) <strong>and</strong> in the Delta <strong>and</strong> in reservoirs. Cage culture is permitted only in the larger<br />
reservoirs such as Hoa Binh (19 000 ha), Thac Ba (18 000 ha), Tri An (32 400 ha), Thac<br />
Mo (10 600 ha) <strong>and</strong> Dau Tieng (18 000 ha). Reservoir cage culture species include<br />
grass carp, marble goby (Oxyeleotris marmorata), snakehead, common carp, hybrid<br />
clariid catfish <strong>and</strong> red tilapia, while the species grown in cages in the Mekong river<br />
<strong>and</strong> delta include three species <strong>of</strong> pangasiid catfish (P. bocourti, P. hypophthalmus <strong>and</strong><br />
P. conchophilus) as well as hybrid clariid catfish (Tuan, 2003).<br />
Pen culture <strong>of</strong> pangasiid species, particularly P. hypophthalmus, is a relatively new<br />
practice that is being developed, along with pond culture, <strong>for</strong> pangasiid catfish in the<br />
Mekong Delta marshes. Some 30 672 tonnes <strong>of</strong> catfish were produced in pens in 2004.<br />
Pen culture <strong>of</strong> P. hypophthalmus already contributes 12 percent <strong>of</strong> total pangasiid<br />
catfish production in the Delta.<br />
The Mekong Delta is the most important freshwater aquaculture region in Viet Nam<br />
<strong>and</strong> there<strong>for</strong>e requires special mention. Many culture practices are applied <strong>and</strong> various<br />
fish species are cultured in this area. Indian major carps, Chinese carps, silver barb <strong>and</strong><br />
tilapia are produced <strong>for</strong> domestic consumption, while pangasiid catfish, marble goby<br />
<strong>and</strong> freshwater prawns are exported. Freshwater prawn farming in the Delta has led<br />
to substantial diversification <strong>of</strong> farming practices, such as the increase in rice fields<br />
<strong>and</strong> integrated rice-prawn farming systems. Mekong catfish farming in the Delta has<br />
exp<strong>and</strong>ed at an extremely rapid rate (Table 2) <strong>and</strong> is unquestionably the most important<br />
species in the Delta. Production in 2004 was around 280 000 tonnes, accounting <strong>for</strong><br />
56 percent <strong>of</strong> freshwater aquaculture production in the Delta <strong>and</strong> about 10 percent <strong>of</strong><br />
the national aquaculture export value (Phuong et al., 2005).<br />
1.3 Coastal Aquaculture<br />
Coastal aquaculture is dominated by pond culture <strong>of</strong> black tiger shrimp, particularly<br />
in the Mekong Delta <strong>and</strong> the central provinces <strong>of</strong> Viet Nam. The diversity <strong>of</strong> coastal<br />
aquaculture is however best summarized on a regional basis. The marine species farmed<br />
in Viet Nam are described by Tuan (2003).
Analysis <strong>of</strong> <strong>feeds</strong> <strong>and</strong> <strong>fertilizers</strong> <strong>for</strong> <strong>sustainable</strong> aquaculture development in Viet Nam 335<br />
FIGURE 2<br />
Production <strong>and</strong> pond surface area <strong>of</strong> shrimp farming in Viet Nam <strong>and</strong> the Mekong Delta<br />
Production (tonnes)<br />
200 000<br />
160 000<br />
120 000<br />
80 000<br />
40 000<br />
Source: MOFI (2003)<br />
0<br />
1.3.1 Coastal aquaculture in the Mekong Delta<br />
The rapid development <strong>of</strong> shrimp farming in the Mekong Delta since 1999 is illustrated<br />
in Figure 2. Marine fish, brine shrimp (Artemia) <strong>and</strong> mud crab are also commonly<br />
cultured species in the Delta. Between 1999 <strong>and</strong> 2003 total shrimp farming area had<br />
increased by more than 2.8 folds (160 000 ha to 450 000 ha) <strong>and</strong> production by over 3.8<br />
times during this period. In 2003, about 450 000 ha were dedicated to shrimp farming<br />
in the Delta <strong>and</strong> production had reached 162 000 tonnes (MOFI, 2003) Currently the<br />
Delta is responsible <strong>for</strong> 86 percent <strong>of</strong> national shrimp production <strong>and</strong> comprises about<br />
87 percent <strong>of</strong> the country’s total shrimp pond area.<br />
Shrimp farms include extensive, improved-extensive, semi-intensive <strong>and</strong> intensive<br />
systems. Extensive shrimp farming (80–250 kg/ha/year) is being gradually replaced by<br />
semi-intensive <strong>and</strong> intensive systems, with higher production levels <strong>of</strong> 6–10 tonnes/ha/<br />
crop. Rice-shrimp farming is also widely practiced, which has several advantages <strong>and</strong><br />
synergistic effects.<br />
1.3.2 Coastal aquaculture in the central provinces<br />
Tiger shrimp is also the most important aquaculture species in the coastal areas <strong>of</strong> the<br />
central provinces. In 2003, this region had some 16 931 ha under shrimp ponds <strong>and</strong><br />
shrimp here are farmed intensively (MOFI, 2004). Lobsters <strong>and</strong> groupers are cultured<br />
in cages. Edwards, Tuan <strong>and</strong> Allan (2004) reported that lobster (Panulirus spp.) cage<br />
culture was more pr<strong>of</strong>itable than grouper culture. In Khanh Hoa province there are over<br />
12 000 lobster farms. Lobster culture is mainly a family enterprise, with each family<br />
owning one or more cages that are deployed in coastal lagoons or sheltered bays. Cages<br />
are typically 10–30 m 3 in volume, constructed with synthetic netting stretched over a<br />
bamboo frame. Floating cages, supported by plastic drums, are also used. Families tend<br />
to aggregate their cages in areas where water quality is good <strong>and</strong> to benefit from lower<br />
labour costs <strong>and</strong> improved security (Hambrey, Tuan <strong>and</strong> Thuong, 2001). Other species<br />
cultured in the central provinces include red grouper, black grouper, snapper, shrimp<br />
<strong>and</strong> ornamental fish.<br />
1.3.3 Coastal aquaculture in northern Viet Nam<br />
Coastal shrimp <strong>and</strong> fish aquaculture activities in northern Viet Nam are concentrated<br />
mainly in the Gulf <strong>of</strong> Tonkin. Cat Ba Isl<strong>and</strong>, Ha Long Bay, Do Son (Hai Phong<br />
province), Quang Ninh, Nam Dinh, Ninh Binh, Thai Binh, Thanh Hoa, Nghe An<br />
<strong>and</strong> Ha Tinh. Cage culture <strong>of</strong> Asian seabass (Lates calcarifer) <strong>and</strong> cobia (Rachycentron<br />
canadum) is mostly located on Cat Ba Isl<strong>and</strong> <strong>and</strong> in Ha Long. Trash fish is the main<br />
feed used in cage culture. Trash fish food conversion ratios (FCR) are high (6–8:1) <strong>and</strong><br />
some farmers are now also using pelleted feed. Both tiger shrimp <strong>and</strong> Pacific white<br />
200 000<br />
Viet Nam Mekong Delta Viet Nam Mekong Delta<br />
500 000<br />
Surface area (ha)<br />
400 000<br />
300 000<br />
200 000<br />
100 000<br />
0<br />
1991 1994 1999 2000 2001 2002 2003 1999 2000 2001 2002 2003<br />
Year Year
336<br />
<strong>Study</strong> <strong>and</strong> <strong>analysis</strong> <strong>of</strong> <strong>feeds</strong> <strong>and</strong> <strong>fertilizers</strong> <strong>for</strong> <strong>sustainable</strong> aquaculture development<br />
shrimp (Litopenaeus vannamei) are farmed in northern Viet Nam, mainly around<br />
Quang Ninh, Hai Phong, Nam Dinh, Ninh Binh, Thai Binh, Thanh Hoa, Nghe An<br />
<strong>and</strong> Ha Tinh.<br />
2. ON FARM FEEDING PRACTICES AND FEED MANAGEMENT STRATEGIES<br />
2.1 Inl<strong>and</strong> Aquaculture Systems<br />
A total <strong>of</strong> 29 species (14 indigenous <strong>and</strong> 15 introduced) are farmed in freshwaters in<br />
Viet Nam (Table 3).<br />
More than 70 percent <strong>of</strong> the freshwater aquaculture species are omnivores <strong>and</strong><br />
include, amongst others Mekong catfish, hybrid clariid catfish, Indian major carps,<br />
kissing gourami (Helostoma temminkii) <strong>and</strong> red tailed tinfoil/silver barb (Barbonymus<br />
altus) (Table 4). All the cultured carnivorous species are indigenous <strong>and</strong> high value<br />
species such as snakehead (giant snakehead Channa micropeltes <strong>and</strong> snakehead murrel<br />
C. striata), marble goby <strong>and</strong> spotted bronze featherback (Notopterus notopterus).<br />
Almost all <strong>of</strong> the filter feeders are introduced species. Overall, omnivorous species are<br />
the most favoured because they are able to feed on a variety <strong>of</strong> <strong>feeds</strong> such as rice bran,<br />
fresh manure, cooked rice, trash fish, vegetables, restaurant waste, etc. (Hung, 2004).<br />
2.1.1 Pond fish culture<br />
Pond culture <strong>of</strong> herbivorous fish<br />
Herbivorous fish are preferred in household-scale culture systems that primarily produce<br />
fish <strong>for</strong> home or local consumption. In particular grass carp <strong>and</strong> silver barb are popular<br />
species <strong>and</strong> they are fed on aquatic plants <strong>and</strong> grass, which are abundant, <strong>and</strong> supplemented<br />
with rice bran, manure, restaurant waste <strong>and</strong> household waste when available.<br />
Pond culture <strong>of</strong> filter feeders<br />
Silver <strong>and</strong> bighead carp, catla, rohu <strong>and</strong> sometimes tilapia are classified as filter feeders,<br />
although tilapia can also be considered an omnivore. Polyculture systems have been<br />
developed <strong>for</strong> the culture <strong>of</strong> filter feeders in which farmers raise 3–5 species in fertilized<br />
ponds. Silver <strong>and</strong> bighead carp are favoured in northern Viet Nam <strong>and</strong> the central<br />
Highl<strong>and</strong>, while catla <strong>and</strong> rohu are preferred in the Mekong Delta.<br />
Animal manure (pig, duck,<br />
TABLE 3<br />
Families <strong>and</strong> the number <strong>of</strong> freshwater aquaculture fish<br />
species in Viet Nam<br />
Family Total number<br />
<strong>of</strong> species<br />
Indigenous<br />
species<br />
Introduced<br />
species<br />
Cyprinidae 12 3 9<br />
Pangasiidae 4 4 -<br />
Ophicephalidae 3 3 -<br />
Cichlidae 3 - 3<br />
Anabantidae 4 2 2<br />
Clariidae 3 2 1<br />
Total 29 14 15<br />
Source: Hung (2004)<br />
chicken <strong>and</strong> cattle) is the main<br />
input <strong>for</strong> polyculture systems in<br />
Viet Nam. The use <strong>of</strong> manures<br />
is diverse <strong>and</strong> is described<br />
below. However, farmers lack<br />
knowledge <strong>of</strong> application<br />
procedures <strong>and</strong> rates. Except<br />
in fingerling ponds, farmers<br />
rarely use inorganic <strong>fertilizers</strong> to<br />
stimulate natural productivity<br />
(Hung, 2004).<br />
TABLE 4<br />
Feeding guilds <strong>of</strong> freshwater aquaculture fish species in Viet Nam<br />
Feeding guild Species<br />
Herbivores (3) Grass carp, snakeskin gourami (Trichogaster pectoralis), silver barb (Spinibarbus<br />
denticulatus)<br />
Filter feeders (4) Silver carp, bighead carp, tilapias<br />
Omnivores (21) Mekong catfish (P. hypophthalmus, P. bocourti), hybrid clariid catfish, Indian major<br />
carps, giant gourami (Osphronemus goramy), kissing gourami, silver barb, etc.<br />
Carnivores (5) Snakeheads (Chana gachua, C. micropeltes, C. striata), marble goby, bronze<br />
featherback (Notopterus notopterus).<br />
Number within parenthesis is the number <strong>of</strong> species under the specified feeding guild.
Analysis <strong>of</strong> <strong>feeds</strong> <strong>and</strong> <strong>fertilizers</strong> <strong>for</strong> <strong>sustainable</strong> aquaculture development in Viet Nam 337<br />
2.1.2 Animal-fish integrated systems<br />
Integrated fish-livestock farming is widely practised<br />
throughout the country. Most common is the pig-fish<br />
combination. Waste products from pig production<br />
are the main source <strong>of</strong> nutrient input. Herbivores<br />
<strong>and</strong> planktivores make optimum use <strong>of</strong> algal <strong>and</strong><br />
zooplankton blooms, while omnivores make direct<br />
use <strong>of</strong> the pig manure. In this way, farmers maximize<br />
the use <strong>of</strong> on-farm resources without additional cost<br />
<strong>for</strong> <strong>feeds</strong>. Pig stocking density is usually in the range<br />
TABLE 5<br />
Fish production in various freshwater farming<br />
systems<br />
Farming systems Yield (tonnes/ha/crop)<br />
Rice-fish integrated 0.43–0.80<br />
Pig-fish integrated 3.88–7.59<br />
Fish-rice alternative 0.60–0.90<br />
Prawn-rice alternative 0.75–0.80<br />
Prawn-rice integrated 0.35–0.50<br />
Source: Wilder <strong>and</strong> Phuong (2002)<br />
<strong>of</strong> 150–200 pigs/ha <strong>of</strong> fishpond with an initial weight <strong>of</strong> 30–50 kg. Fish are usually<br />
stocked at a density <strong>of</strong> 7 fish/m 2 . Pig “compost” can also be obtained from biogas<br />
generators, which is then used <strong>for</strong> pond fertilization. Under these conditions the fish<br />
are normally fed with rice bran (50–70 percent) <strong>and</strong> crab, golden snail or other fish or<br />
agricultural processing by-products. Typical production figures <strong>of</strong> several livestockfish<br />
combinations are provided in Table 5.<br />
VAC systems (V=“Vuon” or garden, A=“Ao” or fishpond, C = “Chuong” or pig<br />
coop) are also popular. The system is designed to optimally use most on-farm waste<br />
resources. Main feed inputs to fish ponds are agricultural by-products such as rice<br />
bran, vegetable, cassava leaf, corn meal, etc. <strong>and</strong> waste (manure <strong>and</strong> uneaten food)<br />
from the pigs. Fish produced in the VAC systems are normally low value fish used <strong>for</strong><br />
household consumption or <strong>for</strong> sale in local markets. Grass carp, common carp, silver<br />
carp <strong>and</strong> Indian carps are commonly used.<br />
2.1.3 Rice-fish integrated system<br />
The Mekong Delta has more than 1.0 million ha <strong>of</strong> rice paddies, <strong>of</strong> which 400 000 ha<br />
are suitable <strong>for</strong> developing rice-fish culture (Tuan et al., 1995, cited by Hao et al.,<br />
2000). However, many factors such as flooding <strong>and</strong> low rice prices have affected ricefish<br />
integrated farming systems in the Delta <strong>and</strong> consequently the practices have been<br />
diversified. Many fish species are cultured in rice fields. These include high-value species<br />
such as snakeskin gourami (Trichogaster pectoralis), climbing perch (A. testudineus),<br />
catfish (P. hypophthalmus) <strong>and</strong> freshwater prawn (M. rosenbergii) as well as low value<br />
species such as silver barb, tilapia <strong>and</strong> Indian carps. Silver barb is particularly suited to<br />
rice-fish systems as it survives <strong>and</strong> grows well. Moreover, fish or prawn culture can be<br />
alternated with rice cultivation (Wilder <strong>and</strong> Phuong, 2002).<br />
Inorganic <strong>fertilizers</strong> are most commonly used in rice-fish systems. In a survey <strong>of</strong><br />
262 fish farms in the Mekong Delta, Long (2002) found that the application rates<br />
<strong>of</strong> inorganic fertilizer into the systems were extremely low ranging between 82–<br />
105 kg/ha/year. Urea was most commonly used. Organic <strong>fertilizers</strong> are not widely<br />
used in the rice-fish systems. A variety <strong>of</strong> <strong>feeds</strong> are used to supplement natural<br />
foods <strong>and</strong> include amongst others rice bran, broken rice, waste vegetable, water<br />
spinach <strong>and</strong> sweet potato leaves. Fish yield depends on whether the fish receive<br />
supplemental feed or not <strong>and</strong> varies from 50–150 kg/ha/year under no feeding<br />
conditions to over 300 kg/ha/year with supplementary feeding.<br />
2.1.4 Giant freshwater prawn (Macrobrachium rosenbergii)<br />
Existing culture systems <strong>of</strong> M. rosenbergii include improved-extensive culture in rice<br />
fields, <strong>and</strong> semi-intensive <strong>and</strong>/or intensive culture in ponds, orchard canals <strong>and</strong> pens.<br />
Pond culture<br />
Giant freshwater prawn are fed on pellets <strong>and</strong> farm-made <strong>feeds</strong>. Farm-made <strong>feeds</strong><br />
consist <strong>of</strong> trash fish, golden snail, rice bran <strong>and</strong> other ingredients. Trash fish is only<br />
incorporated into the feed when golden snails are scarce. During the first month
338<br />
<strong>Study</strong> <strong>and</strong> <strong>analysis</strong> <strong>of</strong> <strong>feeds</strong> <strong>and</strong> <strong>fertilizers</strong> <strong>for</strong> <strong>sustainable</strong> aquaculture development<br />
the prawns are fed exclusively on pellets <strong>and</strong> <strong>for</strong> the remaining five months they are<br />
normally fed a combination <strong>of</strong> pellets (40 percent) <strong>and</strong> farm-made feed (60 percent).<br />
The ration decreases with age from around 30 percent <strong>of</strong> pond biomass <strong>for</strong> the first<br />
week after stocking to around 8–10 percent between weeks 9 <strong>and</strong> 24 <strong>and</strong> the prawns<br />
are fed 4 times per day <strong>and</strong> consumption is monitored (Long, 2003). Yields vary from<br />
500–1 200 kg/ha/cycle (MOFI, 1999).<br />
Rice-prawn integrated system<br />
Besides the Mekong Delta where rice-prawn farming systems are common, farmers<br />
in northern Viet Nam have also recently adopted this practice (Trang, Thanh <strong>and</strong><br />
Phuong, 2004). Rice fields are usually fertilized to stimulate the growth <strong>of</strong> the rice<br />
<strong>and</strong> <strong>of</strong> natural food. Animal manures <strong>and</strong> green fodder (wet composting) are widely<br />
used as <strong>fertilizers</strong>. Animal manures are only applied after composting at a rate <strong>of</strong><br />
20–30 kg/100 m 2 <strong>and</strong> green fodders are applied at the same rate. No supplemental <strong>feeds</strong><br />
are provided to the rice-prawn systems in northern Viet Nam. By contrast, farmers in<br />
the Mekong Delta usually provide supplementary feed in the <strong>for</strong>m <strong>of</strong> pellets <strong>and</strong> farmmade<br />
<strong>feeds</strong>. Farm-made <strong>feeds</strong> <strong>and</strong> feeding schedules are identical to those described in<br />
the previous section <strong>and</strong> yield varies from 300–500 kg/ha/crop. A recent study in Can<br />
Tho showed that farmers can obtain up to 600 kg/ha <strong>of</strong> prawns in the winter-rice crop<br />
by feeding a 9:1 mixture <strong>of</strong> golden snail <strong>and</strong> pellets (Hien, 2004).<br />
Pen culture <strong>of</strong> prawn<br />
Pens range in size between 100 <strong>and</strong> 900 m 2 <strong>and</strong> prawns are usually stocked in June at<br />
an average density <strong>of</strong> 62/m 2 . Pen culture is practiced on a multiple harvest strategy to<br />
maximize productivity <strong>and</strong> prawns are harvested every 2–4 months starting from the<br />
4 th month after the initial stocking. Harvesting lasts until late December or January.<br />
Average prawn yield is 0.52 kg/m 2 /year, Farm-made <strong>feeds</strong> are made from locally available<br />
ingredients such as snails, mud crab, trash fish, rice, coconut meal <strong>and</strong> cassava roots <strong>and</strong><br />
fed twice a day at 22 percent <strong>of</strong> body weight per day (Son, Yi <strong>and</strong> Phuong, 2005).<br />
2.1.5 Cage culture <strong>of</strong> fish<br />
A variety <strong>of</strong> species are farmed in cages. Grass carp are produced in small cages along<br />
rivers or in reservoirs in northern Viet Nam, the central highl<strong>and</strong>s <strong>and</strong> southeastern<br />
Viet Nam. Feed consists <strong>of</strong> locally available grasses. FCR is as high as 40:1 on a wet<br />
weight basis. In intensive cage culture, grass carp can be fed on other <strong>feeds</strong> such as<br />
paddy sprouts, sweet potato, cassava <strong>and</strong> cassava leaves.<br />
Giant snakehead, C. micropeltes is preferred by consumers <strong>and</strong> is cultured only in<br />
cages, while snakehead murrel (C. striata) is cultured only in ponds. Chopped trash<br />
fish is the sole feed <strong>for</strong> these fish <strong>and</strong> FCR ranges from 4.5–5:1. The recent proliferation<br />
<strong>of</strong> snakehead culture has become problematic as the capture <strong>of</strong> juveniles is affecting the<br />
conservation status <strong>of</strong> the species <strong>and</strong> <strong>of</strong> wetl<strong>and</strong> biomes.<br />
Cage culture <strong>of</strong> red tilapia is a recent initiative (1999), particularly in the peri-urban<br />
areas <strong>of</strong> Ho Chi Minh City <strong>and</strong> other cities. Red tilapia production in peri-urban areas<br />
<strong>of</strong> Ho Chi Minh City has increased from 300 tonnes in 2000 to 4 200 tonnes in 2004<br />
<strong>and</strong> this is a substantial proportion <strong>of</strong> national red tilapia production, which in 2004<br />
reached 15 000–20 000 tonnes. Farmers raise fingerlings in earthen ponds until they<br />
reach 50–100 g <strong>and</strong> then transfer them to cages, which vary in size from 60–120 m 3 .<br />
Commercially <strong>for</strong>mulated pellets are the main feed. Protein levels in the <strong>feeds</strong> range<br />
from 35–40 percent <strong>for</strong> fingerlings <strong>and</strong> 22–25 percent <strong>for</strong> growth-out. The fish are<br />
reared <strong>for</strong> 4–5 months to a marketable size <strong>of</strong> 0.6–1.0 kg. The fish are fed 3–4 times per<br />
day, following the feeding schedule <strong>of</strong> the manufacturer. FCR’s using <strong>for</strong>mulated <strong>feeds</strong><br />
range between 2.2–2.5:1. Farm-made <strong>feeds</strong> are rarely used in tilapia cage culture (Hung,<br />
Truc <strong>and</strong> Huy, 2007). Yields are high <strong>and</strong> range from 100–150 kg/m 3 /year.
Analysis <strong>of</strong> <strong>feeds</strong> <strong>and</strong> <strong>fertilizers</strong> <strong>for</strong> <strong>sustainable</strong> aquaculture development in Viet Nam 339<br />
TABLE 6<br />
Technical parameters <strong>for</strong> Pangasius cage culture<br />
Parameters Description<br />
Unit size (m3 ) 96–576<br />
Species cultured P. hypophthalmus, P. bocourti<br />
Feed used Farm-made feed in combination with pellets in early months <strong>of</strong> rearing<br />
Feeding strategy 2–3 times/day,<br />
3–5 % body weight/day<br />
Yield (kg/m3 /5–7 month cycle) 150–200<br />
Source: Hung, Truc <strong>and</strong> Huy (2007)<br />
The Mekong Delta is the main area <strong>for</strong> cage culture <strong>of</strong> pangasiid catfish, particularly<br />
P. hypophthalmus, P. bocourti <strong>and</strong> P. conchophilus. A detailed comparative account <strong>of</strong><br />
pangasiid cage <strong>and</strong> pond culture in the Mekong Delta is provided by Hung, Truc <strong>and</strong><br />
Huy (2007). Table 6 summarizes some technical parameters <strong>of</strong> pangasiid cage culture.<br />
2.1.6 Intensive pond culture <strong>of</strong> fish<br />
Pond culture <strong>of</strong> carnivorous fish is a common practice in Viet Nam. Snakehead, Chana<br />
striata is one <strong>of</strong> the main carnivorous species, which is intensively cultured in ponds<br />
in Viet Nam. Farm-made <strong>feeds</strong> are preferred <strong>and</strong> pelleted <strong>feeds</strong> are rarely used. Farmmade<br />
<strong>feeds</strong> with a protein content <strong>of</strong> at least 40 percent are made from trash fish, snails,<br />
small shrimps <strong>and</strong> chopped squid as protein sources <strong>and</strong> mixed with rice bran, broken<br />
rice or corn bran as well as vitamins <strong>and</strong> minerals to <strong>for</strong>m moist pellets. The fish are<br />
fed twice a day on a ration <strong>of</strong> 4–5 percent biomass per day. At present, the practice is<br />
heavily dependent on trash fish.<br />
Hybrid clariid catfish are raised mainly with restaurant wastes <strong>and</strong> animal manure.<br />
As mentioned previously the fish is commonly used in integrated livestock systems<br />
as they can effectively utilize livestock waste <strong>and</strong> can survive in poor water quality.<br />
Ground <strong>and</strong> mixed slaughterhouse waste such as poultry bones <strong>and</strong> intestines,<br />
livestock bones, restaurant waste, shrimp head waste, fish processing waste can also be<br />
used <strong>for</strong> hybrid catfish.<br />
Pangasiid pond culture has developed rapidly in recent years, particularly since the<br />
successful artificial breeding <strong>of</strong> tra catfish (P. hypophthalmus). The high cost <strong>of</strong> cage<br />
culture has also contributed to the development <strong>of</strong> pond culture. Hung, Truc <strong>and</strong> Huy<br />
(2007) provide a detailed comparative account <strong>of</strong> pangasiid pond, pen <strong>and</strong> cage culture<br />
(see also Phuong, Minh <strong>and</strong> Tuan, 2004). Table 7 summarizes some <strong>of</strong> the comparative<br />
detail.<br />
Giant gourami (Osphronemus goramy) is cultured mostly in ponds in southern<br />
Viet Nam <strong>and</strong> fed on aquatic or terrestrial plants. Even though the fish is classified as<br />
a herbivore, it readily consumes mixed farm-made <strong>feeds</strong> <strong>and</strong> pellets. By using pellets<br />
the production cycle can be reduced from 15–18 months to 8–10 months. The fish<br />
are grown mainly in peri-urban areas to supply restaurants <strong>and</strong> middle-class markets<br />
(Hung, 2004) <strong>and</strong> pond culture <strong>of</strong> gourami is <strong>of</strong>ten combined with morning glory<br />
culture (Huy, 2003).<br />
TABLE 7<br />
Technical description <strong>of</strong> pangasiid pond <strong>and</strong> pen culture in the Mekong delta<br />
Description Pond culture Pen culture<br />
Pond size 0.3–1.0 ha 0.3–0.5 ha<br />
Culture period (month) 6.25±0.87 5.6±0.8<br />
Stocking density (nos./m2 ) 20.5±10.0 (15–35) 34.8±8.1<br />
Feeds farm-made <strong>feeds</strong> & pellets farm-made <strong>feeds</strong> & pellets<br />
Survival rate (%) 94.0±2.20 82.6±4.0<br />
Productivity (tonnes/ha/crop) 150–-350 345±149<br />
Source: Phuong, Minh <strong>and</strong> Tuan (2004)
340<br />
<strong>Study</strong> <strong>and</strong> <strong>analysis</strong> <strong>of</strong> <strong>feeds</strong> <strong>and</strong> <strong>fertilizers</strong> <strong>for</strong> <strong>sustainable</strong> aquaculture development<br />
2.2 Coastal aquaculture systems<br />
2.2.1 Pond culture <strong>of</strong> tiger shrimp<br />
Shrimp culture in central Viet Nam is mainly intensive, whereas in the north <strong>and</strong> in<br />
southern Viet Nam it continues to range from extensive to intensive. The different<br />
systems require different feeding strategies <strong>and</strong> <strong>feeds</strong>.<br />
Extensive system<br />
Extensive shrimp farming is a traditional farming practice in the Mekong Delta <strong>and</strong><br />
other coastal provinces. In extensive systems water is exchanged tidally with the inflow<br />
bringing natural seed <strong>and</strong> feed to the culture ponds. Twice a month during the low<br />
spring tide, shrimp <strong>and</strong> fish are harvested as they move down with the water current<br />
to the sea. Feeding is not practiced in extensive systems <strong>and</strong> shrimp rely on naturally<br />
available foods. Until about 10 to 15 years ago natural seed abundance <strong>of</strong> Penaeus<br />
merguensis <strong>and</strong> P. indicus was sufficiently high to supply the ponds with juveniles.<br />
Recently farmers have had to stock tiger shrimp PLs to improve their yields due to<br />
a decline <strong>of</strong> natural seed. This is known as the improved extensive system. The two<br />
systems occupy a large proportion <strong>of</strong> shrimp culture surface area in Viet Nam <strong>and</strong><br />
particularly in the Mekong Delta. In 2003, extensive <strong>and</strong> improved extensive systems<br />
accounted <strong>for</strong> 68 percent <strong>and</strong> 27 percent <strong>of</strong> the shrimp farming surface area in the<br />
Mekong delta, respectively (Phuong, Minh <strong>and</strong> Tuan, 2004).<br />
Semi-intensive <strong>and</strong> intensive systems<br />
In semi intensive systems the natural food is supplemented with trash fish, small<br />
shrimp (Acetes sp.) <strong>and</strong> low price shrimp pellets. Stocking density ranges <strong>for</strong>m 5–10/m 2 .<br />
Aeration is not used. The systems may be operated on shrimp/rice rotation basis or<br />
integrated with mangroves. There are 20 500 ha <strong>of</strong> semi-intensive shrimp farms in the<br />
Mekong delta (MOFI, 2003).<br />
In the intensive systems, shrimp are stocked at 20–50 Post Larvae (PL) per m 2 . The<br />
system requires a high level <strong>of</strong> maintenance <strong>and</strong> management with respect to feeding,<br />
water quality control, the controlled use <strong>of</strong> antibiotics <strong>and</strong> aeration. Though most<br />
farmers use commercially <strong>for</strong>mulated shrimp <strong>feeds</strong> in these systems, some still follow<br />
traditional methods <strong>of</strong> improving yields by using fertilizer to stimulate plankton<br />
growth <strong>and</strong> adding trash fish. The total surface area under intensive culture in 2003<br />
was 15 534 ha (MOFI, 2004). The main species in the Mekong Delta is tiger shrimp,<br />
while Pacific white shrimp L.vannamei has now been introduced to farms in central<br />
Viet Nam. Stocking densities <strong>for</strong> white shrimp (95 PL/m 2 ) are much higher than <strong>for</strong><br />
tiger shrimp (18 PL/m 2 ).<br />
Formulated <strong>feeds</strong> are most <strong>of</strong>ten used in intensive systems, though some farmers<br />
combine <strong>for</strong>mulated <strong>and</strong> farm-made <strong>feeds</strong> during the final days <strong>of</strong> the production<br />
cycle. Farm-made <strong>feeds</strong> include cooked trash fish, small shrimp <strong>and</strong> molluscs. A study<br />
in Quang Ngai province <strong>of</strong> central Viet Nam shows that 30 percent <strong>of</strong> farmers still use<br />
farm-made <strong>feeds</strong> in intensive tiger shrimp culture, but not <strong>for</strong> white shrimp (Nhan,<br />
2005).<br />
Farmers use feeding trays (2–4 trays per 4 000–5 000 m 2 pond) to monitor<br />
consumption <strong>and</strong> to adjust the ration. Pellets are broadcast over the pond surface 2<br />
to 3 times per day using a boat or floating raft. All feed producers provide feeding<br />
tables to avoid over or under feeding. Table 8 is an example <strong>of</strong> a recommended<br />
feeding strategy. Daily feed is adjusted according to shrimp size <strong>and</strong> the remaining<br />
portion <strong>of</strong> feed on the feeding tray. Under good management FCRs <strong>for</strong> commercially<br />
<strong>for</strong>mulated <strong>feeds</strong> range from 1.3–1.5:1. In poorly managed systems FCR can be as<br />
high as 2.5:1. Under intensive culture conditions yields <strong>of</strong> up to 7 tonnes/ha/crop<br />
can be attained.
Analysis <strong>of</strong> <strong>feeds</strong> <strong>and</strong> <strong>fertilizers</strong> <strong>for</strong> <strong>sustainable</strong> aquaculture development in Viet Nam 341<br />
TABLE 8<br />
Manufacturer recommended feeding schedules <strong>for</strong> intensive shrimp culture using <strong>for</strong>mulated<br />
<strong>feeds</strong><br />
Stage Shrimp<br />
size (g)<br />
2.2.2 Rice-shrimp alternating system<br />
Alternating rice with shrimp culture is<br />
typical in many places in the Mekong<br />
Delta. The system was developed<br />
because <strong>of</strong> saltwater intrusion into rice<br />
fields during the dry season. During<br />
this period shrimp are stocked into<br />
the paddy fields <strong>and</strong> reared under<br />
improved extensive or semi-intensive<br />
conditions. Some output data from<br />
these systems is provided in Table 9.<br />
In these systems <strong>fertilizers</strong> are<br />
only applied when phytoplankton<br />
does not develop naturally. Farmers<br />
prefer chicken manure that is packed<br />
in bags <strong>and</strong> immersed. Inorganic<br />
fertilizer (NPK (nitrogen, phosphorus<br />
<strong>and</strong> potassium) 20:20:15 <strong>and</strong> urea<br />
Feeding rate 1 % feed distributed<br />
on feeding trays<br />
Feeding tray monitoring<br />
intervals (hrs)<br />
PL20–PL27 PL95 >20.0 3.5 3.3 2<br />
1 Percent body weight per day unless otherwise indicated; NA = not applicable<br />
Source: Ocialis Feed Company, Viet Nam (pers. com.)<br />
TABLE 9<br />
Some technical <strong>and</strong> economical parameters <strong>of</strong> alternating riceshrimp<br />
culture in the Mekong Delta<br />
Parameters Data<br />
Pond area (ha) 1–2<br />
Water surface (%) 25–30%<br />
Water level in rice field 30–50 cm<br />
Seed Hatchery produced seed (PL15) Stocking density (piece/m2 ) 2–-55 PLs/m2 Cropping season January – May<br />
Feed Pellet <strong>and</strong> farm-made <strong>feeds</strong><br />
Fertilization Lime <strong>and</strong> fertilizer<br />
Average survival rate 10–33%<br />
Production (kg/ha/year) 300–450<br />
Total cost (VND million/ha/crop) 10–15<br />
Total revenue (VND million/ha/crop) 30–45<br />
Benefit / cost ratio 2.5–3.0<br />
US$1.00 = VND 15 800<br />
Source: Phuong, Minh <strong>and</strong> Tuan (2004)<br />
(46 percent) at a 4:1 ratio) is only used when organic <strong>fertilizers</strong> are unavailable <strong>and</strong> is<br />
applied at 3–5 kg/1 000m 2 .<br />
The price <strong>and</strong> nutritive quality <strong>of</strong> <strong>feeds</strong> used in these systems is lower than those<br />
used in intensive systems. Several manufacturers produce specific <strong>feeds</strong> <strong>for</strong> rice-shrimp<br />
systems. Farmers usually use commercially <strong>for</strong>mulated feed in the first month where<br />
after they use farm-made <strong>feeds</strong>. A recent study has found that the use <strong>of</strong> farm-made<br />
<strong>feeds</strong> in these systems is wasteful <strong>and</strong> environmentally not <strong>sustainable</strong> <strong>and</strong> recommends<br />
that <strong>for</strong>mulated <strong>feeds</strong> only be used when natural food is limiting (Bur<strong>for</strong>d et al., 2004).<br />
Shrimps are fed 3–4 times per day <strong>and</strong> the ration is adjusted according to shrimp size<br />
<strong>and</strong> appetite (Preston <strong>and</strong> Clayton, 2004).<br />
2.2.3 Marine fish <strong>and</strong> lobster<br />
Marine fish <strong>and</strong> lobster are mainly cultured in floating cages in central <strong>and</strong> northern Viet<br />
Nam. Besides cage culture, marine fish <strong>and</strong> mud crab are also cultured in earthen ponds<br />
Lobster<br />
The preferred <strong>feeds</strong> <strong>for</strong> lobster cage culture are molluscs, crustaceans <strong>and</strong> trash fish<br />
(preferably red big-eye, pony fish <strong>and</strong> lizardfish). FCRs range from 28–29:1. The<br />
feeding regime is size dependent. Small lobsters are fed 3–4 times per day with a higher<br />
feed amount in the evening. Trash fish is chopped into small pieces, while molluscs<br />
are removed from their shells. At 400g <strong>and</strong> larger they are fed twice daily <strong>and</strong> feeding
342<br />
<strong>Study</strong> <strong>and</strong> <strong>analysis</strong> <strong>of</strong> <strong>feeds</strong> <strong>and</strong> <strong>fertilizers</strong> <strong>for</strong> <strong>sustainable</strong> aquaculture development<br />
intensity is substantially increased be<strong>for</strong>e moulting. During the last few months the<br />
proportion <strong>of</strong> molluscs <strong>and</strong> crustacean is increased, while trash fish is decreased (Tuan,<br />
2003). Feeding practices may vary from one place to another. For example, Edwards,<br />
Tuan <strong>and</strong> Allan (2004) report that lobsters in some areas are fed once per day <strong>and</strong><br />
farmers alternate between trash fish, snails, clams <strong>and</strong> small crustaceans on a daily<br />
basis to maintain optimum food intake. Lobsters also adapt well to <strong>for</strong>mulated <strong>feeds</strong>,<br />
though water stability <strong>and</strong> price largely preclude the use <strong>of</strong> pellets (Edwards, Tuan <strong>and</strong><br />
Allan, 2004). Cages vary in size from 3–50 m 2 (bottom area) <strong>and</strong> 2–3 m in depth with a<br />
submerged depth <strong>of</strong> 1–1.5 m (Tuan, 2003).<br />
Grouper <strong>and</strong> cobia culture<br />
Grouper are cultured in cages <strong>and</strong> in earthen ponds. Stocking density in cages may<br />
be as high as 25 fish/m 3 but can be adjusted accordingly to size <strong>of</strong> the seed. The main<br />
<strong>feeds</strong> are trash fish, shrimp <strong>and</strong> crabs. Despite its high price (VND 3 000–10 000/kg),<br />
the preferred trash fish <strong>for</strong> grouper is anchovy. If anchovy is in short supply farmers<br />
use pony fish at around half the price. The fish are fed twice a day at dawn <strong>and</strong> dusk<br />
on a daily ration <strong>of</strong> 3–10 percent fish biomass. Trash fish is used whole or chopped<br />
according to the mouth size <strong>of</strong> the fish. Trash fish is sometimes boosted with a vitamin<br />
<strong>and</strong> mineral premix at 0.5 percent <strong>of</strong> feed weight. Decayed or rotten trash fish is not<br />
used <strong>for</strong> grouper culture. Recent work by Edwards, Tuan <strong>and</strong> Allan (2004) has shown<br />
that trash fish <strong>for</strong> grouper as well as cobia is the most cost effective, though MOFI is<br />
concerned about the level <strong>of</strong> pollution caused by the use <strong>of</strong> this food in grouper <strong>and</strong><br />
cobia culture. Presently, grouper <strong>and</strong> cobia culture is entirely dependent on trash fish.<br />
The reduced availability <strong>of</strong> this commodity has now <strong>for</strong>ced many farmers to reduce<br />
their feeding frequency to once every four days. Interestingly, growth rate has not<br />
been significantly affected <strong>and</strong> this practice reduces the impact <strong>of</strong> cage culture on the<br />
environment (Thanh, 2005).<br />
Pond culture <strong>of</strong> grouper is a recent initiative <strong>and</strong> investment costs are lower than<br />
cage culture. The FCR <strong>of</strong> grouper in ponds (4.3:1) is lower than in cages (Trai <strong>and</strong><br />
Hambrey, 1998).<br />
3. REVIEW OF THE AQUAFEED INDUSTRY<br />
Aquafeed production in Viet Nam started in 1998 when several animal feed<br />
manufacturers recognized the opportunities. The domestic animal feed industry is well<br />
established. Currently only shrimp <strong>and</strong> pangasiid catfish <strong>feeds</strong> are made (Hung, 2006).<br />
The aquafeed industry is reviewed in the context <strong>of</strong> its present status, opportunities <strong>and</strong><br />
constraints to support the <strong>sustainable</strong> development <strong>of</strong> aquaculture.<br />
3.1 Animal feed Industry<br />
Commercial animal feed production has grown at an annual rate <strong>of</strong> 10–13 percent.<br />
In 2003 Viet Nam produced 3.8 million tonnes <strong>of</strong> animal feed, <strong>of</strong> which 70 percent<br />
comprised complete <strong>feeds</strong> <strong>and</strong> 30 percent <strong>of</strong> concentrates (which the farmers mix<br />
with on-farm ingredients). Current production does not meet the domestic dem<strong>and</strong><br />
(Table 10). The industry relies heavily on imported feed ingredients, including soybean<br />
meal, corn, fishmeal, meat <strong>and</strong> bone meal, rice <strong>and</strong> wheat bran <strong>and</strong> feed pre-mixes <strong>and</strong><br />
vitamins (Huong, 2004).<br />
According to MARD there were 182 animal feed <strong>and</strong> premix manufacturers<br />
operating in Viet Nam in 2003. Of these 138 are fully fledged animal feed mills that<br />
produce complete <strong>feeds</strong> as well as feed concentrates. The total production capacity <strong>of</strong><br />
the animal feedmills is estimated at 5 million tonnes per annum, which falls short <strong>of</strong> the<br />
dem<strong>and</strong> (Table 10). Fifteen <strong>of</strong> the 138 feedmills are either wholly owned subsidiaries <strong>of</strong><br />
<strong>for</strong>eign companies or are joint ventures <strong>and</strong> these companies hold more than 50 percent<br />
<strong>of</strong> the animal feed production capacity in Viet Nam. Key companies include Proconco
Analysis <strong>of</strong> <strong>feeds</strong> <strong>and</strong> <strong>fertilizers</strong> <strong>for</strong> <strong>sustainable</strong> aquaculture development in Viet Nam 343<br />
a Viet Nam - French joint venture), CP Group <strong>of</strong><br />
Thail<strong>and</strong>, Cargill <strong>of</strong> the United States <strong>of</strong> America,<br />
Uni President <strong>of</strong> Taiwan Province <strong>of</strong> China <strong>and</strong><br />
the Cheil Jedang Group <strong>of</strong> South Korea (Huong,<br />
2004).<br />
Because <strong>of</strong> the rapidly increasing dem<strong>and</strong> <strong>for</strong><br />
aqua<strong>feeds</strong>, animal feed manufacturers have shifted<br />
their production lines to produce aqua<strong>feeds</strong> mainly<br />
<strong>for</strong> shrimp <strong>and</strong> pangasiid catfish.<br />
TABLE 10<br />
Animal feed requirements <strong>and</strong> production in<br />
2000-2002 (thous<strong>and</strong> tonnes)<br />
Year 2000 2001 2002<br />
National animal feed<br />
requirement<br />
8 200 8 500 8 900<br />
Total animal feed production 2 700 3 000 3 400<br />
Complete feed 1 700 1 950 2 400<br />
Feed concentrate 330 350 340<br />
Source: Ministry <strong>of</strong> Agriculture <strong>and</strong> Rural Development,<br />
MARD (pers. com.)<br />
3.2 Shrimp <strong>feeds</strong><br />
The shrimp feed industry is in its infancy. Activities began in 1998 with an annual<br />
production <strong>of</strong> 10 000 tonnes per year. The current dem<strong>and</strong> <strong>for</strong> commercial shrimp<br />
<strong>feeds</strong> in Viet Nam is about 150 000–200 000 tonnes per year. Although the bulk <strong>of</strong> the<br />
dem<strong>and</strong> can theoretically be met by domestic production, approximately 3–5 percent<br />
still has to be imported (Hung, 2006).<br />
There are 36 aquafeed-mills in Viet Nam, 23 <strong>of</strong> which produce shrimp feed. Five<br />
multinational companies each with an installed capacity <strong>of</strong> 20 000–40 000 tonnes per<br />
annum, dominate shrimp feed production in the country. In addition to the larger<br />
companies, there are about 10 smaller, locally owned companies that manufacture<br />
shrimp <strong>feeds</strong>. These feed mills have an installed capacity <strong>of</strong> 5 000–10 000 tonnes per year.<br />
However, many <strong>of</strong> them are not adequately equipped to produce good quality feed.<br />
Most <strong>of</strong> the local companies simply adapted their livestock feed equipment to produce<br />
shrimp feed <strong>and</strong> found that such modifications seldom worked well. As a result, many<br />
are now planning to install dedicated shrimp feed manufacturing equipment. The main<br />
producers <strong>of</strong> shrimp feed, their location <strong>and</strong> capacity are listed in Table 11.<br />
The total capacity <strong>of</strong> shrimp feedmills in Viet Nam is in the range <strong>of</strong> 300 000–400 000<br />
tonnes per annum, which currently exceeds dem<strong>and</strong>. Despite the over-capacity, further<br />
growth in the country’s shrimp feed industry is expected due to following reasons<br />
(Hung, 2006):<br />
• the seasonal nature <strong>of</strong> shrimp farming, produces a peak in dem<strong>and</strong> during the<br />
summer months that exceeds installed capacity. Stronger companies with high<br />
market share are exp<strong>and</strong>ing their feedmill capacity; <strong>and</strong><br />
• the intensive shrimp farming sector, though occupying less than 10 percent <strong>of</strong><br />
national shrimp pond surface area consumes 80–90 percent <strong>of</strong> <strong>for</strong>mulated <strong>feeds</strong>.<br />
Further intensification <strong>of</strong> shrimp farming in the country provides enormous scope<br />
<strong>for</strong> growth <strong>of</strong> the feed industry.<br />
TABLE 11<br />
List <strong>of</strong> main shrimp feed producers in Viet Nam<br />
Company Ownership Location Capacity (tonnes/year) Year <strong>of</strong> commencement<br />
C J Vina Agri South Korea Long An 12 000 2003<br />
Ocialis France Binh Duong 10 000 2003<br />
Asia Hawaii Joint venture (VN-USA) Phu Yen 20 000 2002<br />
Uni-President Taiwan Province <strong>of</strong> China Binh Duong 60 000 2001<br />
Uni-Long Taiwan Province <strong>of</strong> China Nha Trang 20 000 2000<br />
Grobest Taiwan Province <strong>of</strong> China Dong Nai 25 000 2001<br />
CP group Thail<strong>and</strong> Dong Nai 30 000–40 000 2001<br />
Tom Boy Taiwan Province <strong>of</strong> Chin HCM city 30 000 2002<br />
Cargill USA Dong Nai 10 000 2001<br />
Proconco Joint venture (VN-France) Can Tho 12 000 2000<br />
Cataco Viet Nam Can Tho 12 000 2003<br />
Dabasco Viet Nam Can Tho 20 000 2002<br />
Seaprodex Viet Nam Da Nang 15 000 1990<br />
Source: Serene <strong>and</strong> Merican (2004)
344<br />
<strong>Study</strong> <strong>and</strong> <strong>analysis</strong> <strong>of</strong> <strong>feeds</strong> <strong>and</strong> <strong>fertilizers</strong> <strong>for</strong> <strong>sustainable</strong> aquaculture development<br />
TABLE 12<br />
Nutrient composition <strong>of</strong> commercial shrimp feed (% dry matter basis)<br />
Stage Moisture Crude protein Crude lipid Crude fibre Ash Calcium Phosphorus<br />
Post larvae 43 >5 1.5<br />
Starter 41 >6 1.5<br />
Grower 38 >6 1.5<br />
Finisher 36 >6 1.5<br />
Source: Ocialis Feed Company, Viet Nam (pers. com.)<br />
Most shrimp feedmills in Viet Nam are located in the vicinity <strong>of</strong> Ho Chi Minh City.<br />
Its port <strong>and</strong> accessibility to markets provide distinct advantages to feed manufacturers.<br />
Almost all major shrimp feed ingredients including soybean meal, fishmeal, flour, fish<br />
oil <strong>and</strong> feed additives are imported. Besides the average import duty <strong>of</strong> 10 percent, all<br />
ingredients <strong>and</strong> feed additives carry value-added tax (VAT) at five percent, except <strong>for</strong><br />
soybean meal.<br />
In 2004, the Ministry <strong>of</strong> Fisheries published a quality st<strong>and</strong>ard <strong>for</strong> shrimp feed<br />
(28 TCN 102: 2004) that obligates feedmills to comply with certain minimum st<strong>and</strong>ards<br />
(Appendix A.1.). According to the st<strong>and</strong>ard, crude protein content <strong>of</strong> the manufactured<br />
<strong>feeds</strong> should be 35 percent <strong>for</strong> grow-out shrimp (>20g) <strong>and</strong> up to 42 percent <strong>for</strong><br />
beginner <strong>feeds</strong> (0.01–0.20 g). Gross energy should be at least 3 000 cal/kg - <strong>for</strong> grow-out<br />
<strong>and</strong> 3 400 cal/kg <strong>for</strong> beginner <strong>feeds</strong>. Other nutrients in <strong>for</strong>mulated feed such as crude<br />
lipids, calcium, phosphorus, fibre, mineral, lysine <strong>and</strong> methionine <strong>and</strong> aflatoxin are<br />
also st<strong>and</strong>ardized. There are about 5–6 types <strong>of</strong> <strong>feeds</strong> that are produced <strong>for</strong> different<br />
stages <strong>of</strong> tiger shrimp. The nutrient composition <strong>of</strong> the various products does not differ<br />
much among producers. Table 12 is an example <strong>of</strong> the general nutrient composition <strong>of</strong><br />
shrimp <strong>feeds</strong>.<br />
Feed is distributed through an elaborate network <strong>of</strong> dealers <strong>and</strong> sub-dealers<br />
throughout the country. Each company sets up its own distribution channel to cover<br />
markets in coastal provinces from the south to the north <strong>of</strong> Viet Nam. The average<br />
price <strong>of</strong> grow-out feed is US$1.00 per kg <strong>and</strong> does not vary much among companies.<br />
Dealers typically provide the feed on a cash-only basis during the first two months <strong>of</strong><br />
a crop, where after credit can be extended <strong>for</strong> the remaining culture period depending<br />
on growth <strong>and</strong> survival.<br />
3.3 Fish <strong>feeds</strong><br />
Formulated pellets are used mainly in Pangasius catfish <strong>and</strong> red tilapia. However,<br />
trash fish still remains as one <strong>of</strong> the major feed components <strong>for</strong> all omnivorous <strong>and</strong><br />
carnivorous fish species.<br />
3.3.1 Trash fish<br />
Trash fish is traditionally used to feed freshwater <strong>and</strong> marine carnivorous fish <strong>and</strong><br />
lobsters. Trash fish mainly comprises low value species from the marine <strong>and</strong> inl<strong>and</strong><br />
capture fisheries. The rapid development <strong>of</strong> carnivorous fish culture has resulted in an<br />
imbalance between supply <strong>and</strong> dem<strong>and</strong> <strong>and</strong> this has led to substantial price increases<br />
TABLE 13<br />
An estimation <strong>of</strong> trash fish used <strong>for</strong> inl<strong>and</strong> <strong>and</strong> marine fish culture in Viet Nam<br />
Species<br />
Production<br />
(tonnes)<br />
%<strong>of</strong> trash<br />
fish use<br />
FCR<br />
Moist/wet feed<br />
(tonnes)<br />
Trash fish (tonnes)<br />
Min Max<br />
Pangasius catfish 180 000 80 2.50 360 000 64 800 180 000<br />
Marine shrimp 160 000 38 4.74 287 280 71 820 143 640<br />
Marine fish 2 000 100 5.90 11 800 11 800 11 800<br />
Lobster 1 000 100 28.00 28 000 28 000 28 000<br />
Total 6 870 801 176 420 363 440<br />
Source: Edwards, Tuan <strong>and</strong> Allan (2004)
Analysis <strong>of</strong> <strong>feeds</strong> <strong>and</strong> <strong>fertilizers</strong> <strong>for</strong> <strong>sustainable</strong> aquaculture development in Viet Nam 345<br />
in recent years. There are no <strong>of</strong>ficial statistics on trash fish consumption by the<br />
aquaculture sector. However, Edwards, Tuan <strong>and</strong> Allan (2004) estimated (Table 13) that<br />
between 64 800–180 000 <strong>and</strong> 72 000–144 000 tonnes <strong>of</strong> trash fish is used <strong>for</strong> inl<strong>and</strong> <strong>and</strong><br />
coastal aquaculture, respectively <strong>and</strong> that total consumption <strong>of</strong> the aquaculture sector<br />
in Viet Nam was between 177 000–364 000 tonnes per annum.<br />
It is likely that Edwards, Tuan <strong>and</strong> Allan (2004) underestimated trash fish consumption<br />
because they did not take full account <strong>of</strong> snakehead culture in the Mekong Delta. There<br />
have been many Research <strong>and</strong> Development (R&D) attempts to promote the use <strong>of</strong><br />
alternative <strong>feeds</strong> <strong>for</strong> carnivores but results have not been widely applied in practice.<br />
3.3.2 Pangasius catfish feed<br />
Viet Nam is the largest producer <strong>of</strong> pangasiid catfish in the world. The national<br />
production in 2004 was about 260 000–300 000 tonnes (MOFI, 2004). Basa catfish<br />
(P. bocourti) <strong>and</strong> tra catfish (P. hypophthalmus) are the dominant culture species in<br />
Viet Nam. Besides farm-made <strong>feeds</strong>, <strong>for</strong>mulated <strong>feeds</strong> are increasingly being used in<br />
catfish production. Although the cost <strong>of</strong> manufactured <strong>feeds</strong> is higher than that <strong>of</strong><br />
farm-made <strong>feeds</strong>, farmers are <strong>of</strong> the opinion that the quality <strong>of</strong> fish is improved when<br />
manufactured <strong>feeds</strong> are used. Contrary to commercial shrimp <strong>feeds</strong>, catfish <strong>feeds</strong> are<br />
<strong>for</strong>mulated using mostly local ingredients such as rice bran, cassava meal, soybean<br />
meal, local fishmeal <strong>and</strong> feed additives. All manufactured <strong>feeds</strong> are extruded. The<br />
leading catfish feed producers at present are Proconco, Cargill, Uni President <strong>and</strong><br />
Green Feed. Collectively, these companies have an installed capacity <strong>of</strong> 80 000–100 000<br />
tonnes per year (Table 14) (Hung, 2006).<br />
Local companies such as Afiex, Cataco <strong>and</strong> Vinh Tuong also manufacture significant<br />
volumes <strong>of</strong> catfish <strong>feeds</strong>. Collectively, these companies have an installed capacity <strong>of</strong><br />
30 000–50 000 tonnes per year. There are no <strong>of</strong>ficial data <strong>for</strong> commercial catfish feed<br />
production. However, based on catfish production<br />
data it is estimated that some 300 000–400 000 tonnes<br />
<strong>of</strong> commercial catfish feed was produced in 2004.<br />
Manufactured catfish <strong>feeds</strong> also have to meet<br />
feed quality st<strong>and</strong>ards as assigned by the Ministry<br />
<strong>of</strong> Fisheries (28 TCN 188:2004, see Appendix<br />
A.2.), according to which the crude protein content<br />
in <strong>for</strong>mulated <strong>feeds</strong> should be at least 18 percent<br />
<strong>for</strong> grow out (500 g) <strong>and</strong> up to 40 percent <strong>for</strong><br />
fingerlings (1–5 g). Gross energy should be in the<br />
range <strong>of</strong> 1 500 cal/g <strong>for</strong> fish size <strong>of</strong> 500 g <strong>and</strong> up to<br />
3 300 cal/g <strong>for</strong> fingerlings (1–5 g). Other nutrients<br />
including lipid, fibre, ash, calcium, phosphorus,<br />
lysine <strong>and</strong> methionine are also st<strong>and</strong>ardised.<br />
Table 15 is an example <strong>of</strong> the nutrient composition<br />
<strong>of</strong> a commercial catfish feed.<br />
TABLE 14<br />
Annual capacity <strong>of</strong> catfish feed producers<br />
Feedmill<br />
Multinational<br />
Location<br />
Annual production<br />
capacity (tonnes)<br />
Proconco Can Tho 100 000–120 000<br />
Cargill Dong Nai 60 000–80 000<br />
Uni President Binh Duong 60 000–80 000<br />
Green Feed Long An 60 000–80 000<br />
Woosung Dong Nai 60 000–80 000<br />
Tan Sanh<br />
Local<br />
Mekong Delta 40 000–50 000<br />
Viet Thang Mekong Delta 40 000–50 000<br />
Afiex Mekong Delta 30 000–50 000<br />
Cataco Mekong Delta 30 000–50 000<br />
My Tuong Mekong Delta 20 000–30 000<br />
Source: Hung (2006)<br />
TABLE 15<br />
Nutrient composition <strong>of</strong> a commercial <strong>for</strong>mulated feed <strong>for</strong> Pangasius catfish (percent dry matter basis, unless<br />
otherwise indicated)<br />
Feed<br />
types<br />
Crude protein<br />
(minimum)<br />
Crude lipid<br />
minimum<br />
Calcium<br />
Crude<br />
fibre<br />
Phosphorus Moisture<br />
ME<br />
(cal/kg)<br />
Lysine Methionine<br />
6106 35 3.0 1.0–3.0 6 0.95 11.0 2 500 1.50 0.85<br />
6116 32 3.0 1.0–3.0 6 0.95 11.0 2 600 1.45 0.70<br />
6326 28 2.5 1.0–3.1 6 1.00 11.0 2 000 1.30 0.65<br />
6336 25 2.2 0.8–2.5 7 1.00 11.0 2 000 1.00 0.50<br />
6346 22 2.2 0.8–2.5 7 1.00 11.0 2 000 0.80 0.45<br />
6356 20 2.2 0.8–2.5 7 1.00 11.0 2 000 0.60 0.50<br />
Source: Green Feed Company (pers. com.)
346<br />
<strong>Study</strong> <strong>and</strong> <strong>analysis</strong> <strong>of</strong> <strong>feeds</strong> <strong>and</strong> <strong>fertilizers</strong> <strong>for</strong> <strong>sustainable</strong> aquaculture development<br />
TABLE 16<br />
Nutrient composition <strong>of</strong> commercially <strong>for</strong>mulated tilapia feed (% dry matter basis)<br />
Fish stage/size<br />
(g)<br />
Feed type/Ssize<br />
(mm)<br />
Moisture Crude protein Crude lipid Crude fibre Ash<br />
Fingerlings Crumbles 11 40 5 4 10<br />
5–20 Pellet (1.5) 11 40 5 4 10<br />
20–200 Pellet (2.0) 11 30 6 4 10<br />
200–400 Pellet (3.0) 11 30 6 4 10<br />
400–600 Pellet (5.0) 11 22 5 6 12<br />
600–1000 Pellet (7.0) 11 22 5 6 12<br />
Source: Cargill Company (pers. com.)<br />
The average price <strong>of</strong> the <strong>feeds</strong> is around US$0.35/kg <strong>for</strong> starter <strong>feeds</strong> with 30 percent<br />
crude protein <strong>and</strong> US$0.25/kg <strong>for</strong> grower <strong>feeds</strong> (18–20 percent crude protein). Typical<br />
FCRs are around 1.5 <strong>and</strong> 2.0:1 in ponds <strong>and</strong> cages, respectively.<br />
3.3.3 Tilapia feed<br />
Because <strong>of</strong> the integrated nature <strong>of</strong> tilapia farming in Viet Nam the use <strong>of</strong> <strong>for</strong>mulated<br />
<strong>feeds</strong> is unpr<strong>of</strong>itable. Several previous attempts to culture GIFT (genetically modified<br />
farm tilapia) tilapia in cages using <strong>for</strong>mulated <strong>feeds</strong> have not yielded good economic<br />
results, though recent work by the Research Institute <strong>for</strong> Aquaculture (RIA) No. 1<br />
suggests otherwise. However, the use <strong>of</strong> <strong>for</strong>mulated pellets <strong>for</strong> cage <strong>and</strong> tank farming<br />
<strong>of</strong> red tilapia is a viable proposition. In the past farmers simply used <strong>for</strong>mulated catfish<br />
pellets, but because <strong>of</strong> increasing dem<strong>and</strong> <strong>for</strong> a tilapia <strong>for</strong>mulation, manufacturers<br />
have recently introduced a feed to the market. There is no <strong>of</strong>ficial data <strong>for</strong> tilapia feed<br />
consumption but based on red tilapia production in Viet Nam, it is estimated that<br />
there would be a current dem<strong>and</strong> <strong>of</strong> around 50 000–60 000 tonnes <strong>of</strong> tilapia feed per<br />
annum.<br />
In 2004, MOFI published a quality st<strong>and</strong>ard <strong>for</strong> <strong>for</strong>mulated tilapia <strong>feeds</strong> (28 TCN<br />
189: 2004, Appendix A.3.). Crude protein content should be in the range <strong>of</strong> 20 percent<br />
<strong>for</strong> grow-out (500 g fish size) to 40 percent in crumble <strong>feeds</strong> <strong>for</strong> fingerlings (5 g).<br />
Gross energy should be at least 2700 cal/g <strong>for</strong> growth out <strong>and</strong> up to 3200 cal/g <strong>for</strong><br />
fingerling feed. Other nutrients are also st<strong>and</strong>ardized. Table 16 provides an example <strong>of</strong><br />
the nutrient composition <strong>of</strong> tilapia <strong>feeds</strong>.<br />
3.3.4 Marine fish feed<br />
Grouper, cobia, sea bream, snapper are currently the four main marine fish cultured<br />
in Viet Nam. As outlined above <strong>and</strong> mainly <strong>for</strong> economic reasons trash fish remains<br />
the feed <strong>of</strong> choice (Edwards, Tuan <strong>and</strong> Allan, 2004). Formulated <strong>feeds</strong>, imported<br />
from Taiwan Province <strong>of</strong> China are currently being tested to replace trash fish. Two<br />
feed companies (Uni President <strong>and</strong> CP Group) have attempted to develop a local<br />
<strong>for</strong>mulation to replace trash fish in marine fish farming (Orachunwong , Thammasart<br />
<strong>and</strong> Lohawatanakul, 2005).<br />
4. FERTILIZERS, FEED INGREDIENTS AND FEEDS IN AQUACULTURE<br />
In semi-intensive <strong>and</strong> intensive fish farming systems, nutrient inputs including <strong>feeds</strong><br />
<strong>and</strong> <strong>fertilizers</strong> are essential <strong>for</strong> fish production. This section <strong>of</strong> the review focuses on<br />
fertilizer use <strong>and</strong> supply <strong>and</strong> feed ingredient composition, availability <strong>and</strong> supply.<br />
4.1 Fertilizers<br />
4.1.1 Inorganic <strong>fertilizers</strong><br />
Viet Nam imports most <strong>of</strong> its inorganic <strong>fertilizers</strong> <strong>for</strong> rice farming <strong>and</strong> other crops<br />
<strong>and</strong> supply is rarely limited. However, the use <strong>of</strong> inorganic <strong>fertilizers</strong> has not yet<br />
become a common practice in aquaculture in Viet Nam. Fertilizers are mainly applied<br />
<strong>for</strong> intermediate stimulation <strong>of</strong> phytoplankton growth during the nursery period.
Analysis <strong>of</strong> <strong>feeds</strong> <strong>and</strong> <strong>fertilizers</strong> <strong>for</strong> <strong>sustainable</strong> aquaculture development in Viet Nam 347<br />
The most commonly used inorganic <strong>fertilizers</strong><br />
are Urea, NPK <strong>and</strong> DAP (di-ammoniumphosphate).<br />
Urea is the most popular fertilizer applied<br />
to shrimp ponds <strong>and</strong> is applied at a loading rate<br />
<strong>of</strong> 20–30 kg/5 000 m 2 to boost phytoplankton<br />
growth in the initial 15–20 days, during which<br />
the post larvae cannot feed on pelleted feed.<br />
The most common NPK <strong>for</strong>mulation used is<br />
18:46:0, while di-ammonium-phosphate (DAP)<br />
(40 percent P 2O 5 <strong>and</strong> 18 percent N) is employed<br />
in freshwater nursery ponds <strong>and</strong> intensive<br />
shrimp ponds to stimulate intermediate growth<br />
<strong>of</strong> algae <strong>and</strong> phytoplankton.<br />
4.1.2 Organic <strong>fertilizers</strong><br />
The types <strong>of</strong> organic fertilizer <strong>and</strong> application<br />
rates vary <strong>and</strong> are dependent on the system,<br />
species <strong>and</strong> farmer habits. Farmers apply<br />
various organic <strong>fertilizers</strong> <strong>for</strong> pond preparation<br />
<strong>and</strong> or during the nursing stage. Sewerage fed<br />
TABLE 17<br />
Nutrient content <strong>of</strong> common animal<br />
manures used in aquaculture in Viet Nam<br />
Manure Percent (fresh weight basis)<br />
Moisture N P2O5 K2O Pig 82.0 0.8 0.4 0.3<br />
Cattle 83.1 0.3 0.2 1.0<br />
Horse 75.7 0.4 0.4 0.4<br />
Chicken 56.0 1.6 0.5 0.9<br />
Duck 56.0 1.0 1.4 0.6<br />
Source: Dat (2002)<br />
TABLE 18<br />
Composition <strong>of</strong> common green fodders<br />
used as <strong>fertilizers</strong> in Viet Nam<br />
Plants Percent (dry matter basis)<br />
N P2O5 Back bean 1.7 0.3<br />
Water hyacinth 4.8 0.6<br />
Duck weed 2.8 0.4<br />
Source: Dat (2002)<br />
aquaculture systems, particularly <strong>for</strong> the rearing <strong>of</strong> red tilapia fry <strong>and</strong> fingerlings, are<br />
popular in Ho Chi Minh City <strong>and</strong> Ha Noi. However, there are various factors, such as<br />
the rapid rate <strong>of</strong> urbanization, l<strong>and</strong> availability <strong>and</strong> consumer dem<strong>and</strong>s, that presently<br />
limit the use <strong>of</strong> sewerage as a fertilizer source.<br />
Animal manures<br />
As mentioned earlier, animal manures are frequently used in integrated systems to<br />
maximize the use <strong>of</strong> on-farm resources. Application rates are highly variable because<br />
farmers are generally not well in<strong>for</strong>med. The general recommended application rate is<br />
25–30 kg/100 m 2 as the primary nutrient base <strong>for</strong> the development <strong>of</strong> natural foods in<br />
polyculture ponds.<br />
The nutrient content <strong>of</strong> different animal manures used in aquaculture are shown<br />
in Table 17. Chicken, pig <strong>and</strong> duck manures have the highest N <strong>and</strong> P 2O 5 content <strong>and</strong><br />
hence are most frequently applied in aquaculture systems.<br />
The direct application <strong>of</strong> manure to fish ponds is not a common practice in Viet<br />
Nam due to competition with crop farming. However, many farmers construct a pigsty<br />
or chicken house over the fishponds or in close proximity to their ponds. It has been<br />
found that 2–3 pigs are adequate to fertilize a fishpond area <strong>of</strong> 500–1 000 m 2 .<br />
Green fodder fertilizer<br />
Besides animal manures, some green fodders are also composted to provide pond<br />
nutrients. Common green fodders that are used as <strong>fertilizers</strong> are listed in Table 18. The<br />
fodder is placed in a crib in the corner <strong>of</strong> a pond <strong>and</strong> the nutrients released stimulate<br />
natural productivity. This type <strong>of</strong> fertilization is usually practiced in small-ponds under<br />
polyculture conditions <strong>and</strong> is most commonly used in upl<strong>and</strong> areas in the central<br />
highl<strong>and</strong>s <strong>and</strong> in southeastern Viet Nam.<br />
4.2 Feed Ingredients<br />
4.2.1 Rice <strong>and</strong> rice by-products<br />
The conversion rate <strong>of</strong> paddy rice into its by-products is 64 percent rice, 10 percent<br />
rice bran <strong>and</strong> 6 percent broken rice. The national yearly production <strong>of</strong> paddy is<br />
about 33–34 million tonnes (MARD). Rice <strong>and</strong> broken rice is mainly used <strong>for</strong> human
348<br />
<strong>Study</strong> <strong>and</strong> <strong>analysis</strong> <strong>of</strong> <strong>feeds</strong> <strong>and</strong> <strong>fertilizers</strong> <strong>for</strong> <strong>sustainable</strong> aquaculture development<br />
TABLE 19<br />
Annual production <strong>of</strong> paddy, rice bran <strong>and</strong> broken rice during<br />
1998-2002<br />
Year<br />
1998 1999 2000 2001<br />
Production (million tonnes)<br />
2002<br />
Rice paddy 29.15 31.39 32.53 32.98 33.54<br />
Rice bran 2.91 3.14 3.25 3.30 3.35<br />
Broken rice 1.75 1.88 1.95 1.98 2.01<br />
Source: Ministry <strong>of</strong> Agriculture <strong>and</strong> Rural Development, MARD (pers. com.)<br />
TABLE 20<br />
Estimation <strong>of</strong> rice bran use in aqua<strong>feeds</strong> <strong>for</strong> catfish (tonnes)<br />
Feed types Production % rice bran Rice bran used in<br />
aqua<strong>feeds</strong><br />
Min Max Min Max<br />
Formulated <strong>feeds</strong> 300 000 20 50 60 000 150 000<br />
Farm-made <strong>feeds</strong> 500 000 40 70 200 000 350 000<br />
Tilapia <strong>feeds</strong> 50 000 20 40 10 000 20 000<br />
Total 270 000 520 000<br />
consumption, while rice bran <strong>and</strong> a<br />
small proportion <strong>of</strong> broken rice are used<br />
<strong>for</strong> animal feed. These by-products are<br />
indispensable ingredients in <strong>for</strong>mulated<br />
<strong>and</strong> farm-made <strong>feeds</strong> <strong>for</strong> tilapia <strong>and</strong><br />
pangasiid catfish <strong>feeds</strong> but is rarely used<br />
in shrimp feed due to its high fibre<br />
content. In 2002, the annual production<br />
<strong>of</strong> rice bran <strong>and</strong> broken rice in Viet Nam<br />
was 3.3–3.5 million <strong>and</strong> 2.0–2.1 million<br />
tonnes, respectively (Table 19).<br />
The inclusion rate <strong>of</strong> rice bran in<br />
<strong>for</strong>mulated catfish <strong>and</strong> tilapia <strong>feeds</strong><br />
varies from 20–50 percent, depending<br />
on the growth stage. In farm-made<br />
<strong>feeds</strong>, rice bran is used at inclusion<br />
rates <strong>of</strong> 40–70 percent (Phuong, Minh<br />
TABLE 21<br />
Nutrient composition (% as fed basis) <strong>of</strong> rice bran <strong>and</strong> defatted rice bran in Viet Nam<br />
Composition Dry matter Crude protein Crude lipid NFE Ash Crude fibre<br />
Rice bran type I 87.6 13.0 12.0 46.4 8.4 7.8<br />
Rice bran type II 90.3 9.8 6.8 40.1 15.1 18.6<br />
Rice bran type III 89.7 7.6 5.0 38.9 14.9 23.3<br />
Defatted rice bran 89.0 14.9 3.6 47.6 10.4 11.2<br />
Source: NIAH (1995)<br />
<strong>and</strong> Tuan, 2004). There are no <strong>of</strong>ficial data <strong>of</strong> rice bran consumption by aquaculture.<br />
An estimation based on fish production, average FCRs <strong>and</strong> average inclusion rates<br />
is provided in Table 20. The data suggest that the aquafeed industry annually needs<br />
300 000–500 000 tonnes <strong>of</strong> rice bran. According to the above estimate, domestic rice<br />
production can supply the dem<strong>and</strong> <strong>of</strong> both the animal <strong>and</strong> aquafeed industries.<br />
There are three types <strong>of</strong> rice bran in Viet Nam. Type II <strong>and</strong> III have a low protein<br />
content <strong>and</strong> are not suitable <strong>for</strong> extruded <strong>feeds</strong> due to a high fibre content (Table 21).<br />
However, they can be used <strong>for</strong> farm-made <strong>feeds</strong>. On-farm storage <strong>of</strong> rice bran is<br />
difficult because <strong>of</strong> the high lipid <strong>and</strong> moisture content <strong>and</strong> this affects feed quality.<br />
Feedmills usually dry <strong>and</strong> store large volumes in silos.<br />
De-fatted rice bran (DRB) has a higher protein but lower lipid content than other<br />
brans <strong>and</strong> is there<strong>for</strong>e commonly used in animal feed.<br />
4.2.2 Wheat flour <strong>and</strong> wheat bran<br />
Viet Nam imports wheat flour <strong>and</strong> wheat by-products <strong>for</strong> human consumption as<br />
well as <strong>for</strong> the animal <strong>and</strong> aquafeed industries. Some 868 000 tonnes <strong>of</strong> wheat <strong>and</strong> byproducts<br />
were imported in 2004. Shrimp <strong>feeds</strong> require about 10–15 percent <strong>of</strong> wheat<br />
flour as a binding agent <strong>and</strong> an energy source. Wheat gluten is also used in shrimp feed<br />
while wheat bran is incorporated into catfish <strong>feeds</strong>.<br />
4.2.3 Maize <strong>and</strong> maize by-products<br />
Maize <strong>and</strong> its by-products, including maize bran, maize gluten <strong>and</strong> maize starch<br />
are important components in animal <strong>feeds</strong>, especially <strong>for</strong> the poultry feed industry.<br />
Domestic maize production does not meet dem<strong>and</strong> <strong>and</strong> the shortfall is imported. The<br />
inclusion rate <strong>of</strong> maize in aqua<strong>feeds</strong> varies depending on the kind <strong>of</strong> product. It can be<br />
as high as 35 percent <strong>for</strong> maize grain meal <strong>and</strong> 20 percent <strong>for</strong> maize bran in omnivorous<br />
fish <strong>feeds</strong> (Hertrampf <strong>and</strong> Pascual, 2000).
Analysis <strong>of</strong> <strong>feeds</strong> <strong>and</strong> <strong>fertilizers</strong> <strong>for</strong> <strong>sustainable</strong> aquaculture development in Viet Nam 349<br />
However, maize <strong>and</strong> maize by-products are seldom used in commercial <strong>and</strong> or<br />
farm-made aqua<strong>feeds</strong> in Viet Nam. The high astaxanthin <strong>and</strong> canthaxanthin content in<br />
maize meal <strong>and</strong> bran discolours the fish fillet in pangasiid <strong>and</strong> clariid catfish. Moreover,<br />
the higher price <strong>of</strong> maize meal <strong>and</strong> bran in comparison to broken rice <strong>and</strong> rice bran has<br />
restricted the use <strong>of</strong> maize products in aqua<strong>feeds</strong>.<br />
4.2.4 Cassava <strong>and</strong> cassava meal<br />
Cassava is not a staple food in Viet Nam. It is used mainly <strong>for</strong> animal feed <strong>and</strong> <strong>for</strong><br />
industrial purposes. In 2003 Viet Nam produced some 5.23 million tonnes. There is<br />
no <strong>of</strong>ficial data on cassava usage in animal <strong>feeds</strong>. Cassava root is a perishable food <strong>and</strong><br />
has high moisture content (70 percent) at harvest. Cassava meal is a processed product<br />
by sun drying, chopping <strong>and</strong> grinding the root. Protein content is low (0.9 percent<br />
<strong>for</strong> root <strong>and</strong> 2.8 percent <strong>for</strong> meal) <strong>and</strong> starch content is high. In the central highl<strong>and</strong>s,<br />
northeastern <strong>and</strong> southeastern Viet Nam farmers use fresh cassava root to feed common<br />
carp <strong>and</strong> grass carp in cages <strong>and</strong> in the Mekong Delta, farmers <strong>of</strong>ten use cassava root<br />
to feed freshwater prawns.<br />
Cassava meal is used in the manufacture <strong>of</strong> extruded floating pellets <strong>and</strong> is included<br />
at up to 15 percent. Approximately 30 000–45 000 tonnes <strong>of</strong> cassava meal is used by<br />
the aquafeed industry annually. Cassava is not a common ingredient <strong>for</strong> traditional<br />
farm-made <strong>feeds</strong>.<br />
4.2.5 Trash fish<br />
Trash fish is that part <strong>of</strong> the by-catch <strong>of</strong> marine or inl<strong>and</strong> capture fisheries that is<br />
not normally used <strong>for</strong> human consumption. Traditionally trash fish has been used<br />
as a feed <strong>for</strong> carnivorous as well as omnivorous fish. According to MOFI, trash fish<br />
production in 2002 was 200 000 tonnes, comprising 14 percent <strong>of</strong> total capture fisheries<br />
l<strong>and</strong>ings. However, Edwards, Tuan <strong>and</strong> Allan (2004) estimated trash fish production at<br />
approximately 0.93 million tonnes in 2001, suggesting that the MOFI underestimated<br />
the proportion <strong>of</strong> trash fish from the capture fisheries.<br />
Trash fish is currently an indispensable feed <strong>for</strong> carnivorous fish <strong>and</strong> as mentioned<br />
above is also used in farm-made <strong>feeds</strong> <strong>for</strong> omnivorous species. Previously, trash fish<br />
was very abundant during the flood season in the Mekong Delta <strong>and</strong> was used <strong>for</strong><br />
human consumption, manufacture <strong>of</strong> fish sauce <strong>and</strong> as a feed <strong>for</strong> snakehead. Snakehead<br />
culture in the Delta has developed to such an extent that farmers now have to use trash<br />
fish <strong>of</strong> marine origin. FCR <strong>of</strong> trash fish ranges from 4–5 <strong>for</strong> snakeheads <strong>and</strong> as high<br />
as 12–15:1 <strong>for</strong> grouper (Trai <strong>and</strong> Hambrey, 1998). Farm-made <strong>feeds</strong> contain between<br />
20–30 percent <strong>of</strong> trash fish <strong>and</strong> Edwards, Tuan <strong>and</strong> Allan (2004) estimated that if<br />
only 50 percent <strong>of</strong> Pangasius farmers incorporate trash fish into their <strong>feeds</strong> then some<br />
65 000–180 000 tonnes are used by these farmers alone.<br />
The quality <strong>of</strong> trash fish is a major concern. Quality declines rapidly as only ice or<br />
chilled water is used to preserve trash fish at sea. This is compounded by inadequate<br />
on-board storage facilities as the vessels stay at sea <strong>for</strong> one to four weeks. Edwards,<br />
Tuan <strong>and</strong> Allan, (2004) estimated that between 50 <strong>and</strong> 60 percent <strong>of</strong> the total <strong>of</strong>fshore<br />
trawler catch goes to waste because <strong>of</strong> poor storage.<br />
The supply <strong>of</strong> marine trash fish is highly seasonal, causing major fluctuations in<br />
supply <strong>and</strong> price. During the high fishing season the price ranges between VND 1 500–<br />
2 000/kg <strong>and</strong> during the rough seas season (October to December) the price increases<br />
to VND 3 000–5 000/kg. Trash fish availability is considered one <strong>of</strong> the most serious<br />
constraints <strong>for</strong> aquaculture development in Viet Nam.<br />
4.2.6 Live organisms<br />
Small-scale farmers usually use various live organisms to feed their fish. Similar to<br />
other countries, termites, small frogs <strong>and</strong> golden snails are the most common feed
350<br />
<strong>Study</strong> <strong>and</strong> <strong>analysis</strong> <strong>of</strong> <strong>feeds</strong> <strong>and</strong> <strong>fertilizers</strong> <strong>for</strong> <strong>sustainable</strong> aquaculture development<br />
organisms. The most important <strong>of</strong> these <strong>for</strong> aquaculture is the golden snail that was<br />
introduced into Viet Nam in the 1980s <strong>for</strong> human consumption <strong>and</strong> in the hope <strong>of</strong><br />
developing an export industry. The species has now become a catastrophic pest. With<br />
the shell removed the snail has a protein content <strong>of</strong> 9–11 percent, 0.3–0.7 percent lipids<br />
<strong>and</strong> 3.9–8.3 percent carbohydrate <strong>and</strong> is used particularly as an ingredient in freshwater<br />
prawn <strong>and</strong> fish <strong>feeds</strong>. The snails are minced <strong>and</strong> mixed with rice bran at a ratio <strong>of</strong> 10<br />
parts snail <strong>and</strong> 1 part rice bran. Prawn FCRs with this mixed feed ranges from 10–15:1<br />
(Hien, 2004). The price <strong>of</strong> snails (shell-removed) at VND 1 200–1 500/kg is <strong>of</strong>ten<br />
cheaper than trash fish at VND 2 500–3 000/kg.<br />
4.2.7 Fish processing waste<br />
Viet Nam has 600 fish processing factories that produce fish fillets, beheaded <strong>and</strong><br />
shelled shrimp <strong>and</strong> process molluscs be<strong>for</strong>e freezing <strong>and</strong> packing. A large quantity <strong>of</strong><br />
processing waste is consequently produced.<br />
It has been estimated that some 30 percent <strong>of</strong> processed shrimp ends up as waste<br />
<strong>and</strong> that some 60 000–70 000 tonnes <strong>of</strong> shrimp head waste is produced annually. The<br />
product has a protein content <strong>of</strong> 33.5 percent, 3.5 percent lipids, 26.4 percent minerals<br />
(NIAH, 1995). Shrimp head waste is a good source <strong>of</strong> protein <strong>for</strong> fish feed but its<br />
digestibility is low. It can be used as a direct feed <strong>for</strong> hybrid clariid <strong>and</strong> pangasiid catfish<br />
or can be sun dried to produce shrimp head meal, which is an essential component in<br />
shrimp feed since it is rich in chitin, astaxanthin <strong>and</strong> attractants. The inclusion rate in<br />
shrimp <strong>feeds</strong> varies between 2–5 percent.<br />
It has been estimated that pangasiid catfish processing waste amounts to around<br />
210 000 tonnes per annum. The waste is processed into various products <strong>for</strong> human<br />
consumption <strong>and</strong> as well as <strong>for</strong> animal <strong>and</strong> fish <strong>feeds</strong> (particularly <strong>for</strong> pangasiid catfish).<br />
There is an urgent need to evaluate the potential <strong>of</strong> using a proportion <strong>of</strong> the waste <strong>for</strong><br />
the production <strong>of</strong> fishmeal.<br />
Mollusc processing factories also produce <strong>of</strong>fal, which is sometimes used <strong>for</strong> the<br />
feeding <strong>of</strong> hybrid clariid <strong>and</strong> pangasiid catfish. Un<strong>for</strong>tunately none <strong>of</strong> the factories<br />
process mollusc waste into oil, squid liver meal <strong>and</strong> other mollusc meal <strong>and</strong> hence Viet<br />
Nam has to import these products <strong>for</strong> incorporation into shrimp <strong>feeds</strong>.<br />
4.2.8 Fishmeal<br />
Fishmeal is an essential component <strong>of</strong> most commercial aqua<strong>feeds</strong>. Viet Nam produces<br />
between 3 000 <strong>and</strong> 10 000 tonnes <strong>of</strong> fishmeal <strong>and</strong> 185 000 tonnes <strong>of</strong> “fish powder” per<br />
annum (Edwards, Tuan <strong>and</strong> Allan, 2004). Fish powder is made in the traditional manner<br />
(drying <strong>and</strong> grinding). Fishmeal is manufactured mainly <strong>for</strong>m trash fish, spoiled fish<br />
<strong>and</strong> processing waste <strong>and</strong> hence is <strong>of</strong> inferior quality to the imported equivalent <strong>and</strong><br />
sometimes contains high levels <strong>of</strong> histamine <strong>and</strong> cadaverine substances (Edwards, Tuan<br />
<strong>and</strong> Allan, 2004). The protein content (Table 22) <strong>of</strong> local fishmeal varies between 30 <strong>and</strong><br />
59.3 percent (NIAH, 1995). Local fishmeal is not used in shrimp <strong>feeds</strong>.<br />
There are no <strong>of</strong>ficial data <strong>of</strong> fishmeal consumption by aquaculture <strong>and</strong> this had to<br />
be estimated based on aquaculture production statistics <strong>and</strong> inclusion rates in various<br />
TABLE 22<br />
Proximal composition (percent dry matter basis) <strong>of</strong> fishmeal produced in Viet Nam<br />
Fishmeal type Crude protein Crude lipid Crude fibre Ash Ca P<br />
Fishmeal Ba Hon 57.6 1.0 0.7 15.8 5.2 2.7<br />
Fishmeal Da Nang 45.0 12.0 2.4 29.6 5.0 2.5<br />
Ha Long 45% 45.0 6.4 2.4 27.0 5.0 2.2<br />
Ha Long 50% 50.0 4.3 - 25.1 5.0 2.5<br />
Kien Giang 30.0 6.9 4.2 38.2 8.3 3.2<br />
Fishmeal 60% 59.3 8.2 - 24.2 5.1 2.8<br />
Source: NIAH (1995)
Analysis <strong>of</strong> <strong>feeds</strong> <strong>and</strong> <strong>fertilizers</strong> <strong>for</strong> <strong>sustainable</strong> aquaculture development in Viet Nam 351<br />
TABLE 23<br />
Estimation <strong>of</strong> fishmeal use in aqua<strong>feeds</strong> in Viet Nam<br />
Feed types Production<br />
% fishmeal<br />
Min Max<br />
Fishmeal used in aquafeed<br />
Min Max<br />
Shrimp feed 180 000 20 25 36 000 45 000<br />
Catfish feed 300 000 3 5 9 000 15 000<br />
Tilapia feed 50 000 3 5 1 500 2 500<br />
Total 46 500 62 500<br />
<strong>feeds</strong> (Table 23). The <strong>analysis</strong> suggest that some 45 000 to 60 000 tonnes <strong>of</strong> fishmeal<br />
were required <strong>for</strong> aqua<strong>feeds</strong> in 2003. This estimate is not much different to that <strong>of</strong><br />
Edwards, Tuan <strong>and</strong> Allan (2004) who estimated that Viet Nam used a minimum <strong>of</strong><br />
30 000 to a maximum <strong>of</strong> 105 000 tonnes <strong>of</strong> fishmeal <strong>for</strong> aqua<strong>feeds</strong> in 2001/2. Given<br />
the production <strong>of</strong> local fishmeal suggest that at least 90 percent <strong>of</strong> fishmeal used in<br />
aqua<strong>feeds</strong> is imported. Fishmeal imports to Viet Nam have increased from 14 000<br />
tonnes in 1999 to 60 000 tonnes in 2003. Edwards, Tuan <strong>and</strong> Allan (2004) predict that<br />
Viet Nam will require at least 150 000 to 200 000 tonnes <strong>of</strong> fishmeal per annum to<br />
sustain the current growth rate <strong>of</strong> aquaculture in the country.<br />
The price <strong>of</strong> fishmeal in Viet Nam depends entirely on protein content. The current<br />
average price is VND 150 per percent <strong>of</strong> protein, such that fishmeal with 60 percent<br />
protein costs VND 9 000/kg, though high quality fishmeal from Chile or Peru costs<br />
around VND 10 000/kg (prices in May 2005; US$1.00 = VND15 900).<br />
4.2.9 Fish oil<br />
Apart from the small-scale production <strong>of</strong> oil from pangasiid catfish waste, Viet Nam<br />
does not produce fish oil <strong>and</strong> this commodity is imported from South Korea, Chile<br />
<strong>and</strong> Peru. About 2 000–3 000 tonnes <strong>of</strong> fish oil is currently used in the feed industry<br />
(Edwards, Tuan <strong>and</strong> Allan (2004). Fish oil is mainly used in <strong>for</strong>mulated feed <strong>for</strong> tiger<br />
shrimp at an inclusion rate <strong>of</strong> 1–2 percent. In addition, shrimp farmers also use fish oil<br />
<strong>for</strong> top dressing <strong>of</strong> pelleted <strong>feeds</strong> because they perceive this to enhance shrimp feeding<br />
behaviour. Pangasiid oil is included into farm-made <strong>feeds</strong> at around 2–5 percent <strong>and</strong> is<br />
also used by some feedmills in Pangasius <strong>and</strong> tilapia <strong>feeds</strong>.<br />
4.2.10 Soybean meal<br />
Soybean meal is the primary protein component in most commercial animal feed<br />
<strong>for</strong>mulations <strong>and</strong> is also the main protein component in <strong>for</strong>mulated aqua<strong>feeds</strong>. In<br />
2003 Viet Nam produced 225 300 tonnes <strong>of</strong> soybeans <strong>of</strong> which about two-thirds was<br />
consumed directly as food products (e.g. t<strong>of</strong>u, soymilk) with the balance going to<br />
animal <strong>feeds</strong>. The quality <strong>of</strong> local soybean meal is good (Table 24).<br />
In 2003, Viet Nam’s soybean meal imports were estimated at 960 000 tonnes, an<br />
increase <strong>of</strong> 27 percent over the 795 000 tonnes imported in 2002. Argentina <strong>and</strong> India<br />
were the key soybean meal suppliers to Viet Nam. In 2004, soybean meal imports<br />
increased by 14 percent over 2003 to 1.1 million tonnes (Huong, 2004).<br />
Soybean meal inclusion rates in shrimp <strong>feeds</strong> range from 15–20 percent, <strong>for</strong><br />
omnivorous species between 20–30 percent <strong>and</strong> <strong>for</strong> pangasiid catfish can be as high as<br />
40–50 percent, without affecting fish growth (Hung, 2004). Because <strong>of</strong> the increasing<br />
scarcity <strong>of</strong> trash fish about 38 percent <strong>of</strong> farmers are now using soybean meal in their<br />
TABLE 24<br />
Nutrient content (percent as fed basis) <strong>of</strong> soybean meal produced in Viet Nam<br />
Nutrient extract Dry matter Crude protein Crude lipid Crude fibre NFE Ash<br />
Mechanically extracted 86.5 42.6 7.4 5.9 24.7 5.9<br />
Solvent extracted 89.0 44.7 1.5 5.1 32.2 5.5<br />
Source: NIAH (1995)
352<br />
<strong>Study</strong> <strong>and</strong> <strong>analysis</strong> <strong>of</strong> <strong>feeds</strong> <strong>and</strong> <strong>fertilizers</strong> <strong>for</strong> <strong>sustainable</strong> aquaculture development<br />
TABLE 25<br />
Estimation <strong>of</strong> soybean meal use <strong>for</strong> aquafeed<br />
Feed types Production<br />
% soybean meal<br />
Min Max<br />
Soybean meal used in aquafeed<br />
Min Max<br />
Shrimp feed 180 000 10 15 18 000 27 000<br />
Catfish feed 300 000 20 30 60 000 90 000<br />
Tilapia feed 50 000 20 30 10 000 15 000<br />
Total 88 000 132 000<br />
TABLE 26<br />
Nutrient content <strong>of</strong> some common terrestrial <strong>and</strong> aquatic plants used as <strong>feeds</strong> or <strong>fertilizers</strong> in<br />
aquaculture<br />
Green fodders wet weight basis<br />
Moisture Crude protein Crude lipid Carbohydrate Cellulose Mineral<br />
Duck weed 92.0 1.5 0.2 5.4 0.1 1.1<br />
Water hyacinth 92.9 2.1 6.7 2.6 0.6 0.9<br />
Water morning glory 91.6 1.9 0.8 - 1.4 1.1<br />
Cassava leaf 73.4 5.2 3.5 - 5.0 1.8<br />
Source: Bao Thang Company (2002) (pers. com.)<br />
farm-made <strong>for</strong>mulations. As <strong>for</strong> most other <strong>feeds</strong>tuffs there are no <strong>of</strong>ficial statistics <strong>of</strong><br />
soybean meal use in aquafeed <strong>and</strong> this was estimated (Table 25) using the same rationale<br />
as <strong>for</strong> the other commodities. The data suggest that some 80 000–130 000 tonnes<br />
soybean meal is used in commercial <strong>and</strong> farm-made aqua<strong>feeds</strong>.<br />
4.2.11 Other plant proteins<br />
Substantial quantities <strong>of</strong> groundnut meal <strong>and</strong> coconut meal are produced in Viet Nam,<br />
but <strong>for</strong> various reasons are not used to any significant degree in farm-made <strong>and</strong> or<br />
commercial aqua<strong>feeds</strong>. Other oilseed cake meals such as rapeseed meal, palm kernel<br />
meal, cottonseed meal are imported <strong>for</strong> animal feed but not used in aqua<strong>feeds</strong>.<br />
4.2.12 Green fodder<br />
Green fodders are used as supplemental <strong>feeds</strong> <strong>for</strong> herbivorous fish such as grass carp,<br />
gourami <strong>and</strong> silver barb. The common green fodders <strong>and</strong> their nutrient content are<br />
presented in Table 26.<br />
4.2.13 Premix <strong>and</strong> feed additives<br />
In <strong>for</strong>mulated <strong>feeds</strong> vitamin <strong>and</strong> mineral premixes <strong>and</strong> feed additives play an essential<br />
<strong>and</strong> important role in the enhancement <strong>of</strong> animal health <strong>and</strong> physiological function.<br />
There are several multinational <strong>and</strong> local companies in Viet Nam that produce<br />
premixes <strong>for</strong> animal <strong>feeds</strong>, <strong>of</strong> which DSM, Nutriway <strong>and</strong> Bayer are the leading<br />
producers. The inclusion rates are usually 0.025 percent <strong>for</strong> catfish <strong>and</strong> tilapia feed<br />
<strong>and</strong> 0.1–0.2 percent <strong>for</strong> shrimp <strong>feeds</strong>. Other feed additives such as ascorbic acid,<br />
lysine, methionine, anti-oxidants, anti mould agents, astaxanthin, feed attractants, feed<br />
stimulants, <strong>and</strong> probiotics are readily available in Viet Nam. All the ingredients <strong>for</strong><br />
premixes are imported.<br />
5. PROBLEMS AND CONSTRAINTS<br />
The National Development Plan expects the aquaculture sector to produce 2 million<br />
tonnes by 2010. With a targeted annual growth rate <strong>of</strong> over 20 percent, many challenges<br />
are likely to arise. There are two ways to achieve the production target. Firstly by<br />
increasing the surface area <strong>for</strong> aquaculture <strong>and</strong> secondly by intensifying the existing<br />
aquaculture practices. Exp<strong>and</strong>ing water surface area <strong>for</strong> aquaculture can be relatively<br />
easily implemented in the central highl<strong>and</strong>s, northeastern <strong>and</strong> northerwestern Viet<br />
Nam where population density is low, though these areas <strong>of</strong>ten lack adequate water
Analysis <strong>of</strong> <strong>feeds</strong> <strong>and</strong> <strong>fertilizers</strong> <strong>for</strong> <strong>sustainable</strong> aquaculture development in Viet Nam 353<br />
resources. Converting rice fields <strong>and</strong> other wetl<strong>and</strong> agriculture ecosystems into<br />
fishponds has been an important step in the aquaculture expansion plan since the<br />
1990’s in the Mekong Delta <strong>and</strong> other places. Nevertheless, a continued switch from<br />
agricultural to aquaculture will limit rice <strong>and</strong> other crop production to ensure food<br />
security. There<strong>for</strong>e, intensification <strong>of</strong> fish faming is obligatory <strong>for</strong> the sector to achieve<br />
its goals.<br />
However, intensification requires more <strong>feeds</strong> <strong>and</strong> nutrient inputs. This may pose<br />
problems <strong>and</strong> constraints in terms <strong>of</strong> ingredient availability <strong>and</strong> accessibility <strong>and</strong> may<br />
also have socio-economic implications in respect <strong>of</strong> feed resource allocation as well as<br />
economic consequences <strong>for</strong> small <strong>and</strong> medium scale farmers.<br />
5.1 Constraints in feed <strong>and</strong> feed ingredient availability <strong>and</strong> accessibility<br />
5.1.1 Herbivorous fish<br />
• Grass availability, particularly in the dry seasons: Herbivores, especially grass<br />
carp consume grass <strong>of</strong> up to 60–100 percent body weight per day. A 1000 m 2<br />
fishpond used <strong>for</strong> culture <strong>of</strong> grass carp needs 1 to 2 labourers to collect<br />
sufficient volumes <strong>of</strong> grass. In some places, farmers have to travel up to 30<br />
to 50 km to collect enough grass to meet the dem<strong>and</strong>. There are not enough<br />
pastures reserved <strong>for</strong> feed <strong>and</strong> feeding <strong>of</strong> fish.<br />
• Supplemental <strong>and</strong> alternative <strong>feeds</strong> <strong>for</strong> grass carp <strong>and</strong> other herbivores: In<br />
semi-intensive or intensive systems, grass is not adequate <strong>for</strong> grow-out <strong>and</strong> <strong>for</strong><br />
decreasing the duration <strong>of</strong> the production cycle. More research is required to<br />
deal with the intensification <strong>of</strong> herbivorous fish culture.<br />
5.1.2 Filter feeding fish<br />
• Manure availability <strong>and</strong> accessibility: Integrated farming (e.g. VAC systems) is<br />
the most appropriate technology <strong>for</strong> small-scale farmers <strong>and</strong> is actively promoted.<br />
However, manure is not available <strong>and</strong>/or accessible in many places <strong>and</strong> farmers<br />
need to be educated on the value <strong>of</strong> applying manure to fish ponds.<br />
• Alternative nutrient inputs: Inorganic (urea <strong>and</strong> DAP) <strong>fertilizers</strong> are readily<br />
available <strong>and</strong> accessible in Viet Nam. However, farmers are poorly educated in the<br />
use <strong>of</strong> inorganic <strong>fertilizers</strong>. There is a need <strong>for</strong> improved training <strong>and</strong> extension<br />
services.<br />
5.1.3 Omnivorous fish<br />
• Trash fish shortage: As indicated above the pangasiid catfish industry annually<br />
needs 60 000–180 000 tonnes trash fish <strong>and</strong> this will be doubled if catfish<br />
production reaches the target <strong>of</strong> 0.5 million tonnes in 2010. The supply <strong>of</strong> trash<br />
fish is the main limiting factor to achieving the above production target.<br />
• Fishmeal shortage: Viet Nam is not capable <strong>of</strong> producing adequate volumes <strong>of</strong><br />
fishmeal <strong>for</strong> the animal <strong>and</strong> aquaculture feed industries. The country there<strong>for</strong>e has<br />
to import most <strong>of</strong> its fishmeal requirements. Future world supply <strong>of</strong> fishmeal may<br />
constrain the development <strong>of</strong> the aquaculture sector in Viet Nam.<br />
• Alternative ingredients to fishmeal/trash fish: Oilseed cake meals are good protein<br />
sources to partially replace fishmeal or trash fish in catfish <strong>and</strong> tilapia <strong>feeds</strong>.<br />
Feedmillers need to examine the use <strong>of</strong> alternatives such as sunflower oilseed cake<br />
<strong>and</strong> others. Soybean meal is readily available on international markets. Other<br />
local oilseed cake meals are available but the quality <strong>of</strong> these commodities has to<br />
be improved such that they can be used more effectively in aqua<strong>feeds</strong>. Small- <strong>and</strong><br />
medium-scale farmers are constrained to a much greater extent in the search <strong>for</strong><br />
alternatives than the feedmills.
354<br />
<strong>Study</strong> <strong>and</strong> <strong>analysis</strong> <strong>of</strong> <strong>feeds</strong> <strong>and</strong> <strong>fertilizers</strong> <strong>for</strong> <strong>sustainable</strong> aquaculture development<br />
5.1.4 Carnivorous fish<br />
• Trash fish shortage: Trash fish is considered to be the most limiting factor in<br />
carnivorous fish culture. The development <strong>of</strong> marine fish <strong>and</strong> snakehead culture<br />
has placed enormous strain on supplies.<br />
• Trash fish seasonality: Trash fish supply is becoming more unstable over time. Its<br />
high seasonal availability is a severe constraint <strong>for</strong> carnivore aquaculture.<br />
5.1.5 Shrimp<br />
• Shrimp culture in semi-intensive <strong>and</strong> intensive systems require large volumes <strong>of</strong><br />
<strong>feeds</strong> <strong>and</strong> nutrients <strong>and</strong> will be severely constrained if availability <strong>and</strong> accessibility<br />
<strong>of</strong> feed ingredients become problematic. The two major constraints facing the<br />
sector are future fishmeal shortages <strong>and</strong> the high tax on premixes <strong>and</strong> imported<br />
animal feed ingredients.<br />
5.2 Social <strong>and</strong> economic constraints<br />
• Traditional feeding practices: The study by Hung, Truc <strong>and</strong> Huy (2007) clearly<br />
shows that farmers need to change their traditional feeding practices, which<br />
depend largely on trash fish, if they are to remain pr<strong>of</strong>itable.<br />
• Access to credit: A recent study by Thi (2005) showed that 83 percent <strong>of</strong> fish farmers<br />
in An Giang province face credit constraints. It may not be wrong to assume that<br />
most small- <strong>and</strong> medium-scale farmers in other areas face similar problems in<br />
finding adequate credit to buy feed ingredients <strong>and</strong> nutrients. Those that have<br />
access to banks may obtain a loan at a monthly interest rate <strong>of</strong> one percent. Those<br />
that do no have access to the <strong>for</strong>mal banking sector have to take “hot loans” with<br />
monthly interest rates <strong>of</strong> 5–6 percent.<br />
5.3 Farm-made <strong>feeds</strong><br />
Farm-made <strong>feeds</strong> are traditionally used on small <strong>and</strong> medium-scale farms. The<br />
intensification <strong>of</strong> aquaculture <strong>and</strong> reduced availability <strong>of</strong> trash fish <strong>and</strong> fishmeal will<br />
place severe constraints on the preparation <strong>of</strong> farm-made <strong>feeds</strong> by these farmers.<br />
• Farm-made <strong>feeds</strong> <strong>for</strong> pangasiid catfish, marine carnivorous fish, lobsters, freshwater<br />
prawns, snakeheads are traditionally composed <strong>of</strong> trash fish <strong>and</strong> rice bran <strong>and</strong> other<br />
ingredients. The availability <strong>of</strong> trash fish is highly seasonal, hence the preparation<br />
<strong>of</strong> farm-made <strong>feeds</strong> using alternatives such as fishmeal <strong>and</strong> soybean meal are<br />
promoted but the practice is constrained by farmer habits. Commercial feed mills<br />
know how to compensate <strong>for</strong> nutrient deficiencies such as lysine <strong>and</strong> methionine<br />
but farmers do not. Farmers need to be trained in the use <strong>of</strong> alternatives such as<br />
soybean meal <strong>and</strong> this could be achieved through closer liaison between farmer<br />
associations <strong>and</strong> ingredient distributing companies.<br />
• Although aquafeed ingredients are locally available, small-scale aquaculture<br />
farmers do not have adequate <strong>and</strong> ready access to good quality ingredients.<br />
• Due to lack <strong>of</strong> knowledge farmers do not pay enough attention to storing their<br />
feed ingredients in an appropriate manner to prevent oxidation. Hence they have<br />
little underst<strong>and</strong>ing <strong>of</strong> feed quality <strong>and</strong> its effect on production <strong>and</strong> fish health.<br />
• The high seasonal abundance <strong>of</strong> golden snails is a constraint <strong>for</strong> small- <strong>and</strong><br />
medium-scale freshwater prawn farmers.<br />
• Preparation <strong>of</strong> farm-made <strong>feeds</strong> <strong>for</strong> tiger shrimp is not a simple task. Several<br />
attempts have been made to train farmers in pellet production using local<br />
ingredients such as rice bran, wheat flour <strong>and</strong> trash fish. However, all attempts<br />
have failed because <strong>of</strong> high pond pollution levels caused by poor feed quality. It is<br />
not surprising that farmers have not adopted the procedures.
Analysis <strong>of</strong> <strong>feeds</strong> <strong>and</strong> <strong>fertilizers</strong> <strong>for</strong> <strong>sustainable</strong> aquaculture development in Viet Nam 355<br />
5.4 Commercially <strong>for</strong>mulated <strong>feeds</strong><br />
The rapid advances <strong>and</strong> growth in the aquafeed industry <strong>for</strong> catfish <strong>and</strong> shrimp <strong>feeds</strong><br />
poses several constraints.<br />
• Commercially <strong>for</strong>mulated <strong>feeds</strong> are expensive <strong>and</strong> feed cost amounts to 70–<br />
80 percent <strong>of</strong> total production costs in intensive systems. Shrimp farmers can<br />
accept the high feed prices since the benefits <strong>of</strong> higher survival compensates <strong>for</strong><br />
the higher price. However, catfish cage farmers are severely constrained by the<br />
price <strong>of</strong> commercial <strong>feeds</strong> <strong>and</strong> are essentially <strong>for</strong>ced to continue using trash fish<br />
based <strong>feeds</strong>. In the less traditional catfish farming areas in the Mekong Delta<br />
farmers are now growing catfish in ponds, in which FCRs using <strong>for</strong>mulated <strong>feeds</strong><br />
is better than in cages (see Hung, Truc <strong>and</strong> Huy, 2007). Similarly, only red tilapia<br />
cage farmers who are in close proximity to urban markets can justify the use <strong>of</strong><br />
<strong>for</strong>mulated pellets. Moreover, there is a traditional perception that farm-made<br />
<strong>feeds</strong>, using trash fish as the principal component, are superior to commercial<br />
<strong>feeds</strong> (see Hung, Truc <strong>and</strong> Huy, 2007).<br />
6. RECOMMENDATIONS<br />
• For the feeding <strong>for</strong> herbivorous fish the use <strong>of</strong> locally available agriculture byproducts<br />
is highly recommended to maximise the use <strong>of</strong> local sources <strong>of</strong> protein<br />
in resource-poor <strong>and</strong> in remote areas. Development agencies must appreciate this<br />
<strong>and</strong> develop appropriate trials <strong>and</strong> demonstrations to establish these techniques.<br />
• The use <strong>of</strong> VAC systems must be promoted <strong>for</strong> the farming <strong>of</strong> omnivores <strong>and</strong><br />
filter feeders to maximise the use <strong>of</strong> on-farm resources.<br />
• To maximize l<strong>and</strong> use <strong>and</strong> increase fish yield greater use should be made <strong>of</strong><br />
commercial <strong>feeds</strong> <strong>and</strong> the use <strong>of</strong> alternative ingredients <strong>for</strong> farm-made <strong>feeds</strong>. The<br />
replacement <strong>of</strong> trash fish by plant proteins, such as soybean meal, should be the<br />
first priority <strong>and</strong> farmers need to be trained in <strong>for</strong>mulating plant protein based<br />
<strong>feeds</strong>.<br />
• The feed industry in association with government agencies <strong>and</strong> universities must<br />
pay greater attention to the nutritional requirements <strong>of</strong> pangasiid catfish, such that<br />
diet <strong>for</strong>mulation is optimised <strong>and</strong> least cost <strong>feeds</strong> can be produced.<br />
• The high feed cost in Viet Nam makes the country’s shrimp <strong>and</strong> catfish producers<br />
uncompetitive. The main reason <strong>for</strong> the high feed prices is the high import duty<br />
<strong>and</strong> tax on feed additives <strong>and</strong> imported animal feed ingredients. This must to be<br />
addressed by the appropriate authorities.<br />
• The massive use <strong>of</strong> fresh trash fish is a major constraint to snakehead farming.<br />
Research on the use <strong>of</strong> pelleted <strong>feeds</strong> <strong>for</strong> carnivores such as snakehead <strong>and</strong><br />
grouper has to be given priority. In this regard, better use must be made <strong>of</strong> fish<br />
processing by-products. Further studies are also needed to promote the wise use<br />
<strong>of</strong> agricultural by-products <strong>for</strong> fish farming. In particular the research should<br />
focus on trash fish replacement.<br />
• Government should develop enabling policies <strong>and</strong> conditions that will lead to a<br />
reduction in feed prices. This will lead to greater international competitiveness <strong>for</strong><br />
the export <strong>of</strong> fish fillets <strong>and</strong> shrimp.<br />
• A database on the nutritional requirements <strong>of</strong> Pangasius catfish must be developed<br />
that may serve as a reference <strong>for</strong> the <strong>for</strong>mulation <strong>of</strong> commercial <strong>and</strong> farm-made<br />
<strong>feeds</strong>. Investigations on the use <strong>of</strong> low value cultured fish to feed carnivorous fish<br />
should also be carried out.<br />
• The knowledge base <strong>of</strong> extension workers on aquaculture nutrition <strong>and</strong> feeding<br />
must be enhanced such that farmers can intensify their activities.<br />
• The Ministry <strong>of</strong> Fisheries must develop improved fisheries management regulations<br />
that prevent over exploitation <strong>of</strong> trash fish.
356<br />
<strong>Study</strong> <strong>and</strong> <strong>analysis</strong> <strong>of</strong> <strong>feeds</strong> <strong>and</strong> <strong>fertilizers</strong> <strong>for</strong> <strong>sustainable</strong> aquaculture development<br />
REFERENCES<br />
Bao Thang Company. 2002. Nutrient rich plant <strong>feeds</strong> <strong>for</strong> livestocks in Viet Nam. Hanoi,<br />
Ethnical Culture Publisher. (Vietnamese)<br />
Bur<strong>for</strong>d, M., Preston, N., Minh, T.H., Hoa T.T.T. & Bunn, S. 2004. Dominant sources<br />
<strong>of</strong> dietary carbon <strong>and</strong> nitrogen <strong>for</strong> shrimp reared in extensive rice–shrimp ponds. In<br />
N. Preston <strong>and</strong> H. Clayton, eds. Rice–shrimp farming in the Mekong Delta: biophysical<br />
<strong>and</strong> socioeconomic issues. ACIAR Technical Reports No. 52e.<br />
Dat, D.H. 2002. H<strong>and</strong>book <strong>of</strong> <strong>fertilizers</strong> usage. Hanoi, Agricultural Publisher. (Vietnamese)<br />
Edwards, P., Tuan, L.A. & Allan, G.L. 2004. A survey <strong>of</strong> marine trash fish <strong>and</strong> fishmeal as<br />
aquaculture feed ingredients in Viet Nam. ACIAR Working Paper No. 57.<br />
FAO. 2006. FAO Fisheries Department, Fishery In<strong>for</strong>mation, Data <strong>and</strong> Statistics Unit.<br />
Fishstat Plus: Universal s<strong>of</strong>tware <strong>for</strong> fishery statistical time series. Aquaculture production:<br />
quantities 1950-2004, Aquaculture production: values 1984-2004; Capture production:<br />
1950-2004; Commodities production <strong>and</strong> trade: 1950-2004; Total production: 1970-2004,<br />
Vers. 2.30 (available at www.fao.org/fi/statist/FISOFT/FISHPLUS.asp)<br />
Hambrey, J.B., Tuan, L.A. & Thuong, T.K. 2001. Aquaculture <strong>and</strong> poverty alleviation 2:<br />
cage culture in coastal waters <strong>of</strong> Viet Nam. World Aquaculture, 32: 34–36, 38, 66–67.<br />
Hao, N.V., Hien, N.T., Khoi, P.D., Dan N.T. & Griffiths, D. 2000. Preliminary results<br />
on the development <strong>of</strong> rice-fish farming in Tien Giang province. The 3rd Technical<br />
symposium on Mekong fisheries, Phnom Penh, 8–9 December 2000.<br />
Hertrampf, J.W. & Pascual F.P. 2000. H<strong>and</strong>book on ingredients <strong>for</strong> aquaculture <strong>feeds</strong>.<br />
Dordrecht, Netherl<strong>and</strong>s, Kluwer Academic Publishers. 573 pp.<br />
Hien, N.H. 2004. Application <strong>of</strong> science <strong>and</strong> technology to set up a model <strong>of</strong> integrated<br />
freshwater prawn <strong>and</strong> rice farming system in Co Do district, Can Tho province. Project<br />
report, Nov. 2004. 24 pp. (Vietnamese)<br />
Huy, H.P.V. 2003. Potential <strong>and</strong> constraint in the development <strong>of</strong> wastewater-fed<br />
aquaculture systems in peri-urban area <strong>of</strong> Ho Chi Minh city. Bangkok, Asia Institute <strong>of</strong><br />
Technology. (MA Thesis)<br />
Hung, L.T. 2004. Feed <strong>and</strong> feeding constraints in inl<strong>and</strong> aquaculture in Viet Nam. In P.<br />
Edwards <strong>and</strong> G.L. Allan, eds. Feeds <strong>and</strong> feeding <strong>for</strong> inl<strong>and</strong> aquaculture in Mekong region<br />
countries. ACIAR Technical Reports No. 56. 136 pp.<br />
Hung, L.T. 2006. Development <strong>of</strong> aquafeed industry in Viet Nam <strong>and</strong> its challenges.<br />
In N.W. Keong <strong>and</strong> N.C. Kiat, eds. Asian aqua<strong>feeds</strong>: current developments in the<br />
aquaculture feed industry, pp. 138–154. Technical Proceedings <strong>of</strong> the Seminar on Asian<br />
Aqua<strong>feeds</strong>, Kuala Lumpur, Malaysia, 12–13 April 2005. Occasional Publication No. 13,<br />
Kuala Lumpur, Malaysian Fisheries Society.<br />
Hung, L.T., Truc, L.T.T. & Huy, H.P.V. 2007. A case study on the use <strong>of</strong> farm-made feed<br />
<strong>and</strong> commercially <strong>for</strong>mulated pellets <strong>for</strong> pangasiid catfish culture in the Mekong delta,<br />
Viet Nam (this volume).<br />
Huong, B.T. 2004. Viet Nam livestock <strong>and</strong> products livestock production update 2004.<br />
USDA <strong>for</strong>eign agricultural service, grain report. Global agricultural in<strong>for</strong>mation<br />
network. Grain Report Number: VM4007.<br />
Long, D.N. 2002. Sustainable development by improving the productivity <strong>of</strong> a rice/fish<br />
polyculture system in the Mekong delta in South Viet Nam. Notre-Dame De La Paix,<br />
Namur, France, Facultes Universitaires. (PhD Thesis)<br />
Long, D.N. 2003. Trial on giant freshwater prawn (Macrobrachium rosenbergii de Man,<br />
1897) intensive culture in earthen ponds at Moc Hoa district, Long An province.<br />
Unpublished scientific research done under coordination <strong>of</strong> the department <strong>of</strong> science<br />
<strong>and</strong> technology <strong>of</strong> Long An province. (Vietnamese)<br />
MOFI (Ministry <strong>of</strong> Fisheries). 2003. Annual report <strong>of</strong> shrimp farming in 2003. Hanoi,<br />
Ministry <strong>of</strong> Fisheries. (Vietnamese)
Analysis <strong>of</strong> <strong>feeds</strong> <strong>and</strong> <strong>fertilizers</strong> <strong>for</strong> <strong>sustainable</strong> aquaculture development in Viet Nam 357<br />
MOFI (Ministry <strong>of</strong> Fisheries). 2004. Planning <strong>and</strong> management issues <strong>for</strong> the development<br />
<strong>of</strong> Pangasius production to year 2010. Workshop on Viet Nam Tra-Basa trade name <strong>and</strong><br />
quality held in An Giang province, 14 – 16 December 2004, Hanoi, Ministry <strong>of</strong> Fisheries.<br />
(Vietnamese)<br />
MOFI (Ministry <strong>of</strong> Fisheries). 1999. Development <strong>of</strong> freshwater prawn in Mekong<br />
delta. National seminar held in An Giang province, Hanoi, Ministry <strong>of</strong> Fisheries.<br />
(Vietnamese)<br />
NIAH (National Institute <strong>of</strong> Animal Husb<strong>and</strong>ry). 1995. Composition <strong>and</strong> nutritive<br />
value <strong>of</strong> animal <strong>feeds</strong> in Viet Nam. Hanoi, Agricultural Publishing House. 253 pp.<br />
(Vietnamese)<br />
Nhan, D.V. 2005. A survey on shrimp culture status in Quang Ngai province, Central Viet<br />
Nam. Viet Nam, Faculty <strong>of</strong> Fisheries, Nong Lam University. (BSc thesis) (Vietnamese)<br />
Orachunwong, C., Thammasart, S. & Lohawatanakul, C. 2005. Aquafeed <strong>for</strong> caged<br />
marine fish in some Asian countries. Asian aqua feed 2005 seminar, 12–13 April 2005,<br />
Kuala Lumpur, Malaysia.<br />
Preston, N. & Clayton, H. 2004. Rice–shrimp farming in the Mekong Delta: biophysical<br />
<strong>and</strong> socioeconomic issues. ACIAR Technical Reports No. 52e.<br />
Phuong, N.T., Yang, Y., Ngoc, L.B. & Griffiths, D. 2005. A case study <strong>of</strong> environmental<br />
management <strong>of</strong> catfish farming in the Mekong River Delta <strong>of</strong> Viet Nam. World<br />
aquaculture 2005, Bali, Indonesia.<br />
Phuong, N.T., Minh, T.H., & Tuan, N.A. 2004. Overview <strong>of</strong> shrimp culture systems<br />
in Mekong Delta. Workshop on inshore fisheries development held in Nong Lam<br />
University <strong>of</strong> Ho Chi Minh City, 4 August 2004. (Vietnamese)<br />
Serene, P. & Merican, Z. 2004. Review <strong>of</strong> Aquafeed Industry in Viet Nam. Aquaculture<br />
Magazine, T 1-2/2004.<br />
Son, V.N., Yi, Y. & Phuong, N.T. 2005. River pen culture <strong>of</strong> giant freshwater prawn<br />
Macrobrachium rosenbergii (De Man) in Southern Viet Nam. Aquaculture Research, 36:<br />
284–291.<br />
Trai, N.V. & Hambrey, J.B. 1998. Grouper culture in Khanh Hoa province, Viet Nam.<br />
INFOFISH International 4/98: 30–35.<br />
Tuan, L. A. 2003. Status <strong>of</strong> Aquaculture <strong>and</strong> associated environmental management<br />
issues in Viet Nam. (available at http://www.nautilusconsultants.co.uk/pdfs/tropeca/<br />
VIETNAMVIET NAM%20%20STATUS%20OF%20AQUACULTURE.pdf).<br />
Trang, P.V., Thanh N.T. & Phuong, N.T. 2004. Culture technique <strong>for</strong> some common<br />
shrimp species in Viet Nam. Hanoi Agricultural Publisher. (Vietnamese)<br />
Thi, P.A. 2005. Investigation <strong>of</strong> culture techniques <strong>and</strong> economic efficiency <strong>of</strong> Pangasius<br />
culture in pond, cage <strong>and</strong> fence systems in Long Xuyen city, An Giang province. Faculty<br />
<strong>of</strong> Fisheries, Nong Lam University <strong>of</strong> Ho Chi Minh City, Viet Nam. (BSc thesis)<br />
(Vietnamese)<br />
Thanh, T.T. 2005. An investigation on the status <strong>of</strong> grouper culture in pond in Cam Ranh<br />
district, Khanh Hoa province. Faculty <strong>of</strong> Fisheries, Nong Lam University <strong>of</strong> Ho Chi<br />
Minh City, Viet Nam. (BSc thesis) (Vietnamese)<br />
Wilder M. & Phuong, N.T. 2002. The status <strong>of</strong> aquaculture in the Mekong Delta region <strong>of</strong><br />
Viet Nam: Sustainable production <strong>and</strong> combined farming systems. In the Proceedings <strong>of</strong><br />
International Commemorative Symposium: 70th Anniversary <strong>of</strong> the Japanese Society <strong>of</strong><br />
Fisheries Science. Fisheries Science Vol. 68, Supplement I, November 2002.
358<br />
<strong>Study</strong> <strong>and</strong> <strong>analysis</strong> <strong>of</strong> <strong>feeds</strong> <strong>and</strong> <strong>fertilizers</strong> <strong>for</strong> <strong>sustainable</strong> aquaculture development<br />
APPENDIX<br />
QUALITY NORMS, FEED STANDARDS, FEED SPECIFICATIONS AND FEEDING<br />
GUIDELINES OF AQUAFEEDS IN VIET NAM<br />
A.1. Quality st<strong>and</strong>ard (28TCN 102: 2004) <strong>for</strong> <strong>for</strong>mulated shrimp (Penaeus monodon) <strong>feeds</strong><br />
Feed type Shape <strong>of</strong> feed Size <strong>of</strong> shrimp (g)<br />
1 Crumbles 0.01–0.2<br />
2 Crumbles 0.2–1.0<br />
3 Crumbles or pellet 1.0–5.0<br />
4 Pellet 5.0–10.0<br />
5 Pellet 10.0–20.0<br />
6 Pellet >20.0<br />
A.2. Physical, chemical, micro-organism <strong>and</strong> veterinary hygiene safety st<strong>and</strong>ard <strong>for</strong> <strong>for</strong>mulated<br />
shrimp (Penaeus monodon) <strong>feeds</strong><br />
St<strong>and</strong>ard<br />
No. 1 No. 2<br />
Feed type<br />
No. 3 No. 4 No. 5 No. 6<br />
1 Diameter <strong>of</strong> pellet (mm) not bigger 0.6 0.8 1.2 1.8 2.2 2.5<br />
Length/diameter ratio 1.5–2.5<br />
2 Broken rate (% weight) not higher 2<br />
3 Durability not lower (hours) 1<br />
4 Crude energy (kcal/kg feed) not lower 3 400 3 400 3 200 3 200 3 000 3 000<br />
5 Moisture (% weight) not higher 11<br />
6 Crude protein (% weight) not higher 42 40 39 38 37 35<br />
7 Crude lipid (% weight) 6–8 6–8 5–7 5–7 4–6 4–6<br />
8 Crude fibre (% weight) not higher 3 3 4 4 5 5<br />
9 Ash (% weight) not higher 14 14 15 15 16 16<br />
10 S<strong>and</strong> (ash un-dissolvable in HCl<br />
10%) (% weight) not higher<br />
1 1 2 2 2 2<br />
11 Calcium (% weight ) not higher 2.3<br />
12 Calcium/phosphorus ratio 1.0–1.5<br />
13 NaCl (% weight) not higher 2.5<br />
14 Lysine (% weight) not lower 2.1 2.1 1.8 1.8 1.7 1.7<br />
15 Methionine (% weight) not lower 0.9 0.9 0.8 0.8 0.7 0.7<br />
16 Alive insects Not permitted<br />
17 Pathogenic bacterium (Salmonella) Not permitted<br />
18 Aspergillus Not permitted<br />
19 Aflatoxin
Analysis <strong>of</strong> <strong>feeds</strong> <strong>and</strong> <strong>fertilizers</strong> <strong>for</strong> <strong>sustainable</strong> aquaculture development in Viet Nam 359<br />
A.4. Physical, chemical, micro-organism <strong>and</strong> veterinary hygiene safety st<strong>and</strong>ard <strong>for</strong> <strong>for</strong>mulated<br />
catfish feed<br />
St<strong>and</strong>ard<br />
No. 1 No. 2<br />
Feed type<br />
No. 3 No. 4 No. 5 No. 6<br />
1 Diameter <strong>of</strong> pellet (mm) not bigger 1 1.5 2.5 5 10 12<br />
Length/diameter ratio 1–1.5<br />
2 Broken rate (% weight) not higher 2<br />
3 Durability not lower (hours) 30<br />
4 Crude energy (kcal/kg feed) not lower 3 300 2 800 2 400 2 100 1 800 1 500<br />
5 Moisture (% weight) not higher 11<br />
6 Crude protein (% weight) not higher 40 35 30 26 22 18<br />
7 Crude lipid (% weight) 8 6 5 5 4 3<br />
8 Crude fibre (% weight) not higher 6 6 7 7 8 8<br />
9 Ash (% weight) not higher 16 14 12 10 10 10<br />
10 S<strong>and</strong> (ash un-dissolvable in HCl<br />
10%) (% weight) not higher<br />
2<br />
11 Phosphorus (% weight ) is not higher 1<br />
12 NaCl (% weight) not higher 2.5<br />
13 Lysine (% weight) not lower 2.0 1.8 1.5 1.3 1.1 0.9<br />
14 Methionine (% weight) not lower 0.9 0.8 0.7 0.6 0.5 0.4<br />
15 Alive insects Not permitted<br />
16 Pathogenic bacterium (Salmonella) Not permitted<br />
17 Aspergillus Not permitted<br />
18 Aflatoxin 500
360<br />
<strong>Study</strong> <strong>and</strong> <strong>analysis</strong> <strong>of</strong> <strong>feeds</strong> <strong>and</strong> <strong>fertilizers</strong> <strong>for</strong> <strong>sustainable</strong> aquaculture development<br />
A.7. Feed specifications <strong>and</strong> feeding guidelines <strong>for</strong> catfish <strong>and</strong> tilapia<br />
Br<strong>and</strong> name/number<br />
Tilapia <strong>and</strong> catfish fingerling<br />
Feed size<br />
(mm)<br />
Crude protein min.<br />
(%)<br />
Fish weight<br />
(g)<br />
Feeding rate<br />
(% body weight)<br />
Feeding frequency<br />
(time/day)<br />
Aquaxcel-7404 5<br />
Aquaxcel-7424 1.2 40 2–5 10 >5<br />
Aquaxcel-7434 1.5 35 5–20 5–10 >5<br />
Aquaxcel-7444 1.5 35 >20 5–10 >5<br />
Catfish grow-out<br />
7644 1.8 28 20–300 >5 5<br />
7654 3.0 26 30–300 3–5 4<br />
7664 3.0 22 300–500 2–3 3–4<br />
7674 4.5 25 200–500 2–3 3–4<br />
7684 4.5–6.0 22 >500 2–3 3–4<br />
7694 NC 6.0 22 >500 2–3 3–4<br />
7694 ND 10.0 22 >500 1–2 3<br />
Tilapia grow-out<br />
A.6. Physical, chemical, micro-organism <strong>and</strong> veterinary hygiene safety st<strong>and</strong>ard <strong>of</strong> <strong>for</strong>mulated<br />
feed <strong>for</strong> tilapia (Oreochromis sp.)<br />
St<strong>and</strong>ard<br />
No. 1 No. 2<br />
Feed type<br />
No. 3 No. 4 No. 5 No. 6<br />
1 Diameter <strong>of</strong> pellet (mm) not bigger 1.0 1.5 2.0 4.0 4.0 6.0<br />
Length/diameter ratio 1.0–1.5<br />
2 Broken rate (% weight) not higher 2<br />
3 Durability not lower (hours) 30<br />
4 Crude energy (kcal/kg feed) not lower 3 200 3 000 2 860 2 800 2 750 2 700<br />
5 Moisture (% weight) not higher 11<br />
6 Crude protein (% weight) not higher 40 35 30 27 25 20<br />
7 Crude lipid (% weight) 6 6 5 5 4 4<br />
8 Crude fibre (% weight) not higher 5 5 6 6 7 7<br />
9 Ash (% weight) not higher 19<br />
10 S<strong>and</strong> (ash un-dissolvable in HCl<br />
10%) (% weight) not higher<br />
1 1 2 2 2 2<br />
11 Calcium (% weight ) not higher 2.5<br />
12 Calcium/phosphorus ratio 1.0–1.5<br />
13 NaCl (% weight) not higher 2.5<br />
14 Lysine (% weight) not lower 1.7 1.6 1.4 1.3 1.1 0.9<br />
15 Methionine (% weight) not lower 1.0 0.9 0.8 0.7 0.6 0.5<br />
16 Alive insects Not permitted<br />
17 Pathogenic bacterium (Salmonella) Not permitted<br />
18 Aspergillus Not permitted<br />
19 Aflatoxin 500 2–3 3–4<br />
4.5 25 >500 2–3 3–4
Analysis <strong>of</strong> <strong>feeds</strong> <strong>and</strong> <strong>fertilizers</strong> <strong>for</strong> <strong>sustainable</strong> aquaculture development in Viet Nam 361<br />
A.8. Feed specifications, proximate composition <strong>and</strong> feeding guidelines <strong>for</strong> shrimp<br />
Br<strong>and</strong> name<br />
Feed type<br />
(mm)<br />
Crude protein<br />
(minimum %)<br />
Crude lipid<br />
(minimum %)<br />
Mineral<br />
(maximum %)<br />
Crude fibre<br />
(maximum %)<br />
Calcium<br />
(minimum %)<br />
Phosphorus<br />
(minimum %)<br />
Shrimp size (g)<br />
Age (days)<br />
Feeding rate (%<br />
body weight)<br />
Feeding frequency<br />
(time/day)<br />
Quantity <strong>of</strong> feed<br />
<strong>for</strong> 100 000 shrimp<br />
(kg/day)<br />
TB1 Powder 42 6 16 3 3.5 1.5 20g 100–120 3–2 5–6 60–76<br />
Source: Tomboy Company (pers. com.)
Case study on the use <strong>of</strong><br />
farm-made <strong>feeds</strong> <strong>and</strong> commercially<br />
<strong>for</strong>mulated pellets <strong>for</strong> pangasiid<br />
catfish culture in the Mekong<br />
Delta, Viet Nam<br />
Le Thanh Hung, Luu Thi Thanh Truc <strong>and</strong> Huynh Pham Viet Huy<br />
Faculty <strong>of</strong> Fisheries<br />
Nong Lam University, Ho Chi Minh City<br />
Viet Nam<br />
Summary 364<br />
1. Introduction 365<br />
2. Methods 366<br />
3. Results <strong>and</strong> discussion 367<br />
4. Conclusions <strong>and</strong> recommendations 375<br />
References 376<br />
Hung, L.T., Truc, L.T.T. <strong>and</strong> Huy, H.P.V. 2007. Development <strong>of</strong> the aquafeed<br />
industry in India. In M.R. Hasan, T. Hecht, S.S. De Silva <strong>and</strong> A.G.J. Tacon (eds). <strong>Study</strong><br />
<strong>and</strong> <strong>analysis</strong> <strong>of</strong> <strong>feeds</strong> <strong>and</strong> <strong>fertilizers</strong> <strong>for</strong> <strong>sustainable</strong> aquaculture development. FAO<br />
Fisheries Technical Paper. No. 497. Rome, FAO. pp. 363–377.<br />
363
364<br />
<strong>Study</strong> <strong>and</strong> <strong>analysis</strong> <strong>of</strong> <strong>feeds</strong> <strong>and</strong> <strong>fertilizers</strong> <strong>for</strong> <strong>sustainable</strong> aquaculture development<br />
SUMMARY<br />
This survey was carried out during the period September to December 2005 <strong>and</strong> is based<br />
on data obtained from 107 fish farmers from three different locations in the Mekong<br />
Delta in Viet Nam. Feeding practices <strong>and</strong> culture facilities <strong>for</strong> pangasiid catfish varied<br />
widely, depending on location, culture tradition <strong>and</strong> feed types. In Viet Nam, cage culture<br />
<strong>of</strong> pangasiid catfish started in Chau Doc <strong>and</strong> then moved downstream to other locations<br />
along the river such as Long Xuyen <strong>and</strong> Can Tho/Vinh Long. It is expected that pond<br />
culture <strong>of</strong> pangasiids will soon be the predominant culture method <strong>for</strong> these species.<br />
Traditional farm-made <strong>feeds</strong> consist mainly <strong>of</strong> trash fish <strong>and</strong> rice bran. However, recent<br />
changes in the availability <strong>of</strong> trash fish have resulted in significant increases in the price<br />
<strong>of</strong> farm-made <strong>feeds</strong>, which is affecting aquaculture throughout the country. The study<br />
revealed that about 39 percent <strong>of</strong> farmers now use soybean meal <strong>for</strong> the manufacture <strong>of</strong><br />
farm-made <strong>feeds</strong> at inclusion levels ranging between 10 <strong>and</strong> 30 percent. The incorporation<br />
<strong>of</strong> other ingredients, such as fishmeal, is still a relatively rare occurrence <strong>and</strong> only 2 to<br />
20 percent <strong>of</strong> farmers use such alternatives, depending on locality.<br />
The production <strong>of</strong> pelleted <strong>feeds</strong> <strong>for</strong> catfish started in 1998. Since then it has<br />
exp<strong>and</strong>ed into all catfish growing areas in the Delta. Pelleted <strong>feeds</strong> appear to have several<br />
advantages, e.g. improved growth <strong>and</strong> food conversion. Despite the advantages farmers<br />
in the more traditional catfish growing areas still prefer farm-made <strong>feeds</strong>. It was also<br />
noted that even those farmers who regularly use pellets, revert to farm-made <strong>feeds</strong> during<br />
the final months <strong>of</strong> grow-out or when the price <strong>of</strong> fish decreases. The cost <strong>of</strong> production<br />
using pellets is higher than <strong>for</strong> farm-made <strong>feeds</strong>.<br />
Although the use <strong>of</strong> commercial pelleted feed is exp<strong>and</strong>ing quickly, farm-made <strong>feeds</strong><br />
still play an important role in pangasiid aquaculture in Viet Nam. A cost/benefit <strong>analysis</strong><br />
revealed that the production cost in ponds, using farm-made <strong>feeds</strong>, is generally lower<br />
than in cages. Hence farmers adjust their feeding practices depending on the price <strong>of</strong> the<br />
fish at harvest.<br />
To reduce the cost <strong>of</strong> farm-made <strong>feeds</strong>, farmers need to diversify <strong>and</strong> incorporate<br />
alternative ingredients into their feed <strong>for</strong>mulations. To ensure the sustainability <strong>and</strong><br />
future growth <strong>of</strong> pangasiid catfish aquaculture in the Mekong Delta there is a need <strong>for</strong><br />
researchers <strong>and</strong> extension workers to focus on developing alternative <strong>and</strong> cost effective<br />
feed <strong>for</strong>mulations <strong>and</strong> appropriate feeding strategies.
Case study on the use <strong>of</strong> farm-made <strong>feeds</strong> <strong>and</strong> commercially <strong>for</strong>mulated pellets <strong>for</strong> pangasiid catfish culture 365<br />
1. INTRODUCTION<br />
In 2004, catfish production in Viet Nam amounted to some 260 000–300 000 tonnes,<br />
which comprised about 56 percent <strong>of</strong> freshwater aquaculture production in the<br />
Mekong River Delta, <strong>and</strong> constituted about 10 percent <strong>of</strong> national aquaculture export<br />
earnings (Phuong et al., 2005). It is widely recognized as one <strong>of</strong> the most important<br />
aquaculture sectors in Viet Nam. The Mekong Delta is the most important region <strong>for</strong><br />
pangasiid aquaculture in Viet Nam. The most commonly farmed species are Pangasius<br />
hypophthalmus, P. bocourti <strong>and</strong> P. conchophilus. Cages, ponds <strong>and</strong> net pens are the most<br />
common farming practices in the region. Table 1 summarizes the trends in pangasiid<br />
aquaculture in the Mekong Delta.<br />
Culture practices as well as the use <strong>of</strong> different types <strong>of</strong> feed vary widely, depending<br />
on location, available facilities <strong>and</strong> infrastructure. Farm-made <strong>feeds</strong>, in which trash<br />
fish <strong>for</strong>ms the major protein component, are the most widely used in the Delta region.<br />
However, the use <strong>of</strong> trash fish in farm-made <strong>feeds</strong> currently poses several constraints<br />
on pangasiid aquaculture practices <strong>and</strong> development in the Delta. The most serious<br />
<strong>of</strong> these is the quality <strong>and</strong> availability <strong>of</strong> fish, which <strong>of</strong>ten arrives on site in a highly<br />
decomposed <strong>for</strong>m. This is principally because fish is kept <strong>for</strong> 7–10 days at sea in<br />
unsuitable conditions <strong>and</strong> is not chilled during transportation to farming areas. This<br />
has led to the promotion <strong>of</strong> the use <strong>of</strong> <strong>for</strong>mulated pellets under certain conditions.<br />
Pelleted <strong>feeds</strong> have several advantages over farm-made <strong>feeds</strong>. These include availability,<br />
lower feed conversion ratios <strong>and</strong> reduced environmental impact.<br />
Previously, trash fish from the wetl<strong>and</strong> areas <strong>of</strong> the Delta, especially during the<br />
flood season, was readily available <strong>and</strong> marine trash fish was only used as an alternative<br />
during the dry season. Over-fishing <strong>of</strong> the wetl<strong>and</strong>s <strong>and</strong> the dependence on marine<br />
trash fish, even during the flood season, has increased the price <strong>of</strong> the commodity to a<br />
point at which the potential economic benefits may be negligible. It is mainly <strong>for</strong> this<br />
reason that farmers now seek alternative ingredients, such as soybean meal <strong>and</strong> other<br />
plant protein sources that are available in the Delta. Collectively, these issues have<br />
constrained the development <strong>of</strong> the catfish farming sector in the region.<br />
Recent research has shown that pangasiid catfish can be reared on soybean meal<br />
based diets without any negative effects (Hung, 2003). Nevertheless, the use <strong>of</strong> trash<br />
fish is still a common practice in the catfish culture industry in the Delta. The present<br />
study was designed to obtain a better underst<strong>and</strong>ing <strong>of</strong> current feed use patterns <strong>and</strong><br />
to assess the relative economic merits <strong>of</strong> farm-made <strong>and</strong> <strong>for</strong>mulated <strong>feeds</strong> <strong>and</strong> to advise<br />
farmers accordingly. The objectives <strong>of</strong> the study were:<br />
• to evaluate the use <strong>of</strong> farm-made feed versus <strong>for</strong>mulated pellets in different<br />
locations where catfish culture is a common practice;<br />
• to conduct a cost/benefit <strong>analysis</strong> <strong>of</strong> the two feed types to compare the production<br />
costs; <strong>and</strong><br />
• to identify the potential <strong>and</strong> future development <strong>of</strong> farm-made <strong>feeds</strong> <strong>for</strong> pangasiid<br />
catfish production in Viet Nam.<br />
TABLE 1<br />
Catfish culture area <strong>and</strong> production trends in the Mekong River Delta during 1997-2004<br />
Category 1997 1999 2001 2003 2004<br />
(estimated)<br />
Growth rate<br />
(%/year)<br />
Culture area (ha) 1 290 2 253 2 305 5 2 717 3 200 24.6<br />
Ponds (area) 1 290 2 253 2 288 2 652 2 991 21.9<br />
Cages (units) 1 300 1 621 2 539 2 271 1 872* 7.3<br />
Production (tonnes) 40 250 86 775 114 289 162 778 255 044 88.9<br />
Pond 22 550 50 330 66 660 109 105 178 624 115.3<br />
Cage 700 19 005 37 418 48 068 45 748 -<br />
*The lower number <strong>of</strong> cages in 2004 is a direct consequence <strong>of</strong> the higher unit production cost (see later).<br />
Source: MOFI (2004)
366<br />
<strong>Study</strong> <strong>and</strong> <strong>analysis</strong> <strong>of</strong> <strong>feeds</strong> <strong>and</strong> <strong>fertilizers</strong> <strong>for</strong> <strong>sustainable</strong> aquaculture development<br />
2. METHODS<br />
A structured questionnaire was developed <strong>and</strong> applied on 107 r<strong>and</strong>omly selected<br />
farmers, such that the various catfish farming practices in the Mekong Delta were<br />
represented (Table 2). The survey was conducted in three locations during the period<br />
July to November 2005. The three survey areas were Chau Doc, Long Xuyen, <strong>and</strong><br />
Can Tho/Vinh Long. Approximately 80–90 percent <strong>of</strong> catfish production in the Delta<br />
originates from these areas. Each location has its own farming traditions.<br />
Historically, Chau Doc is the cradle <strong>of</strong> catfish cage culture in the Mekong Delta.<br />
Presently, cage culture is still the dominant <strong>for</strong>m <strong>of</strong> pangasiid culture. For this reason<br />
30 representative cage culture operators were selected from this region. The city <strong>of</strong><br />
Long Xuyen, in An Giang province, is 30 km downstream from the town <strong>of</strong> Chau<br />
Doc. Just prior to the survey period the price <strong>of</strong> catfish dropped <strong>and</strong> many <strong>of</strong> the cage<br />
farmers in the region had switched to pond culture <strong>of</strong> other species. A total <strong>of</strong> 15 cage<br />
farmers were interviewed in this area. Pen culture is also practiced in this area <strong>and</strong><br />
because <strong>of</strong> the similarities between pen <strong>and</strong> pond culture, the results <strong>for</strong> 14 pond <strong>and</strong><br />
pen farmers were pooled.<br />
Because <strong>of</strong> similar farming practices, traditions <strong>and</strong> physical conditions Can Tho <strong>and</strong><br />
Vinh Long were grouped as the third study location. The locations are about 30–35 km<br />
downstream from Long Xuyen city. These two localities are the main representative<br />
areas <strong>for</strong> pond farming practices. Of the 48 interviewees in the area, 46 were pond<br />
farmers <strong>and</strong> two were cage farmers.<br />
Based on the type <strong>of</strong> farming <strong>and</strong> feed use practices in each <strong>of</strong> the three areas a<br />
r<strong>and</strong>om selection <strong>of</strong> farmers was made so that the current status <strong>of</strong> the two feeding<br />
FIGURE 1<br />
Map <strong>of</strong> the Mekong Delta, showing the three study locations in Viet Nam<br />
TABLE 2<br />
Sample allocation in the three main catfish culture<br />
areas<br />
Location<br />
Culture facilities<br />
Cage Pond<br />
Total<br />
Chau Doc 30 30<br />
Long Xuyen 15 14 29<br />
Can Tho <strong>and</strong> Vinh Long 2 46 48<br />
Total 47 60 107<br />
practices in different culture facilities in respective<br />
study areas was well represented in the data.<br />
Of 107 farmers selected <strong>for</strong> the survey, 48<br />
households were further interviewed using an<br />
economic evaluation questionnaire to carry out<br />
cost/benefit analyses. The sample size <strong>for</strong> this<br />
exercise was smaller than the overall sample because<br />
only a small proportion <strong>of</strong> surveyed farmers were
Case study on the use <strong>of</strong> farm-made <strong>feeds</strong> <strong>and</strong> commercially <strong>for</strong>mulated pellets <strong>for</strong> pangasiid catfish culture 367<br />
able to provide detailed economic in<strong>for</strong>mation<br />
(Table 3).<br />
All data were coded <strong>and</strong> entered into Micros<strong>of</strong>t<br />
Excel spreadsheet <strong>for</strong> <strong>analysis</strong>.<br />
3. RESULTS AND DISCUSSION<br />
3.1 Experience <strong>of</strong> catfish farmers<br />
Figure 2 shows the average years <strong>of</strong><br />
experience <strong>of</strong> farmers in the three areas. In<br />
Chau Doc, where cage culture <strong>of</strong> catfish<br />
originated, farmers on average have over 14<br />
years <strong>of</strong> experience, which is significantly<br />
more than in the other two areas, viz.<br />
5.5 <strong>for</strong> Long Xuyen <strong>and</strong> two in Can Tho<br />
<strong>and</strong> Vinh Long. This has had a significant<br />
influence on culture practices. For example,<br />
Chau Doc farmers seem to be more<br />
conservative concerning the application <strong>of</strong><br />
new techniques. In fact, many <strong>of</strong> the farmers<br />
started catfish culture be<strong>for</strong>e 1979 simply<br />
by following their parents’ occupation<br />
(Action Aid, 2002).<br />
The second most experienced farmers<br />
are in Long Xuyen where catfish farming<br />
developed soon after the evolution <strong>of</strong> catfish<br />
cage culture in Chau Doc. This location is<br />
also the second most important area <strong>for</strong><br />
catfish culture along the Mekong River. On average, farmers in Long Xuyen have<br />
approproximately 5.5 years <strong>of</strong> experience in cage culture <strong>and</strong> approproximately 3.6<br />
years experience in pond culture. Although many <strong>of</strong> the farming traditions have been<br />
passed on from Chau Doc, catfish culture in Long Xuyen has its own characteristics<br />
due to the difference in topography. In this region farmers make use <strong>of</strong> the tidal range<br />
<strong>for</strong> water exchange in ponds <strong>and</strong> as a result can practice both cage <strong>and</strong> pond culture.<br />
Farmers in the Can Tho <strong>and</strong> Vinh Long area are the most recent practitioners <strong>of</strong><br />
catfish farming in the Delta, <strong>and</strong> pond<br />
culture in this area is the dominant farming<br />
system. In this region, farmers have an<br />
average experience <strong>of</strong> about 2.4 years. Cage<br />
culture is not commonly practiced in Can<br />
Tho <strong>and</strong> Vinh Long due to the nature <strong>of</strong> the<br />
river system. The water borne river traffic<br />
in Can Tho <strong>and</strong> Vinh Long is intensive <strong>and</strong><br />
this is a major constraint to cage culture.<br />
3.2 Feeds <strong>and</strong> feeding practices<br />
Feed use<br />
The survey data suggests that type <strong>of</strong> feed<br />
depends on the farming system. A high<br />
percent <strong>of</strong> pond farmers in Can Tho <strong>and</strong><br />
Vinh Long use commercially <strong>for</strong>mulated<br />
pellets <strong>for</strong> the entire production cycle<br />
(Figure 3). The findings <strong>of</strong> the present<br />
study clearly show the evolution that has<br />
TABLE 3<br />
Sample size <strong>of</strong> farmers participating in the cost/<br />
benefit <strong>analysis</strong><br />
Location Culture facility Total<br />
Cage Pond<br />
Can Tho <strong>and</strong> Vinh Long 0 27 27<br />
Chau Doc 5 0 5<br />
Long Xuyen 9 7 9<br />
Total 14 34 48<br />
FIGURE 2<br />
Average years <strong>of</strong> experience <strong>of</strong> farmers in the three<br />
sampling locations<br />
Cage Pond Cage Cage Pond<br />
Can Tho <strong>and</strong> Vinh Long<br />
Chau Doc<br />
Location <strong>and</strong> facility<br />
Long Xuyen<br />
FIGURE 3<br />
Feed use patterns under different culture conditions in<br />
the three locations
368<br />
<strong>Study</strong> <strong>and</strong> <strong>analysis</strong> <strong>of</strong> <strong>feeds</strong> <strong>and</strong> <strong>fertilizers</strong> <strong>for</strong> <strong>sustainable</strong> aquaculture development<br />
taken place since the study undertaken by Phu <strong>and</strong> Hien (2003). Approproximately<br />
76 percent <strong>of</strong> interviewed pond farmers in Can Tho <strong>and</strong> Vinh Long now use pellets<br />
<strong>for</strong> the entire grow-out cycle. This is in contrast to the 46 percent <strong>of</strong> farmers in Can<br />
Tho province <strong>and</strong> the 5 to 10 percent <strong>of</strong> farmers in other provinces that used pellets,<br />
as reported by Phu <strong>and</strong> Hien (2003). Around 17 percent <strong>of</strong> pond farmers use farmmade<br />
feed in combination with pellets, whilst only 6.5 percent <strong>of</strong> the farmers use<br />
exclusively farm-made <strong>feeds</strong>. In total only about 24 percent <strong>of</strong> farmers in this region<br />
now use farm-made <strong>feeds</strong>. Combination feeding is however used by 100 percent <strong>of</strong><br />
cage farmers.<br />
In the Long Xuyen area, approximately 50 percent <strong>of</strong> pond farmers use farm-made<br />
<strong>feeds</strong>, although most use these <strong>feeds</strong> in combination with pellets. The most widely<br />
used practice by cage farmers (87 percent) is to use pellets during the initial stages <strong>of</strong><br />
rearing <strong>and</strong> farm-made <strong>feeds</strong> <strong>for</strong> the finishing stage (see later). Only a small proportion<br />
(7 percent) <strong>of</strong> farmers who practice cage culture use farm-made <strong>feeds</strong> exclusively <strong>for</strong><br />
the duration <strong>of</strong> the production cycle. In general, combination feeding is the most<br />
prevalent feeding practice in the region.<br />
In contrast to the feeding practices in Long Xuyen <strong>and</strong> Can Tho/Vinh Long, more<br />
than 93 percent <strong>of</strong> cage farmers in Chau Doc still use farm-made <strong>feeds</strong> as the principal<br />
feed <strong>and</strong> only use it in combination with pellets during the first month after stocking.<br />
The remainder use only farm-made <strong>feeds</strong> <strong>for</strong> the entire culture cycle. There<strong>for</strong>e, nearly<br />
100 percent <strong>of</strong> cage farmers in this area use farm-made <strong>feeds</strong> <strong>for</strong> the greater part <strong>of</strong> or<br />
the entire production cycle. This is very similar to the results reported by Phu <strong>and</strong> Hien<br />
(2003) <strong>and</strong> illustrates the tradition bound nature <strong>of</strong> the farmers in this area. The use <strong>of</strong><br />
farm-made <strong>feeds</strong> here is principally related to the low price <strong>of</strong> the feed in comparison<br />
to pellets in the past, which is <strong>of</strong> course a decisive factor <strong>for</strong> any aquaculture business.<br />
Only a few farmers noted that the availability <strong>of</strong> ingredients influenced their decision<br />
to choose farm-made <strong>feeds</strong> over <strong>for</strong>mulated pellets.<br />
From the above it is evident that farm-made <strong>feeds</strong> are more generally used in Long<br />
Xuyen <strong>and</strong> Chau Doc, while commercially <strong>for</strong>mulated <strong>feeds</strong> are more commonly used<br />
in pond culture systems in Long Xuyen <strong>and</strong> Can Tho/Vinh Long. It was interesting<br />
to note that even those farmers who use mainly farm-made feed, usually also use<br />
pellets during the first month <strong>of</strong> culture when the fish require high quality feed.<br />
Hence, it is difficult, if not impossible, to determine the proportion <strong>of</strong> fish produced<br />
using farm-made <strong>feeds</strong> <strong>and</strong> <strong>for</strong>mulated <strong>feeds</strong>. However, based on the 300 000–350 000<br />
tonnes <strong>of</strong> <strong>for</strong>mulated feed produced in 2004 <strong>and</strong> a feed conversion ratio <strong>of</strong> 1.5–1.8 it is<br />
estimated that <strong>for</strong>mulated <strong>feeds</strong> account <strong>for</strong> approximately 200 000 tonnes <strong>of</strong> fish. Total<br />
production <strong>of</strong> catfish in 2004 was 300 000 tonnes, suggesting that the remainder <strong>of</strong> the<br />
catfish (100 000 tonnes) were produced using farm-made <strong>feeds</strong>. The best estimate <strong>for</strong><br />
the proportional contribution to total production attributed to farm-made <strong>feeds</strong> <strong>and</strong><br />
pellets is around 1:1.9.<br />
Feeding practices<br />
The production cycle <strong>for</strong> pangasiid catfish is divided into three phases, viz., (1) the<br />
first month after stocking <strong>of</strong> the fingerlings, (2) the main growth period <strong>of</strong> around 4<br />
to 5 months <strong>and</strong> (3) the final month be<strong>for</strong>e the fish are harvested. Feeding practices<br />
are closely related to these phases <strong>and</strong> as mentioned above also vary according to the<br />
location. The variation in feeding practices by farmers who mainly use farm-made<br />
<strong>feeds</strong> is illustrated in Figures 4, 5 <strong>and</strong> 6.<br />
In Long Xuyen, pellets are commonly used in the first month in both cages <strong>and</strong><br />
ponds. Some 93 <strong>and</strong> 86 percent <strong>of</strong> cage <strong>and</strong> pond farmers used pellets during the first<br />
month, respectively (Figure 4). The reasons <strong>for</strong> using pellets in the first month were<br />
diverse. However, the main reason was that farmers were <strong>of</strong> the opinion that small fish<br />
are better adapted to feed on pellets <strong>and</strong> that pellets also provide better nutrition.
Case study on the use <strong>of</strong> farm-made <strong>feeds</strong> <strong>and</strong> commercially <strong>for</strong>mulated pellets <strong>for</strong> pangasiid catfish culture 369<br />
Farmers were also <strong>of</strong> the opinion<br />
that the use <strong>of</strong> pellets reduced<br />
mortalities during the early rearing<br />
phase. During the middle months<br />
farmers use farm-made <strong>feeds</strong>,<br />
while during the final month some<br />
farmers keep on using farm-made<br />
feed. Others use a combination<br />
<strong>of</strong> farm-made <strong>feeds</strong> <strong>and</strong> pellets.<br />
Approproximately 28 percent<br />
<strong>of</strong> cage culture farmers in Long<br />
Xuyen combine pellets with<br />
farm-made <strong>feeds</strong> during the final<br />
month, while only 14 percent <strong>of</strong><br />
pond farmers follow this practice.<br />
Farmers were <strong>of</strong> the opinion that<br />
feeding pellets in the final month<br />
improved the quality <strong>of</strong> the fish<br />
<strong>and</strong> resulted in a whiter meat at<br />
harvest. Farmers were also <strong>of</strong> the<br />
opinion that feeding fish with<br />
pellets accelerates the growth rate,<br />
such that the fish can be harvested<br />
earlier. The findings suggest that<br />
farmers recognize the benefits <strong>of</strong><br />
pelleted <strong>feeds</strong> <strong>and</strong> would also use<br />
them <strong>for</strong> the entire cycle provided<br />
that the feed is af<strong>for</strong>dable.<br />
Feeding practices by cage<br />
farmers in Chau Doc is similar<br />
to those in Long Xuyen. About<br />
83 percent <strong>of</strong> farmers use pellets<br />
during the first month <strong>and</strong><br />
90 percent use farm-made <strong>feeds</strong><br />
during the middle months (Figure<br />
5). However, in contrast to farmers<br />
in Long Xuyen, approximately<br />
10 percent <strong>of</strong> farmers in Chau Doc<br />
use a combination <strong>of</strong> the <strong>feeds</strong><br />
from the beginning to the end <strong>of</strong><br />
the production cycle. Moreover,<br />
a higher percent <strong>of</strong> farmers<br />
(37 percent) in Chau Doc apply<br />
combination feeding in the final<br />
month than in Long Xuyen.<br />
As previously mentioned, Can<br />
Tho <strong>and</strong> Vinh Long are relatively<br />
new catfish farming areas. The<br />
only real difference in these areas,<br />
in comparison with Chau Doc<br />
<strong>and</strong> Long Xuyen, is that a higher<br />
proportion <strong>of</strong> farmers (73 percent)<br />
use pellets during the first month.<br />
% farmers<br />
FIGURE 4<br />
Feed use practices in cages <strong>and</strong> in ponds during the three<br />
rearing phases in Long Xuyen<br />
100<br />
80<br />
60<br />
40<br />
20<br />
0<br />
First<br />
month<br />
Middle<br />
month<br />
Combination feeding Farm-made Pellet<br />
Last<br />
month<br />
First<br />
month<br />
Long Xuyen<br />
Location <strong>and</strong> farm<br />
Middle<br />
month<br />
Last<br />
month<br />
FIGURE 5<br />
Feed use practices in cages during the three rearing phases in<br />
Chau Doc<br />
FIGURE 6<br />
Feed use in ponds during the three rearing phases in Can Tho<br />
<strong>and</strong> Vinh Long
370<br />
<strong>Study</strong> <strong>and</strong> <strong>analysis</strong> <strong>of</strong> <strong>feeds</strong> <strong>and</strong> <strong>fertilizers</strong> <strong>for</strong> <strong>sustainable</strong> aquaculture development<br />
FIGURE 7<br />
Farmer perception on the efficacy <strong>of</strong> farm-made <strong>feeds</strong><br />
<strong>and</strong> pellets<br />
FIGURE 8<br />
Feed ingredients used by fish farmer households <strong>for</strong><br />
preparation <strong>of</strong> farm-made <strong>feeds</strong><br />
3.3 Farmer perceptions on the<br />
efficacy <strong>of</strong> different feed types<br />
Commercial pellets are only used<br />
by farmers if there are known<br />
or perceived advantages over<br />
other feed types. Because <strong>of</strong> the<br />
high proportional use <strong>of</strong> pellets<br />
in Can Tho <strong>and</strong> Vinh Long it is<br />
clear that most farmers in these<br />
areas consider pellets to be more<br />
effective than farm-made <strong>feeds</strong>. On<br />
the contrary, 100 percent <strong>of</strong> cage<br />
farmers in Chau Doc <strong>and</strong> nearly<br />
80 percent in Long Xuyen use<br />
farm-made <strong>feeds</strong> either exclusively<br />
or in combination with pellets.<br />
This suggests that they perceive<br />
farm-made <strong>feeds</strong> to be superior to<br />
pellets. However, this perception<br />
may be clouded as farmers in these<br />
areas are more conservative <strong>and</strong><br />
averse to changes.<br />
3.4 Preparation <strong>of</strong> farm-made<br />
<strong>feeds</strong><br />
Traditionally farm-made <strong>feeds</strong> were<br />
composed <strong>of</strong> rice bran <strong>and</strong> trash fish<br />
at a ratio <strong>of</strong> 1:1 or 2:1, depending on<br />
the production phase. Besides rice<br />
bran <strong>and</strong> trash fish farmers now<br />
also use other ingredients such as<br />
soybean meal, fishmeal, corn meal,<br />
dried fish, meat-bone meal <strong>and</strong><br />
poultry by-product meal. Figure<br />
8 shows the proportion <strong>of</strong> fish<br />
farmer households using different<br />
ingredients <strong>for</strong> the manufacture <strong>of</strong><br />
farm-made <strong>feeds</strong>. The data show<br />
that all farmers who make their<br />
own <strong>feeds</strong> use rice bran as an<br />
energy source, whilst a very small<br />
proportion use broken rice or corn<br />
meal instead <strong>of</strong> rice bran. Several protein sources are used, though the majority <strong>of</strong><br />
farmers (80 percent throughout the Delta) use trash fish. Soybean meal is the second<br />
most important protein source used by farmers (39 percent <strong>of</strong> farmers). It is either used<br />
as an alternative or as a supplement to trash fish. Farmers in the Mekong Delta have<br />
recognized the financial benefits <strong>of</strong> such substitutions in order to reduce production<br />
cost during the period when the supply <strong>of</strong> trash fish is low. Moreover, farmers also<br />
use soybean meal as an alterative protein source because <strong>of</strong> the reduced availability <strong>of</strong><br />
trash fish <strong>and</strong> the increasing price <strong>of</strong> this commodity. Farmers appear to have a lower<br />
preference <strong>for</strong> other alternatives such as fishmeal, by-products <strong>of</strong> fish processing, meatbone<br />
meal <strong>and</strong> poultry by-product meal. Furthermore, it was <strong>of</strong> interest to note that<br />
farmers in Chau Doc only used trash fish <strong>and</strong> rice bran <strong>for</strong> feed preparation, whilst
Case study on the use <strong>of</strong> farm-made <strong>feeds</strong> <strong>and</strong> commercially <strong>for</strong>mulated pellets <strong>for</strong> pangasiid catfish culture 371<br />
those from the other regions were more<br />
open to change <strong>and</strong> used alternative<br />
ingredients to reduce their dependency<br />
on trash fish.<br />
The inclusion rates <strong>of</strong> ingredients in<br />
farm-made <strong>feeds</strong> varied between farmers,<br />
depending on perceptions, tradition <strong>of</strong><br />
feed preparation <strong>and</strong> the availability <strong>of</strong><br />
ingredients. In general, rice bran <strong>for</strong>ms<br />
the bulk <strong>of</strong> their <strong>for</strong>mulation <strong>and</strong> is<br />
included at over 50 percent by 66 percent<br />
<strong>of</strong> all farmers (Table 4). Broken rice is<br />
also commonly used but at inclusion<br />
levels <strong>of</strong> 10–30 percent (66 percent <strong>of</strong><br />
farmers). The reason <strong>for</strong> the use <strong>of</strong> rice<br />
bran is its low price <strong>and</strong> high availability.<br />
Trash fish is the most important protein source. Inclusion rates vary from 10–30 percent<br />
(58 percent <strong>of</strong> farmers) <strong>and</strong> from 30 to 50 percent (36 percent <strong>of</strong> farmers). These<br />
differences can be attributed to traditional feed preparation practices. The second most<br />
commonly used protein ingredient is soybean meal <strong>and</strong> is used at inclusion rates <strong>of</strong><br />
10–30 percent (79 percent <strong>of</strong> farmers). The only other ingredient <strong>of</strong> consequence is the<br />
by-product <strong>of</strong> fish processing, which is included by some farmers at between 10 to<br />
30 percent. The data suggest that pangasiid farmers in the Mekong Delta are actively<br />
beginning to seek alternative ingredients <strong>for</strong> their farm-made feed preparations.<br />
In addition to the main ingredients, farmers <strong>of</strong>ten mix readily available feed<br />
additives into their preparations. Among others, these may include vitamin C, lysine,<br />
methionine, anti-oxidants, probiotics, brewer’s yeast, enzymes, vitamin <strong>and</strong> mineral<br />
premixes. Figure 9 shows that about 65 percent <strong>of</strong> the interviewees use vitamin C<br />
to improve fish health <strong>and</strong> up to 24 percent <strong>of</strong> farmers use enzymes to increase feed<br />
digestibility.<br />
Normally, ingredients are mixed, cooked <strong>and</strong> extruded into sticky long strings<br />
(see Figure 13) <strong>and</strong> are fed to the fish in a wet <strong>for</strong>m. In some places in Can Tho <strong>and</strong><br />
Vinh Long farmers only cook the broken rice to <strong>for</strong>m a binding paste <strong>and</strong> then mix it<br />
with the other ingredients be<strong>for</strong>e extrusion. This method is called the partial cooking<br />
process in which premixes <strong>and</strong> feed additives<br />
are added at higher rates in comparison to the<br />
complete cooking process. The fuels to cook<br />
the ingredients include rice <strong>and</strong> cashew husks<br />
<strong>and</strong> rubber tyres, though most farmers use<br />
rice husks because it is cheap <strong>and</strong> available<br />
throughout the year.<br />
The survey identified nine major feed<br />
<strong>for</strong>mulations (Table 5). These diets have<br />
relatively low protein levels <strong>for</strong> a carnivorous<br />
species <strong>and</strong> range from 13.6 to 31.5 percent,<br />
while lipid levels range from 6.7 to 12.2 percent.<br />
The estimated proximate composition <strong>of</strong> the<br />
diets is based on the nutrient composition<br />
<strong>of</strong> the ingredients. Farmers in Chau Doc<br />
traditionally use feed <strong>for</strong>mulations 3 <strong>and</strong> 4<br />
(Table 5) <strong>for</strong> the initial production phase<br />
<strong>and</strong> <strong>feeds</strong> 1 <strong>and</strong> 2 <strong>for</strong> the final stage <strong>of</strong> the<br />
production cycle. In contrast, farmers in Long<br />
TABLE 4<br />
Percent <strong>of</strong> farmers using different feed ingredients at various<br />
inclusion rates <strong>for</strong> farm-made <strong>feeds</strong><br />
Inclusion rates <strong>of</strong> different ingredients<br />
(% as fed basis)<br />
Ingredient >50 31–50 10–30
372<br />
<strong>Study</strong> <strong>and</strong> <strong>analysis</strong> <strong>of</strong> <strong>feeds</strong> <strong>and</strong> <strong>fertilizers</strong> <strong>for</strong> <strong>sustainable</strong> aquaculture development<br />
TABLE 5<br />
Farm-made feed <strong>for</strong>mulations <strong>for</strong> catfish farming in the Mekong Delta (% inclusion rate as fed basis)<br />
Ingredients Diet 1 Diet 2 Diet 3 Diet 4 Diet 5 Diet 6 Diet 7 Diet 8 Diet 9<br />
Trash fish 20 20 30 35 25<br />
Rice bran 80 70 50 59 43 40 50 50 50<br />
Broken rice 10 20<br />
Soybean meal 16 30 20 20<br />
Soybean 30<br />
Fishmeal 16 20<br />
Corn 10<br />
Fish by-products 30 10<br />
Restaurant waste 30<br />
Vegetable 10<br />
Brewer’s grain 6<br />
Proximate nutrient composition <strong>of</strong> farm-made <strong>feeds</strong> (% dry matter)<br />
Crude protein 13.6 13.8 14.8 14.1 25.4 24.3 31.5 19.0 21.0<br />
Crude lipid 12.2 11.5 9.9 10.0 9.0 9.8 6.7 9.3 8.0<br />
FIGURE 10<br />
Price fluctuations <strong>of</strong> the main farm-made feed ingredients in 2005<br />
(US$1.00 = VND 15 800)<br />
Xuyen <strong>and</strong> Can Tho/Vinh<br />
Long prefer to use diets 6<br />
to 9 in which trash fish is<br />
completely replaced by<br />
soybean meal, fishmeal, byproducts<br />
<strong>of</strong> fish processing<br />
or restaurant waste. Diets 6<br />
to 9 are relatively high in<br />
protein when compared to<br />
the trash fish based diets due<br />
to the high protein content <strong>of</strong><br />
soybean meal <strong>and</strong> fishmeal.<br />
3.5 Price <strong>and</strong> availability<br />
<strong>of</strong> feed ingredients <strong>for</strong><br />
farm-made <strong>feeds</strong><br />
Figure 10 illustrates the price<br />
<strong>of</strong> the five most important<br />
feed ingredients. Fishmeal (locally produced with 50 percent protein content) <strong>and</strong><br />
soybean meal are more expensive than others, though protein content is approximately<br />
3–4 times higher than <strong>for</strong> trash fish. Hence the use <strong>of</strong> soybean meal <strong>and</strong> fishmeal<br />
may be more pr<strong>of</strong>itable than trash fish in terms <strong>of</strong> cost per unit <strong>of</strong> protein. Seasonal<br />
price fluctuations are relatively high <strong>for</strong> trash fish <strong>and</strong> rice bran but not <strong>for</strong> soybean<br />
meal <strong>and</strong> fishmeal, which reflects seasonal <strong>and</strong> general availability. In comparison to<br />
other ingredients, trash fish has the highest price fluctuation <strong>and</strong> this is caused by the<br />
seasonal nature <strong>of</strong> the fishery.<br />
3.6 Future trends in feed use <strong>and</strong> feeding practices<br />
Constraints<br />
Data in Figure 11 show that more than a quarter (27 percent) <strong>of</strong> interviewed farmers<br />
had no problem with the use <strong>of</strong> farm-made <strong>feeds</strong>, though the same proportion <strong>of</strong><br />
farmers also identified supply instability <strong>of</strong> the main ingredient (trash fish) as the<br />
main constraint in the use <strong>of</strong> farm-made <strong>feeds</strong>. Some 26 percent <strong>of</strong> farmers regarded<br />
price <strong>and</strong> price fluctuation as a constraint. The third most common constraint (voiced<br />
by 15 percent <strong>of</strong> farmers) is the unknown origin <strong>and</strong> thus unknown quality <strong>of</strong> feed<br />
ingredients. In conclusion, almost all <strong>of</strong> the constraints revolve around the dependency<br />
on trash fish as the main source <strong>of</strong> protein <strong>for</strong> farm-made feed preparations.
Case study on the use <strong>of</strong> farm-made <strong>feeds</strong> <strong>and</strong> commercially <strong>for</strong>mulated pellets <strong>for</strong> pangasiid catfish culture 373<br />
Future trends in feed use patterns<br />
<strong>and</strong> manufacture<br />
Although farmers face several<br />
constraints with respect to the<br />
use <strong>of</strong> farm-made <strong>feeds</strong> most <strong>of</strong><br />
them (90 percent) reported that<br />
they would maintain their present<br />
feeding practices. However, some<br />
(10 percent) reported that they plan<br />
to change their feed preparations to<br />
deal with the scarcity <strong>of</strong> ingredients.<br />
These changes in feed preparation<br />
techniques are likely to include the<br />
choice <strong>of</strong> alternative protein sources<br />
FIGURE 11<br />
Constraints faced by farmers in the use <strong>of</strong> farm-made <strong>feeds</strong><br />
No problem<br />
Supply instability<br />
Feed <strong>for</strong>mulation method<br />
Price fluctuation<br />
Unknown origin <strong>of</strong> feed ingredients<br />
High price <strong>of</strong> feed<br />
such as fishmeal <strong>and</strong> soybean meal <strong>and</strong> the use <strong>of</strong> small-scale, on-farm extruders to<br />
produce floating pellets.<br />
3.7 Economic evaluation <strong>of</strong> farm-made <strong>and</strong> pelleted <strong>feeds</strong><br />
Data collected from 48 catfish farmers were used <strong>for</strong> the economic evaluation <strong>of</strong> their<br />
activities. The <strong>analysis</strong> is based on a 6–7 month production cycle <strong>for</strong> both cage <strong>and</strong><br />
pond farming systems. Farmers normally obtain a loan from a bank <strong>for</strong> cage or pond<br />
construction at an annual interest rate <strong>of</strong> 8–10 percent. Personal loans may also be<br />
obtained from relatives, friends <strong>and</strong> private lenders but this practice is less common<br />
due to their higher monthly interest rates, which may be 2–3 percent higher than bank<br />
rates. Other investment costs include capital <strong>for</strong> a cooker, feed mixer, compressor <strong>and</strong> a<br />
water pump, averaging around US$250–312 3 , US$625–940, US$188–250 <strong>and</strong> US$312–<br />
625, respectively <strong>and</strong> totaling around US$1 750.<br />
Cage culture system<br />
Of the 15 cage farmers, 12 used farm-made feed <strong>and</strong> three used pellets. Fish stocking<br />
densities in cages range from 120–150 fish/m 3 , <strong>and</strong> fingerlings range in size from<br />
80–100 g/fish. Cages are depreciated over a span <strong>of</strong> 10 years, while other equipment<br />
such as feed mixers, extruders, cookers is depreciated over a span <strong>of</strong> 5 years. The cost<br />
per fingerling is in the range <strong>of</strong> VND 1 000–1 500 (US$0.06–0.09). Two permanent<br />
labour units are required if farm-made <strong>feeds</strong> are used <strong>and</strong> one unit <strong>for</strong> pellets. The<br />
average food conversions ration (FCR) <strong>for</strong> farm-made feed ranges from 2.0–3.7 <strong>and</strong> <strong>for</strong><br />
pellets between 1.5 <strong>and</strong> 2. The cost/benefit <strong>analysis</strong> <strong>for</strong> cage culture was calculated <strong>for</strong><br />
a unit <strong>of</strong> one cubic meter <strong>and</strong> the results are presented in Table 6.<br />
The results show that the cost <strong>of</strong> feed accounts <strong>for</strong> the highest proportion <strong>of</strong><br />
total production cost in cages (78.8 percent <strong>for</strong> farm-made <strong>feeds</strong> <strong>and</strong> 84.5 percent <strong>for</strong><br />
pellets). Fingerlings account <strong>for</strong> the second highest proportional cost, though this is<br />
much lower than <strong>for</strong> feed, at around 8–9 percent. This finding suggests that catfish seed<br />
production is no longer a constraint <strong>for</strong> the catfish farming sector. Labour constituted<br />
a small proportion <strong>of</strong> the total production cost at around 0.9 percent <strong>and</strong> 1.6 percent<br />
<strong>for</strong> the pellet <strong>and</strong> farm-made feed systems, respectively.<br />
The results show that the average production cost per kilogramme is higher in<br />
the pellet based systems (US$0.64 to US$0.65) than in the farm-made feed systems<br />
(US$0.51–0.73). However, because <strong>of</strong> the highly variable FCRs <strong>and</strong> the fluctuating<br />
price <strong>of</strong> trash fish it is not possible to conclude that higher pr<strong>of</strong>it margins are attained<br />
with the use <strong>of</strong> farm-made <strong>feeds</strong>.<br />
3 US$1.00 = 16 000 VND
374<br />
<strong>Study</strong> <strong>and</strong> <strong>analysis</strong> <strong>of</strong> <strong>feeds</strong> <strong>and</strong> <strong>fertilizers</strong> <strong>for</strong> <strong>sustainable</strong> aquaculture development<br />
TABLE 6<br />
Average pangasiid catfish production costs (US$) in cage culture (per cubic meter)<br />
(US$1.00 = VND 16 000)<br />
Item<br />
Fixed cost<br />
Farm-made feed (n = 12)<br />
Amount % total<br />
Pellet feed (n = 2)<br />
Amount % total<br />
Depreciation (cage, boat, feed mixer<br />
<strong>and</strong> feeding machines)<br />
Variable costs<br />
1.61±1.13 2.41 1.19±0.46 2.44<br />
Fingerlings 6.58±2.85 9.84 3.58±2.75 7.38<br />
Feed 52.51±0.47 78.55 41.15±0.11 84.69<br />
Labour 1.06±0.99 1.59 0.42±0.03 0.86<br />
Disease prevention <strong>and</strong> treatment 3.63±2.71 5.42 2.02±0.76 4.16<br />
Fuel <strong>and</strong> electricity 1.16±0.83 1.74 0.19±0.04 0.39<br />
Interest 0.0 0.0 0.00<br />
Taxes <strong>and</strong> fees 0.19±0.18 0.29 0.04±0.02 0.08<br />
Transport<br />
Total cost<br />
1.10±0.01 0.15 0.0 0.00<br />
Per cubic metre 66.86±29.08 48.59±5.27<br />
Per kilogramme 0.62±0.11 0.64±0.01<br />
Pond culture<br />
The cost benefit <strong>analysis</strong> <strong>for</strong> pond based culture was based on data obtained from 34<br />
farmers (Table 7). Stocking density in ponds ranges from 30–40 fingerlings/m 2 . The<br />
fingerlings used in pond culture are smaller <strong>and</strong> hence cheaper (US$0.01–0.04) than<br />
those used in cages. Average FCRs using farm-made <strong>feeds</strong> <strong>and</strong> pellets in ponds are 2.0–<br />
3.5 <strong>and</strong> 1.5–1.7, respectively. Other production costs include fuel, electricity, labour,<br />
disease prevention <strong>and</strong> treatment, interest <strong>and</strong> transport.<br />
The results show that feed cost accounts <strong>for</strong> 81 percent <strong>and</strong> 90 percent <strong>of</strong> the total<br />
production cost <strong>for</strong> farm-made <strong>feeds</strong> <strong>and</strong> pellets, respectively. Feed cost in pond<br />
culture is higher than in cage culture. As <strong>for</strong> cage culture, the cost <strong>of</strong> seed is the second<br />
highest contributor to total production cost.<br />
Though there is some variation in the overall production costs between farmers<br />
the data indicates that the average production cost is only marginally higher when<br />
the fish are fed on pellets (US$0.50–0.69 per kg) in comparison with farm-made <strong>feeds</strong><br />
(US$0.43–0.64 per kg) (Tables 3 <strong>and</strong> 4; Figure 12). Overall, it would appear that the cost<br />
TABLE 7<br />
Average pangasiid catfish production costs (US$) in pond culture (per square meter)<br />
Item<br />
Fixed cost<br />
Farm-made feed (n = 11)<br />
Amount % total<br />
Pellet feed (n = 23)<br />
Amount % total<br />
Depreciation (pond, boat, feed mixer<br />
<strong>and</strong> feeding machines)<br />
0.15±0.14 0.80 0.19±0.26 0.89<br />
Pond rental<br />
Variable costs<br />
0.00<br />
0.00 0.07±0.04 0.31<br />
Fingerlings 1.82±2.75 9.81 1.03±0.77 4.82<br />
Feed 15.09±8.48 81.08 19.36±12.08 90.62<br />
Labour 0.18±0.09 0.98 0.18±0.11 0.82<br />
Disease prevention <strong>and</strong> treatment 1.00±0.61 5.37 0.06±0.85 2.38<br />
Fuel <strong>and</strong> electricity 1.00±0.07 5.37 0.07±0.15 0.34<br />
Interest 0.0 0.00 0.10±0.01 0.49<br />
Taxes <strong>and</strong> fees 0.01±0.01 0.04 0.06±0.10 0.27<br />
Transport<br />
Total cost<br />
0.01±0.02 0.06 0.09±0.04 0.40<br />
Per square metre 18.07±10.63 21.36±0.64<br />
Per kilogramme 0.55±0.115 0.60±0.10
Case study on the use <strong>of</strong> farm-made <strong>feeds</strong> <strong>and</strong> commercially <strong>for</strong>mulated pellets <strong>for</strong> pangasiid catfish culture 375<br />
<strong>of</strong> production in ponds is lower<br />
than in cages, though this may<br />
not be significant. From these<br />
data we concluded that farmmade<br />
<strong>feeds</strong> might be a better<br />
choice <strong>for</strong> small-scale farmers.<br />
However, large-scale farmers<br />
would be advised to use pellets to<br />
ensure good stock management<br />
<strong>and</strong> to reduce the risk associated<br />
with the instability in trash fish<br />
supply.<br />
FIGURE 12<br />
Comparison <strong>of</strong> production cost in cages <strong>and</strong> in ponds with<br />
farm-made <strong>and</strong> pelleted <strong>feeds</strong><br />
4. CONCLUSIONS AND<br />
RECOMMENDATIONS<br />
The survey <strong>of</strong> 107 fish farmers<br />
in the three different locations<br />
in the Mekong Delta revealed<br />
that feeding practices <strong>and</strong> culture<br />
facilities varied widely with respect to location, culture traditions <strong>and</strong> feed use<br />
practices. Cage culture <strong>of</strong> pangasiid catfish originated in Chau Doc. Pangasiid farming<br />
has now exp<strong>and</strong>ed to other locations along the Delta, where pond culture is generally<br />
favoured over cage culture. This is ascribed to the lower capital <strong>and</strong> production costs <strong>of</strong><br />
pond culture; <strong>and</strong> perhaps also due to the greater competition <strong>for</strong> cage space with water<br />
borne traffic in Long Xuyen <strong>and</strong> Can Tho/Vinh Long. It is expected that the trend<br />
towards pond culture will soon become the dominant farming practice <strong>for</strong> pangasiid<br />
catfish farming in the Mekong Delta.<br />
Commercially manufactured pellets first became available in 1998 <strong>and</strong> are now<br />
available in most parts <strong>of</strong> the Delta where catfish farming has developed. Pellets appear<br />
to have several advantages over farm-made <strong>feeds</strong>, though the average production cost<br />
per kg is higher than <strong>for</strong> farm-made <strong>feeds</strong>. Despite the advantages, farm-made <strong>feeds</strong><br />
still remain the most popular type <strong>of</strong> catfish feed in the more traditional farming areas.<br />
Moreover, many pellet feeding farmers also use farm-made <strong>feeds</strong> during the final<br />
month(s) <strong>of</strong> grow-out period. The practice is particularly prevalent when the market<br />
price <strong>of</strong> fish declines. Figures 13 <strong>and</strong> 14 illustrate the preparation <strong>and</strong> use <strong>of</strong> farm-made<br />
<strong>feeds</strong> <strong>and</strong> pelleted <strong>feeds</strong>.<br />
Farm-made feed traditionally consists <strong>of</strong> trash fish <strong>and</strong> rice bran. In recent years<br />
the supply <strong>of</strong> trash fish in Viet Nam has declined <strong>and</strong> the resultant higher price <strong>of</strong><br />
the commodity has had a significant negative impact on aquaculture in the country.<br />
The instability in the supply <strong>of</strong> trash fish has led to the use <strong>of</strong> alternative protein<br />
sources such as fishmeal <strong>and</strong> soybean meal. Fortunately, recent studies have indicated<br />
that Pangasius species can be reared entirely on non-marine protein sources without<br />
retarding fish growth or survival rates (Hung, 2003).<br />
There are numerous companies in the region that import <strong>and</strong> distribute ingredients<br />
suitable <strong>for</strong> catfish feed preparation <strong>and</strong> these are accessible to small-scale farmers.<br />
Trash fish throughout the SE Asia region, including Viet Nam, will become even scarcer<br />
in future. Hence, to ensure the growth <strong>of</strong> pangasiid aquaculture in the Mekong Delta<br />
there is a need to change the perception <strong>of</strong> the more traditional farmers, particularly<br />
in the Chau Doc area, with respect to the value <strong>of</strong> alternative ingredients. Farmers in<br />
the more recent catfish growing areas are more adaptable to change. Moreover, there is<br />
an urgent need <strong>for</strong> the state to promote <strong>and</strong> support appropriate on-farm research <strong>and</strong><br />
extension programmes to assist farmers throughout the Delta to <strong>for</strong>mulate new lowcost<br />
<strong>feeds</strong> <strong>and</strong> to determine the nutrient requirements <strong>of</strong> pangasiid catfish.
376<br />
COURTESY OF H.P. VIET HUY AND L.T. THANH TRUC<br />
COURTESY OF H.P. VIET HUY AND L.T. THANH TRUC<br />
<strong>Study</strong> <strong>and</strong> <strong>analysis</strong> <strong>of</strong> <strong>feeds</strong> <strong>and</strong> <strong>fertilizers</strong> <strong>for</strong> <strong>sustainable</strong> aquaculture development<br />
FIGURE 13<br />
Cooked farm-made feed (top left), cooling <strong>of</strong> cooked farm-made feed (top right),<br />
extruding semi-moist catfish feed (bottom left) <strong>and</strong> feeding semi-moist, farm-made feed<br />
to pangasiid catfish in ponds<br />
FIGURE 14<br />
Pelleted feed <strong>for</strong> pangasiid catfish (left) <strong>and</strong> feeding <strong>of</strong> Pangasius hypophthalmus in<br />
ponds (right)<br />
REFERENCES<br />
Action Aid. 2002. What do the catfish farmers say? Report <strong>of</strong> an interaction with catfish<br />
farmers in the Mekong Delta <strong>of</strong> Vietnam. Report <strong>of</strong> field trip research to the Mekong<br />
Delta (An Giang <strong>and</strong> Vinh Long provinces) from 25 to 31 July 2002. Hanoi, Action Aid<br />
Viet Nam, Food Rights Campaign. (Unpublished)<br />
Hung, L.T. 2003. Trends <strong>of</strong> the use <strong>of</strong> plant proteins in aqua-<strong>feeds</strong>: study on Pangasius catfish<br />
(Pangasius bocourti), pp. 238–247. National seminar <strong>of</strong> science to serve aquaculture<br />
development in South Vietnam, 20–21 Dec 2002. Agriculture Publisher. (Vietnamese)
Case study on the use <strong>of</strong> farm-made <strong>feeds</strong> <strong>and</strong> commercially <strong>for</strong>mulated pellets <strong>for</strong> pangasiid catfish culture 377<br />
MOFI (Ministry <strong>of</strong> Fisheries). 2004. Planning <strong>and</strong> management issues <strong>for</strong> the development<br />
<strong>of</strong> Pangasius production to year 2010. Presented in the workshop on Vietnam Tra-<br />
Basa trade name <strong>and</strong> quality, held in An Giang province, 14 – 16 December 2004.<br />
(Vietnamese)<br />
Phu, T.Q. <strong>and</strong> Hien, T.T.T. 2003. Changes in Types <strong>of</strong> Feeds <strong>for</strong> Pangasius catfish culture<br />
improve production in the Mekong Delta. Aquanews Vol. 18 No. 3 ~ Summer 2003<br />
(available at http://pdacrsp.oregonstate.edu/aquanews/summer2003/p7.html).<br />
Phuong, N.T., Yi, Y., Ngoc, L.B. <strong>and</strong> Griffiths, D. 2005. A case study <strong>of</strong> environmental<br />
management <strong>of</strong> catfish farming in the Mekong River Delta <strong>of</strong> Viet Nam. World<br />
Aquaculture 2005, Bali, Indonesia. (Unpublished)
COUNTRY REVIEWS: AFRICA<br />
379
Analysis <strong>of</strong> <strong>feeds</strong> <strong>and</strong> <strong>fertilizers</strong><br />
<strong>for</strong> <strong>sustainable</strong> aquaculture<br />
development in Cameroon<br />
Victor Pouomogne<br />
Institute <strong>of</strong> Agricultural Research <strong>for</strong> Development (IRAD)<br />
Fishculture <strong>and</strong> Inl<strong>and</strong> Fisheries Research Station, PO Box 255 Foumban<br />
Cameroon<br />
Summary 382<br />
1. Introduction 383<br />
2. General overview <strong>of</strong> aquaculture practices <strong>and</strong> farming systems 383<br />
3. Review <strong>and</strong> <strong>analysis</strong> <strong>of</strong> aquaculture <strong>feeds</strong> <strong>and</strong> feeding 386<br />
4. Resource availability <strong>and</strong> the expansion <strong>of</strong> the aquaculture industry 397<br />
5. Recommendation <strong>and</strong> suggested policy guidelines 397<br />
Acknowledgements 397<br />
References 398<br />
Pouomogne, V. 2007. Analysis <strong>of</strong> <strong>feeds</strong> <strong>and</strong> <strong>fertilizers</strong> <strong>for</strong> <strong>sustainable</strong> aquaculture<br />
development in Cameroon. In M.R. Hasan, T. Hecht, S.S. De Silva <strong>and</strong> A.G.J.<br />
Tacon (eds). <strong>Study</strong> <strong>and</strong> <strong>analysis</strong> <strong>of</strong> <strong>feeds</strong> <strong>and</strong> <strong>fertilizers</strong> <strong>for</strong> <strong>sustainable</strong> aquaculture<br />
development. FAO Fisheries Technical Paper. No. 497. Rome, FAO. pp. 381–399.<br />
381
382<br />
<strong>Study</strong> <strong>and</strong> <strong>analysis</strong> <strong>of</strong> <strong>feeds</strong> <strong>and</strong> <strong>fertilizers</strong> <strong>for</strong> <strong>sustainable</strong> aquaculture development<br />
SUMMARY<br />
Aquaculture is an exp<strong>and</strong>ing activity in Cameroon. The availability <strong>of</strong> high quality<br />
fingerlings <strong>and</strong> <strong>feeds</strong> has been identified as the most important factors that constrain<br />
the development <strong>of</strong> the sector in Cameroon. The data <strong>and</strong> in<strong>for</strong>mation presented here<br />
was obtained from the available literature <strong>and</strong> by interviewing key stakeholders in the<br />
sector.<br />
Extensive <strong>and</strong> semi-intensive earthen pond fish farmings are the two most<br />
common aquaculture systems in Cameroon. Most small-scale rural fish farmers<br />
practice crib-based, compost aquaculture, without supplementary feeding. These<br />
cribs comprise around 10 percent <strong>of</strong> the pond water surface. A small-scale<br />
commercial sector is emerging in the peri-urban areas <strong>of</strong> Yaounde, Bafoussam <strong>and</strong><br />
Bertoua. These farmers practise polyculture <strong>of</strong> Nile tilapia <strong>and</strong> African catfish in<br />
fertilized ponds using chicken manure <strong>and</strong> single feed ingredients such as wheat bran<br />
<strong>and</strong> cotton seed oilcake. More than 80 percent <strong>of</strong> the 800 tonne production in 2005<br />
was derived from extensive <strong>and</strong> semi-intensive farming systems. In 2005, less than<br />
200 tonnes <strong>of</strong> fish were produced using compounded <strong>feeds</strong>. There are three major<br />
<strong>and</strong> three smaller industrial animal feed manufacturers in Cameroon. Only one <strong>of</strong><br />
the larger concerns produces aqua<strong>feeds</strong>. The total production capacity <strong>of</strong> animal<br />
feed manufacturers is estimated to be over 150 000 tonnes per year, though current<br />
production is less than 100 000 tonnes. In addition to the industrial sector, a farmmade<br />
livestock <strong>feeds</strong> sector is currently developing very rapidly in Cameroon, under<br />
common initiative groups that are less restricted by taxation policies. Most <strong>of</strong> the<br />
ingredients needed in classical animal compounded feed <strong>for</strong>mulations are available<br />
on local markets. The prices <strong>of</strong> most feed ingredients have been relatively stable,<br />
except <strong>for</strong> maize <strong>and</strong> soybean products that are mostly imported.<br />
To facilitate the development <strong>of</strong> the animal feed sector requires a renewed institutional<br />
<strong>and</strong> private sector focus. Its aims should be to provide in<strong>for</strong>mation <strong>for</strong> the <strong>sustainable</strong><br />
production <strong>of</strong> scarce ingredients such as maize, soybeans <strong>and</strong> fishmeal <strong>and</strong> facilitating<br />
the procurement <strong>of</strong> machinery <strong>for</strong> making <strong>and</strong> drying pellets using local technology. In<br />
particular, the public sector needs to accelerate the revision <strong>of</strong> import duties <strong>and</strong> taxes<br />
with respect to fuel, animal feed ingredients, <strong>fertilizers</strong> <strong>and</strong> machinery. In addition,<br />
researchers need to evaluate more <strong>of</strong> the locally available alternative feed ingredients<br />
<strong>and</strong> <strong>fertilizers</strong> <strong>and</strong> to provide farmers with a better comprehension <strong>of</strong> compost based<br />
aquaculture, which remains the most commonly used system.
Analysis <strong>of</strong> <strong>feeds</strong> <strong>and</strong> <strong>fertilizers</strong> <strong>for</strong> <strong>sustainable</strong> aquaculture development in Cameroon 383<br />
1. INTRODUCTION<br />
Aquaculture in Cameroon began in 1948. In<br />
comparison to other farming activities the sector is<br />
under developed. Fortunately, with the assistance <strong>of</strong><br />
FAO <strong>and</strong> the WorldFish Center investor interest in<br />
the small-scale aquaculture sector is increasing. Seed<br />
<strong>and</strong> feed have been identified as key constraints <strong>for</strong><br />
the development <strong>of</strong> the sector in the newly adopted<br />
strategic framework <strong>for</strong> aquaculture development<br />
in Cameroon (Moehl, Halwart <strong>and</strong> Brummett,<br />
2005). As part <strong>of</strong> this strategy, the government will<br />
no longer set production goals, will endeavour to<br />
privatise all <strong>for</strong>mer public aquaculture stations,<br />
will facilitate development through generation<br />
<strong>and</strong> dissemination <strong>of</strong> technological <strong>and</strong> marketing<br />
TABLE 1<br />
Livestock <strong>and</strong> fish production in Cameroon<br />
(1998)<br />
Sector Population<br />
(thous<strong>and</strong>)<br />
in<strong>for</strong>mation <strong>and</strong> focus on quality control <strong>of</strong> private sector seed <strong>and</strong> feed production.<br />
It should be noted that over 90 percent <strong>of</strong> fish producers in Cameroon are small, rural<br />
or peri-urban farmers who lack the resources to purchase costly feed ingredients.<br />
They rely mostly on nutrients derived from pond fertilization with organic materials<br />
<strong>of</strong> miscellaneous origins. In recent years the compound feed industry has shown<br />
tremendous growth, largely as a consequence <strong>of</strong> the rapidly exp<strong>and</strong>ing broiler chicken<br />
industry. Many <strong>of</strong> the ingredients used in the manufacture <strong>of</strong> chicken feed are also used<br />
<strong>for</strong> making fish pellets. Table 1 shows the contribution by livestock <strong>and</strong> fish to the<br />
protein requirement <strong>of</strong> Cameroon. The data show that fish, followed by beef are the<br />
two main protein sources <strong>for</strong> human consumption.<br />
This review is based on secondary-sources <strong>of</strong> in<strong>for</strong>mation <strong>and</strong> data derived from<br />
published papers <strong>and</strong> unpublished reports. Primary data <strong>and</strong> in<strong>for</strong>mation were also<br />
collected from the field through consultations with pr<strong>of</strong>essionals in the sector. The<br />
in<strong>for</strong>mation used <strong>for</strong> this report is considered the most reliable <strong>and</strong> up-to date (mid<br />
December 2005) <strong>for</strong> Cameroon, even though some may differ from past available<br />
<strong>of</strong>ficial data issued by the Department <strong>of</strong> Fisheries (MINEPIA), which is responsible<br />
<strong>for</strong> aquaculture development in the country.<br />
2. GENERAL OVERVIEW OF AQUACULTURE PRACTICES AND FARMING<br />
SYSTEMS<br />
2.1 Background<br />
In 1952 the colonial administration built 22 aquaculture demonstration stations to<br />
strengthen the sector <strong>and</strong> by 1960 the number <strong>of</strong> private earthen fish ponds exceeded<br />
10 000. Soon after independence in 1960 the extension ef<strong>for</strong>t collapsed <strong>and</strong> most ponds<br />
were ab<strong>and</strong>oned. During the early 1970s a UNDP/FAO regional project increased the<br />
number <strong>of</strong> public aquaculture stations to 32. However, declining donor support <strong>and</strong><br />
the transfer <strong>of</strong> aquaculture from the Forestry Department to the Livestock Department<br />
weakened the revival. Since 1980 there has been a revival in focussed donor support<br />
<strong>for</strong> aquaculture. The USAID common carp farming project in the Western Highl<strong>and</strong>s<br />
(1980–1984, <strong>and</strong> PCV till 1998), the IDRC provided support <strong>for</strong> integrated fish cum<br />
pig <strong>and</strong> chicken farming from 1986 to 1990, the Belgian Cooperation Agency provided<br />
support <strong>for</strong> catfish seed production at the Foumban Research Station from 1990 to<br />
1994, the French cooperation agency provided support <strong>for</strong> participatory aquaculture<br />
development in the Yaoundé region from 1994 to 1997, while DFID supported a<br />
participatory WorldFish Center project from 2000 to 2005.<br />
The development <strong>of</strong> aquaculture in Cameroon since independence was there<strong>for</strong>e<br />
largely driven by donor support. Given the stop-start, top-down nature <strong>of</strong> support the<br />
evolution <strong>of</strong> the sector until the mid 1990s has been erratic. In 1995, after evaluating<br />
% contribution to<br />
national animal protein<br />
consumption<br />
Cattle 4 846 25<br />
Sheep 2 304 3<br />
Goats 2 949 3<br />
Pig 1 200 7<br />
Poultry 31 000 8<br />
Fish * 54<br />
*Total amount <strong>of</strong> fish consumed by Cameroonians was<br />
estimated in 2002 at 250 000 tonnes, <strong>of</strong> which 150 000<br />
tonnes was from capture fisheries, 400 tonnes from<br />
aquaculture <strong>and</strong> the deficit (100 000 tonnes) imported.<br />
Source: DSDSR (2002)
384<br />
TABLE 2<br />
Aquaculture production (tonnes) in Cameroon (1990–2005)<br />
<strong>Study</strong> <strong>and</strong> <strong>analysis</strong> <strong>of</strong> <strong>feeds</strong> <strong>and</strong> <strong>fertilizers</strong> <strong>for</strong> <strong>sustainable</strong> aquaculture development<br />
past experiences, the Cameroon<br />
Government promoted a more<br />
participatory approach such as<br />
those supported by the French<br />
Cooperation Agency <strong>and</strong> DFID.<br />
This has resulted in considerable<br />
changes in aquaculture practices,<br />
improved use <strong>of</strong> local knowledge<br />
<strong>and</strong> practical experience at the<br />
farm <strong>and</strong> village level. In addition, the revision <strong>of</strong> legislation regulating freedom <strong>of</strong><br />
associations (1992) <strong>and</strong> increases in fish prices related to the devaluation <strong>of</strong> the CFA<br />
franc 1 in 1994 have created an environment favourable <strong>for</strong> <strong>sustainable</strong> aquaculture<br />
development. Population growth <strong>and</strong> the concomitant increase in the dem<strong>and</strong> <strong>for</strong> animal<br />
protein have also contributed significantly to the rising fish price. As a consequence,<br />
many ab<strong>and</strong>oned ponds have recently been rehabilitated <strong>and</strong> this has <strong>of</strong>ten been done<br />
without technical input from the extension services. This positive trend is facilitated by<br />
recent changes in policy <strong>and</strong> linked to the new market economy.<br />
Species 1990 2000 2003 2004 2005<br />
Nile tilapia 80 180 250 350 450<br />
North African catfish 6 120 180 230 300<br />
Others 20 50 70 70 70<br />
Total 106 350 500 650 820<br />
Source: Author estimates, PNVRA, WorldFish Center, FAO Cameroon, CEPID <strong>and</strong><br />
SEAPB (personal communication)<br />
2.2 Major cultured species <strong>and</strong> production figures<br />
An <strong>analysis</strong> <strong>of</strong> available data from the National Research <strong>and</strong> Extension Program,<br />
WorldFish Center, FAO Special Program <strong>for</strong> Food Security <strong>and</strong> the Department <strong>of</strong><br />
Fisheries revealed that by the end <strong>of</strong> 2004 there were approximately 4 000 farmers with<br />
7 000 ponds (>50 percent new or rebuilt since 1995) with an average size <strong>of</strong> 350 m².<br />
Total fish production from earthen ponds was estimated at 600 tonnes, <strong>of</strong> which<br />
more than 90 percent was produced by small-scale farmers. Nile tilapia (Oreochromis<br />
niloticus) was the most commonly farmed species, followed by North African catfish<br />
(Clarias gariepinus). The most common practice is polyculture <strong>of</strong> Nile tilapia with<br />
Clarias gariepinus where possible, or with other locally available species such as<br />
African bonytongue, Heterotis niloticus (local name: kanga), snakehead, Parachanna<br />
obscura (local name: viper fish), b<strong>and</strong>ed jewel fish Hemichromis fasciatus (local name:<br />
panther fish), common carp (Cyprinus carpio) or barbs, Barbus spp. (local name:<br />
gougeon) (Pouomogne, 2005). Fingerlings <strong>of</strong> the other species listed above are obtained<br />
mostly from the wild.<br />
2.3 Aquaculture practices (size <strong>of</strong> installations, pr<strong>of</strong>itability, farming systems)<br />
Aquaculture in Cameroon is dominated by the use <strong>of</strong> small ponds with an average<br />
size <strong>of</strong> 350 m² <strong>and</strong> indirect feeding through compost cribs loaded with organic<br />
material (mainly grass <strong>and</strong> weeds) <strong>and</strong> kitchen refuse. On average, the compost cribs<br />
comprise 10 percent <strong>of</strong> pond surface area. Average production is around 1 900 kg/ha/<br />
year (Pouomogne, field work findings 2004). The most progressive farmers (about<br />
15 percent <strong>of</strong> the total) who are concentrated mainly around Yaoundé (the capital city),<br />
use additional organic <strong>fertilizers</strong> (dry chicken droppings from commercial chicken<br />
farms) or compounded low cost pellets (presently available from IRAD <strong>and</strong> WorldFish<br />
Center pilot feed manufacturing plants). The recent on-farm participatory approaches<br />
by the WorldFish Center <strong>and</strong> FAO have shown that production can be increased to<br />
around 9 000 kg/ha/year. A small number <strong>of</strong> commercial producers (FoodFishCorp <strong>and</strong><br />
EPA) have attained production levels <strong>of</strong> 15 tonnes/ha/year. Well managed farms with<br />
more than 0.5 ha <strong>of</strong> water were found to be generally pr<strong>of</strong>itable. A recent WorldFish<br />
Center study involving a dozen farms around Yaoundé showed that <strong>sustainable</strong> pr<strong>of</strong>its<br />
are possible (up to 40 percent internal rate <strong>of</strong> return), particularly where fish farming<br />
was integrated with chickens or pigs (Pouomogne, 2003). However, a recent economic<br />
1 Cameroon local currency; average value in 2005 US$1.00 = CFAF530
Analysis <strong>of</strong> <strong>feeds</strong> <strong>and</strong> <strong>fertilizers</strong> <strong>for</strong> <strong>sustainable</strong> aquaculture development in Cameroon 385<br />
TABLE 3<br />
Differences in structural <strong>and</strong> price parameters between rural <strong>and</strong> peri-urban harvest markets in<br />
southern Cameroon (n= 84 farms)<br />
Type <strong>of</strong> harvest market<br />
One-tail<br />
Variable Peri-urban Rural<br />
T-test<br />
Number <strong>of</strong> buyers in market 25.4 ± 8.96 8.3 ± 7.32 0.0004<br />
Average quantity per sale (kg) 4.1 ± 3.47 2.4 ± 0.76 0.1660<br />
Total quantity marketed per harvest (kg) 89.9 ± 48.7 28.2 ± 23.5 0.0127<br />
Total quantity given as gifts (kg) 55.7 ± 41.2 11.4 ± 9.3 0.0458<br />
Total quantity consumed by household (kg) 50.3 ± 89.6 8.3 ± 6.8 0.3020<br />
Catfish price (CFAF/kg) 2 583 ± 376 1 636 ± 354 0.0000<br />
Tilapia price (CFAF/kg) 1 833 ± 408 1 054 ± 258 0.0000<br />
Mean price all species (CFAF/kg) 1 908 ± 570 1 290 ± 386 0.0053<br />
Source: Brummett (2005)<br />
<strong>analysis</strong> showed that at the current price <strong>of</strong> CFAF100 <strong>for</strong> one 5 g catfish fingerling,<br />
most small-scale rural farmers are losing money, although they would be pr<strong>of</strong>itable at a<br />
unit fingerling price <strong>of</strong> CFAF50. Hence there is a need to reduce the production cost <strong>of</strong><br />
catfish fingerlings. Table 3 summarizes some socio-economic variables <strong>of</strong> the recently<br />
ended WorldFish Center project.<br />
2.4 Aquaculture development policy in Cameroon <strong>and</strong> future prospects<br />
Compared to other farming activities, aquaculture in Cameroon remains under<br />
developed. To address this inadequacy a strategic framework was developed to<br />
accelerate the development <strong>of</strong> the sub-sector. Facilitated by the FAO <strong>and</strong> WorldFish<br />
Center, the framework was approved at the end <strong>of</strong> 2002 <strong>and</strong> provides the foundation<br />
<strong>for</strong> the development <strong>of</strong> a strategic aquaculture plan (Moehl, Halwart <strong>and</strong> Brummett,<br />
2005). The framework fits within the Development Plan <strong>for</strong> the rural sector <strong>and</strong> the<br />
poverty alleviation strategic plan currently implemented by the government (DSRP,<br />
2000; DSDSR, 2002).<br />
The strategic framework defines the respective roles <strong>of</strong> the public <strong>and</strong> the private<br />
sectors <strong>and</strong> relevant key points are highlighted below:<br />
• The role <strong>of</strong> government will be largely restricted to the provision <strong>and</strong> dissemination<br />
<strong>of</strong> in<strong>for</strong>mation <strong>and</strong> will be geared towards control <strong>of</strong> production <strong>and</strong> market chain<br />
activities to reduce hindrances linked to the interaction <strong>of</strong> various actors in the<br />
field <strong>and</strong> will cease to participate in any direct production activities. The private<br />
sector (including commercial <strong>and</strong> non-commercial producers, investors, NGOs<br />
(Non Governmental Organizations), banks, development agencies) will be directly<br />
responsible <strong>for</strong> the development <strong>of</strong> the sub-sector. Under these conditions, a sharp<br />
reduction <strong>of</strong> current government infrastructure will occur, which in turn provides<br />
opportunities <strong>for</strong> the private sector (e.g. aquaculture stations). Moreover, the<br />
framework recognises that previous interest in aquaculture was driven largely by<br />
misdirected assistance, inappropriate in<strong>for</strong>mation <strong>and</strong> promotion <strong>of</strong> the activity<br />
in unsuitable environments <strong>and</strong> was there<strong>for</strong>e mainly artificial. Hence<strong>for</strong>th, the<br />
development <strong>of</strong> the sector will be driven by market <strong>for</strong>ces. Scarce government<br />
resources can then be mobilised to focus on promoting aquaculture in identified<br />
high potential zones, using “mobile mixed teams”, including senior researchers<br />
<strong>and</strong> multidisciplinary extension technicians. The proposed new dispensation will<br />
compel producers to work together through fish farmers’ associations <strong>and</strong> to<br />
facilitate in<strong>for</strong>mation flow within <strong>and</strong> between associations, their members, <strong>and</strong><br />
the market.<br />
• The availability <strong>of</strong> good quality fish seed has historically been a major constraint<br />
to aquaculture development. Within the new strategic framework, government<br />
will retain the responsibility <strong>of</strong> progressive training <strong>and</strong> will aim to provide<br />
private fingerlings producers with up-to-date in<strong>for</strong>mation on seed production
386<br />
<strong>Study</strong> <strong>and</strong> <strong>analysis</strong> <strong>of</strong> <strong>feeds</strong> <strong>and</strong> <strong>fertilizers</strong> <strong>for</strong> <strong>sustainable</strong> aquaculture development<br />
<strong>and</strong> hatchery management. Moreover, the public service, through its own<br />
infrastructure or specialised NGOs acting <strong>for</strong> the government will be responsible<br />
to develop <strong>and</strong> maintain brood stock to ensure a regular supply <strong>of</strong> certified <strong>and</strong><br />
improved genetic material to private fingerling producers.<br />
• Outreach (extension services) in Cameroon, as elsewhere in sub Saharan Africa,<br />
remains a major debacle in aquaculture development. Lessons learnt from the past<br />
emphasize the effectiveness <strong>of</strong> specialized technicians providing on-farm support<br />
<strong>and</strong> supervision or through on-farm participatory research. However, the cost <strong>of</strong><br />
this approach is prohibitive <strong>and</strong> un<strong>sustainable</strong>. By contrast, repetitive failures have<br />
been registered with generalist extension services providing advice in the field <strong>of</strong><br />
aquaculture. A compromise should thus be sought, with inter alia, the idea <strong>of</strong><br />
“mobile mixed teams” evoked earlier, or the establishment <strong>of</strong> technical assistance<br />
contracts with specialised NGO partners on the basis <strong>of</strong> objectively verifiable<br />
indicators. In high potential <strong>and</strong> prioritised zones (e.g. peri-urban areas <strong>of</strong> large<br />
cities such as Yaounde or Douala), government should explore the opportunity<br />
<strong>of</strong> providing high level technical assistance to suitable <strong>and</strong> specifically identified<br />
private producers. In return <strong>for</strong> this support such commercial producers would be<br />
required to lend support to non-commercial farmers.<br />
To ensure the success <strong>of</strong> the initiatives a multi-disciplinary committee comprised <strong>of</strong><br />
representatives <strong>of</strong> major stakeholders is needed to monitor development <strong>and</strong> revise the<br />
strategy on an iterative basis as <strong>and</strong> when necessary. For some recurrent issues, such as<br />
high level education <strong>and</strong> training, new outreach paradigms or specific regulatory aspects<br />
(e.g. fish h<strong>and</strong>ling practise, introduction <strong>of</strong> alien species, pond effluent management,<br />
etc), multilateral partners may be needed to better tackle the issues at the regional or<br />
sub-regional level rather than at the national level. In addition, the framework tackles<br />
some specific questions, including the future <strong>of</strong> public aquaculture stations. It is<br />
suggested that most <strong>of</strong> these stations be sold or leased to the private sector on the basis<br />
<strong>of</strong> existing laws <strong>and</strong> procedures on the sale or lease <strong>of</strong> public property. One or more<br />
stations, preferably those in high potential zones, should be maintained by the State <strong>for</strong><br />
training, research <strong>and</strong> genetic management <strong>of</strong> brood stock.<br />
3. REVIEW AND ANALYSIS OF AQUACULTURE FEEDS AND FEEDING<br />
Compounded balanced diets are used only marginally by Cameroonian fish farmers.<br />
More than 90 percent <strong>of</strong> fish producers in Cameroon know nothing about compounded<br />
fish pellets. They depend mostly on on-farm resources such as vegetable matter, animal<br />
manure <strong>and</strong> household wastes <strong>for</strong> pond inputs. Some farmers provide supplementary<br />
feed in the <strong>for</strong>m <strong>of</strong> agro-industrial by-products such as cereal bran, where af<strong>for</strong>dable.<br />
3.1 Fertilizers, feed ingredients <strong>and</strong> <strong>feeds</strong><br />
3.1.1 Seasonal availability, cost, accessibility, nutritional composition<br />
a. Fertilizers <strong>and</strong> on-farm aqua<strong>feeds</strong><br />
The materials described below are used as pond inputs to stimulate natural water<br />
productivity. They are normally dumped into the compost crib or are spread over<br />
the water surface. Depending on the level <strong>of</strong> integrated farm activities <strong>and</strong> the scale<br />
<strong>of</strong> operation most <strong>of</strong> these materials are available on the farm. These commodities are<br />
farm by-products <strong>and</strong> are free <strong>of</strong> charge <strong>for</strong> most small-scale farmers.<br />
Manure (chicken, pig, rabbit, goat, sheep, cattle)<br />
More than 40 million l<strong>and</strong> animals are reared in Cameroon per annum (DSDSR, 2002).<br />
Manure production from this st<strong>and</strong>ing stock has been estimated to exceed 30 million<br />
tonnes per year. This manure is available all year round <strong>and</strong> is used mostly <strong>for</strong> vegetable<br />
production <strong>and</strong> <strong>for</strong> natural fertilization <strong>of</strong> extensive pastures. These materials are well<br />
suited as fish pond fertilization inputs, with dry manure: fish conversion rates varying
Analysis <strong>of</strong> <strong>feeds</strong> <strong>and</strong> <strong>fertilizers</strong> <strong>for</strong> <strong>sustainable</strong> aquaculture development in Cameroon 387<br />
from 4–6 <strong>for</strong> chicken litter to more than 10 <strong>for</strong> cattle manure. This variation is related<br />
to the C:N ratio <strong>of</strong> the manure, estimated at about 10:1 <strong>and</strong> 25:1 <strong>for</strong> chicken <strong>and</strong> cattle<br />
manure, respectively (ODA, 1986, cited by Pouomogne, 1994).<br />
Laos grass <strong>and</strong> “marguerite”<br />
Laos grass (Chromolaena odorata) <strong>and</strong> “marguerite” (Tithonia diversifolia,<br />
Leucanthemum vulgare) are available all year round. Both grasses were tested<br />
as compost crib input in small ponds (Yossa, 2003) <strong>and</strong> are now commonly<br />
used in most rural fish ponds. The chemical composition on a dry matter basis<br />
is as follows: N= 3.2 percent, P = 0.19 percent, K= 2.3 percent, Ca = 1.1 percent,<br />
<strong>and</strong> Mg = 0.55 percent <strong>for</strong> Chromolaena odorata; N= 3.17 percent, P =0.2 percent,<br />
K = 3.22 percent, Ca = 3.5 percent, <strong>and</strong> Mg = 0.41 percent <strong>for</strong> Tithonia diversifolia<br />
(Pouomogne et al., 2005).<br />
Elephant or napier grass (Pennisetum purpureum)<br />
Napier grass is commonly used by fish farmers, both as compost input <strong>and</strong> as feed <strong>for</strong><br />
herbivorous species. A certain degree <strong>of</strong> competition exists <strong>for</strong> this material as it is also<br />
used as a feed <strong>for</strong> ruminants <strong>and</strong> pigs. It grows mostly in fertile wet l<strong>and</strong>s. Availability<br />
is restricted to the rainy season, from April to October. P. purpureun contains 6 percent<br />
crude protein (dry matter basis) <strong>and</strong> 9 percent ash (Pouomogne, 1994).<br />
Water lily (Nymphaea sp), papyrus (Cyperus sp) <strong>and</strong> water hyacinth (Eichhornia<br />
crassipes)<br />
These aquatic weeds are available all year round <strong>and</strong> also occur in many ponds where<br />
they have been voluntarily introduced by the farmer to mistakenly “provide shelter<br />
to fish”. Un<strong>for</strong>tunately, <strong>and</strong> as could have been expected, the plants have covered<br />
the entire water surface <strong>and</strong> pond bottom. No <strong>for</strong>mal composting trials have been<br />
undertaken to test these materials as pond inputs. Chemical composition <strong>of</strong> these<br />
materials show lower nutritional content compared to Napier grass (New, Tacon <strong>and</strong><br />
Csavas, 1994).<br />
Cacao husk, c<strong>of</strong>fee pulp<br />
These by-products are available mainly during the harvesting season from November<br />
to February. Total availability in 2000 was estimated at 300 000 <strong>and</strong> 75 000 tonnes,<br />
respectively. Both are used as compost crib inputs <strong>and</strong> in the dry <strong>for</strong>m can also be used<br />
at a 20 percent inclusion rate in tilapia <strong>and</strong> catfish pellets (Pouomogne, Takam <strong>and</strong><br />
Pouomogne, 1997; Mvouti, 2001).<br />
Cassava pearls <strong>and</strong> soaking residues<br />
Cassava is one <strong>of</strong> the staple foods most commonly consumed by rural farmers within the<br />
<strong>for</strong>est areas <strong>of</strong> Cameroon. Annual production is estimated at 2 million tonnes (DSDSR,<br />
2002). Be<strong>for</strong>e consumption the entire tuber is soaked <strong>for</strong> 2 to 7 days to facilitate pealing<br />
<strong>and</strong> to decrease the cyanidic toxin component <strong>of</strong> the tuber. The soaking is commonly<br />
per<strong>for</strong>med in fish ponds or nearby small streams. The fertilizing material consists <strong>of</strong> the<br />
ab<strong>and</strong>oned “pearls” <strong>and</strong> the white juice that is diluted in the water during the soaking<br />
process. The recommended application rate <strong>for</strong> pond fertilization is 10 tonnes cassava<br />
soaked per ha per week (Pouomogne, 1994). The nutritional composition <strong>of</strong> cassava is<br />
presented in Table 4.<br />
Other on-farm by-products used as feed or <strong>fertilizers</strong><br />
Other on-farm by-products that are used <strong>for</strong> pond fertilization or as feed include<br />
palm oil pressure extraction molasses, sugar cane molasses, bean envelopes, over ripe<br />
fruit (papaya, guava, avocado), kitchen wastes, dead animals (mostly chickens <strong>and</strong>
388<br />
<strong>Study</strong> <strong>and</strong> <strong>analysis</strong> <strong>of</strong> <strong>feeds</strong> <strong>and</strong> <strong>fertilizers</strong> <strong>for</strong> <strong>sustainable</strong> aquaculture development<br />
pigs), slaughtered animal viscera, miscellaneous <strong>for</strong>est fruits <strong>and</strong> termites. All the<br />
above are commonly used on an ad hoc basis, though precise application rates have<br />
not been determined. The availability <strong>of</strong> these materials is regular <strong>and</strong> farmers are<br />
now dem<strong>and</strong>ing reliable scientific in<strong>for</strong>mation <strong>for</strong> greater efficiency. Kitchen refuse<br />
appears the most readily available commodity with which to load compost cribs. An<br />
average <strong>of</strong> 1.2 tonnes/household/year is produced in the western Cameroon highl<strong>and</strong>s<br />
(Pouomogne, Brummett <strong>and</strong> Gatchouko, 2004, unpublished data). The chemical<br />
composition <strong>of</strong> some <strong>of</strong> the materials are presented in Table 4.<br />
TABLE 4<br />
Proximate composition (% dry matter basis) <strong>and</strong> availability <strong>of</strong> common pond input materials in Cameroon<br />
(2005)<br />
Material Crude protein Ash P Ca Peak availability<br />
Laos grass (Chromolaena odorata) 26 - 0.2 1.1 Everywhere, all year<br />
Marigold/marguerite(Tithonia diversifolia) 23 - 0.2 3.5 Nearby roads, all year<br />
Elephant or Napier grass (Pennisetum<br />
purpureum)<br />
6 17 - - Wet <strong>and</strong> fertile soils, all year<br />
Cassava peelings 7 - 0.1 0.2 Household, all year (Feb–May)<br />
Bean peels 30 - 0.4 0.1 Farm plots, Nov–Feb<br />
Leucaena (whole) 24 7 - - Farm plots, all year<br />
Mimosa (Mimosa pudica) leaves 30 5 - - Farm plots, all year<br />
Groundnut leaves 16 19 - - Farm plots, July–Sept<br />
Sweet potato leaves 15 - 0.3 0.4 Farm plots, Nov–Feb<br />
Cassava leaves 27 10 - - Farm plots, all year<br />
Taro leaves 17 - 0.2 0.6 Farm plots, all year<br />
Macabo leaves 16 - 12.0 - Farm plots, all year<br />
Water lily/nenuphar (Nymphaea sp) - - - - Marsh areas, all year<br />
Water hyacinth 15 - 0.5 0.9 Marsh areas, all year<br />
Papyrus 10 - - - Marsh areas, all year<br />
Ripe avocado fruit 12 - 0.3 0.1 Households, farm plots<br />
(March–June)<br />
Ripe guava fruit 11 - 0.2 0.1 Farm plots, all year<br />
Guava leave 9 - 0.1 2.2 Farm plots, all year<br />
Ripe banana peels 10 - 0.2 0.3 Households, farm plots<br />
Ripe banana fruit 7 - 0.1 0.1 Households, farm plots<br />
Papaya fruit 6 - 0.1 0.3 Households, farm plots<br />
Papaya seeds <strong>and</strong> pulp 27 - 0.4 0.5 Households, farm plots<br />
Papaya peels 18 - 0.2 0.3 Households, farm plots<br />
Ground nut peels 5 2 - - Households, farm plots (Jul–<br />
Sept)<br />
Kitchen wastes 20 1 - - Household, all year<br />
Wild mango (whole) 4 - 0.1 0.3 Household, March–May<br />
Miscellaneous <strong>for</strong>est fruits 6 - - - All year, Aug–Nov, Southern<br />
Cameroon<br />
Palm oil pressure extraction molasses 12 - - - All year<br />
Sugar cane molasses 2 3 - - Industrial firm, B<strong>and</strong>jock, all<br />
year<br />
Dead animals 50 - - - Households <strong>and</strong> farm plots,<br />
all year<br />
Slaughterhouse wastes 52 - - - All year (festivals)<br />
Cow rumen content 60–70 14 - - All year (festival)<br />
Termites - - - - All year<br />
Snails 61 9.1 - - All year<br />
Pig manure - - - - Households, southern<br />
Cameroon<br />
Cow manure 9 40 - - Household <strong>and</strong> pastures,<br />
Goat/sheep manure - - - - Nationwide, all year<br />
Rabbit manure - - - - Households, all year<br />
Fresh chicken manure 27 35 - - Households<br />
Most <strong>of</strong> these materials are available free <strong>of</strong> charge. The main constrains when available are related to collection <strong>and</strong><br />
transportation cost.<br />
Source: Hauber (2005)
Analysis <strong>of</strong> <strong>feeds</strong> <strong>and</strong> <strong>fertilizers</strong> <strong>for</strong> <strong>sustainable</strong> aquaculture development in Cameroon 389<br />
Wood ash <strong>and</strong> inorganic <strong>fertilizers</strong><br />
Wood ash from kitchen fires is occasionally also used <strong>for</strong> pond fertilization. Inorganic<br />
<strong>fertilizers</strong> are not commonly used in Cameroon small-holder ponds <strong>and</strong> this is mainly<br />
due to the high price <strong>of</strong> the commodity. In some commercial farms NPK (20:10:10) is<br />
the most commonly used fertilizer at an application rate <strong>of</strong> 50 kg/ha/month to enhance<br />
phytoplankton start up, followed by organic fertilization <strong>and</strong> supplemental feeding.<br />
b. Feed ingredients<br />
The materials discussed in this section are produced by agro-industrial plants. They are<br />
used either as single <strong>feeds</strong> or are compounded with others <strong>and</strong> fed to fish in the <strong>for</strong>m <strong>of</strong><br />
dough or pellets, but mostly as dry meal. Feed conversion ratios in semi-intensive pond<br />
culture are generally below 8:1 <strong>for</strong> most <strong>of</strong> these by-products. Prices fluctuate widely<br />
according to supply <strong>and</strong> government taxes. All <strong>of</strong> these feed materials are subject to<br />
transportation constraints such as bad roads, high transport costs, police harassment<br />
<strong>and</strong> corruption.<br />
Wheat bran<br />
This is a by-product <strong>of</strong> the wheat flour milling industry. All wheat used in Cameroon is<br />
imported. An estimated 30 000 tonnes <strong>of</strong> wheat bran was produced in 2004. There is a<br />
high dem<strong>and</strong> <strong>for</strong> this relatively low cost commodity, particularly by pig farmers. Given<br />
its current price (CFAF60/kg) <strong>and</strong> the favourable crude protein <strong>and</strong> gross energy<br />
contents (11–16 percent <strong>and</strong> 18.0 kJ/g respectively), the use <strong>of</strong> wheat bran as a fish feed<br />
has been widely promoted <strong>and</strong> is now used by most small-scale commercial farmers,<br />
alongside with dry chicken layer droppings.<br />
Rice bran<br />
Rice bran production in Cameroon has decreased over the last 15 years. National<br />
production in 1990 was estimated at 25 000 tonnes (Fomunyam et al., 1990), while<br />
current production is less than 10 000 tonnes. Rice bran is used in fish farming in the<br />
same way as wheat bran.<br />
Maize<br />
Current national production is estimated at 1.2 million tonnes <strong>and</strong> there is high user<br />
competition <strong>for</strong> the commodity. The price varies from FCFA75/kg immediately<br />
after harvesting in mid July to more than CFAF210/kg in May <strong>of</strong> the following year.<br />
National production does not meet the dem<strong>and</strong> <strong>and</strong> annually more than 20 000 tonnes<br />
are imported. Maize is also used in the manufacture <strong>of</strong> compound fish diets.<br />
Cotton oil seed cake<br />
The main producer <strong>of</strong> this ingredient is Sodecoton, a newly privatized firm based in the<br />
Northern part <strong>of</strong> Cameroon. Production in 2004 was estimated at 60 000 tonnes. Its<br />
high protein content (49 percent) <strong>and</strong> relatively low price <strong>of</strong> CFAF125/kg (2.3 times<br />
lower than soybeans) makes it a preferred fish feed ingredient (see <strong>for</strong>mulations in<br />
Table 6). Because <strong>of</strong> the high gossypol content a maximum inclusion rate <strong>of</strong> 30 percent<br />
in compounded fish <strong>feeds</strong> is recommended (Pouomogne, 1994). Price fluctuations <strong>for</strong><br />
cotton oilseed cake are negligible.<br />
Groundnut oil cake<br />
Groundnut oilseed cake is another substitute <strong>of</strong> soybean oilcake in compounded fish<br />
feed. It has a similar protein content to soybean oil cake. Current production fluctuates<br />
significantly. When available on local markets, it constitutes a good substitute <strong>for</strong><br />
soybean or cotton seed oilcakes. The price in 2005 <strong>of</strong> CFAF150–200/kg was lower than<br />
<strong>for</strong> cotton <strong>and</strong> soybean oilseed cake. Storage <strong>of</strong> groundnut oilseed cake is problematic.
390<br />
<strong>Study</strong> <strong>and</strong> <strong>analysis</strong> <strong>of</strong> <strong>feeds</strong> <strong>and</strong> <strong>fertilizers</strong> <strong>for</strong> <strong>sustainable</strong> aquaculture development<br />
Compounded feed containing this ingredient is easily contaminated by aflatoxins that<br />
can result in high fish mortalities.<br />
Palm kernel cake<br />
This residue <strong>of</strong> palm kernel oil extraction is one <strong>of</strong> the cheapest commodities that can<br />
be used in compounded fish <strong>feeds</strong> (CFAF40/kg). About 20 000 tonnes were produced<br />
in 2004. The strong smell limits its consumption by most animals <strong>and</strong> hence the use <strong>of</strong><br />
the product is minimal. In fish farming, the highest inclusion rate in compounded diets<br />
is 10 percent (Pouomogne, Nana <strong>and</strong> Pouomegne, 1998; Jauncey, 1998).<br />
Soybean oilseed cake<br />
This is the main ingredient used as a protein source in animal <strong>feeds</strong> in Cameroon.<br />
National production <strong>of</strong> soybean cake is low (
Analysis <strong>of</strong> <strong>feeds</strong> <strong>and</strong> <strong>fertilizers</strong> <strong>for</strong> <strong>sustainable</strong> aquaculture development in Cameroon 391<br />
TABLE 5<br />
Protein content, availability <strong>and</strong> price <strong>of</strong> major fish feed ingredients in Cameroon (2005)<br />
Ingredient Crude protein<br />
(% dry matter)<br />
Quantity<br />
(tonnes/year)<br />
Average price<br />
(CFAF/kg)<br />
Peak availability<br />
Crayfish meal 60–76 * 700 Market, all year<br />
Fishmeal (white) 59–66 6 000 600 Feed retailers, all year<br />
Cattle meat meal 50–58 * 600 Sodepa, all year<br />
Blood meal 82–87 * 700 Idem<br />
Concentrate /premix 22 1 000 1 000 Import, retailers<br />
Bone meal (dry powder) * * 175 Feed retailers<br />
Groundnut cake 32–40 *<br />
Idem, Sodecoton Garoua,<br />
250 CHOCOCAM Douala<br />
Soybean oil cake 45–49 15 000 360 Import, retailers<br />
Cotton oil seed cake 48–50 70 000 160 Sodecoton, retailers<br />
Brewery waste 18–26 30 000<br />
Lager Beer Breweries,<br />
15 nationwide<br />
Wheat bran 12–17 30 000<br />
STC Wheatflour factories<br />
Foumbot, Sodeblé<br />
50 Ngaoundere, retailers<br />
Rice bran 8–11 10 000 50 Semry, Soderim, retailers<br />
Maize 8–12 1 200 000<br />
Maiscam Ngaoundéré,<br />
140 markets, retailers<br />
Millet (sorghum) 8–12 400 000 150 Idem, Northern Cameroon<br />
Palm kernel oil cake 10–16 20 000 40 CDC, SOCAPALM, retailers<br />
Cocoa husk 14 300 000 * Farms plot southern<br />
Cameroon (Nov–Feb)<br />
C<strong>of</strong>fee pulp 11 75 000 * Idem, Western highl<strong>and</strong><br />
Cameroon<br />
Dry layer droppings<br />
22–28 5 000 000 50 SPC <strong>and</strong> EPA stores,<br />
(industrial)<br />
Nationwide, all year<br />
* Data not available; CHOCOCAM = Chocolaterie de Cameroun; CDC = Cameroon Development Corporation;<br />
SOCAPALM = Société Camerounaise des Palmeraies; SPC = Société Camerounaise des Provenderies; EPA = Elevage<br />
Promotion Afrique<br />
Source: Hauber (2005) <strong>and</strong> author estimates<br />
c. Compounded pellets<br />
Four compounded fish diets are currently available in Cameroon. These include a dry<br />
mix (usually made by mixing 2 or 3 ingredients), a compound diet made by extrusion<br />
through a meat mincer <strong>and</strong> sun drying the pellets, a commercially available extruded<br />
pellet (made by a single manufacturer) <strong>and</strong> a flake diet made <strong>for</strong> ornamental fish<br />
farming. Most <strong>of</strong> the <strong>feeds</strong> contain around 30 percent crude protein, all from plant<br />
origin except <strong>for</strong> the commercially extruded diet, which contains fishmeal. With the<br />
development <strong>of</strong> low-cost <strong>for</strong>mulations using up to 30 percent <strong>of</strong> non-conventional<br />
ingredients, such as cocoa husks <strong>and</strong> dry chicken manure, the cost price <strong>of</strong> these<br />
pellets vary from CFAF170–250/kg. The retail price varies from CFAF225–500/kg<br />
according to dem<strong>and</strong>. The total quantity <strong>of</strong> pellets used in 2004 was estimated at 100<br />
tonnes. Dem<strong>and</strong> is however increasing <strong>and</strong> the estimate <strong>for</strong> 2005 exceeded 300 tonnes.<br />
The main aquafeed producer was FoodFishCorp (extruded pellets), while IRAD <strong>and</strong><br />
most small-scale commercial peri-urban fish farmers produced CP31 <strong>and</strong> CP45 pellets<br />
by alternative means (Pouomogne, Nana <strong>and</strong> Pouomegne, 1998; Mbongo <strong>and</strong> Yossa,<br />
2004). In<strong>for</strong>mation on the availability, price <strong>and</strong> crude protein content <strong>of</strong> the most<br />
commonly available <strong>fertilizers</strong> <strong>and</strong> feed ingredients are presented in Table 5.<br />
3.1.2 Feeding / fertilization practices (feeding rates, pellet size, feeding frequency)<br />
As indicated earlier, aquaculture in Cameroon is primarily based on a fertilization<br />
system using a compost crib built inside the pond. The crib is filled with miscellaneous<br />
inputs that are available on the farm. The typical rural/subsistence based farm pond<br />
crib is a bamboo frame comprising approximately 10 percent <strong>of</strong> the water surface<br />
area. Prior to stocking the pond, the crib is loaded with weeds <strong>and</strong> grass <strong>and</strong> available
392<br />
<strong>Study</strong> <strong>and</strong> <strong>analysis</strong> <strong>of</strong> <strong>feeds</strong> <strong>and</strong> <strong>fertilizers</strong> <strong>for</strong> <strong>sustainable</strong> aquaculture development<br />
animal manure. There after, all available household food wastes are dumped into the<br />
crib, the contents <strong>of</strong> which is then turned <strong>and</strong> mixed biweekly. In this system, fish<br />
depend entirely on natural productivity <strong>of</strong> the water body. Nile tilapia are stocked at an<br />
unknown density (usually the left overs <strong>of</strong> the preceding rearing cycle), <strong>and</strong> secondary<br />
fish species (Clarias sp. <strong>and</strong>/or Parachanna obscura) are added when possible to control<br />
the tilapia population.<br />
The follow-up to the above scenario is where the farmer aims to commercialize the<br />
enterprise. The system is essentially the same as above except that there is a greater<br />
degree <strong>of</strong> controlled management <strong>and</strong> an improved feeding/fertilization regimen. In<br />
such cases stocking density <strong>of</strong> Nile tilapia is usually 1 to 2 per m² plus an equivalent<br />
density <strong>of</strong> Clarias gariepinus, Heterotis niloticus or Parachanna obscura, <strong>and</strong> farmers are<br />
prepared to use scarce animal manure as a pond input rather than <strong>for</strong> vegetable growing<br />
<strong>and</strong> regularly apply supplementary <strong>feeds</strong> such as cassava, cocoyam, banana leaves,<br />
chopped up dead farm animals, over-ripe fruit <strong>and</strong> household food leftovers. The feed<br />
application rates are not st<strong>and</strong>ardized <strong>and</strong> essentially depend on the availability <strong>of</strong> the<br />
materials.<br />
In close proximity to the main cities <strong>of</strong> Yaounde <strong>and</strong> Bafoussam, where farmers<br />
have easier access to pond inputs, the second system has evolved further. Peri-urban<br />
fish farmers feed their fish directly <strong>and</strong> no longer rely purely on natural productivity.<br />
However, presently the price <strong>of</strong> feed ingredients is still more important than the<br />
nutritional balance <strong>of</strong> the feed. Among other options, farmers feed their fish with fresh<br />
or sun dried brewery waste <strong>and</strong> wheat bran <strong>and</strong> water fertility is enhanced mainly by<br />
the application <strong>of</strong> animal manure. Water quality is monitored by way <strong>of</strong> crude Secchi<br />
disks <strong>and</strong> manure is applied as <strong>and</strong> when necessary. Some <strong>of</strong> the peri-urban farmers<br />
have livestock pens above their ponds to enhance primary production (Pouomogne,<br />
1994). Pen stocking densities are at a rate <strong>of</strong> 1 pig (>25 kg weight) or 50 chickens (>3<br />
weeks old) per 100 m² water surface.<br />
There are only a few commercial farms where ponds are not fertilized <strong>and</strong> fish are<br />
fed entirely on a balanced diet. Stocking density <strong>of</strong> fish in intensive systems is higher<br />
(up to 3 Nile tilapia + 3 Clarias gariepinus + 1 Heterotis niloticus per m²), <strong>and</strong> ponds<br />
are intensively managed. Floating feeding frames are commonly used <strong>and</strong> the fish are<br />
fed according to prescribed feeding tables depending on mean fish weight. The use <strong>and</strong><br />
practicality <strong>of</strong> dem<strong>and</strong> feeders is currently being tested by IRAD.<br />
3.2 On farm feed management strategies <strong>and</strong> pond management techniques<br />
3.2.1 Pond management techniques<br />
Ponds in Cameroon are mostly <strong>of</strong> the derivation type (receiving water through a feeder<br />
canal or pipe). This technology <strong>and</strong> a minimum water depth <strong>of</strong> 1.2 m <strong>and</strong> surface area<br />
<strong>of</strong> 200 m 2 , has led to higher fish yields <strong>and</strong> the increased dem<strong>and</strong> <strong>and</strong> price <strong>of</strong> fish<br />
has led to pond rehabilitation in many areas. However, the level <strong>of</strong> management <strong>and</strong><br />
production depends largely on the means <strong>and</strong> motivation <strong>of</strong> the farmer.<br />
a. In rural subsistence based aquaculture the farmer uses left over small fish from<br />
the previous rearing cycle. Tilapia are raised either in mono or in poly-culture<br />
with a “police fish”. The preferred “police fish” is African catfish, which is<br />
stocked at a ratio <strong>of</strong> 1 predator per 4 m 2 . Alternatively indigenous wild species,<br />
captured from the surrounding streams, are used <strong>and</strong> these include native catfish<br />
(Clarias jaensis), viper fish, panther fish, kanga, gougeon, etc (see corresponding<br />
scientific names in the earlier section). Fish are fed with available on-farm<br />
materials, including cassava, cocoyam, banana leaves, kitchen refuse, termites,<br />
etc. Each pond contains a compost crib <strong>and</strong> production hardly reaches 3 tonnes/<br />
ha/year.<br />
b. In small-scale commercial aquaculture, single feed ingredients are used to feed<br />
the fish along with pond fertilization <strong>and</strong> <strong>of</strong>ten integrated with chickens or pigs
Analysis <strong>of</strong> <strong>feeds</strong> <strong>and</strong> <strong>fertilizers</strong> <strong>for</strong> <strong>sustainable</strong> aquaculture development in Cameroon 393<br />
reared above the pond water. Pond preparation is per<strong>for</strong>med using quick lime<br />
(10 to 30 kg per 100 m² water surface, depending on the nature <strong>of</strong> the pond<br />
bottom <strong>and</strong> on the farmers underst<strong>and</strong>ing <strong>of</strong> technical recommendations).<br />
Normal stocking density is 1 to 2 tilapias plus 1 catfish per m², plus some other<br />
fish species at a lower density. Higher production levels have been recorded<br />
when the number <strong>of</strong> species in the pond is increased <strong>and</strong> the pond is adequately<br />
fertilized <strong>and</strong> fed.<br />
c. Compounded pellets <strong>and</strong> extruded <strong>feeds</strong> are commonly used in peri-urban,<br />
medium or large commercial farms. Stocking densities are higher at up to 7<br />
fish per m². Strict feeding protocols are maintained, fish are sampled every two<br />
months <strong>and</strong> feed is adjusted accordingly. Production levels <strong>of</strong> between 9 to 17<br />
tonnes/ha/year have been recorded in some <strong>of</strong> these systems.<br />
3.2.2 Feed <strong>for</strong>mulation, processing <strong>and</strong> storage<br />
a. Formulation<br />
Farm made supplemental feed <strong>for</strong>mulations are diverse. Most small-scale commercial<br />
farmers use single ingredients to feed fish, based on af<strong>for</strong>dability <strong>and</strong> seasonal<br />
availability. Wheat <strong>and</strong> rice bran are the two most common single <strong>feeds</strong>, while farmers<br />
around the oil factories use cotton oilseed cake. Other single ingredient <strong>feeds</strong> <strong>for</strong><br />
tilapia <strong>and</strong> catfish polyculture include brewery waste, dry chicken droppings, rotten<br />
maize, beans or kitchen leftovers. More innovative farmers use a combination <strong>of</strong> mixed<br />
ingredients either in a dry or a moist <strong>for</strong>m. The available <strong>for</strong>mulated <strong>feeds</strong> (see Table 6)<br />
are used by the more advanced commercial farmers, while the larger companies use<br />
<strong>for</strong>mulations as recommended in the international literature (Jauncey, 1998; Guillaume<br />
et al., 1999).<br />
b. Processing<br />
The common feed processing practice by small-scale, peri-urban fish farmers consists<br />
<strong>of</strong> sun drying the wet ingredients, milling the dried ingredients in a disk or hammer<br />
mills, sieving, mixing <strong>and</strong> then extruding the mixture through a mincer (2 or 5 mm<br />
diameter) after moistening with 30 percent water. The pellets are then sun dried <strong>and</strong><br />
packaged into 50 kg bags. Sun drying is not possible during the rainy season (i.e. from<br />
TABLE 6<br />
Feed <strong>for</strong>mulations developed in Cameroon <strong>for</strong> Nile tilapia in polyculture with African catfish<br />
<strong>and</strong> other species<br />
Ingredients Grower, IRAD CP31<br />
(fertilized ponds)<br />
Grower tilapia 2<br />
(intensive system <strong>for</strong>mula)<br />
Starter, IRAD CP45<br />
(tilapia or Clarias below 10 g)<br />
Fishmeal - 20 55<br />
Soybean meal 13 15 5<br />
Cotton seed meal 15 15 5<br />
Groundnut meal 12 5 4<br />
Brewery waste 10 15 10<br />
Rice or wheat bran 20 15 2<br />
Cocoa husk or c<strong>of</strong>fee pulp 10 - -<br />
Layer droppings meal 15 - -<br />
Corn meal - 8 3<br />
Bone meal 1 - 4<br />
Palm oil 2 2 5<br />
Premix*<br />
Proximate <strong>analysis</strong><br />
2 5 5<br />
Crude protein 28.5 34.5 43.3<br />
Fat 8 9 11<br />
Gross energy (kJ/g) ? 19.2 20.4<br />
*Contains: 50% Met-Lys-Thr-efa-vitamins mix, 25% appetizer (crayfish), <strong>and</strong> 25% binder (wheat flour)<br />
Source: IRAD <strong>and</strong> private feed company
394<br />
<strong>Study</strong> <strong>and</strong> <strong>analysis</strong> <strong>of</strong> <strong>feeds</strong> <strong>and</strong> <strong>fertilizers</strong> <strong>for</strong> <strong>sustainable</strong> aquaculture development<br />
April to November in southern Cameroon). At a moisture content above 10 percent<br />
pellets become mouldy <strong>and</strong> unsafe after a few days. An air drying system is currently<br />
being tested to address this problem (see Figure 16, Hecht, this volume), because<br />
electric, oil or wood dryers are too expensive <strong>for</strong> small manufacturers. An air dryer<br />
<strong>of</strong> this type with a 100 kg drying capacity costs CFAF100 000. An electric dryer <strong>of</strong><br />
the same capacity costs 5 to 8 times more. FoodFishCorp produces pellets with an<br />
industrial extruder with a capacity <strong>of</strong> 100 tonnes per month. The ornamental fish feed<br />
manufactured in Cameroon is <strong>for</strong>mulated <strong>and</strong> contains an antioxidant, which plays a<br />
key role in the stability <strong>of</strong> the feed both <strong>for</strong> nutritive value <strong>and</strong> <strong>for</strong> long term storage.<br />
After preparing the moist <strong>for</strong>mulation, the mixture is spread in a thin layer, h<strong>and</strong><br />
pressed using wooden rollers <strong>and</strong> ultimately pressed between two electrically heated<br />
metallic sheets under a precise temperature, pressure <strong>and</strong> time protocol.<br />
c. Storage<br />
Dried <strong>and</strong> packed pellets are stored in aerated halls <strong>and</strong> must be used within four<br />
months following manufacture. Formulations containing more than 15 percent<br />
groundnut oilseed cake have to be used within two months after packaging.<br />
3.2.3 Feed / fertilizer efficiency <strong>and</strong> labour cost<br />
Conversion efficiencies <strong>for</strong> tilapia in polyculture using currently available inputs <strong>for</strong><br />
crib based systems in rural fish ponds are estimated to range from 8 to 30:1. Most<br />
<strong>of</strong>ten, labour does not constitute a limiting factor except during the staple crop farming<br />
season. Commercial fish farmers who use supplemental <strong>feeds</strong> show efficiencies 4 to<br />
10 time higher than their rural counterparts. Food conversion ratios <strong>of</strong> 1.5 to 6:1 have<br />
been recorded.<br />
3.3 The development <strong>of</strong> the aquafeed industry, with special reference to Nile<br />
tilapia <strong>and</strong> African catfish<br />
Aquafeed production in Cameroon remains insignificant <strong>and</strong> has by no means reached<br />
its full potential. Data presented in this section refers mainly to the chicken <strong>and</strong> pig<br />
feed industries.<br />
3.3.1 Overview<br />
The compounded animal feed industry is dominated by the production <strong>of</strong> chicken<br />
feed (70 percent), followed by pig (20 percent) <strong>and</strong> rabbit <strong>feeds</strong>. There are three major<br />
feed producers (Sodecoton, Société des Provenderies du Cameroun (SPC), Elevage<br />
Promotion Afrique (EPA) <strong>and</strong> several smaller concerns (Complexe Avicole de Mvogt<br />
Betsi (CAMB), SABEL, Ets Nkam <strong>and</strong> GICABAF). In the past SPC <strong>and</strong> EPA<br />
produced about 20 000 tonnes annually (Table 8), however since 2004 both companies<br />
have decreased their annual production <strong>and</strong> now mainly produce <strong>feeds</strong> <strong>for</strong> their inhouse<br />
requirements only.<br />
Soybean oilseed cake is the most important imported feed ingredient (average<br />
consumption during the past five years was 11 000 tonnes per annum). The major<br />
importers belong to the Chicken Market Chain Syndicate in Cameroon (SIFAC) <strong>and</strong><br />
these have joined the recent established association <strong>for</strong> the Defense <strong>of</strong> Consumer Rights<br />
(ACDIC) to fight against subsidised frozen chicken imports from the European Union<br />
by the government. All major players oppose the current regulations controlling the<br />
animal feed industry. New regulations are under discussion, including the duty free<br />
importation <strong>of</strong> milling equipment <strong>and</strong> raw materials such as fishmeal, soybean meal,<br />
concentrates <strong>and</strong> other premixes, a five-year tax holiday <strong>for</strong> new feed millers entering<br />
the industry <strong>and</strong> a code <strong>of</strong> investment encouraging <strong>for</strong>eign companies to participate<br />
in the Cameroonian animal feed industry (see Moehl, Halwart <strong>and</strong> Brummett, 2005;<br />
MINEPIA, 2005).
Analysis <strong>of</strong> <strong>feeds</strong> <strong>and</strong> <strong>fertilizers</strong> <strong>for</strong> <strong>sustainable</strong> aquaculture development in Cameroon 395<br />
TABLE 7<br />
Local <strong>and</strong> imported animal feed ingredients in Cameroon from 2001 to 2005 (tonnes)<br />
Ingredient 2001 2002 2003 2004 2005* Origin Availability**<br />
Soybean oil cake 8 968 12 472 10 824 13 648 7 033 Import Adequate<br />
Cottonseed oil cake 47 601 50 544 49 119 58 354 63 625 SODECTON Adequate<br />
Maize "gritz" 8 811 12 022 11 098 10 988 9 067 Import Poor<br />
Veterinary drugs 126 149 111 124 95 Import Adequate<br />
Premix ? 1 094 601 22 Import Adequate<br />
Miscellaneous 4 576 5 724 4 320 4 073 4 011 Import Excellent<br />
* From January to October 2005<br />
**Precise data on prices were not provided in the reference document.<br />
Source: Groupement Pr<strong>of</strong>essionnel des acconiers (2005); Sodecoton (pers. comm.)<br />
TABLE 8<br />
Compounded animal feed production in Cameroon<br />
Firm 2000 2001 2002 2003 2004<br />
Capacity<br />
tonnes/year<br />
Observations<br />
FishFoodCorp 0 0 0 0 40 1 000 New firm<br />
Sodecoton 28 286 47 601 50 544 49 119 48 354 30 000 Developing<br />
SPC 19 200 18 500 19 000 14 000 18 800 50 000 Strategic changes<br />
EPA 20 600 21 500 14 400 10 800 2 000 25 000 Declining<br />
Ets Nkam 1 900 2 000 2 150 1 800 2 400 5 000 Increasing<br />
CAMB 2 000 2 500 3 000 3 750 4 000 20 000 Increasing<br />
SIPREK - - - - - 15 000 Increasing<br />
SIFAB - - - - 1 450 12 000 New firm<br />
Total 71 986 92 101 87 669 79 449 75 594 131 000<br />
Source: Feed company representatives (pers. comm.)<br />
3.3.2 Current feed ingredient imports, exports <strong>and</strong> taxes<br />
An average <strong>of</strong> 27 700 tonnes <strong>of</strong> raw animal feed ingredients were imported annually<br />
during the past five years (Table 7).<br />
3.3.3 Total production capacity <strong>of</strong> compounded animal <strong>feeds</strong><br />
The total capacity <strong>of</strong> the currently active animal feed mills in Cameroon exceeds<br />
100 000 tonnes per annum. However, less than 35 percent <strong>of</strong> this capacity is currently<br />
employed (Table 8).<br />
FishFood Corp focuses on the production <strong>of</strong> extruded fish pellets, while the other<br />
producers manufacture cattle feed concentrate, chicken feed, pig <strong>and</strong> rabbit <strong>and</strong> other<br />
miscellaneous <strong>feeds</strong>. Chicken <strong>and</strong> pig <strong>feeds</strong> comprise 70 <strong>and</strong> 20–25 percent <strong>of</strong> the<br />
total feed production, respectively. Major feed producers are committed to technical<br />
inspections by larger customers to ensure quality, sustainability <strong>and</strong> efficiency. This<br />
guarantee by the producers is important as many customers are ready to purchase the<br />
<strong>feeds</strong> at higher prices if they have a say <strong>and</strong> are ensured <strong>of</strong> quality <strong>feeds</strong>.<br />
3.3.4 Industrially manufactured versus farm-made aqua<strong>feeds</strong><br />
The industrial animal feed manufacturers are facing fierce competition from smaller<br />
feed producers. This is mainly a consequence <strong>of</strong> taxes that favour Common Initiative<br />
Groups (GICs) over large corporations. This has provided the impetus <strong>for</strong> the rapid<br />
growth <strong>and</strong> expansion <strong>of</strong> smaller feed producers, who only use locally available<br />
ingredients. This sector is currently booming at the expense <strong>of</strong> the larger feed<br />
producers, some <strong>of</strong> which are now <strong>for</strong>ced to limit their production <strong>for</strong> own use.<br />
Moreover, most small-scale commercial fish farmers prefer using the IRAD CP31<br />
pellets made by small-scale producers rather than the extruded products made by<br />
FishFoodCorp, despite the fact that the <strong>feeds</strong> are similarly priced. The preference <strong>for</strong><br />
the IRAD CP31 feed is mainly a consequence <strong>of</strong> availability <strong>and</strong> producers providing<br />
a follow-up customer care service.
396<br />
<strong>Study</strong> <strong>and</strong> <strong>analysis</strong> <strong>of</strong> <strong>feeds</strong> <strong>and</strong> <strong>fertilizers</strong> <strong>for</strong> <strong>sustainable</strong> aquaculture development<br />
TABLE 9<br />
Quantity (tonnes) <strong>and</strong> price (CFAF/kg) <strong>of</strong> feed ingredients<br />
distributed <strong>for</strong> farm-made animal <strong>feeds</strong> by the importer ADER<br />
from 2003 to 2005<br />
Ingredients 2003 2004 2005 Average<br />
Soybean oil cake Quantity 6 500 4 820 4 500 5 275<br />
Price 270 320 250 280<br />
Fishmeal Quantity 200 184 70 151<br />
Price 400 433 400 411<br />
Premix Quantity 65 74 65 68<br />
Price 1 500 1 440 1 280 1 410<br />
Source: ADER company representative (pers. comm.)<br />
3.4 Problems <strong>and</strong> constraints<br />
Small-scale commercial aquaculture is<br />
developing in Cameroon. However,<br />
the majority <strong>of</strong> farmers remain poor<br />
<strong>and</strong> many cannot af<strong>for</strong>d the shift<br />
to a more intensive production<br />
system using supplemental <strong>feeds</strong>.<br />
Aquaculture will only be able to<br />
play its role in poverty alleviation<br />
in the short-term if the compost<br />
based traditional system is better<br />
understood <strong>and</strong> optimised. Current problems <strong>and</strong> constraints in the manufacture <strong>and</strong><br />
use <strong>of</strong> aqua<strong>feeds</strong> in Cameroon can be listed as follow:<br />
• The sustainability <strong>of</strong> the current dem<strong>and</strong> <strong>for</strong> aqua<strong>feeds</strong> is questionable. Most <strong>of</strong><br />
the dem<strong>and</strong> is derived through subsidized facilitation <strong>and</strong> from smaller private<br />
beginners. Users <strong>of</strong> <strong>for</strong>mulated aqua<strong>feeds</strong> are excited by the results obtained but<br />
most lack the finances <strong>and</strong> the necessary business acumen to make fish farming<br />
pr<strong>of</strong>itable.<br />
• Although data exists on the nutritional value <strong>of</strong> many alternate ingredients, most<br />
locally available materials remain to be appraised, both in terms <strong>of</strong> palatability <strong>and</strong><br />
digestibility.<br />
• The tropical climate (high temperature <strong>and</strong> humidity) negatively affects the quality<br />
<strong>of</strong> ingredients <strong>and</strong> compounded <strong>feeds</strong> during storage. For instance, infestation <strong>of</strong><br />
maize or beans by grain driller insects or oilseed cakes by Aspergillus is prevalent<br />
throughout Cameroon.<br />
• Funding <strong>for</strong> research <strong>and</strong> development in aquaculture is limited <strong>and</strong> inadequate.<br />
When data are available, extension services remain inadequate to diffuse the<br />
in<strong>for</strong>mation reliably to motivated farmers.<br />
• Government taxation policies are disabling the animal feed manufacturing sector.<br />
Policies are currently under revision.<br />
• Feed <strong>for</strong>mulation <strong>and</strong> processing technologies developed in Europe are not always<br />
appropriate <strong>and</strong> research needs to be undertaken to make better use <strong>of</strong> locally<br />
available ingredients such as bloodmeal, fishmeal, soybean meal <strong>and</strong> binders.<br />
• Aquafeed manufacturing equipment,<br />
particularly pelleting machines, are not<br />
available locally. Mills <strong>and</strong> mixers are relatively<br />
easily adapted by most local electro-mechanical<br />
artisans (Figure 1) but trials with most pelleting<br />
system have been disappointing.<br />
• The key constraints are macro-economic policy<br />
<strong>and</strong> climate (devaluation <strong>of</strong> the currency, the<br />
cycles <strong>of</strong> heavy international debt, corruption,<br />
etc) which keep most <strong>of</strong> sub-Saharan African<br />
farmers in an acute state <strong>of</strong> poverty.<br />
• Lack <strong>of</strong> expertise in aquaculture technologies.<br />
Given the current state <strong>of</strong> aquaculture in<br />
Cameroon it is our opinion that more ef<strong>for</strong>t<br />
should be focused on the development <strong>of</strong> semiintensive<br />
pond fertilization based aquaculture,<br />
which is more accessible to most Cameroonian<br />
farmers. However, this does not mean that<br />
the aquaculture feed industry should be<br />
neglected.<br />
FIGURE 1<br />
Adapted equipment <strong>for</strong> the<br />
production <strong>of</strong> fish pellets in<br />
Foumban, Cameroon
Analysis <strong>of</strong> <strong>feeds</strong> <strong>and</strong> <strong>fertilizers</strong> <strong>for</strong> <strong>sustainable</strong> aquaculture development in Cameroon 397<br />
4. RESOURCE AVAILABILITY AND THE EXPANSION OF THE AQUACULTURE<br />
INDUSTRY<br />
4.1 Projected growth<br />
Since 1992, aquaculture has registered a significant growth (Table 2). Many ab<strong>and</strong>oned<br />
ponds have been rehabilitated <strong>and</strong> the work undertaken by various institutions has<br />
led to improved aquaculture practices. As already mentioned, most farmers remain<br />
relatively poor. However, positive examples <strong>of</strong> fish farmers who have successfully<br />
begun to practice supplemental feeding <strong>and</strong> who have increased production from 1–3<br />
tonnes to >9 tonnes/ha/year are pushing an increasing number <strong>of</strong> non-commercial<br />
farmers to switch to commercial fish farming. This will generate a continuous increase<br />
in aquaculture production. While the larger commercial producers will no doubt<br />
increase fish production in Cameroon, we think that the most interesting future<br />
prospects will come from small-scale commercial farmers in the peri-urban areas.<br />
The most promising <strong>of</strong> these farmers should be identified <strong>and</strong> strongly encouraged to<br />
participate with development partner organizations. In short, the business is still under<br />
construction <strong>and</strong> in the absence <strong>of</strong> any commitment from development partners to keep<br />
working <strong>for</strong> some more years to come, it would be unwise to make any projections.<br />
The current fact is that <strong>for</strong> the past 15 years aquaculture in Cameroon has registered a<br />
10 percent yearly growth rate.<br />
5. RECOMMENDATION AND SUGGESTED POLICY GUIDELINES<br />
Semi-intensive <strong>and</strong> extensive earthen pond-based farming is the prevailing aquaculture<br />
system in Cameroon. It has remained a rural subsistence activity up to the mid<br />
1990s. Since then, many changes in living conditions alongside the devaluation <strong>of</strong><br />
the currency in 1994 have created positive conditions resulting in a revitalization <strong>of</strong><br />
aquaculture <strong>and</strong> the mergence <strong>of</strong> a strong small-scale market orientated aquaculture<br />
sector. Development over the last 15 years has been most rapid in peri-urban areas,<br />
where there is a greater dem<strong>and</strong> <strong>for</strong> fish <strong>and</strong> easier <strong>and</strong> af<strong>for</strong>dable access to inputs <strong>and</strong><br />
efficient technical expertise.<br />
The animal feed manufacturing industry has been operating <strong>for</strong> more than 10<br />
years <strong>and</strong> produces mainly chicken feed. Most feed ingredients are readily available<br />
<strong>and</strong> prices have remained relatively stable, except <strong>for</strong> maize <strong>and</strong> soybeans that are<br />
mostly imported. There is a need <strong>for</strong> government to facilitate the production <strong>of</strong> maize<br />
<strong>and</strong> soybeans in Cameroon. Whereas most equipment <strong>for</strong> small-scale animal feed<br />
manufactures can be locally sourced at af<strong>for</strong>dable prices, pellet presses <strong>and</strong> dryers still<br />
need to be improved. Government taxation policies constitute a serious hindrance to<br />
the development <strong>of</strong> the sector <strong>and</strong> the current new legislation under revision is eagerly<br />
awaited by animal feed manufacturers. Further scientific work remains to be done on<br />
the following: evaluation <strong>of</strong> alternative locally available feed ingredients <strong>and</strong> <strong>fertilizers</strong>;<br />
improved per<strong>for</strong>mance <strong>of</strong> pellet drying devices during the rainy season; better storage<br />
protocols <strong>for</strong> aqua<strong>feeds</strong>; improving the water stability <strong>of</strong> farm-made pellets <strong>and</strong> a better<br />
comprehension <strong>of</strong> the natural feed contribution to fish growth within compost based<br />
aquaculture systems; Cameroonian farmers need to be educated to optimize natural<br />
plus exogenous feed regimens. Moreover, there is need <strong>for</strong> continued farmer-scientist<br />
based partnerships to improve fish breeding <strong>and</strong> production (Brummett, 2005).<br />
ACKNOWLEDGEMENTS<br />
Mireille Kenmegne, Patrick Mounoumeck <strong>and</strong> Maurice G<strong>and</strong>ebe contributed to data<br />
collection. We wish to express our thanks to all contributors, especially our colleagues<br />
in industry.
398<br />
<strong>Study</strong> <strong>and</strong> <strong>analysis</strong> <strong>of</strong> <strong>feeds</strong> <strong>and</strong> <strong>fertilizers</strong> <strong>for</strong> <strong>sustainable</strong> aquaculture development<br />
REFERENCES<br />
Brummett, R.E. 2005. Development <strong>of</strong> integrated aquaculture-agriculture systems <strong>for</strong><br />
small-scale farmers in the <strong>for</strong>est margins <strong>of</strong> Cameroon (NRE9800 605/522/003). Final<br />
technical report. WorldFish Center, International Institue <strong>of</strong> Tropical Agriculture (IITA),<br />
Institut de Recherche Agricole pour le Développement Cameroun (IRAD), Ministère de<br />
l’Elevage, des Pêches et des Industries Animales Cameroun (MINEPIA). 32 pp.<br />
DSDSR (Document de Stratégie de Développement du Secteur Rural). 2002. Document de<br />
stratégie de développement du secteur rural. Document principal. 113 pp.<br />
DSRP (Document de Stratégie de Réduction de la Pauvreté). 2000. Document intérimaire<br />
de stratégie de réduction de la pauvreté. 2000-2003.<br />
Fomunyam, R.T., Tambi, E.N., Nfi, A.N., Meffeja, F., Fombad, B., Mbomi, E.S., Fai, E.N.<br />
& Morfaw, J.N. 1990. By-products Cameroon (3p-84-105). Final report No. 3. Mankon,<br />
IRZV, IDRC. 40 pp. (mimeo)<br />
Groupement Pr<strong>of</strong>essionnel des acconiers. 2005. Statistiques in<strong>for</strong>matisées sur les<br />
importations transitant par le port de Douala. Extraits 2000–2005. Décembre 2005.<br />
Guillaume, J., Kaushik, S., Bergot, P. & Métailler, R. 1999. Nutrition et alimentation des<br />
poissons et des crustacés. INRA/IFREMER eds. 489 pp.<br />
Hauber, M. 2005. Least cost feed <strong>for</strong>mulations <strong>for</strong> sub Saharan aquaculture. Stage report.<br />
Germany, University <strong>of</strong> Kassel.<br />
Jauncey, K. 1998. Tilapia <strong>feeds</strong> <strong>and</strong> feeding. Stirling, Pisces Press Ltd. 241 pp.<br />
Mbongo, T. & Yossa, R. 2004. Etude des principales contraintes et opportunités pour le<br />
développement et la vulgarisation de l’alimentation artificielle du poisson (granulés<br />
piscicoles) dans la province du centre au Cameroun. Rapport de recherché. 10 pp.<br />
Mvouti, A. 2001. Evaluation de la pulpe de café (C<strong>of</strong>fea robusta) en alimentation du<br />
Clarias gariepinus. Mémoire d’Ingénieur. PA, FASA, Université de Dschang. 26 pp. plus<br />
annexes.<br />
MINEPIA. 2005. Avant-projet de loi portant régime de la pêche et de l’aquaculture au<br />
Cameroun. TPC/CMR/2907 (A). Concertation nationale au Palais des congrès Yaoundé,<br />
November 8–9. 32 pp.<br />
New, M.B., Tacon, A.G.J. & Csavas, I. 1994. Farm-made aqua<strong>feeds</strong>. Fisheries technical<br />
paper No. 343, Rome, FAO. 434 pp.<br />
Moehl, J., Halwart, M., & Brummett, R. 2005. Report <strong>of</strong> the FAO-WorldFish Center<br />
Workshop on Small-scale Aquaculture in Sub-Saharan Africa: Revisiting the Aquaculture<br />
Target Group Paradigm. Limbé, Cameroon, 23–26 March 2004. CIFA Occasional Paper.<br />
No. 25. Rome, FAO. 54 pp.<br />
Pouomogne, V. 1994. Alimentation du tilapia Oreochromis niloticus en étang, 1994.<br />
Evaluation du potentiel d’utilisation de quelques sous-produits de l’industrie agroalimentaire<br />
et modalités d’apport des aliments. ENSA de Rennes. Edité par le CIRAD,<br />
Montpellier, France. 101 pp. plus annexes. (PhD thesis)<br />
Pouomogne, V., Takam, G. & Pouomogne, J.B. 1997. A preliminary evaluation <strong>of</strong> cacao<br />
husks in practical diets <strong>for</strong> juvenile Nile tilapia (Oreochromis niloticus). Aquaculture,<br />
156: 211-219.<br />
Pouomogne, V., Nana, J.P., & Pouomegne, J.B. 1998. Principes de pisciculture appliquée<br />
en milieu tropical africain. Comment produire du poisson à coût modéré (des exemples du<br />
Cameroun). CEPID/Coopération Française Yaoundé. Presses Universitaires d’Afrique.<br />
236 pp.<br />
Pouomogne, V. 2003. Quarterly progress report. October-December 2002. ICLARM FSRP<br />
project. Focus on the World Fish Summit, Penang, November 2-4. 25 pp. plus annexes.<br />
Pouomogne, V. 2005. Contribution to NEPAD development plan <strong>for</strong> aquaculture in Africa.<br />
Preparatory workshop <strong>for</strong> Abuja fish <strong>for</strong> all summit, June 26-30 2005. Cairo, NEPAD/<br />
WorldFish Center. 10 pp.
Analysis <strong>of</strong> <strong>feeds</strong> <strong>and</strong> <strong>fertilizers</strong> <strong>for</strong> <strong>sustainable</strong> aquaculture development in Cameroon 399<br />
Pouomogne, V., Yossa, R., Brummett, R.E., & Gokowsky, J. 2005. Premières données<br />
sur l’utilisation de Tithonia diversifolia et Chromolaena odorata comme fertilisants en<br />
étang de pisciculture du tilapia Oreochromis niloticus. Cameroon journal <strong>of</strong> agricultural<br />
sciences (in press).<br />
Yossa, N.R. 2003. Valorisation de Tithonia diversifolia (H.) A. gray et Chromolaena<br />
odorata (L.) R. King et H. Robinson dans la fertilisation des étangs piscicoles. Mémoire<br />
DEPFOR, FASA, Université de Dschang. 56 pp. plus annexes.
Analysis <strong>of</strong> <strong>feeds</strong> <strong>and</strong> <strong>fertilizers</strong><br />
<strong>for</strong> <strong>sustainable</strong> aquaculture<br />
development in Egypt<br />
Abdel-Fattah M. El-Sayed<br />
Oceanography Department, Faculty <strong>of</strong> Science<br />
Alex<strong>and</strong>ria University, Alex<strong>and</strong>ria<br />
Egypt<br />
Summary 402<br />
1. Introduction 403<br />
2. Aquaculture practices <strong>and</strong> farming systems 403<br />
3. Aquaculture <strong>feeds</strong> <strong>and</strong> feeding 407<br />
4. The use <strong>of</strong> <strong>fertilizers</strong> in aquaculture 412<br />
5. Farm management <strong>and</strong> feeding strategies 413<br />
6. The animal feed industry 414<br />
7. Problems <strong>and</strong> constraints 418<br />
8. Future perspectives 419<br />
9. Recommendations 420<br />
Acknowledgements 420<br />
References 421<br />
Appendix 422<br />
El-Sayed, A-F.M. 2007. Analysis <strong>of</strong> <strong>feeds</strong> <strong>and</strong> <strong>fertilizers</strong> <strong>for</strong> <strong>sustainable</strong> aquaculture<br />
development in Egypt. In M.R. Hasan, T. Hecht, S.S. De Silva <strong>and</strong> A.G.J. Tacon (eds).<br />
<strong>Study</strong> <strong>and</strong> <strong>analysis</strong> <strong>of</strong> <strong>feeds</strong> <strong>and</strong> <strong>fertilizers</strong> <strong>for</strong> <strong>sustainable</strong> aquaculture development.<br />
FAO Fisheries Technical Paper. No. 497. Rome, FAO. pp. 401–422.<br />
401
402<br />
<strong>Study</strong> <strong>and</strong> <strong>analysis</strong> <strong>of</strong> <strong>feeds</strong> <strong>and</strong> <strong>fertilizers</strong> <strong>for</strong> <strong>sustainable</strong> aquaculture development<br />
SUMMARY<br />
Aquaculture is one <strong>of</strong> the fastest growing animal production sectors in Egypt. During<br />
the period 1984 to 2004, production has increased from 15 000 tonnes (9.8 percent <strong>of</strong><br />
total fish production) to 471 535 tonnes (54.5 percent <strong>of</strong> total fish production). The rapid<br />
growth <strong>of</strong> the sector is expected to continue due to the availability <strong>of</strong> aquatic resources<br />
<strong>and</strong> energy inputs, including feed <strong>and</strong> fertilizer resources.<br />
Aquaculture in Egypt is practiced mainly in semi-intensive <strong>and</strong> intensive farming<br />
systems. Over 85 percent <strong>of</strong> aquaculture production is obtained from semi-intensive<br />
fish culture in brackish-water earthen ponds. Polyculture <strong>of</strong> Nile tilapia, mullet <strong>and</strong><br />
carp is the most important semi-intensive culture practice. Nile tilapia contributes over<br />
40 percent <strong>of</strong> production.<br />
The success or failure <strong>of</strong> aquaculture depends mainly on the availability <strong>and</strong><br />
accessibility <strong>of</strong> inputs, including <strong>feeds</strong> <strong>and</strong> <strong>fertilizers</strong>. However, little in<strong>for</strong>mation is<br />
available on feed <strong>and</strong> fertilizer resources. The available in<strong>for</strong>mation indicates that there<br />
are no st<strong>and</strong>ardised feeding <strong>and</strong> fertilization schedules. This is particularly important<br />
as aquaculture depends mostly on organic fertilization. With the exception <strong>of</strong> fishmeal<br />
<strong>and</strong> soybean meal, feed ingredients that are commonly used in aqua<strong>feeds</strong> are available<br />
in adequate volumes. However, the prices <strong>of</strong> most <strong>of</strong> the ingredients have increased<br />
substantially during the past few years.<br />
Poultry manure is the most important organic fertilizer used in ponds. It is estimated<br />
that the amount <strong>of</strong> poultry manure used in aquaculture represents about 3.5–10.0 percent<br />
<strong>of</strong> total poultry manure production. It is expected that poultry manure will remain<br />
the major pond nutrient input <strong>and</strong> hence the proportion <strong>of</strong> the total poultry manure<br />
production used by aquaculture will increase substantially in future. Inorganic <strong>fertilizers</strong><br />
are rarely used by Egyptian fish farmers <strong>and</strong> current use represents about 0.01 percent <strong>of</strong><br />
the national inorganic fertilizer consumption. It is unlikely that there will be any serious<br />
competition <strong>for</strong> <strong>fertilizers</strong> between aquaculture <strong>and</strong> agriculture, at least in the short term.<br />
Many factors affect pond fertilization including water quality, soil chemistry, season, pond<br />
dynamics, <strong>and</strong> economics. Pond fish farmers in Egypt rarely consider any <strong>of</strong> these factors <strong>and</strong><br />
fertilize their ponds on a “trial <strong>and</strong> error” basis, in addition to adopting each other’s practices.<br />
There<strong>for</strong>e, fertilization rates <strong>and</strong> frequencies in many areas are insufficient to produce the<br />
required natural food <strong>for</strong> the fish. Most <strong>of</strong> the ponds are fertilized only once, just prior to<br />
fish stocking <strong>and</strong> farmers mainly rely on processed commercial aqua<strong>feeds</strong> (25 percent crude<br />
protein) from as early as three days after stocking. This practice could be a costly mistake. In<br />
well-fertilized ponds supplementary feeding can be delayed <strong>for</strong> up to two months resulting<br />
in significant savings. As a result <strong>of</strong> inappropriate feed <strong>and</strong> fertilization regimes, pond yields<br />
are generally low, ranging from 2.5–6.0 tonnes/ha/production cycle (7–10 months).<br />
The commercial aquafeed industry in Egypt is growing at a rapid rate. Current<br />
production is about 250 000 tonnes/year, which is about 10 percent <strong>of</strong> the total animal<br />
feed production in Egypt. It is expected that the annual production <strong>of</strong> aqua<strong>feeds</strong> will<br />
increase to 1.2 million tonnes/year within 10 years. Compressed (sinking) pellets, with<br />
a crude protein content <strong>of</strong> 25 percent, comprise the bulk <strong>of</strong> the aqua<strong>feeds</strong> produced<br />
in Egypt. Extrusion technology <strong>for</strong> making floating pellets was introduced in the mid<br />
1990s, <strong>and</strong> the market <strong>for</strong> extruded <strong>feeds</strong> is growing. In contrast, farm-made <strong>feeds</strong> are<br />
rarely used by the Egyptian fish farmers.<br />
The main constraints faced by the farmers <strong>and</strong> the aquafeed industry include, among<br />
others, the escalating price <strong>of</strong> ingredients, high customs tariffs on feed ingredients, poor<br />
h<strong>and</strong>ling <strong>and</strong> storage <strong>of</strong> feed ingredients <strong>and</strong> finished <strong>feeds</strong>, small-scale farmers are unable<br />
to access finance, the need <strong>for</strong> extension services <strong>and</strong> limited research on fish nutrition,<br />
feeding <strong>and</strong> pond fertilization. Recommendations to address these problems are provided<br />
to assist farmers <strong>and</strong> aquafeed producers to use the available resources in the most<br />
<strong>sustainable</strong> manner <strong>and</strong> to assist decision makers to adopt best management practices <strong>for</strong><br />
<strong>sustainable</strong> aquaculture development in the country.
Analysis <strong>of</strong> <strong>feeds</strong> <strong>and</strong> <strong>fertilizers</strong> <strong>for</strong> <strong>sustainable</strong> aquaculture development in Egypt 403<br />
1. INTRODUCTION<br />
Fish culture has been practiced in Egypt since 2500 B.C. (Bardach, Ryther <strong>and</strong><br />
McLarney, 1972). The country has about 80 000 ha <strong>of</strong> brackish-water <strong>and</strong> freshwater<br />
bodies in addition to coastlines <strong>of</strong> about 1000 km each on the Mediterranean Sea <strong>and</strong><br />
the Red Sea (Figure 1). These aquatic resources are ample <strong>for</strong> the sector to exp<strong>and</strong><br />
substantially in future. Between 1995 <strong>and</strong> 2004, total fish production in Egypt increased<br />
by 115 percent from 407 000 to 865 029 (Figure 2). In recent years the Egyptian<br />
government has paid particular attention to the aquaculture industry <strong>and</strong>, as a<br />
result, production has increased from 15 000 tonnes in 1984 (9.8 percent <strong>of</strong> total fish<br />
production) to 471 535 tonnes in 2004 (54.5 percent <strong>of</strong> total fish production). During<br />
the same period, capture fisheries only grew by 13.9 percent, from 345 400 tonnes to<br />
393 494 tonnes <strong>and</strong> over the last five years (2000–2004) capture fisheries have remained<br />
more or less static (Figure 2).<br />
The success or failure <strong>of</strong> aquaculture depends mainly<br />
on the availability <strong>and</strong> accessibility <strong>of</strong> energy inputs,<br />
including <strong>feeds</strong> <strong>and</strong> fertilizer resources. This means that the<br />
availability <strong>of</strong> as much in<strong>for</strong>mation as possible on the source,<br />
nature, quantity, quality, prices, seasonality, production,<br />
import, export, manufacturers, <strong>and</strong> distribution <strong>of</strong> feed <strong>and</strong><br />
fertilizer among the various users is vitally important <strong>for</strong><br />
the <strong>sustainable</strong> development <strong>of</strong> the sector.<br />
This study reviews the current status <strong>and</strong> trends <strong>of</strong><br />
feed <strong>and</strong> fertilizer use in Egyptian aquaculture. First-h<strong>and</strong><br />
in<strong>for</strong>mation was obtained by interviewing farmers <strong>and</strong><br />
industry representatives <strong>and</strong> by way <strong>of</strong> a questionnaire<br />
that was distributed among fish farmers <strong>and</strong> aquafeed<br />
manufactures.<br />
2. AQUACULTURE PRACTICES AND FARMING<br />
SYSTEMS<br />
Aquaculture in Egypt consists <strong>of</strong> extensive, semi-intensive<br />
<strong>and</strong> intensive farming systems. Fish farms are distributed<br />
throughout the Nile Delta region <strong>and</strong> concentrated mainly<br />
in the Northern Lakes areas (Figure 3).<br />
The following sections briefly describe<br />
the major farming systems <strong>and</strong> production<br />
technologies <strong>and</strong> Table 1 summarizes the<br />
in<strong>for</strong>mation.<br />
2.1 Extensive culture<br />
Traditional extensive farming systems are<br />
characterized by low level <strong>of</strong> intervention,<br />
limited use <strong>of</strong> inputs, low capital investment<br />
<strong>and</strong> poor management. These farms were<br />
constructed by rein<strong>for</strong>cing embankments<br />
<strong>of</strong> natural enclosures, like lagoons, rivers<br />
<strong>and</strong> lakes. The size <strong>of</strong> these enclosures<br />
(hosha) vary from 1–20 ha. Fish (mainly<br />
tilapia) are trapped in the hosha <strong>and</strong> rely<br />
on natural food. The net yield from these<br />
systems is low <strong>and</strong> varies from 250–750<br />
kg/ha. This <strong>for</strong>m <strong>of</strong> aquaculture has been<br />
a traditional practice in the northern lakes<br />
)<br />
s<br />
e<br />
n<br />
n<br />
o<br />
t<br />
d<br />
n<br />
a<br />
s<br />
u<br />
o<br />
h<br />
t<br />
(<br />
n<br />
o<br />
i<br />
t<br />
c<br />
u<br />
d<br />
o<br />
r<br />
P<br />
1000<br />
800<br />
600<br />
400<br />
200<br />
0<br />
FIGURE 1<br />
Aquatic resources <strong>of</strong> Egypt<br />
Source: Modified from Hamza (1996)<br />
FIGURE 2<br />
Fish production in Egypt during 1995–2004<br />
Fisheries<br />
Aquaculture<br />
Total<br />
1995 1996 1997 1998 1999 2000 2001 2002 2003 2004<br />
Source: GAFRD (2005)<br />
Year
404<br />
<strong>Study</strong> <strong>and</strong> <strong>analysis</strong> <strong>of</strong> <strong>feeds</strong> <strong>and</strong> <strong>fertilizers</strong> <strong>for</strong> <strong>sustainable</strong> aquaculture development<br />
FIGURE 3<br />
Major aquaculture production regions in Egypt<br />
region <strong>for</strong> many years. The practice<br />
has recently been prohibited,<br />
because <strong>of</strong> the destructive effects on<br />
lake fisheries <strong>and</strong> the environment.<br />
However, hosha culture is still<br />
illegally practiced in some areas<br />
<strong>and</strong> the production from these<br />
systems is generally not captured in<br />
aquaculture production statistics.<br />
2.2 Semi-intensive earthen<br />
pond culture<br />
Semi-intensive fish culture<br />
in earthen ponds is, by far, the<br />
most important farming system<br />
in Egypt. About 86 percent <strong>of</strong><br />
aquaculture production is obtained<br />
from these systems. Semi-intensive<br />
fish production has increased from<br />
182 000 tonnes in 1999 to 401 765<br />
tonnes in 2004 (Table 2), although the proportion as a percent <strong>of</strong> total aquaculture<br />
production has remained fairly stable at 87.7–90.5 percent over the same period. Pond<br />
culture is practiced mainly by the private sector <strong>and</strong> consists <strong>of</strong> many small-, medium-<br />
<strong>and</strong> large-scale farms. The private sector produced 464 320 tonnes in 2004 (98.5 percent<br />
<strong>of</strong> total pond production), whereas the government farms produced 7 183 tonnes<br />
(1.5 percent).<br />
Source: Modified from Hamza (1996)<br />
TABLE 1<br />
An overview <strong>of</strong> freshwater <strong>and</strong> brackish-water aquaculture systems in Egypt, 2005<br />
System Culture species<br />
Extensive<br />
Polyculture Tilapia, mullets,<br />
seabream,<br />
seabass, carps,<br />
catfish<br />
Semi-intensive<br />
1. Polyculture<br />
in brackishwater<br />
pond<br />
Tilapia,<br />
mullets, carps<br />
2. Monoculture Tilapia (mainly<br />
all-male)<br />
Intensive culture<br />
Monoculture Tilapia (mainly<br />
all-male)<br />
Polyculture Tilapia + grey<br />
mullets<br />
Cage culture Tilapia (mainly<br />
all-male)<br />
CP = crude protein<br />
Source: author’s field survey<br />
Stocking<br />
density<br />
(fish/ha)<br />
Natural<br />
populations<br />
15 000–<br />
30 000<br />
15 000–<br />
30 000<br />
50 000–<br />
100 000<br />
Stocking<br />
ratio<br />
Size <strong>of</strong><br />
pond<br />
(ha)<br />
Varies 5 to over<br />
40<br />
Fertilization <strong>and</strong><br />
feeding<br />
Depends mainly on<br />
available natural food,<br />
without fertilization<br />
Varies 0.5–13.0 2–5 tonnes poultry<br />
manure + 29 kg super<br />
phosphate + 18 kg<br />
urea/ ha; 25% CP feed<br />
0.5–2.0 2–5 tonnes poultry<br />
manure + 29 kg super<br />
phosphate + 18 kg<br />
urea/ ha; 25% CP feed<br />
0.25–0.50 35–40% CP <strong>feeds</strong> at<br />
the beginning, reduced<br />
to 25% CP during<br />
fattening<br />
50 000 3:1 0.5–1.0 36% CP <strong>feeds</strong> at the<br />
beginning, reduced<br />
to 25% CP during<br />
fattening.<br />
60–100<br />
fish/m 3<br />
32–<br />
600 m 3<br />
35–40% CP feed at the<br />
beginning, reduced<br />
to 25–30% CP during<br />
fattening.<br />
Rearing<br />
period<br />
(months)<br />
Harvest<br />
size (g)<br />
Total yield<br />
(tonnes/ha)<br />
9–14 varies 0.25–0.75<br />
7–12 200–300<br />
100–200<br />
200–500<br />
5–10<br />
7–9 200–400 5–10<br />
7–10 200–400 15–25<br />
9–12 200–300 15–20<br />
8–14 300–400 25–35 kg/m 3
Analysis <strong>of</strong> <strong>feeds</strong> <strong>and</strong> <strong>fertilizers</strong> <strong>for</strong> <strong>sustainable</strong> aquaculture development in Egypt 405<br />
TABLE 2<br />
Aquaculture production (thous<strong>and</strong> tonnes) in different production systems from 1999–2004<br />
Production system 1999 2000 2001 2002 2003 2004<br />
Rice field 10.0 16.4 18.4 16.3 17.0 17.3<br />
Cage 12.9 16.1 23.7 28.2 32.1 50.4<br />
Pond 182.0 307.6 300.8 331.8 396.1 403.8<br />
Total 204.9 340.1 342.9 376.3 445.2 471.5<br />
Source: GAFRD (2005)<br />
TABLE 3<br />
Aquaculture production (tonnes) by species <strong>and</strong> production systems in 2004<br />
Production system<br />
Species<br />
FW pond1 BW pond2 Rice field Cage<br />
Fish ponds vary in size from 0.5–13.0 ha<br />
with a depth <strong>of</strong> 50–150 cm <strong>and</strong> are stocked<br />
at a density <strong>of</strong> 15 000–30 000 fish/ha. Nile<br />
tilapia (Oreochromis niloticus), mullets<br />
(Mugil cephalus <strong>and</strong> Liza ramada) <strong>and</strong> carp<br />
(big head carp, silver carp <strong>and</strong> black carp) are<br />
the major culture species, although tilapia<br />
<strong>and</strong> mullet represent 75 to over 90 percent <strong>of</strong><br />
the fish in most <strong>of</strong> the farms in the northern<br />
Delata lakes, particularly in Kafr El-Shaikh,<br />
Edku, Maadia <strong>and</strong> Borollus regions. Many<br />
farmers in the Central Delta <strong>and</strong> in Upper<br />
Egypt practice polyculture <strong>of</strong> tilapia <strong>and</strong><br />
carp. Carp is generally not farmed under<br />
monoculture conditions. The contribution by other species, such as seabream, seabass<br />
<strong>and</strong> clariid catfish is minor (Tables 3 <strong>and</strong> 4). Marine fish such as seabream <strong>and</strong> seabass<br />
are cultured in brackish-water ponds under polyculture conditions with mullet, mainly<br />
in Domiat. The ponds used <strong>for</strong> polyculture <strong>of</strong> marine fish are generally large (8–20 ha<br />
each) <strong>and</strong> the fish are stocked at relatively low densities (2 500 fish/ha) at a ratio <strong>of</strong> 6:3:1<br />
(seabass: seabream: mullet, respectively).<br />
Brackish-water <strong>and</strong> freshwater ponds are generally constructed in depressed irrigated<br />
l<strong>and</strong>s or saline l<strong>and</strong>s. Substantial areas <strong>of</strong> inl<strong>and</strong> lakes, particularly in the northern<br />
Delta lakes <strong>and</strong> Maryut Salt Valley near Alex<strong>and</strong>ria are also enclosed <strong>and</strong> trans<strong>for</strong>med<br />
into production ponds in which fish are produced under semi-intensive, polyculture<br />
conditions. Semi-intensive, polyculture in earthen ponds is practiced mainly in brackishwater<br />
environments. In 2004, about 85 percent <strong>of</strong> total aquaculture production originated<br />
from brackish-water ponds, while the remainder was produced in freshwater ponds,<br />
cages <strong>and</strong> rice fields (GAFRD, 2005).<br />
Production in semi-intensive systems varies from 5–10 tonnes/ha/production<br />
cycle (7–12 months). Monoculture <strong>of</strong> Nile tilapia is also practiced semi-intensively in<br />
many areas (particularly where consumer dem<strong>and</strong> <strong>for</strong> carp is low). During the period<br />
Total<br />
% <strong>of</strong> total<br />
production<br />
Nile tilapia 1 920 176 863 20 255 199 038 42.20<br />
Common carp 17 203 17 203 3.60<br />
Mullets (two species) 132 651 132 651 28.10<br />
Carps (bighead, silver <strong>and</strong> black) 87 674 30 148 117 822 25.00<br />
Gilthead seabream 2 465 2 465 0.52<br />
European seabass 1 812 1 812 0.38<br />
African catfish (Clarias sp.) 160 299 459 0.10<br />
Bayad (Bagrus spp.) 85 0.02<br />
Total 2 080 401 850 17 203 50 403 471 545 100<br />
1 Freshwater intensive pond; 2 brackish-water semi-intensive pond<br />
Source: GAFRD (2005)<br />
TABLE 4<br />
Proportion (%) <strong>of</strong> total production <strong>of</strong> each species in<br />
2004 by farming system<br />
Species<br />
Semi-intensive<br />
system<br />
Intensive<br />
system<br />
Nile tilapia 37.5 4.72<br />
Common carp (in rice field) 3.65 -<br />
Mullet 28.1 -<br />
Carps (bighead, silver <strong>and</strong> black) 18.6 6.43<br />
Gilthead seabream 0.52 -<br />
European seabass 0.38 -<br />
African catfish 0.1 -<br />
Total 88.85 11.15<br />
Source: calculated based on total production
406<br />
<strong>Study</strong> <strong>and</strong> <strong>analysis</strong> <strong>of</strong> <strong>feeds</strong> <strong>and</strong> <strong>fertilizers</strong> <strong>for</strong> <strong>sustainable</strong> aquaculture development<br />
TABLE 5<br />
Enterprise budget in US$ <strong>for</strong> a 10-ha semi-intensive pond culture farm in Egypt, 2005<br />
Item<br />
Receipts<br />
Quantity Unit cost Cost (US$/ha) Cost (US$/10 ha)<br />
Total income<br />
Variable costs<br />
6 1 230 7 380 73 800<br />
Feed (tonnes) 12 234 2 808 28 080<br />
Seed (x1000 fish) 25 10 250 2 500<br />
Fertilizer (tonnes) 3 20 60 600<br />
Labour (US$/person/cycle) 2 200 200 2 000<br />
Miscellaneous cost (electricity, water,<br />
transportation, gas, etc)<br />
Fixed costs<br />
600 600 6 000<br />
Pond rental 400 400 4 000<br />
Total cost 4 318 43 180<br />
Returns to risk <strong>and</strong> management 3 062 30 620<br />
Source: author’s field survey<br />
1999–2004, the average production in semi-intensive pond culture has increased from<br />
4 to 6 tonnes /ha/year (GAFRD, 2005).<br />
The cost <strong>of</strong> labour in semi-intensive aquaculture varies between regions. In Kafr El-<br />
Shaikh <strong>and</strong> Behaira, a 10-ha farm requires 2 permanent workers, with a monthly salary<br />
<strong>of</strong> about US$50 per person (US$800–1 000 per 8–10 month cycle) plus an additional<br />
cost <strong>of</strong> about US$100–120/ha <strong>for</strong> crop harvesting <strong>and</strong> other seasonal works. Thus, the<br />
total labour cost is about US$180–220 US$/ha/cycle (average cost is about US$200). An<br />
average budget <strong>for</strong> a 10-ha semi-intensive pond farm is summarized in Table 5.<br />
2.3 Intensive cage culture<br />
Cage culture is rapidly developing, particularly in the Domiat <strong>and</strong> Rashid (Rosetta)<br />
branches <strong>of</strong> the Nile River <strong>and</strong> in the northern Delta lakes region (Lake Manzala <strong>and</strong><br />
Lake Borullos) (Figure 4). Production from cages has increased from 12 900 tonnes in<br />
1999 to 50 403 tonnes in 2004, <strong>and</strong> now contributes 10.6 percent <strong>of</strong> total aquaculture<br />
production. Nile tilapia is the principal cage culture species. The sizes <strong>of</strong> the cages vary<br />
from small cages <strong>of</strong> around 32 m 3 to larger cages <strong>of</strong> around 600 m 3 .<br />
In the larger cages (10x10x6 m), tilapia fingerlings (1–10 g) are stocked at 80–<br />
100 fish/m 3 <strong>and</strong> are initially fed with 35–40 percent CP pellets <strong>and</strong> then switched over<br />
to a 25–30 percent CP pellet <strong>for</strong> the fattening period, either manually or with automatic<br />
feeders. After 10–14 months the fish reach an average weight <strong>of</strong> 400 g <strong>and</strong> the final<br />
biomass at the end <strong>of</strong> the production cycle is around 35 kg/m 3 . Some farmers stock<br />
their cages with larger fish (40–60 g) <strong>and</strong> in this way are able to reduce the production<br />
cycle to 6–8 months.<br />
FIGURE 4<br />
Culture <strong>of</strong> Nile tilapia in cages in Rashid (Rosetta) branch <strong>of</strong> the Nile River, near Rashid (left) <strong>and</strong> in small<br />
cages (2–4 m 3 ) suspended in a drainage canal in a rural area in Behaira Governorate (right)
Analysis <strong>of</strong> <strong>feeds</strong> <strong>and</strong> <strong>fertilizers</strong> <strong>for</strong> <strong>sustainable</strong> aquaculture development in Egypt 407<br />
Smaller cages (2–4 m 3 ) suspended in drainage canals are also used in rural areas.<br />
Stocking densities are lower (20–40 fish/m 3 ) <strong>and</strong> agricultural by-products <strong>and</strong> kitchen<br />
wastes are provided as feed. Production in these cages is low (5–10 kg/m 3 ) but it is still<br />
pr<strong>of</strong>itable because <strong>of</strong> the low capital <strong>and</strong> input costs.<br />
The Egyptian government has recently adopted a policy to promote cage culture <strong>of</strong><br />
tilapia. The “Social Development Fund” <strong>and</strong> the Agricultural Development <strong>and</strong> Credit<br />
Bank provide loans <strong>for</strong> tilapia cage culture enterprises to new university graduates<br />
who can not find jobs within the public or private sector. The government funds the<br />
feasibility study (free <strong>of</strong> charge), assists in the construction <strong>of</strong> cages, site selection,<br />
<strong>and</strong> sometimes provides seed at a subsidised price. Production <strong>for</strong>m theses cages<br />
(6x6x2 m) range <strong>for</strong>m 1.5–2.0 tonnes/6–8 month cycle. This programme has been very<br />
successful.<br />
2.4 Intensive pond culture<br />
Intensive pond culture is also developing in many areas in Egypt, especially in the<br />
newly reclaimed agricultural l<strong>and</strong>s in the desert. Nile tilapia (mainly monosex) is the<br />
major cultured species in intensive systems. All male tilapia are produced through oral<br />
administration <strong>of</strong> 17α-methyltestosterone. In these systems fish are stocked at 50 000–<br />
100 000 fish/ha <strong>and</strong> fed with commercial <strong>feeds</strong> (25–30 percent CP) <strong>and</strong> reach 200–>400 g<br />
in 7–10 months. Some farmers feed the fish with 35–40 percent CP <strong>feeds</strong> at the beginning<br />
<strong>and</strong> then switch to a 25 percent CP pellet during the grow-out stage.<br />
Intensive polyculture using Nile tilapia <strong>and</strong> mullet (Mugil cephalus <strong>and</strong> Liza ramada)<br />
is practiced in Kafr El-Shaikh. Fish are stocked at about 50 000 fish/ha (37 000 tilapia <strong>and</strong><br />
13 000 mullet) <strong>and</strong> fed on commercial pellets. The fish attain 200–300 g after 9–12 months<br />
<strong>and</strong> production ranges from 15–20 tonnes/ha.<br />
2.5 Integrated aquaculture<br />
Rice is widely cultivated in Egypt <strong>and</strong> integrated rice/fish farming has attracted the<br />
attention <strong>of</strong> many rice farmers in recent years. Fish production (mainly common carp)<br />
in rice fields has increased from 10 000 tonnes in 1999 to 17 203 tonnes in 2004 at annual<br />
average yields <strong>of</strong> 300–500 kg/ha (GAFRD, pers. comm.)<br />
In the Kafr El-Sheik Governorate 1 some farmers practice integrated wheat <strong>and</strong><br />
alfalfa/fish farming, by planting wheat <strong>and</strong>/or alfalfa in their ponds in winter <strong>and</strong><br />
flooding them in spring. The crops are not harvested <strong>and</strong> let to rot in the ponds<br />
providing nutrients <strong>for</strong> fish production. However, more research is needed to<br />
investigate this practice.<br />
3. AQUACULTURE FEEDS AND FEEDING<br />
3.1 Major feed ingredients<br />
Fishmeal<br />
Both local <strong>and</strong> imported fishmeal is widely used in aqua<strong>feeds</strong> in Egypt. Fishmeal is<br />
imported from Denmark, Peru, Chile, Argentina, Norway, Japan, Morocco <strong>and</strong> Yemen.<br />
Imported fishmeal contains 60–72 percent crude protein. Several factors constrain the<br />
use <strong>of</strong> imported fishmeal <strong>and</strong> these include:<br />
• the price <strong>of</strong> imported fish meal (65–68 percent CP) has increased from US$591/<br />
tonne in 1996 to US$720 in 2004, although this was mainly due to the sharp decline<br />
in the value <strong>of</strong> the Egyptian pound against the US$;<br />
• the increasing dem<strong>and</strong> <strong>for</strong> fishmeal by aquafeed manufacturers, coupled with<br />
shortages on the international market has led to intense competition within the animal<br />
feed industry. The rapid expansion <strong>of</strong> the aquafeed industry in Egypt will intensify the<br />
competition <strong>for</strong> fishmeal <strong>and</strong> this may lead to further price increases; <strong>and</strong><br />
3 Governorates are the administrative divisions in Egypt. Egypt consists <strong>of</strong> 26 governorates.
408<br />
<strong>Study</strong> <strong>and</strong> <strong>analysis</strong> <strong>of</strong> <strong>feeds</strong> <strong>and</strong> <strong>fertilizers</strong> <strong>for</strong> <strong>sustainable</strong> aquaculture development<br />
• the quality <strong>of</strong> fishmeal is <strong>of</strong>ten affected by transportation, inadequate storage<br />
facilities <strong>and</strong> distribution.<br />
Local production <strong>of</strong> fishmeal is negligible. The annual production by a single producer<br />
is 200–400 tonnes (Edfina Preserved Foods Company, pers. comm.) <strong>and</strong> crude protein<br />
content ranges <strong>for</strong>m
Analysis <strong>of</strong> <strong>feeds</strong> <strong>and</strong> <strong>fertilizers</strong> <strong>for</strong> <strong>sustainable</strong> aquaculture development in Egypt 409<br />
TABLE 6<br />
Production (thous<strong>and</strong> tonnes) <strong>of</strong> major agricultural crops during 1999–2005<br />
Crop 1999 2000 2001 2002 2003 2004 2005<br />
Wheat 6 564 6 564 6 255 6 625 6 845 7 180 8 144<br />
Rice 5 816 6 001 5 227 6 105 6 175 6 351 6 124<br />
Maize 5 437 5 650 6 094 5 677 5 682 5 842 NA*<br />
Kidney bean 307 354 440 401 337 331 282<br />
Sugar beet 2 560 2 890 2 858 3 168 2 692 2 861 3 430<br />
Sugar cane 15 254 12 697 15 572 16 030 16 246 16 335 16 317<br />
Vegetables1 11 963 13 133 12 709 12 561 14 364 13 367 NA*<br />
Cotton 439 483 457 483 481 637 522<br />
Soybean 19.0 11.0 14.9 17.7 28.7 43.4 25.8<br />
Sunflower 20 30 44.1 35.0 31.6 44.3 30.4<br />
Peanut 2 407 2 496 2 734 2 547 2 611 2 552 2 658<br />
Flax seed 10.3 10.9 16.9 19.9 29.0 39.4 14.6<br />
1includes tomato, potato, marrow, haricot, kidney bean, pea, cabbage, aubergine, green pepper, okra, sweet<br />
potato, lettuce, carrot, cantaloupe <strong>and</strong> strawberry.<br />
*Not available<br />
Source: MALR (2006)<br />
TABLE 7<br />
Production <strong>of</strong> major feed ingredients in Egypt in<br />
2004<br />
Production<br />
Value<br />
Ingredient<br />
(thous<strong>and</strong><br />
(thous<strong>and</strong> US$)<br />
tonnes)<br />
Wheat bran<br />
In 2004, Egypt produced 7.2 million<br />
tonnes <strong>of</strong> wheat. In addition some<br />
6.5 million tonnes were imported<br />
from the United States <strong>of</strong> America,<br />
Argentina, Australia <strong>and</strong> France.<br />
Wheat bran production in 2004<br />
amounted to some 2 million tonnes<br />
(Table 7). Wheat bran is the most<br />
commonly used energy source<br />
in animal <strong>feeds</strong> <strong>and</strong> in 2003 some<br />
704 263 <strong>and</strong> 3 991 tonnes were<br />
used <strong>for</strong> cattle <strong>and</strong> poultry <strong>feeds</strong>,<br />
respectively.<br />
Fishmeal
410<br />
<strong>Study</strong> <strong>and</strong> <strong>analysis</strong> <strong>of</strong> <strong>feeds</strong> <strong>and</strong> <strong>fertilizers</strong> <strong>for</strong> <strong>sustainable</strong> aquaculture development<br />
TABLE 8<br />
Imports <strong>and</strong> exports <strong>of</strong> major food/feed commodities in 2004<br />
Commodity<br />
Quantity<br />
(tonnes)<br />
Value<br />
(thous<strong>and</strong> US$)<br />
Unit value<br />
(US$/tonne)<br />
Imports<br />
Wheat 4 366 842 727 652 170<br />
Yellow corn 2 429 279 364 817 150<br />
Soybean 214 893 64,508 300<br />
Soybean cake 712 459 214 374 300<br />
Broad (kidney) bean, dry 314,003 93,255 300<br />
Lentils 88,937 43,901 500<br />
Sesame seed 32 095 27 232 850<br />
Sunflower seed oil 115 503 72 461 630<br />
Soybean oil 91 702 55 622 610<br />
Fish oil (2005) 620 16 000 9 920<br />
Vegetable oils 875 169 360 560 421<br />
Fishmeal 15 217 9 118 600<br />
Meat meal 92 534 30 455 330<br />
Cattle <strong>of</strong>fal 13,754 16,826 1 220<br />
Beef <strong>and</strong> veal, boneless<br />
Exports<br />
102 386 180 758 1 770<br />
Molasses 406 870 41 279 100<br />
Hydrogenated oils 17 103 13 528 790<br />
Vegetable oils 12 547 10 057 802<br />
Source: FAO (2007)<br />
were produced (Table 7). Because <strong>of</strong><br />
the downturn in cotton production,<br />
Egypt has had to import large volumes<br />
<strong>of</strong> plant oils. In 2004, some 115 503<br />
tonnes <strong>of</strong> sunflower oil, 91 702 tonnes<br />
<strong>of</strong> soybean oil <strong>and</strong> 875 169 tonnes<br />
<strong>of</strong> vegetable oils were imported<br />
(Table 8). Plant oils are used mainly<br />
<strong>for</strong> human consumption, while only<br />
a small amount (about 125 tonnes) is<br />
used by the aquafeed industry. Fish<br />
oil is not widely used in animal feed<br />
<strong>and</strong> aqua<strong>feeds</strong> in Egypt due to its high<br />
costs. Only about 15–20 tonnes <strong>of</strong> fish<br />
oil are locally produced. However,<br />
imported fish oil has jumped from<br />
24 tonnes in 2003 to 620 tonnes in<br />
2005 (Table 8).<br />
Vitamins <strong>and</strong> minerals<br />
Vitamins <strong>and</strong> mineral mixtures are<br />
mainly imported <strong>for</strong> livestock <strong>and</strong><br />
poultry feed manufacturing. A number <strong>of</strong> national factories are currently producing<br />
vitamin <strong>and</strong> mineral premixes <strong>for</strong> fish <strong>and</strong> crustaceans. No data is available on the<br />
imports <strong>of</strong> vitamins <strong>and</strong> minerals<br />
Additives<br />
Feed additives, including binders, antioxidants, antibiotics, mould inhibitors, enzymes,<br />
<strong>and</strong> chemo-attractants have become essential components in animal <strong>and</strong> aqua<strong>feeds</strong>. All<br />
are readily available but expensive <strong>and</strong> their use in animal <strong>and</strong> aqua<strong>feeds</strong> in Egypt is<br />
limited.<br />
Nutritional composition<br />
The proximate analyses <strong>of</strong> the major ingredients that are commonly used as <strong>feeds</strong> or<br />
feed ingredients in aquaculture are presented in Table 9.<br />
3.2 Fertilizer resources<br />
Organic <strong>fertilizers</strong><br />
Livestock dung <strong>and</strong> poultry droppings are the main sources <strong>of</strong> organic fertilizer in<br />
Egypt. Livestock manure production (excluding poultry droppings) has increased<br />
from 222 million cubic metres (on a wet weight basis) in 1996 to about 300 million<br />
cubic metre in 2004. During the same period, poultry manure production has increased<br />
from about 1.6 million cubic metres (about one million tonnes) to over 2 million<br />
tonnes. It should be noted that a considerable proportion <strong>of</strong> livestock <strong>and</strong> poultry is<br />
raised by villagers, which is not recorded in the <strong>of</strong>ficial statistics.<br />
Inorganic <strong>fertilizers</strong><br />
Between 1996/7 <strong>and</strong> 2004/5, production <strong>of</strong> inorganic <strong>fertilizers</strong> increased from 3.96 to<br />
11.9 million tonnes (Ministry <strong>of</strong> Investment, pers. comm., 2005). Fertilizer production<br />
<strong>and</strong> consumption is summarized in Table 10. There are six fertilizer factories in Egypt<br />
<strong>and</strong> production exceeds national dem<strong>and</strong>. Despite the production <strong>of</strong> nitrogenous<br />
<strong>fertilizers</strong> in excess <strong>of</strong> dem<strong>and</strong>, there is an annual shortfall during the summer (May to<br />
July) <strong>and</strong> this is due to the requirements <strong>for</strong> sugar cane, maize <strong>and</strong> cotton farming.
Analysis <strong>of</strong> <strong>feeds</strong> <strong>and</strong> <strong>fertilizers</strong> <strong>for</strong> <strong>sustainable</strong> aquaculture development in Egypt 411<br />
TABLE 9<br />
Chemical composition (percent as fed basis) <strong>of</strong> feed ingredients commonly used in animal <strong>and</strong><br />
fish <strong>feeds</strong><br />
Ingredient Moisture<br />
Crude<br />
protein<br />
3.3 Agricultural calendar<br />
Underst<strong>and</strong>ing the agricultural farming calendar is crucial <strong>for</strong> aquaculture practices in<br />
general <strong>and</strong> the aquafeed industry in particular. The agricultural cycle in Egypt includes<br />
two major cropping seasons; summer crops <strong>and</strong> winter crops. A third minor season is<br />
also exists <strong>and</strong> known as “Nile crops”. Nile crops are generally summer crops, but the<br />
cultivation starts in mid/late summer. The agricultural calendar <strong>for</strong> Egypt is presented<br />
in Table 11.<br />
Crude<br />
lipid<br />
Crude<br />
fibre<br />
NFE Ash<br />
Plants <strong>and</strong> plant by-products<br />
Green roughages<br />
Alfalfa (first cut) 86.2 2.1 0.7 2.4 5.9 2.7<br />
Alfalfa (second cut) 85.5 1.9 0.4 3.8 6.4 2.0<br />
Alfalfa (third cut) 73.4 3.7 0.6 7.5 11.5 3.3<br />
Corn plant 78.7 1.5 0.5 4.4 12.7 2.2<br />
Sudan grass (first cut) 85.1 1.3 0.4 4.4 7.2 1.7<br />
Sudan grass (second cut) 71.2 2.6 0.8 7.0 15.2 3.2<br />
Sweet corn (first cut) 92.5 0.6 0.2 2.1 3.8 0.8<br />
Sweet corn (second cut) 77.0 1.9 0.6 5.5 12.7 2.4<br />
Sugarcane leaves<br />
Dry <strong>for</strong>ages<br />
71.1 1.3 0.2 7.7 15.5 4.1<br />
Alfalfa hay (first cut) 9.1 7.0 0.3 27.7 43.2 12.7<br />
Alfalfa hay (third cut) 10.5 10.0 1.9 27.4 40.5 9.7<br />
Wheat straw 10.2 4.2 1.9 22.2 45.5 16.0<br />
Barely straw 10.2 4.1 1.5 21.8 44.1 18.2<br />
Beans straw 13.9 4.0 0.6 19.0 51.3 11.3<br />
Corn cobs<br />
Grains <strong>and</strong> legumes<br />
11.3 2.4 0.3 31.4 51.8 2.9<br />
Wheat 11.1 8.3 1.8 3.8 73.3 1.8<br />
White corn 10.3 9.1 4.8 7.2 67.1 1.4<br />
Yellow corn 7.9 8.3 2.9 2.1 82.5 2.1<br />
Sorghum 11.0 9.2 4.2 2.9 82.7 1.2<br />
Barely 13.2 10.1 1.6 8.2 77.1 3.0<br />
Kidney beans 9.8 28.0 1.0 5.7 50.7 5.5<br />
Soybean meal 13.5 45.5 16.9 7.5 24.6 5.5<br />
Cotton seed meal (with hulls) 7.5 27.1 8.5 21.4 27.2 6.9<br />
Cotton seed meal (without hulls) 7.1 44.4 10.1 5.2 25.7 7.5<br />
Sesame seeds (with hulls) 9.0 30.2 14.4 18.0 20.1 17.4<br />
Lentil seed cake 18.5 13.3 10.7 7.1 35.2 7.5<br />
Rice, broken, polished 9.2 11.0 7.8 1.1 75.9 4.2<br />
Rice bran 10.5 13.0 12.1 10.3 57.2 7.5<br />
Wheat bran, coarse 12.0 11.1 3.6 17.8 63.8 4.3<br />
Wheat bran, fine 12.0 17.1 3.0 9.4 65.5 4.5<br />
Corn gluten 5.9 43.9 3.2 4.4 44.0 3.7<br />
Sugarcane bagasse<br />
Animal by-products<br />
3.2 1.3 0.4 51.1 44.5 2.7<br />
Blood meal 9.3 81.2 1.0 - - 5.3<br />
Broken eggs 4.2 34.7 15.0 - - 25.5<br />
Fishmeal (local) 10.3 65.3 10.5 - - 16.7<br />
Fishmeal (imported) 9.0 70.0 6.1 - - 11.6<br />
Animal gelatine 11.4 85.7 3.1 - - -<br />
Meat <strong>and</strong> bone meal 4.6 61.8 6.0 - - 26.0<br />
Poultry by-product meal 13.0 53.9 23.0 - - 18.2<br />
Shrimp meal (local) 12.7 51.7 5.6 - - 26.9<br />
NFE = nitrogen free extract<br />
Source: modified from El-Sayed (1999)
412<br />
<strong>Study</strong> <strong>and</strong> <strong>analysis</strong> <strong>of</strong> <strong>feeds</strong> <strong>and</strong> <strong>fertilizers</strong> <strong>for</strong> <strong>sustainable</strong> aquaculture development<br />
TABLE 10<br />
Production, consumption, average local sale prices <strong>and</strong> export <strong>of</strong> inorganic <strong>fertilizers</strong> in Egypt<br />
in 2004/2005<br />
Fertilizers<br />
Production<br />
(tonnes)<br />
Domestic<br />
consumption<br />
(tonnes)<br />
Average<br />
price<br />
(US$/tonne)<br />
Export<br />
(tonnes)<br />
Nitrogenous<br />
Urea (46.5% N) 2 390 620 1 707 230 90 663 588<br />
Ammonium nitrate (33.5% N) 1 301 999 1 302 904 91 1600<br />
Ammonium sulphate (20.6% N) 112 507 121 139 84 -<br />
Subtotal based on 15.5% N<br />
Phosphates<br />
10 135 383 8 098 641 1 994 222<br />
Super phosphate<br />
(15% P)<br />
1 360 464 1 160 024 76 191 075<br />
Triple super phosphate (37% P) 33 619 8715 141 26 401<br />
Subtotal based on 15% P 1 443 391 1 181 521 256 197<br />
Gr<strong>and</strong> total 11 578 774 9 280 162 2 250 419<br />
Source: Ministry <strong>of</strong> Investment (pers. comm.)<br />
TABLE 11<br />
Agricultural cycle <strong>and</strong> cropping areas (ha) by season in Egypt during 1999–2004<br />
Crops<br />
Farming<br />
period<br />
Major crops<br />
Winter crops Nov–May Wheat, alfalfa<br />
(barseem),<br />
kidney bean,<br />
barely, sugar<br />
beet, vegetables.<br />
Summer crops Mar/Apr–<br />
Sept<br />
Nile crops Jun–Oct<br />
Rice, maize,<br />
cotton, Sugar<br />
cane, soybean,<br />
vegetables.<br />
Maize, corn,<br />
vegetables.<br />
Cultivated area (thous<strong>and</strong> ha)<br />
1999 2000 2001 2002 2003 2004<br />
2 546 2 582 2 514 2 592 2 628 2 593<br />
2 445 2 399 2 506 2 543 2 777 2477<br />
249 259 246 253 259 255<br />
Total 5 240 5 240 5 266 5 388 5 664 5325<br />
Source: CAPMS (2006)<br />
4. THE USE OF FERTILIZERS IN AQUACULTURE<br />
4.1 Organic <strong>fertilizers</strong><br />
Semi-intensive fish farming in Egypt depends exclusively on poultry manure <strong>for</strong> pond<br />
fertilization. Fish ponds are fertilized at a rate <strong>of</strong> 2–5 tonnes/ha. Generally, manure is<br />
applied prior to fish stocking (<strong>and</strong> seldom afterwards). There are no accurate records<br />
<strong>of</strong> the total amount <strong>of</strong> organic <strong>fertilizers</strong> used in aquaculture. Given that there are<br />
approximately 42 000 ha <strong>of</strong> fish ponds in Egypt it was calculated that between 70 000–<br />
200 000 tonnes <strong>of</strong> organic <strong>fertilizers</strong> are used annually <strong>for</strong> fish pond fertilization. This<br />
means that aquaculture annually uses about 3.5–10.0 percent <strong>of</strong> total poultry manure<br />
production. The volumes used are expected to increase as aquaculture exp<strong>and</strong>s <strong>and</strong> as<br />
farmers are educated in appropriate manuring practices. At present farmers use between<br />
1.7–4.8 tonnes/ha/production cycle <strong>and</strong> it is expected that this will increase to over<br />
10 tonnes/ha/production cycle in future.<br />
4.2 Inorganic fertilizer<br />
The use <strong>of</strong> inorganic <strong>fertilizers</strong> in Egyptian aquaculture is very limited. About 60 percent<br />
<strong>of</strong> the farmers interviewed use inorganic <strong>fertilizers</strong> (urea <strong>and</strong> super-phosphate) in<br />
addition to organic <strong>fertilizers</strong>, but only once at the beginning <strong>of</strong> the production cycle.<br />
Very few farmers apply inorganic <strong>fertilizers</strong> when natural pond productivity decreases.<br />
Super phosphate <strong>and</strong> urea are applied at 25–36 <strong>and</strong> 12–24 kg/ha, respectively. It is not<br />
known what quantities <strong>of</strong> inorganic fertilizer are used in aquaculture. Based on the<br />
available in<strong>for</strong>mation it was calculated that about 300–600 tonnes <strong>of</strong> urea <strong>and</strong> 625–900<br />
tonnes <strong>of</strong> super phosphate are currently used <strong>for</strong> pond fertilization, which if realistic,
Analysis <strong>of</strong> <strong>feeds</strong> <strong>and</strong> <strong>fertilizers</strong> <strong>for</strong> <strong>sustainable</strong> aquaculture development in Egypt 413<br />
equates to around 0.01 percent <strong>of</strong> the total <strong>fertilizers</strong> used by agriculture. It is unlikely<br />
that any competition will arise between agriculture <strong>and</strong> aquaculture.<br />
5. FARM MANAGEMENT AND FEEDING STRATEGIES<br />
Very little published in<strong>for</strong>mation is available on aquaculture management in Egypt in<br />
general, <strong>and</strong> feed management strategies in particular. The following section is based on<br />
in<strong>for</strong>mation obtained during interviews with fish farmers <strong>and</strong> feed manufacturers <strong>and</strong><br />
<strong>analysis</strong> <strong>of</strong> the data obtained from the questionnaires.<br />
5.1 Pond preparation <strong>and</strong> fertilization<br />
Despite the benefits, minimal attention is generally paid to pond preparation in Egypt,<br />
although most <strong>of</strong> the ponds are drained <strong>and</strong> remain dry <strong>for</strong> a long period (3–4 months<br />
after fish harvesting). The majority <strong>of</strong> pond fish farmers harvest their fish in early winter<br />
<strong>and</strong> the ponds remain dry from about December/January to April. In most instances<br />
the pond soil is not tilled <strong>and</strong>/or limed be<strong>for</strong>e starting the next production cycle. The<br />
in<strong>for</strong>mation obtained from interviews <strong>and</strong> the questionnaires also suggest that pond<br />
fish farmers rarely adopt scheduled, optimum management practices. Instead most<br />
farmers fertilize <strong>and</strong> manage their systems by trial <strong>and</strong> error <strong>and</strong> <strong>of</strong>ten adopt each others<br />
practices. The general fertilization practice encompasses a single application <strong>of</strong> 1.5–3.0<br />
tonnes/ha <strong>of</strong> dry poultry manure. Some farmers supplement this with super phosphate<br />
<strong>and</strong> urea at application rates <strong>of</strong> 35 <strong>and</strong> 25 kg/ha, respectively. In general, no <strong>fertilizers</strong> are<br />
applied during the production cycle. Many farmers pile the dry manure on the pond<br />
dykes, where it is sprayed with water <strong>for</strong> a few days be<strong>for</strong>e it is washed into the ponds.<br />
This process increases the fermentation rate <strong>and</strong> reduces the time to achieve maximum<br />
primary production. In some areas, farmers use cow dung (instead <strong>of</strong> poultry manure)<br />
<strong>for</strong> pond fertilization. They reported that the large particles <strong>of</strong> cow manure decay slower<br />
than poultry manure <strong>and</strong> are also consumed by the fish.<br />
As a result <strong>of</strong> inadequate fertilization rates natural pond productivity is low <strong>and</strong><br />
many farmers start feeding their fish with commercial <strong>feeds</strong> (25 percent CP) as early<br />
as 3 days after stocking. Abdelghany, Ayyat <strong>and</strong> Ahmad.(2002) found that when Nile<br />
tilapia, common carp <strong>and</strong> silver carp were reared in adequately fertilized ponds (biweekly<br />
with 750 kg chicken litter/ha, 100 kg triple super phosphate <strong>and</strong> 20 kg urea/ha)<br />
supplemental feeding could be delayed <strong>for</strong> up to 6 weeks, without any reduction in fish<br />
yield, but with a significant reduction in feed cost. Generally, farmers were found not<br />
to be aware <strong>of</strong> the fact that excessive fertilization leads to significant deterioration in<br />
water quality <strong>and</strong> that this may result in high mortalities, low fish growth (<strong>and</strong> yield)<br />
<strong>and</strong> economic losses.<br />
Most farmers feed their fish manually twice per day, although the popularity <strong>of</strong><br />
dem<strong>and</strong> feeders is increasing (Figure 5). In general, the findings revealed that there are<br />
FIGURE 5<br />
Manual feeding <strong>of</strong> cultured fishes at Barsiq Fish Farm (Behaira) (left) <strong>and</strong> feeding tilapia<br />
with dem<strong>and</strong> feeder at Hamool (Kafr El-Shaikh) (right)
414<br />
<strong>Study</strong> <strong>and</strong> <strong>analysis</strong> <strong>of</strong> <strong>feeds</strong> <strong>and</strong> <strong>fertilizers</strong> <strong>for</strong> <strong>sustainable</strong> aquaculture development<br />
no st<strong>and</strong>ard pond management, fertilization <strong>and</strong> feeding practices. As a consequence, fish<br />
yields are generally low compared with well-fertilized, well-fed ponds in other countries.<br />
Fish yield range from 2.5–6.0 tonnes/ha/production cycle (<strong>of</strong> about 7–10 months). There<br />
are a few exceptions where yield exceeds 7 tonnes/ha/cycle.<br />
5.2 Cost-benefit <strong>analysis</strong> <strong>of</strong> pond fertilization<br />
One <strong>of</strong> the four goals <strong>of</strong> pond fertilization is to optimize cost efficiency (Knud-<br />
Hansen, 1998). This objective is <strong>of</strong> crucial importance within the framework <strong>of</strong> the<br />
present report, because fertilization strategies are very <strong>of</strong>ten evaluated simply in<br />
terms <strong>of</strong> their ability to enhance growth <strong>and</strong> production, without any consideration<br />
<strong>of</strong> cost-efficiency. It is critically important that extension workers <strong>and</strong> researchers<br />
consider economic as well as ecological implications when recommending pond<br />
fertilization strategies (Knud-Hansen, 1998). Un<strong>for</strong>tunately, these factors are generally<br />
not considered in Egypt. Hence, there is a need <strong>for</strong> detailed research on fertilization<br />
regimens such that rural farmers, who generally have very little education <strong>and</strong> are<br />
ignorant <strong>of</strong> the economic implications <strong>of</strong> their management practices, can maximize<br />
their returns.<br />
5.3 Farm-made <strong>feeds</strong><br />
Although used only by a small number <strong>of</strong> farmers, farm-made <strong>feeds</strong> are generally made<br />
as follows (El-Sayed, 2006). Ingredients are purchased <strong>and</strong> sorted to remove impurities<br />
or other objects that may damage the manufacturing equipment. The <strong>feeds</strong>tuffs are<br />
then milled <strong>and</strong> mixed according to certain <strong>for</strong>mulations, water is added <strong>and</strong> the<br />
compounded ingredients are cooked or steamed with starch as a binder. Moist str<strong>and</strong>s<br />
are extruded using a meat mincer, whereupon the str<strong>and</strong>s are sun dried, broken up <strong>and</strong><br />
stored. The dry concentrate can also be fed to fish by filling jute bags <strong>and</strong> suspending<br />
these in the water column, or alternatively moist feed balls are made <strong>and</strong> fed to the<br />
fish.<br />
Up to a few years ago, the majority <strong>of</strong> Egyptian fish farmers relied on farm-made <strong>feeds</strong>,<br />
by mixing energy sources such as wheat bran, rice bran or ground corn with protein<br />
sources (mainly local fishmeal or trash fish) at a 3:1 ratio. The mix was fed manually to<br />
the fish either dry or wet. This practice was very common especially among small-scale<br />
fish farmers. Other <strong>for</strong>mulations include brackish-water shrimp, trash fish, chopped<br />
tilapia (T. zillii) <strong>and</strong> local fishmeal as protein sources <strong>and</strong> wheat or rice ban as energy<br />
sources. However, the availability <strong>of</strong> commercial aqua<strong>feeds</strong> at reasonable prices has<br />
sharply reduced the dependence on farm-made aqua<strong>feeds</strong>. The major problems related<br />
to farm-made <strong>feeds</strong> include the need <strong>for</strong> daily feed preparation, the absence <strong>of</strong> binders<br />
<strong>and</strong> the consequent loss <strong>of</strong> nutrients <strong>and</strong> the absence <strong>of</strong> basic feed <strong>for</strong>mulations. The<br />
ingredients used <strong>for</strong> farm-made <strong>feeds</strong> <strong>and</strong> their inclusion levels vary from one area to<br />
another <strong>and</strong> is mainly determined by availability <strong>and</strong> price.<br />
6. THE ANIMAL FEED INDUSTRY<br />
In 2004, there were 57 registered animal feed factories (50 private <strong>and</strong> 7 public companies)<br />
in Egypt that manufacture various types <strong>of</strong> feed (CAPMS, 2004). In addition, there are<br />
many registered manufacturers/suppliers <strong>of</strong> feed additives, concentrates <strong>and</strong> binders.<br />
The animal feed industry, including manufacturing, h<strong>and</strong>ling, distribution, importation<br />
<strong>and</strong> exportation <strong>of</strong> processed <strong>feeds</strong> <strong>and</strong> feed components is regulated by law (Law 1498<br />
issued by the Ministry <strong>of</strong> Agriculture <strong>and</strong> L<strong>and</strong> Reclamation in 1996) to ensure feed<br />
safety <strong>and</strong> quality. The animal feed industry in Egypt is mainly geared towards poultry<br />
<strong>and</strong> livestock production. The production capacity <strong>and</strong> actual production <strong>of</strong> animal <strong>feeds</strong><br />
in Egypt during 2000/2001–2002/2003 are compared in Tables 12 <strong>and</strong> 13, respectively.<br />
There is a considerable over capacity <strong>and</strong> the data show that animal feed mills could<br />
increase their production by 797 000 tonnes (65 percent).
Analysis <strong>of</strong> <strong>feeds</strong> <strong>and</strong> <strong>fertilizers</strong> <strong>for</strong> <strong>sustainable</strong> aquaculture development in Egypt 415<br />
TABLE 12<br />
Animal feed production capacity in Egypt during 2000/2001–2002/2003<br />
Public sector Private sector Total<br />
Type <strong>of</strong> feed Year<br />
Quantity<br />
(thous<strong>and</strong> tonnes)<br />
Value<br />
(million US$)<br />
6.1 Commercial aqua<strong>feeds</strong><br />
The rapid expansion <strong>of</strong> aquaculture in Egypt during the past decade has increased the<br />
dem<strong>and</strong> <strong>for</strong> processed aqua<strong>feeds</strong>. The number <strong>of</strong> aquafeed mills has increased from 5<br />
mills producing about 20 000 tonnes/year in 1999 (El-Sayed, 1999) to 18 mills with a<br />
current annual production <strong>of</strong> about 250 000 tonnes (Mansour, 2005; Osman <strong>and</strong> Sadek,<br />
2004a). Overall, this equates to about 10 percent <strong>of</strong> the total animal feed production<br />
(2.6 million tonnes in 2003, including aquafeed production) in the country. The<br />
estimated volume <strong>and</strong> value <strong>of</strong> major feed ingredients that are currently used by the<br />
aquafeed industry are presented in Table 14.<br />
Because Nile tilapia is the most important<br />
aquaculture species in Egypt most <strong>of</strong> the<br />
manufactured <strong>feeds</strong> are conventional, compressed<br />
(sinking) pellets with a protein content <strong>of</strong><br />
25 percent. Pellet size ranges from 2–5 mm <strong>and</strong><br />
the feed is mainly used <strong>for</strong> semi-intensive culture<br />
<strong>of</strong> tilapia, mullet <strong>and</strong> carp. A small proportion is<br />
also used <strong>for</strong> intensive, monoculture <strong>of</strong> tilapia,<br />
seabream <strong>and</strong> seabass, especially in cage culture<br />
systems. The <strong>for</strong>mulations <strong>of</strong> three commercial<br />
<strong>feeds</strong> used in intensive <strong>and</strong> semi-intensive<br />
aquaculture are given in Table 15. Despite the<br />
different dietary requirements <strong>of</strong> the various<br />
Quantity<br />
(thous<strong>and</strong> tonnes)<br />
Value<br />
(million US$)<br />
Quantity<br />
(thous<strong>and</strong> tonnes)<br />
Value<br />
(million US$)<br />
Livestock<br />
feed<br />
2000/2001 1 527.2 209.4 1 525.8 240.8 3 053.0 450.2<br />
2001/2002 1 286.1 164.6 815.2 111.0 2 101.3 275.6<br />
Poultry feed 2002/2003 978.1 129.4 1 043.6 144.3 2 021.7 273.7<br />
2000/2001 36.0 7.4 1 293.9 231.8 1 329.9 (523.5)* 239.2<br />
2001/2002 36.0 8.6 454.6 67.2 490.6 (550.1)* 75.8<br />
Total 2002/2003 36.0 8.0 278.8 91.2 314.8 (451.5)* 99.2<br />
2000/2001 1 563.2 216.8 2 819.7 472.6 4 382.9 689.4<br />
2001/2002 1 322.1 173.2 1 269.8 178.2 2 591.9 351.4<br />
2002/2003 1 014.1 137.4 1 322.4 235.5 2 336.5 372.9<br />
*Values in parenthesis are the poultry feed manufacturers production capacity as provided by the MALR (2005).<br />
Source: CAPMS (2004)<br />
TABLE 13<br />
Actual production <strong>and</strong> value <strong>of</strong> animal <strong>feeds</strong> in Egypt during 2000/2001–2002/2003<br />
Type <strong>of</strong> feed Year<br />
Quantity<br />
(thous<strong>and</strong><br />
tonnes)<br />
Public sector Private sector Total<br />
Value<br />
(million<br />
US$)<br />
Quantity<br />
(thous<strong>and</strong><br />
tonnes)<br />
TABLE 14<br />
Estimated volume <strong>and</strong> value <strong>of</strong> the major<br />
ingredients used in aquafeed production in 2004<br />
Ingredient<br />
Value<br />
(million<br />
US$)<br />
Quantity<br />
(thous<strong>and</strong><br />
tonnes)<br />
Value<br />
(million<br />
US$)<br />
Quantity<br />
(tonnes)<br />
Average price<br />
(US$/ tonnes)<br />
Livestock 2000/2001 646.0 88.4 628.0 99.1 1 274.0 187.5 147.3<br />
feed<br />
2001/2002 577.0 85.9 738.5 102.7 1 315.5 188.6 143.4<br />
2002/2003 458.5 59.9 766.7 105.0 1 225.2 164.9 134.6<br />
Poultry feed 2000/2001 7.1 1.5 964.6 172.0 971.7 173.5 189.0<br />
2001/2002 11.7 2.8 443.3 64.6 455.0 67.4 148.0<br />
2002/2003 8.1 1.8 272.1 58.4 280.2 60.2 214.7<br />
Total 2000/2001 653.1 89.9 1 592.6 271.1 2 245.7 361.0 160.8<br />
2001/2002 588.7 88.7 1 181.8 167.3 1 770.5 256.0 143.3<br />
2002/2003 466.6 61.7 1 038.8 163.4 1 505.4 225.1 149.5<br />
Source: CAPMS (2004)<br />
Value<br />
(thous<strong>and</strong> US$)<br />
Fishmeal 10 000 7 290<br />
Soybean meal 50 000 15 397<br />
Yellow corn 100 000 16 045<br />
Rice bran 30 000 7 293<br />
Wheat bran 30 000 6 483<br />
Corn gluten 10 000 1 459<br />
Soybean oil 125 97<br />
Vitamin <strong>and</strong> mineral premix 75 182<br />
Source: Calculated by the author, based on the percentage <strong>of</strong><br />
each ingredient in the <strong>feeds</strong>.
416<br />
<strong>Study</strong> <strong>and</strong> <strong>analysis</strong> <strong>of</strong> <strong>feeds</strong> <strong>and</strong> <strong>fertilizers</strong> <strong>for</strong> <strong>sustainable</strong> aquaculture development<br />
species no specific <strong>feeds</strong> are made <strong>for</strong> carp, seabass <strong>and</strong> seabream. However, niche <strong>feeds</strong><br />
can be made if required, at a premium.<br />
Particular attention has been paid to the nutritional requirements <strong>of</strong> Nile tilapia<br />
under different culture conditions (see El-Sayed, 2006 <strong>for</strong> more details). The<br />
TABLE 15<br />
Formulation <strong>and</strong> percent composition <strong>of</strong> compressed (25% crude protein) pellets<br />
Ingredient<br />
Extruded<br />
(private sector)<br />
Compressed<br />
(GAMP*; government mill)<br />
Compressed<br />
(GAFRD; government mill)<br />
Soybean meal (44% CP) 19.0 22.0 21.0<br />
Fishmeal (72% CP) 9.0 4.0 5.0<br />
Corn gluten 5.6 3.8 2.0<br />
Local meat meal (65% CP) - 8.0 11.0<br />
Yellow corn 30.0 41.7 36.0<br />
Rice bran 11.0 10.0 24.3<br />
Wheat bran 24.0 10.0 -<br />
Soybean oil 0.5 0.3 0.5<br />
Fish oil 0.5 - -<br />
Vitamin <strong>and</strong> mineral mix 0.4 0.2 0.2<br />
Crude protein 25.0 25.0 25.0<br />
Crude oil** 7.6 7.5 9.0<br />
GAMP = General Authority <strong>of</strong> Milling <strong>and</strong> Polishing’; GAFRD = General Authority <strong>for</strong> Fisheries Resources<br />
Development; **calculated, based on the lipid contents <strong>of</strong> the ingredients.<br />
Source: Osman <strong>and</strong> Sadek (2004b)<br />
TABLE 16<br />
Recommended levels <strong>of</strong> different alternative protein sources tested <strong>for</strong> Nile tilapia under<br />
laboratory conditions. Levels tested are a replacement <strong>of</strong> conventional protein sources such as<br />
fishmeal or soybean meal<br />
Protein source<br />
Animal origin<br />
Fish weight (g) Tested levels (%) Recommended levels (%)<br />
Shrimp meal 20 100 100<br />
FS + SBM or MBM,<br />
PBM or HFM (1:1)<br />
8 0–75 50–75<br />
MBM + Methionine 0.011 40–50 50<br />
MBM 20 100 100<br />
BM 20 100
Analysis <strong>of</strong> <strong>feeds</strong> <strong>and</strong> <strong>fertilizers</strong> <strong>for</strong> <strong>sustainable</strong> aquaculture development in Egypt 417<br />
recommended inclusion levels <strong>of</strong> various protein sources in Nile tilapia <strong>feeds</strong> is<br />
summarized in Table 16, while the digestibility <strong>of</strong> several <strong>feeds</strong>tuffs by this species is<br />
given in Table 17.<br />
Extruded (exp<strong>and</strong>ed, or floating) aquafeed technology was introduced into Egypt<br />
in the mid 1990s with the establishment <strong>of</strong> a small unit with a production capacity <strong>of</strong><br />
500 tonnes/year (El-Sayed, 1999). Since 2001, a number <strong>of</strong> the established commercial<br />
TABLE 17<br />
Presence <strong>of</strong> endogenous anti-nutrient factors <strong>and</strong> protein <strong>and</strong> organic matter digestibility by<br />
Nile tilapia <strong>of</strong> commonly used feed ingredients<br />
Ingredient Endogenous anti-nutrients1 Animal source<br />
/*<br />
Digestibility (%)**<br />
Crude protein Organic matter<br />
Fishmeal 72–94 58<br />
Sardine meal 87 80<br />
Tuna meal 82<br />
Anchovy meal 90–94 86<br />
Meat <strong>and</strong> bone meal 92.2<br />
Poultry <strong>of</strong>fal meal 74 59<br />
Shrimp meal 87<br />
Silkworm pupa meal<br />
Plant source<br />
91.1<br />
Azolla 75<br />
Duckweed 88.4–93.9 *** 78.1–90.7 ***<br />
Barely 1, 2, 5, 8<br />
Brewers grains 66 42<br />
Cassava 1, 4<br />
Cooked cassava meal 74<br />
Leucaena 23<br />
Copra meal 56–81<br />
Corn grain (raw) 1, 5, 8, 13 83 76<br />
Corn grain (cooked) 90<br />
Corn gluten meal 91–97<br />
Cottonseed 5, 8, 10, 12, 23<br />
Cottonseed meal 90<br />
Cottonseed cake 90<br />
Groundnut 1, 2, 5, 6, 8<br />
Groundnut meal 79 72<br />
Rapeseed<br />
Rapeseed meal<br />
1, 3, 5, 7<br />
Soybean 1, 3, 5, 6, 8, 11, 12, 14,16, 17<br />
Soybean meal 91–93 57<br />
Sunflower 1, 7, 20<br />
Sunflower seed cake 86–89 42<br />
Wheat 1, 2, 5, 8, 11, 18, 22<br />
Wheat germ meal 95.5<br />
Wheat middling 76 58<br />
Wheat bran 75 30<br />
Rice 1, 2, 5, 8, 13<br />
Rice bran 2<br />
Kidney bean 1, 2, 5, 7, 22<br />
Sorghum 1, 4, 5, 7, 18<br />
Lentils 1, 2, 6<br />
Alfalfa/lucerne 1, 6, 8, 12<br />
1- Protease inhibitor, 2- Phytohaemaglutinins, 3- Glucosinolates, 4- Cyanogens, 5- Phytic acid, 6- Saponins,<br />
7- Tannins, 8- Estrogenic factors, 9- Lathyrogens, 10, Gossypol, 11- Flatulence factor, 12- Anti-vitamin E factor,<br />
13- Anti-thiamine factor, 14- Anti-vitamin A factor, 15- Anti-pyridoxine factor, 16- Anti-vitamin D factor,<br />
17- Anti-vitamin B12 factor, 18- Amylase inhibitor, 19- Invertase inhibitor, 20- Arginase inhibitor, 21- Cholinesterase<br />
inhibitor, 22- Dihydroxyphenylalanine, 23- Cyclopropionic acid.<br />
Source: *Tacon (1992); **modified from El-Sayed (2006); *** El-Shafai et al. (2004)
418<br />
FIGURE 6<br />
Comparative prices <strong>and</strong> FCRs <strong>of</strong> extruded <strong>and</strong><br />
conventional pressed pellets (25%CP) <strong>for</strong> Nile tilapia<br />
Price (US$)<br />
320<br />
300<br />
280<br />
260<br />
240<br />
220<br />
200<br />
1.5<br />
308<br />
<strong>Study</strong> <strong>and</strong> <strong>analysis</strong> <strong>of</strong> <strong>feeds</strong> <strong>and</strong> <strong>fertilizers</strong> <strong>for</strong> <strong>sustainable</strong> aquaculture development<br />
234<br />
2.2<br />
Price (US$/tonne)<br />
FCR<br />
Extruded feed Pressed feed<br />
Source: Osman <strong>and</strong> Sadek (2004b)<br />
LE/tonne<br />
FIGURE 7<br />
Price <strong>of</strong> extruded <strong>and</strong> pressed aqua<strong>feeds</strong> (25%<br />
crude protein) from 1996–2005 in US$ <strong>and</strong> LE<br />
2 500<br />
2 000<br />
1 500<br />
1 000<br />
500<br />
0<br />
Sinking pellets-LE<br />
Floating pellets-LE<br />
Sinking pellets-US$<br />
Floating pellets-US$<br />
1996 1998 2000 2002 2004<br />
Year<br />
Source: Osman <strong>and</strong> Sadek (2004b)<br />
feedmills have started production lines <strong>for</strong><br />
extruded <strong>feeds</strong> in addition to their traditional<br />
production lines. The market <strong>for</strong> extruded <strong>feeds</strong><br />
is growing in Egypt, despite the significantly<br />
higher price over sinking <strong>feeds</strong> simply because<br />
<strong>of</strong> better FCRs (Osman <strong>and</strong> Sadek, 2004b).<br />
These findings are illustrated in Figure 6.<br />
Since the mid 1990s the price <strong>of</strong> compressed<br />
pellets (25 percent CP) has gradually increased<br />
from about LE 2 800–900 (about US$250–300)<br />
to LE 1800 (US$292)/tonne in 2004 (Figure 7).<br />
Similarly, the price <strong>of</strong> floating (extruded)<br />
pellets has almost doubled in the last four<br />
years, increasing from LE 1200 (US$295)/<br />
tonne in 2001 to LE 2050 LE (US$332)/tonne<br />
in 2004 (Osman <strong>and</strong> Sadek, 2004b). While the<br />
price in US$ has fluctuated little, the increases<br />
in LE have been substantial <strong>and</strong> this is due to<br />
the exchange rate <strong>of</strong> the LE against the US$.<br />
Surprisingly, farmers reported that the price<br />
<strong>of</strong> both sinking <strong>and</strong> extruded <strong>feeds</strong> decreased<br />
by about 5 percent in 2005, compared with<br />
the previous year. They attributed this<br />
reduction to increasing competition among<br />
manufacturers <strong>and</strong> a slight increase in the<br />
value <strong>of</strong> the Egyptian pound against the US$<br />
in 2005 (US$1.00 = LE 6.17 <strong>and</strong> 5.70 in 2004<br />
<strong>and</strong> 2005, respectively).<br />
The current average FCR using compressed<br />
pellets is 2.2:1 (Osman <strong>and</strong> Sadek, 2004b).<br />
There<strong>for</strong>e the total amount <strong>of</strong> manufactured<br />
aqua<strong>feeds</strong> theoretically accounts <strong>for</strong> 113 000<br />
tonnes <strong>of</strong> fish or 24 percent <strong>of</strong> total aquaculture<br />
production (471 535 tonnes) in 2004. Hence<br />
the bulk <strong>of</strong> fish production can theoretically<br />
be attributed to natural food production in<br />
the ponds, through fertilization. From this<br />
it can be concluded that organic <strong>fertilizers</strong><br />
(chicken manure) currently constitutes the<br />
most important pond input in Egypt.<br />
7. PROBLEMS AND CONSTRAINTS<br />
The following problems <strong>and</strong> constraints have been identified:<br />
1. The continuous increase in the price <strong>of</strong> feed ingredients, particularly imported<br />
ingredients such as fishmeal, soybean, corn, oils <strong>and</strong> additives. This has lead to<br />
parallel increases in feed prices.<br />
2. The high custom tariffs <strong>and</strong> taxes on imported ingredients <strong>and</strong> manufacturing<br />
equipment have contributed to rising feed costs.<br />
3. Because <strong>of</strong> the rapid growth <strong>of</strong> aquaculture it is expected that there will be some<br />
level <strong>of</strong> competition <strong>for</strong> raw materials between the aquafeed <strong>and</strong> the animal feed<br />
industries, which may influence the price <strong>of</strong> <strong>feeds</strong>.<br />
2 US$ = 5.68 LE (Egypt Pound, EGP)<br />
2.5<br />
2<br />
1.5<br />
1<br />
0.5<br />
0<br />
FCR<br />
360<br />
340<br />
320<br />
300<br />
280<br />
260<br />
240<br />
220<br />
200<br />
US$/tonne
Analysis <strong>of</strong> <strong>feeds</strong> <strong>and</strong> <strong>fertilizers</strong> <strong>for</strong> <strong>sustainable</strong> aquaculture development in Egypt 419<br />
4. The growing public misconception about the use <strong>of</strong> commercial aqua<strong>feeds</strong> or<br />
farm-made <strong>feeds</strong> is <strong>of</strong> concern <strong>and</strong> must be addressed.<br />
5. One <strong>of</strong> the most serious problems facing the aquafeed industry in Egypt is the<br />
poor h<strong>and</strong>ling <strong>and</strong> sometimes abysmal storage facilities <strong>for</strong> ingredients <strong>and</strong><br />
finished <strong>feeds</strong>.<br />
6. Small-scale farmers are constrained because <strong>of</strong> the lack <strong>of</strong> access to finance,<br />
which makes them vulnerable to exploitation by suppliers <strong>of</strong> seeds, <strong>feeds</strong>,<br />
<strong>fertilizers</strong>. Aquaculture inputs are purchased during the production cycle, but<br />
payment is delayed until after the fish are harvested <strong>and</strong> sold. As a result, farmers<br />
are generally supplied with low quality inputs, at high prices.<br />
7. Lack <strong>of</strong> extension services to advise farmers on pond fertilization, feed<br />
<strong>for</strong>mulation <strong>and</strong> manufacture.<br />
8. Fish farmers are generally unaware <strong>of</strong> proper fertilization strategies <strong>and</strong> methods<br />
that should be adopted to optimise pond productivity.<br />
9. The limited, <strong>and</strong> sometimes conflicting, statistical in<strong>for</strong>mation on feed ingredients,<br />
feed production <strong>and</strong> production capacity. Highly variable values <strong>of</strong> production,<br />
prices, imports, exports, etc, <strong>of</strong> several ingredients have been reported by different<br />
government authorities. This leads to a general mistrust <strong>of</strong> government statistics<br />
1 400<br />
<strong>and</strong> causes confusion among researchers, administrators <strong>and</strong> decision makers.<br />
10. Limited research on fish nutrition, feeding <strong>and</strong> fertilization Aqstrategies. u ac u ltu r e p r o dKey u c tio nissues<br />
1 200<br />
pertaining to fish nutrition research <strong>and</strong> aquafeed technology Aq u af e d pwere r o d u c tioidentified n<br />
in an Expert Consultation on Fish Nutrition Research <strong>and</strong> Feed Technology<br />
1 000<br />
facilitated by the WorldFish Center in December 2004 in Abbassa (summarized<br />
by El-Sayed, 2004).<br />
8. FUTURE PERSPECTIVES<br />
600<br />
Between 1994 <strong>and</strong> 2004 aquaculture production has increased 7 fold from 56 600 tonnes to<br />
471 535 tonnes. All indications are that aquaculture will 400continue<br />
to grow in Egypt. The<br />
main concerns regarding the future expansion <strong>of</strong> the sector revolve around the availability<br />
200<br />
<strong>and</strong> accessibility <strong>of</strong> inputs <strong>and</strong> resources. Some aquaculture specialists believe that the<br />
future growth <strong>of</strong> aquaculture will compete with the needs <strong>of</strong> agriculture, while others<br />
0<br />
discount this scenario. They believe that the continued expansion <strong>of</strong> the poultry industry<br />
in Egypt will lead to the production <strong>of</strong> greater volumes <strong>of</strong> manure <strong>and</strong> that this will<br />
Year<br />
compensate <strong>for</strong> the expected increase in dem<strong>and</strong> <strong>for</strong> organic fertilizer by aquaculture. In<br />
addition, the gradual shift from semi-intensive<br />
systems to more intensive production systems<br />
will increase the dependence on pelleted <strong>feeds</strong>,<br />
thereby reducing the dem<strong>and</strong> <strong>for</strong> organic<br />
<strong>fertilizers</strong>. Competition <strong>for</strong> inorganic fertilizer<br />
1 400<br />
is also unlikely to occur, at least in the short<br />
1 200<br />
Aq u acu ltu r e p ro d u ctio n<br />
term. This is simply because the current use <strong>of</strong><br />
Aq u af e d p ro d u ctio n<br />
inorganic <strong>fertilizers</strong> in aquaculture is negligible<br />
1 000<br />
(about 0.01 percent <strong>of</strong> total production). In<br />
addition, Egypt currently exports substantial<br />
800<br />
amounts <strong>of</strong> inorganic <strong>fertilizers</strong> (19 percent<br />
<strong>of</strong> total production in 2004/2005), a small<br />
600<br />
proportion <strong>of</strong> which would satisfy the needs<br />
400<br />
<strong>of</strong> aquaculture.<br />
Egypt’s aquaculture target is to produce<br />
200<br />
800 000 tonnes/year by 2014 (Mansour,<br />
2005). This means that aquafeed production<br />
0<br />
is expected to increase to about 1.2 million<br />
Year<br />
tonnes/year (Figure 8), assuming a FCR <strong>of</strong> Source: Mansour (2005), GAFRD (pers. comm.)<br />
Production (thous<strong>and</strong> tonnes)<br />
Production (thous<strong>and</strong> tonnes)<br />
800<br />
2000 2002 2004 2006 2008 2010 2012 2014<br />
FIGURE 8<br />
Projected aquaculture production <strong>and</strong> feed dem<strong>and</strong><br />
to 2014<br />
2 000 2002 2004 2006 2008 2010 2012 2014
420<br />
<strong>Study</strong> <strong>and</strong> <strong>analysis</strong> <strong>of</strong> <strong>feeds</strong> <strong>and</strong> <strong>fertilizers</strong> <strong>for</strong> <strong>sustainable</strong> aquaculture development<br />
1.5:1 (instead <strong>of</strong> the current reported value <strong>of</strong> 2.2:1). It is expected that there will be<br />
substantial competition <strong>for</strong> ingredients by the aquafeed <strong>and</strong> animal feed industries.<br />
Accordingly, the prices <strong>of</strong> feed ingredients in general <strong>and</strong> imported ingredients in<br />
particular, will increase. Small-scale fish farmers (<strong>and</strong> small-scale poultry <strong>and</strong> livestock<br />
producers) are likely to be the most seriously affected groups. It is incumbent upon the<br />
government to develop action plans to deal with the potential crisis in the animal <strong>and</strong><br />
aquafeed industries. It is also expected that feed manufacturers will make greater <strong>and</strong><br />
better use <strong>of</strong> non-conventional feed resources that are readily available <strong>and</strong> accessible<br />
in Egypt.<br />
9. RECOMMENDATIONS<br />
The following recommendations are made <strong>for</strong> the <strong>sustainable</strong> development <strong>of</strong><br />
aquaculture in Egypt:<br />
• Despite the availability <strong>of</strong> many conventional <strong>and</strong> non-conventional feed<br />
resources in Egypt, the sustainability, accessibility, prices <strong>and</strong> nutritional value<br />
<strong>of</strong> these commodities have not been well-studied. This requires urgent attention.<br />
Similarly, there is a need to conduct research on the comparative biological<br />
<strong>and</strong> economic advantages <strong>of</strong> different organic <strong>fertilizers</strong>, re-evaluation <strong>of</strong> the<br />
protein requirements <strong>of</strong> the various species under different culture conditions<br />
<strong>and</strong> improving the digestibility <strong>of</strong> non-conventional, high fibre content feed<br />
ingredients.<br />
• Small-scale farmers must be trained to manufacture <strong>and</strong> encouraged to use farmmade<br />
<strong>feeds</strong>. This will lead to substantial reductions in feed cost <strong>and</strong> increased farm<br />
pr<strong>of</strong>itability.<br />
• Greater attention must be paid to feeding <strong>and</strong> fertilization strategies in semiintensive<br />
culture. Farmers must receive training in pond preparation <strong>and</strong><br />
management as well as fertilization <strong>and</strong> feed management.<br />
• Easier access to finance by small-scale farmers must be facilitated by<br />
government.<br />
• Custom tariffs on imported feed ingredients (such as soybean, fishmeal <strong>and</strong><br />
yellow corn) must be reviewed to reduce the price <strong>of</strong> finished <strong>feeds</strong>.<br />
• Aquafeed mills should be routinely monitored <strong>and</strong> inspected to assure that<br />
production procedures, feed composition, packaging, h<strong>and</strong>ling, transportation,<br />
storage <strong>and</strong> hygiene comply with the quality control st<strong>and</strong>ards set by government.<br />
• Extension services should be instituted by the relevant authorities (especially the<br />
General Authority <strong>for</strong> Fisheries Resources Development) to improve feeding,<br />
fertilization <strong>and</strong> farm management.<br />
• The government must undertake periodic reviews <strong>of</strong> the animal feed legislations<br />
to ensure coherency <strong>and</strong> to reduce/eliminate any overlapping, redundant <strong>and</strong><br />
conflicting regulations.<br />
• Dialogue among <strong>and</strong> between producers <strong>and</strong> distributors <strong>of</strong> feed or feed ingredients,<br />
fish farmers, research institutions <strong>and</strong> concerned government authorities must be<br />
improved.<br />
• The public misconception about the use <strong>of</strong> commercial aqua<strong>feeds</strong> or farm-made<br />
<strong>feeds</strong> must be addressed through appropriate educational programmes <strong>and</strong> the<br />
media.<br />
ACKNOWLEDGEMENTS<br />
The author gratefully acknowledges the following authorities <strong>for</strong> assistance <strong>and</strong><br />
providing in<strong>for</strong>mation: Central Agency <strong>for</strong> Public Mobilization <strong>and</strong> Statistics,<br />
Ministry <strong>of</strong> Investment, General Authority <strong>for</strong> Fisheries Resources Development,<br />
Ministry <strong>of</strong> Agriculture <strong>and</strong> L<strong>and</strong> Reclamation, In<strong>for</strong>mation <strong>and</strong> Decision Supporting<br />
Center <strong>of</strong> the Cabinet <strong>of</strong> Ministers, Edfina Preserved Foods Company (Domiat
Analysis <strong>of</strong> <strong>feeds</strong> <strong>and</strong> <strong>fertilizers</strong> <strong>for</strong> <strong>sustainable</strong> aquaculture development in Egypt 421<br />
Factory) <strong>and</strong> Fish Farmers’ Association at Kafr El-Shaikh. Sincere thanks also go to<br />
Dr Ismail Radwan (a fish farmer at Hamool, Kafr El-Shaikh) <strong>and</strong> Mr Ahmed Zytoun<br />
(a fish farmer at Maadia, Behaira) <strong>for</strong> providing their own private data, <strong>and</strong> also <strong>for</strong><br />
facilitating my visits to many fish farms in their regions. I would also like to thank<br />
Mr Refaat Sherif, Advisor to the Minister <strong>of</strong> Investment, <strong>for</strong> providing recent data<br />
on fertilizer production, consumption, import <strong>and</strong> export. The in<strong>for</strong>mation provided<br />
by Pr<strong>of</strong> Elham Wassef <strong>and</strong> Dr Alaa El-Haweet (National Institute <strong>of</strong> Oceanography<br />
<strong>and</strong> Fisheries, Alex<strong>and</strong>ria) is also appreciated. The assistance <strong>of</strong> the many fish farmers<br />
whom I visited <strong>and</strong> interviewed is also highly appreciated.<br />
REFERENCES<br />
Abdelghany, A.E., Ayyat, M-S. & Ahmad, M.H. 2002. Appropriate timing <strong>of</strong> supplemental<br />
feeding <strong>for</strong> production <strong>of</strong> Nile tilapia, silver carp, <strong>and</strong> common carp in fertilized<br />
polyculture ponds. Journal <strong>of</strong> the World Aquaculture Society, 33: 307–315.<br />
Bardach, J.E., Ryther, J.H. & McLarney, W.O. 1972. Aquaculture: the farming <strong>and</strong><br />
husb<strong>and</strong>ry <strong>of</strong> freshwater <strong>and</strong> marine organisms. New York, Wiley Interscience. 868 pp.<br />
CAPMS (Central Agency <strong>for</strong> Public Mobilization <strong>and</strong> Statistics). 2004. Animal feed<br />
industry 2002/2003. Cairo, Central Agency <strong>for</strong> Public Mobilization <strong>and</strong> Statistics. 8 pp.<br />
(Arabic)<br />
CAPMS (Central Agency <strong>for</strong> Public Mobilization <strong>and</strong> Statistics). 2006. The statistical year<br />
book, 1995-2004. Cairo, Central Agency <strong>for</strong> Public Mobilization <strong>and</strong> Statistics. 413 pp.<br />
El-Sayed, A.-F.M. 1999. Aquaculture feed <strong>and</strong> fertilizer resource Atlas <strong>of</strong> Egypt. Regional<br />
Office <strong>for</strong> the Near East, Cairo, FAO. 105 pp.<br />
El-Sayed, A.-F.M. 2004. An overview <strong>of</strong> fish nutrition research in Egypt. Expert<br />
Consultation on Fish Nutrition Research <strong>and</strong> Feed Technology in Egypt. Abbassa, Abou<br />
Hammad, Sharkia, Egypt, 2 December 2004, World FishCenter. (Unpublished)<br />
El-Sayed, A.-F.M. 2006. Tilapia culture. Walling<strong>for</strong>d, Oxon, UK, CABI Publishing. 277 pp.<br />
El-Shafai, S.A., El-Gohary, F.A., Verreth, J.A.J., Schrama, J.W. & Gijzen, H.J. 2004.<br />
Apparent digestibility coefficient <strong>of</strong> duckweed (Lemna minor), fresh <strong>and</strong> dry <strong>for</strong> Nile<br />
tilapia (Oreochromis niloticus L.). Aquaculture Research, 35: 574–586.<br />
FAO. 2007. FAO Fisheries Department, Fishery In<strong>for</strong>mation, Data <strong>and</strong> Statistics Unit.<br />
Fishstat Plus: Universal s<strong>of</strong>tware <strong>for</strong> fishery statistical time series. Aquaculture production:<br />
quantities 1950-2005, Aquaculture production: values 1984-2005; Capture production:<br />
1950-2005; Commodities production <strong>and</strong> trade: 1950-2004; Total production: 1970-2005,<br />
Vers. 2.30 (available at www.fao.org/fi/statist/FISOFT/FISHPLUS.asp).<br />
GAFRD (General Authority <strong>for</strong> Fisheries Resources Development). 2005. Fisheries statistics<br />
year book. Cairo, General Authority <strong>for</strong> Fisheries Resources Development. 140 pp.<br />
Hamza, A.K. 1996. Aquaculture in Egypt. World Aquaculture, 27: 14–19.<br />
Knud-Hansen, C.F. 1998. Pond fertilization: ecological approach <strong>and</strong> practical applications.<br />
Pond Dynamics/Aquaculture CRSP. Corvallis, Oregon, Oregon State University. 125 pp.<br />
Mansour, A.M. 2005. Improvement <strong>of</strong> aquafeed industry <strong>and</strong> development <strong>of</strong> fish farms.<br />
Al-Sayyad (bi-monthly bulletin), December 2004/January 2005. 15 pp. (Arabic)<br />
MALR (Ministry <strong>of</strong> Agriculture <strong>and</strong> L<strong>and</strong> Reclamation). 2005 <strong>and</strong> 2006. Economic<br />
indices (available at http://www.agri.gov.eg/MainMenuI.aspx?Id=area_s.htm&Ph=1600).<br />
(Arabic)<br />
Osman, M.F. & Sadek, S.S. 2004a. Industrial fish feed production development in Egypt.<br />
Abbassa, Abou Hammad, Sharkia, Egypt, WorldFish Center. (Unpublished)<br />
Osman, M.F. & Sadek, S.S. 2004b. An overview <strong>of</strong> fish feed industry in Egypt - challenges<br />
<strong>and</strong> opportunities. Expert Consultation on Fish Nutrition Research <strong>and</strong> Feed Technology<br />
in Egypt. Abbassa, Abou Hammad, Sharkia, Egypt, 2nd December, 2004, WorldFish<br />
Center. (Unpublished)<br />
Tacon, A.G.J. 1992. Nutritional fish pathology - morphological signs <strong>of</strong> nutrient deficiency<br />
<strong>and</strong> toxicity in farmed fish. FAO Fish. Tech. Pap. 330, Rome, FAO. 75 pp.
422<br />
<strong>Study</strong> <strong>and</strong> <strong>analysis</strong> <strong>of</strong> <strong>feeds</strong> <strong>and</strong> <strong>fertilizers</strong> <strong>for</strong> <strong>sustainable</strong> aquaculture development<br />
APPENDIX<br />
Nutritional requirement <strong>of</strong> aquaculture species<br />
A.1. Dietary protein <strong>and</strong> lipid requirements (percent <strong>of</strong> dry feed) <strong>of</strong> some aquaculture species in<br />
Egypt<br />
Species Life stage Crude protein Crude lipid<br />
Nile tilapia Fry 40–45 10–15<br />
Fingerlings 35 10<br />
Growout 25–30 6–9<br />
Broodstock 40 10<br />
Gilthead seabream Fingerlings 50–60 15–28<br />
Growout 45–50 15–22<br />
European seabass Fingerlings 45–50 10–20<br />
Growout 40–45 10–-15<br />
Grass carp Fry 41–43 4<br />
Common carp 3–40
Analysis <strong>of</strong> <strong>feeds</strong> <strong>and</strong> <strong>fertilizers</strong><br />
<strong>for</strong> <strong>sustainable</strong> aquaculture<br />
development in Kenya<br />
Beatrice Ny<strong>and</strong>at<br />
Department <strong>of</strong> Fisheries<br />
PO Box 58187 - 00100 Nairobi<br />
Kenya<br />
Summary 424<br />
1. Overview <strong>of</strong> aquaculture practices 425<br />
2. Analysis <strong>of</strong> <strong>fertilizers</strong> <strong>and</strong> nutrients 426<br />
3. Analysis <strong>of</strong> <strong>feeds</strong> <strong>and</strong> feeding 427<br />
4. Constraints to <strong>sustainable</strong> aquaculture development 434<br />
5. Recommendations <strong>for</strong> improved utilization <strong>of</strong> fertilizer <strong>and</strong> feed resources 435<br />
References 435<br />
Ny<strong>and</strong>at, B. 2007. Analysis <strong>of</strong> <strong>feeds</strong> <strong>and</strong> <strong>fertilizers</strong> <strong>for</strong> <strong>sustainable</strong> aquaculture<br />
development in Kenya. In M.R. Hasan, T. Hecht, S.S. De Silva <strong>and</strong> A.G.J. Tacon (eds).<br />
<strong>Study</strong> <strong>and</strong> <strong>analysis</strong> <strong>of</strong> <strong>feeds</strong> <strong>and</strong> <strong>fertilizers</strong> <strong>for</strong> <strong>sustainable</strong> aquaculture development.<br />
FAO Fisheries Technical Paper. No. 497. Rome, FAO. pp. 423–436.<br />
423
424<br />
<strong>Study</strong> <strong>and</strong> <strong>analysis</strong> <strong>of</strong> <strong>feeds</strong> <strong>and</strong> <strong>fertilizers</strong> <strong>for</strong> <strong>sustainable</strong> aquaculture development<br />
SUMMARY<br />
The expansion <strong>of</strong> the agricultural sector is crucial <strong>for</strong> the overall economic <strong>and</strong> social<br />
growth <strong>and</strong> development <strong>of</strong> Kenya. In 2003, the sector contributed 24 percent to Gross<br />
Domestic Product <strong>and</strong> a further 27 percent through linkages with manufacturing,<br />
distribution <strong>and</strong> service-related sectors. The agriculture sector, which comprises<br />
agriculture, livestock, fisheries <strong>and</strong> related activities, also supports an estimated 75 percent<br />
<strong>of</strong> the population. In addition, 87 percent <strong>of</strong> all poor households live in rural areas where<br />
farming is their main activity. About 50 percent <strong>of</strong> Kenyans are food insecure, while<br />
significant potential <strong>for</strong> increased production remains largely unexploited. About 66 <strong>of</strong><br />
the manufacturing sector is agro-based.<br />
The major cereal crops <strong>of</strong> Kenya are maize, wheat, rice, sorghum, millet <strong>and</strong> barley<br />
among others. Together with cassava, sweet potatoes <strong>and</strong> soybeans these crops represent<br />
the major food crops farmed in Kenya <strong>and</strong> there is little or no surplus <strong>for</strong> the animal<br />
feed industry. It is estimated that feed manufacturers use 450 000 tonnes <strong>of</strong> raw materials<br />
annually, <strong>of</strong> which about 2 200 tonnes <strong>of</strong> fishmeal is imported from Tanzania. The<br />
Kenyan animal feed industry is comprised <strong>of</strong> a <strong>for</strong>mal <strong>and</strong> an in<strong>for</strong>mal sector. The <strong>for</strong>mal<br />
sector is represented by the animal feed manufacturers association <strong>of</strong> Kenya. There<br />
are about 80 registered feed manufacturers in the country <strong>of</strong> which 17 are considered<br />
large scale. At this stage the industry is largely unregulated; hence feed quality is <strong>of</strong>ten<br />
a major problem. The growth <strong>of</strong> the fishmeal based animal <strong>feeds</strong> industry during the<br />
last decade has resulted in an unprecedented dem<strong>and</strong> <strong>for</strong> silver cyprinid Rastrineabola<br />
argentea (locally known as omena), the second most important commercial fish species<br />
in Lake Victoria <strong>and</strong> Nile perch skeletons as raw material <strong>for</strong> animal <strong>feeds</strong> <strong>and</strong> fishmeal,<br />
respectively. It is feared that this will lead to a severe reduction <strong>of</strong> omena <strong>and</strong> Nile perch<br />
by-products <strong>for</strong> human consumption.<br />
Approximately a third <strong>of</strong> Kenya’s 5 900 fish farmers are commercial farmers<br />
although only four are large scale commercial enterprises. The remainder are rural,<br />
non-commercial, small-scale fish farmers. Total fish production is currently estimated<br />
at around 1 000 tonnes. Culture systems range across the spectrum from small-scale<br />
extensive to semi-intensive pond based polyculture <strong>of</strong> Nile tilapia, Oreochromis niloticus<br />
<strong>and</strong> North African catfish, Clarias gariepinus to intensive pond, tank, raceway <strong>and</strong> cage<br />
monoculture.<br />
Though animal manure is generally available its use in small-scale aquaculture is<br />
limited. Chicken manure is very expensive <strong>and</strong> on a unit weight basis approaches the<br />
price <strong>of</strong> chemical <strong>fertilizers</strong>. This is a major problem. Chemical <strong>fertilizers</strong> are only used<br />
by larger commercial enterprises.<br />
The main protein sources <strong>of</strong> farm-made <strong>feeds</strong> are oilseed cakes (cotton, soybean<br />
<strong>and</strong> sunflower), fishmeal, bloodmeal, carcass meal <strong>and</strong> lake shrimp, though fishmeal is<br />
very scarce. Cereal bran, kitchen waste <strong>and</strong> vegetables are commonly used by the noncommercial<br />
farmers. Many commercial farmers, irrespective <strong>of</strong> scale, have developed<br />
their own highly successful <strong>for</strong>mulations <strong>and</strong> make their own pellets using crude<br />
machinery such as meat mincers, while others modify poultry <strong>and</strong> pig feed <strong>for</strong>mulations.<br />
Farm made <strong>feeds</strong> are fed either as a moist dough, in pellet <strong>for</strong>m or as a dry meal. Only<br />
two aquaculture <strong>feeds</strong> are produced in Kenya, a tilapia pellet <strong>and</strong> a rainbow trout pellet.<br />
These are expensive <strong>and</strong> hence most commercial farmers compound <strong>and</strong> manufacture<br />
<strong>feeds</strong> on the farm. Recommendations to address the constraints facing the development<br />
<strong>of</strong> aquaculture are provided.
Analysis <strong>of</strong> <strong>feeds</strong> <strong>and</strong> <strong>fertilizers</strong> <strong>for</strong> <strong>sustainable</strong> aquaculture development in Kenya 425<br />
1. OVERVIEW OF AQUACULTURE PRACTICES<br />
Kenya has extensive bodies <strong>of</strong> both inl<strong>and</strong> <strong>and</strong><br />
coastal waters in which aquaculture can be<br />
practiced, either on an intensive or extensive<br />
scale. Though there are several experimental<br />
mariculture initiatives, aquaculture is presently<br />
only practiced in inl<strong>and</strong> waters <strong>and</strong> comprises<br />
about 0.6 percent <strong>of</strong> the total national fish<br />
production.<br />
Traditionally, fish farming has mainly been<br />
practiced at a subsistence (non-commercial)<br />
level. Of the 5 890 registered fish farmers in<br />
2005 only 4 (0.1 percent) were large scale farms,<br />
1 962 (33.3 percent) were small-scale commercial<br />
farms <strong>and</strong> 3 925 (66.6 percent) non-commercial<br />
farmers. The increases in production since 1999<br />
have been negligible <strong>and</strong> <strong>of</strong>ficial statistics report<br />
that approximately 1 035 tonnes were produced<br />
in 2004 (Table 1).<br />
The l<strong>and</strong> tenure system in Kenya curtails<br />
l<strong>and</strong> ownership by farmers. Consequently 80<br />
percent <strong>of</strong> farmers hold small plots <strong>of</strong> l<strong>and</strong>,<br />
normally less than 2 ha. Cultivation <strong>of</strong> staple<br />
<strong>and</strong> cash crops (mainly tea <strong>and</strong> c<strong>of</strong>fee <strong>for</strong><br />
export) <strong>for</strong>ms the backbone <strong>of</strong> small-holder<br />
TABLE 1<br />
Trends in total fish production <strong>and</strong> percent<br />
contribution by aquaculture to total annual fish<br />
yield (1999- 2004)<br />
Year Total fish<br />
yield<br />
(tonnes)<br />
Aquaculture<br />
production<br />
(tonnes)<br />
farming in Kenya. Despite the seemingly higher returns from fish farming (Table 2),<br />
farmers pay more attention to crop farming. This may suggest one <strong>of</strong> two things, either<br />
that the calculated returns from fish farming are unrealistic or that farmers are averse<br />
to the associated risks <strong>of</strong> fish farming. Underpinning their activities is a well-developed<br />
agricultural research, extension <strong>and</strong> marketing system. The livestock production sector<br />
in Kenya has a well developed extension system with partly privatized veterinary<br />
services.<br />
The current development goals <strong>of</strong> the Kenyan government focus mainly on alleviating<br />
poverty, increasing food production <strong>and</strong> addressing environmental degradation. Since<br />
independence, the increase in food production has been below the average population<br />
growth rate. Several strategies have been developed to address this, including<br />
intensification <strong>of</strong> existing technologies, increasing the genetic potential <strong>of</strong> staple <strong>and</strong><br />
cash crops, developing capture fisheries <strong>and</strong> livestock production <strong>and</strong> encouraging the<br />
development <strong>of</strong> large-scale commercial aquaculture.<br />
The choice <strong>of</strong> aquaculture systems in Kenya is dependent largely on the financial<br />
status <strong>of</strong> the farmer. Several systems are employed <strong>and</strong> these are listed below:<br />
• intensive pond monoculture <strong>of</strong> Nile tilapia, Oreochromis niloticus <strong>and</strong> rainbow<br />
trout, Oncorhynchus mykiss;<br />
• intensive cage culture <strong>of</strong> Nile tilapia;<br />
• intensive fingerling production <strong>of</strong> North African catfish, Clarias gariepinus<br />
(currently there are six commercial catfish hatcheries producing between 10 000<br />
<strong>and</strong> 20 000 fingerlings per month, mainly as live bait <strong>for</strong> the long line Nile perch,<br />
Lates niloticus fishery in Lake Victoria);<br />
• semi-intensive pond monoculture <strong>of</strong> North African catfish <strong>and</strong> Nile tilapia (<strong>and</strong><br />
other tilapia’s);<br />
• semi-intensive pond polyculture <strong>of</strong> North African catfish <strong>and</strong> Nile tilapia;<br />
• extensive pond monoculture <strong>of</strong> tilapia <strong>and</strong> common carp, Cyprinus carpio; <strong>and</strong><br />
• extensive pond polyculture <strong>of</strong> Nile tilapia <strong>and</strong> common carp.<br />
Aquaculture as % <strong>of</strong><br />
total fish production<br />
1999 214 712 984 0.46<br />
2000 202 639 967 0.47<br />
2001 164 274 998 0.60<br />
2002 128 227 998 0.78<br />
2003 119 688 1 012 0.85<br />
2004 134 741 1 035 0.77<br />
Source: MLFD (1999–2004)<br />
TABLE 2<br />
Comparison <strong>of</strong> returns from crop <strong>and</strong> fish farming in<br />
Kenya, 2003<br />
Farming activity Production<br />
(kg/ha/year)<br />
Net annual revenue<br />
(US$/ha/year)<br />
Fish (Western Kenya) 7 400 6 420<br />
Fish (Central Kenya) 3 500 4 095<br />
C<strong>of</strong>fee 2 471 488<br />
Tea 6 000 59 289<br />
Tomato (rain-fed) 9 884 2 604<br />
Tomato (irrigated) 9 884 10 418<br />
Source: Anon (2003)<br />
Average exchange rate (2005): US$1.00 = Ksh75.6
426<br />
<strong>Study</strong> <strong>and</strong> <strong>analysis</strong> <strong>of</strong> <strong>feeds</strong> <strong>and</strong> <strong>fertilizers</strong> <strong>for</strong> <strong>sustainable</strong> aquaculture development<br />
TABLE 3<br />
Aquaculture production statistics (2000-2004), excluding production from Government stations<br />
Indicators 2000 2001 2002 2003 2004<br />
Total no. <strong>of</strong> farmers 7 501 8 371 7 840 7 790 5 890<br />
Total area <strong>of</strong> ponds harvested (ha) 27.36 16.77 88.0 19.9<br />
Tilapia production (weight in tonnes) by small-holder,<br />
non-commercial farmers in extensive <strong>and</strong> semi-intensive<br />
systems<br />
31.69 70.31 17.16 * 19.76<br />
Tilapia production (weight in tonnes) by commercial<br />
farmers in semi-intensive or intensive systems<br />
42.75 * 33.43 27.78 42.13<br />
Total tilapia production (value in US$) 66 438 85 799 56 474 * 20 405<br />
Catfish production (weight in tonnes) by commercial<br />
farmers in semi-intensive system<br />
1.51 * * * 8.64<br />
Catfish production value (value in US$) 1 453 * * * 5 796<br />
Common carp production (weight in kg) by small-holders<br />
in extensive systems<br />
675 * * * *<br />
Common carp production value (value in US$) 725 * * * *<br />
Trout production (weight in tonnes) by commercial<br />
farmers in intensive system<br />
3.8 1.8 2.5 * 2.5<br />
Trout production value (value in US$) 23 806 17 235 16 541 * 32 052<br />
Total production (tonnes) 80.4 72.1 58.6 72.0 73.09<br />
Total value (US$) 71 738 103 034 78 872 89 434 104 291<br />
* Data not available<br />
Source: MLFD (2005)<br />
Fish holding systems include, earthen or concrete ponds, PVC lined earthen ponds,<br />
locally assembled cages, concrete raceways <strong>and</strong> metal tanks.<br />
Approximately 35 percent <strong>of</strong> tilapia produced in Kenya is produced in semiintensive<br />
systems, while 65 percent is produced in extensive systems. Aquaculture<br />
production statistics are summarized in Table 3. Production <strong>of</strong> common carp in Kenya<br />
has virtually stopped <strong>and</strong> this is most likely due to consumer preferences.<br />
2. ANALYSIS OF FERTILIZERS AND NUTRIENTS<br />
2.1 Availability <strong>and</strong> accessibility <strong>of</strong> <strong>fertilizers</strong><br />
Poultry <strong>and</strong> cattle comprise the bulk <strong>of</strong> livestock production in Kenya. Table 4 shows<br />
that there were 11.4 million head <strong>of</strong> cattle in 2000 <strong>and</strong> by 2004 this had increased to<br />
13 million. Poultry production has been fairly stable at around 26 million birds per<br />
annum.<br />
The amount <strong>of</strong> organic manure produced on the basis <strong>of</strong> the national herd in 2004<br />
was approximately 18.8 million tonnes. However, most <strong>of</strong> the manure is produced from<br />
pastoralism <strong>and</strong> is there<strong>for</strong>e not readily available <strong>for</strong> both agriculture <strong>and</strong> aquaculture.<br />
The bulk <strong>of</strong> the available manure is used <strong>for</strong> crop production <strong>and</strong> only a small, non<br />
quantified proportion is used <strong>for</strong> aquaculture. Most small-scale farmers use “green<br />
compost” in pond cribs. Accurate data <strong>of</strong> the quantity <strong>of</strong> manure used in aquaculture is<br />
lacking. In Kenya, the recommended manuring rate <strong>for</strong> fish ponds is 500 kg/ha/week.<br />
The most commonly used chemical <strong>fertilizers</strong> by commercial farmers are diammonium<br />
phosphate (DAP) <strong>and</strong> urea. From a nutrient supply perspective these<br />
are also the cheapest sources <strong>of</strong> nutrients in the country. For example, the price<br />
TABLE 4<br />
Kenya livestock population (thous<strong>and</strong>) during 2000-2004<br />
Sector 2000 2001 2002 2003 2004<br />
Cattle 11 445 11 476 11 940 12 531 13 022<br />
Sheep 7 940 7 609 9 289 8 157 10 230<br />
Goat 10 804 11 319 11 947 13 391<br />
Pig 311 333 336 415 380<br />
Poultry 26 292 27 031 27 871 28 283 26 240<br />
Donkey 416 479 521 424 516<br />
Camel 718 819 847 895 1 194<br />
Source: MLFD (2004)<br />
<strong>for</strong> dry chicken manure in 2005 was<br />
US$400/tonne compared, to DAP <strong>and</strong><br />
urea, which sold at an average price <strong>of</strong><br />
US$470/tonne (Table 5).<br />
2.2 Fertilizer management<br />
strategies<br />
Small-scale, non-commercial farmers<br />
fertilize their ponds using the crib or<br />
the bag method. The crib comprises
Analysis <strong>of</strong> <strong>feeds</strong> <strong>and</strong> <strong>fertilizers</strong> <strong>for</strong> <strong>sustainable</strong> aquaculture development in Kenya 427<br />
about 10 percent <strong>of</strong> total pond size <strong>and</strong> is loaded with<br />
vegetation that rots <strong>and</strong> gradually releases nutrients<br />
into the water. The crib compost is turned weekly to<br />
facilitate nutrient release. Alternatively a gunny bag is<br />
filled with 5-10 kg dry chicken or goat manure <strong>and</strong> tied<br />
to a corner <strong>of</strong> the pond. The bag is shaken frequently<br />
(once a week) to facilitate the release <strong>of</strong> nutrients. One<br />
bag is used per 200 m 2 <strong>and</strong> farmers are encouraged to<br />
add manure on a weekly or <strong>for</strong>tnightly basis.<br />
Manuring rate depend on the size <strong>of</strong> the pond.<br />
Maximum recommended application rates are 50 g <strong>of</strong><br />
dry manure per square metre per week (5 kg/100 m 2 /<br />
week). Most farmers do not weigh the manure they use in their ponds, but measure<br />
turbidity to regulate their manuring schedule by monitoring algal blooms <strong>and</strong> using<br />
Secchi disk depth. Ponds are fertilized when Secchi disk depth exceeds 15 cm.<br />
Chemical <strong>fertilizers</strong> are only used by commercial farmers who practice semi-intensive<br />
aquaculture in ponds. The fertilizer is dissolved in a bucket <strong>of</strong> water <strong>and</strong> the solution<br />
sprinkled onto the water surface at various localities. Application rates <strong>for</strong> DAP <strong>and</strong><br />
Urea are 2 g/m 2 /week (15 tablespoonfuls/100 m 2 /week) <strong>and</strong> 3 g/m 2 /week (about 30<br />
tablespoonfuls/100 m 2 /week), respectively. This combination <strong>of</strong> DAP <strong>and</strong> Urea is<br />
equivalent to 20 kg N/ha/week <strong>and</strong> 8 kg P/ha/week. These rates are recommended <strong>for</strong><br />
warmer areas, whereas in cooler areas half the rate is applied.<br />
To reduce pond acidity, commercial farmers apply agricultural lime to earthen<br />
ponds. Lime is applied at a rate <strong>of</strong> 20 g/100 m 2 <strong>for</strong> red soil, whereas black cotton soil<br />
may require more. One week after application the ponds are filled with water.<br />
3. ANALYSIS OF FEEDS AND FEEDING<br />
3.1 Availability <strong>of</strong> feed ingredients<br />
As mentioned earlier the major cereals produced include, maize, wheat, rice, sorghum,<br />
millet <strong>and</strong> barley among others, <strong>and</strong> together with cassava, sweet potatoes <strong>and</strong><br />
soybeans these crops represent the major food<br />
crops farmed in Kenya (Table 6). These crops also<br />
<strong>for</strong>m the main staple foods <strong>of</strong> the population <strong>and</strong><br />
there is little or no surplus <strong>for</strong> the animal feed<br />
industry (MOA, 2004). It is estimated that feed<br />
manufactures use about 450 000 tonnes <strong>of</strong> raw<br />
materials annually, worth about 6 billion Kenya<br />
Shillings. Approximately 2 200 tonnes <strong>of</strong> omena<br />
fishmeal 1 is imported from Tanzania to support<br />
the local industry (AKEFEMA, 2005). The wheat<br />
deficit is imported from Pakistan, Russia <strong>and</strong><br />
the United States <strong>of</strong> America (Table 7). Kenya<br />
TABLE 7<br />
Wheat production <strong>and</strong> import, 2000-2003<br />
Year Production<br />
(thous<strong>and</strong> tonnes)<br />
Production<br />
(% <strong>of</strong> total requirement)<br />
TABLE 5<br />
Price <strong>of</strong> organic <strong>and</strong> inorganic <strong>fertilizers</strong> in<br />
Kenya (2005)<br />
Fertilizer Cost (US$/kg)<br />
Di-ammonium phosphate (DAP) 0.50<br />
Triple super phosphate (TSP) 0.47<br />
Lime (CaCO3) 0.05<br />
Murate <strong>of</strong> potash 0.49<br />
Urea 0.44<br />
Calcium ammonium nitrate (CAN) 0.40<br />
Chicken manure (dry) 0.40<br />
Cattle manure 0.13<br />
Pig manure 0.06<br />
Source: Author’s survey (2006)<br />
TABLE 6<br />
Food crop production statistics (2002-2004)<br />
Production (tonnes)<br />
Crop 2002 2003 2004<br />
Maize 2 408 596 2 710 848 2 138 639<br />
Rice 45 099 40 502 49 295<br />
Millet 72 197 63 622 50 467<br />
Cassava 746 974 521 975 443 000<br />
Sweet potato 434 774 615 458 571 293<br />
Soybean * 779 653<br />
Sorghum 115 584 127 215 69 508<br />
Import<br />
(thous<strong>and</strong> tonnes)<br />
*Data not available.<br />
Source: MOA (2005)<br />
Import<br />
(% <strong>of</strong> total requirement)<br />
1 Fishmeal produced from silver cyprinid Rastrineabola argentea (locally known as omena), the second<br />
most important commercial fish species in Lake Victoria.<br />
Total<br />
(thous<strong>and</strong> tonnes)<br />
2000 74 10 636 90 710<br />
2001 82 12 617 88 699<br />
2002 60 10 515 90 575<br />
2003<br />
Source: MOA (2003)<br />
64 11 502 89 567
428<br />
<strong>Study</strong> <strong>and</strong> <strong>analysis</strong> <strong>of</strong> <strong>feeds</strong> <strong>and</strong> <strong>fertilizers</strong> <strong>for</strong> <strong>sustainable</strong> aquaculture development<br />
imports 98 percent <strong>of</strong> its vegetable oil<br />
requirement, mostly from Malaysia.<br />
The severe shortage <strong>of</strong> suitable feed<br />
ingredients continues to be a serious<br />
constraint faced by the animal feed<br />
industry (AKEFEMA, 2005).<br />
There are two rainy seasons in Kenya<br />
when crops are planted:<br />
• long season (April-July), crop<br />
planting takes place from March-<br />
April <strong>and</strong> harvesting is from July-<br />
September; <strong>and</strong><br />
• short season (October-December),<br />
crop planting takes place in<br />
October <strong>and</strong> harvesting is from<br />
January to February.<br />
FIGURE 1<br />
Supplementary feeding <strong>of</strong> tilapia with<br />
omena dust mixed with maize bran in<br />
Bondo, Western Kenya<br />
Agricultural by-products most frequently used as single fish <strong>feeds</strong> or as ingredients<br />
<strong>for</strong> compounded <strong>feeds</strong> include cereal bran (maize, wheat <strong>and</strong> rice) <strong>and</strong> oilseed cakes<br />
(cotton, soybean <strong>and</strong> sunflower). The quality <strong>of</strong> bran is highly variable <strong>and</strong> depends<br />
on the locality <strong>and</strong> the method <strong>of</strong> processing. For example, rice bran from Mwea Rice<br />
Factory had a crude protein content <strong>of</strong> approximately 10 percent (Veverica, Were <strong>and</strong><br />
Gichuri, 2002), however, after the collapse <strong>of</strong> the factory, other processors emerged<br />
<strong>and</strong> the rice bran obtained from these processors contained between 3-6 percent crude<br />
protein (Liti <strong>and</strong> Munguti , 2003). It was later observed that processors <strong>of</strong>ten mix their<br />
bran with milled rice husks thus reducing the protein content. Wheat bran obtained<br />
from industrial processors is <strong>of</strong> a more reliable quality with a crude protein content<br />
<strong>of</strong> 14-17 percent. Nonetheless, all <strong>of</strong> the materials mentioned above are marketed<br />
throughout the country <strong>for</strong> use as livestock feed, though availability depends on the<br />
season, the region <strong>and</strong> dem<strong>and</strong>.<br />
About 99.9 percent <strong>of</strong> the small-scale, non-commercial tilapia farmers in Kenya<br />
rely primarily on natural pond productivity with some supplementation <strong>of</strong> agricultural<br />
by-products as feed to increase yield (Figure 1). Most <strong>of</strong> the supplementary <strong>feeds</strong> are<br />
readily available <strong>and</strong> are not utilized as human food. The price <strong>of</strong> agricultural byproducts<br />
<strong>and</strong> other pond inputs is highly variable on a seasonal <strong>and</strong> a regional basis<br />
<strong>and</strong> this is illustrated in Table 8 <strong>and</strong> the average price <strong>of</strong> common fish feed ingredients<br />
or supplementary <strong>feeds</strong> is shown in Table 9.<br />
Fishmeal, bloodmeal, carcass meal, oilseed cakes <strong>and</strong> Lake shrimp (Caridina niloticus)<br />
are the main protein sources in farm-made aqua<strong>feeds</strong>. Fishmeal, in particular, is a scare<br />
commodity. Local production <strong>of</strong> fishmeal is shown in Table 10. The crude protein<br />
level <strong>of</strong> ingredients is <strong>of</strong>ten variable <strong>and</strong> care should be taken when incorporating<br />
TABLE 8<br />
Regional prices <strong>of</strong> pond inputs, 2004<br />
Commodity<br />
Nairobi Rift Valley Western<br />
Kenya<br />
Price (US$/tonne)<br />
Nyanza<br />
region<br />
Central<br />
Kenya<br />
Coastal<br />
region<br />
Wheat bran 100 80 90 90 100 120<br />
Maize bran 90 80 90 90 90 90<br />
Rice bran 90 100 100 80 80 90<br />
Cattle/sheep/goat manure 260 10 130 260 130 10<br />
Chicken manure 530 400 400 400 400 360<br />
Pig manure 60 60 60 60 60 60<br />
Lake shrimp 400 330–400 260 200 400 660<br />
Omena fishmeal 660–990 530–660 400–460 360 990 925–1 125<br />
Source: MLFD (2005)<br />
COURTESY OF DEVIN BARTLEY
Analysis <strong>of</strong> <strong>feeds</strong> <strong>and</strong> <strong>fertilizers</strong> <strong>for</strong> <strong>sustainable</strong> aquaculture development in Kenya 429<br />
TABLE 9<br />
Price <strong>of</strong> locally available feed <strong>and</strong><br />
ingredients, 2004<br />
Ingredient Cost<br />
(US$/kg)<br />
Rice bran 0.08<br />
Maize bran 0.09<br />
Wheat bran 0.13<br />
Brewers waste 0.03<br />
Cotton seed cake 0.26<br />
Groundnut cake 0.40<br />
Blood meal (raw) 0.03<br />
Fishmeal 0.53<br />
Grower mash 0.24<br />
Layer mash 0.24<br />
Dairy meal 0.22<br />
Pig finisher 0.19<br />
Source: MLFD (2005)<br />
these ingredients into <strong>feeds</strong>. For example, the crude<br />
protein content <strong>of</strong> Lake shrimp varies depending<br />
on season, fishing area <strong>and</strong> h<strong>and</strong>ling from 40 to<br />
60 percent. Other high protein resources used<br />
on ornamental fish farms <strong>and</strong> catfish <strong>and</strong> tilapia<br />
hatcheries include liver, egg yolk, Artemia, rotifers<br />
or other zooplankton <strong>and</strong> powdered (skimmed)<br />
milk.<br />
Vegetable oils from cotton seed <strong>and</strong> soybeans<br />
are the main sources <strong>of</strong> lipids in fish <strong>feeds</strong>, while<br />
cassava starch is <strong>of</strong>ten used as a binder.<br />
Vitamins <strong>and</strong> mineral premixes are only included<br />
in commercially manufactured <strong>feeds</strong>. The use <strong>of</strong><br />
pigment enhancing feed additives is restricted to a<br />
few ornamental fish producers who use naturally<br />
occurring material e.g. carotene from carrots, sweet<br />
potato <strong>and</strong> cassava leaves. However, the qualitative <strong>and</strong> quantitative use <strong>of</strong> these<br />
materials is not documented. There is no documented use <strong>of</strong> preservatives in fish <strong>feeds</strong><br />
in Kenya. The proximate composition <strong>of</strong> some <strong>of</strong> the more common supplementary<br />
<strong>feeds</strong> or ingredients is provided in Table 11.<br />
TABLE 10<br />
Fishmeal production <strong>and</strong> import, 2005<br />
Type Local Production<br />
(tonnes)<br />
Source <strong>of</strong> raw materials Price<br />
(Ksh/kg)<br />
Marine 7 Tuna waste (head, tail,<br />
bones, skin <strong>and</strong> gut)<br />
Freshwater 15 Nile perch waste<br />
(head, tail, bones,<br />
skin <strong>and</strong> gut)<br />
15 587 Omena, Rastrineobola<br />
argentea<br />
NA = not applicable<br />
Source: Wananchi Marine Products (K) Ltd, W.E Tilley (M) Ltd <strong>and</strong> AKEFEMA (pers. comm.)<br />
Import Cost<br />
(Ksh/kg)<br />
18 Nil NA<br />
25 Nil NA<br />
30 2 200 110<br />
TABLE 11<br />
Proximate composition <strong>of</strong> major feed ingredients (percent by weight, as fed basis)<br />
Ingredient Crude protein Crude lipid Crude fibre<br />
Wheat middling 15.0 4.2 7.0<br />
Wheat bran 13.0 3.7 12.0<br />
Maize bran 7.5 6.0 10.0<br />
Maize germ meal, solvent extracted 16.0 1.7 5.5<br />
Maize germ cake, expeller 14.0 14.0 4.3<br />
Maize gluten meal 23.0 5.0 4.0<br />
Molasses (cane) 3.0 - -<br />
Groundnut oilcake 22.0 14.0 9.5<br />
Soybean oilcake (imported) 45.0 7.5 -<br />
Soybean meal (imported) 50.0 1.4 -<br />
Cottonseed oilcake (imported) 38.0 5.8 18.0<br />
Sunflower seed oilcake (imported) 35.0 14.0 20.0<br />
Rice bran, mechanically extracted 12.0 4.5 -<br />
Brewers dried yeast 45.0 1.2 3.9<br />
Fodder yeast 30.0 - -<br />
Omena fishmeal 58.0 15.0 0.1<br />
Nile perch fishmeal 53.0 15.0 -<br />
Fishmeal (imported) 58.0 15.0 -<br />
Source: College <strong>of</strong> Agriculture <strong>and</strong> Veterinary Sciences, Department <strong>of</strong> Food Technology <strong>and</strong> Nutrition (2005, pers.<br />
comm.)
430<br />
<strong>Study</strong> <strong>and</strong> <strong>analysis</strong> <strong>of</strong> <strong>feeds</strong> <strong>and</strong> <strong>fertilizers</strong> <strong>for</strong> <strong>sustainable</strong> aquaculture development<br />
TABLE 12<br />
Ingredients <strong>of</strong> plant <strong>and</strong> animal origin commonly used as aquafeed in Kenya<br />
Type <strong>of</strong> ingredients Form in which<br />
fed to fish<br />
Leaves<br />
cassava,<br />
arrowroot,<br />
sweet potato,<br />
Titonia<br />
Leaves<br />
Sesbania,<br />
Leucaena,<br />
Cassia<br />
Cereal by-products<br />
Maize bran<br />
Rice bran<br />
Wheat bran<br />
Chopped or whole or added<br />
to pellets (dried <strong>and</strong> ground,<br />
inclusion rate <strong>of</strong> 20–30%).<br />
Leaves only, seeds are not<br />
used as they are toxic.<br />
Fed as is or soaked in fresh<br />
blood then dried, ground<br />
then pelleted. Can be<br />
included in pellets at<br />
50–70% depending on<br />
quality <strong>of</strong> main protein<br />
source included e.g.<br />
fishmeal.<br />
Nutritional<br />
value<br />
Excellent source <strong>of</strong> Vitamins, A,<br />
B1, B2, C <strong>and</strong> niacin. Crude protein<br />
levels, 4.6%–7.0%. Carotene helps<br />
give colour to trout flesh <strong>and</strong><br />
ornamental fish.<br />
Good source <strong>of</strong> vitamins <strong>and</strong><br />
protein.<br />
Inclusion levels: sesbania-26%,<br />
leucaena-20%.<br />
Also used as fertilizer. The leaves<br />
once decomposed make good<br />
compost<br />
Good energy source; moderate<br />
protein.<br />
Maize bran-energy 1 424 kJ/g,<br />
CP=11%.<br />
Rice bran-energy 1 407 kJ/g,<br />
CP=10.9%.<br />
Wheat bran-energy 1 344 kJ/g,<br />
CP=14–17%.<br />
Maize germ Fed as is or soaked in blood. Higher protein than bran; good<br />
energy source<br />
Wheat pollard Very finely ground so<br />
<strong>of</strong>ten included in pellets;<br />
inclusion rate depends on<br />
main protein source e.g.<br />
fishmeal <strong>and</strong> can be as high<br />
as 60–75%. Rarely fed alone<br />
as powder.<br />
Oilseed cakes<br />
Soybean<br />
Sunflower<br />
Sesame<br />
Cottonseed<br />
Animal waste<br />
Slaughter-house waste<br />
or animal by-products<br />
or fish wastes<br />
Insects<br />
termites, white ants<br />
locusts, maggots,<br />
silkworm larvae<br />
Industrial waste:<br />
Brewers waste<br />
Cake made by pressing,<br />
contain more fats <strong>and</strong> less<br />
protein than cakes made by<br />
solvent extraction.<br />
Can be put directly into<br />
pond. Large pieces should<br />
be chopped.<br />
CP= crude protein; CL=crude lipid<br />
Source: Veverica, Were <strong>and</strong> Gichuri (2002)<br />
Target fish species<br />
Tilapias, common carp<br />
after the leaves have<br />
decomposed. Trout to a<br />
lesser extent <strong>and</strong> mainly<br />
<strong>for</strong> carotenoids.<br />
Mainly tilapias, other fish<br />
benefit from the fertilizer<br />
effect.<br />
Tilapias, catfishes, carps.<br />
Tilapias, carps, catfishes.<br />
Good energy source. CP=13.2% Tilapias, catfishes, carps.<br />
Also a major component<br />
<strong>of</strong> trout <strong>feeds</strong>.<br />
Excellent protein <strong>and</strong> energy<br />
sources. Can get mouldy or become<br />
rancid if improperly stored.<br />
CP=45–60%, Lipid=1–7%<br />
Excellent protein <strong>and</strong> mineral<br />
source. Some kind <strong>of</strong> animal or fish<br />
product are usually good if fish are<br />
reared in cages. Rich in vitamin B 12.<br />
CP=48–50%<br />
CL=10–14%<br />
Fresh or dried. Excellent energy source; high<br />
protein.<br />
Silkworm- CP=55–75%,CL= 15–30%,<br />
Termites (dried)-CP=35.7%,<br />
Termites(raw)- CP=38%<br />
Wet or dried. Can be put<br />
directly into pond.<br />
CP=10.7% Catfishes<br />
Tilapias, catfishes, carps.<br />
Especially <strong>for</strong> catfishes<br />
<strong>and</strong> also <strong>for</strong> tilapias <strong>and</strong><br />
trout.<br />
Trout, tilapias, catfishes,<br />
carps.<br />
Farmers in Kenya use a wide variety <strong>of</strong> supplementary <strong>feeds</strong> (Table 12) <strong>and</strong> these<br />
also vary by season <strong>and</strong> region.<br />
3.2 Feed <strong>for</strong>mulations <strong>and</strong> manufacturing<br />
Compounded pellets in Kenya are only available <strong>for</strong> rainbow trout <strong>and</strong> Nile tilapia<br />
(Table 13). From 2000 to July 2004, Lafarge Ecosystems (<strong>for</strong>mally Baobab Tilapia<br />
Farm) <strong>for</strong>mulated <strong>and</strong> made their own <strong>feeds</strong> <strong>and</strong> then contracted Atta Kenya Ltd.<br />
in Mombasa to make a feed based on their <strong>for</strong>mulation. Unga Limited also produces<br />
compounded <strong>feeds</strong> <strong>for</strong> Nile tilapia but only <strong>for</strong> orders <strong>of</strong> not less than one tonne/year<br />
(Table 13).<br />
It should be noted that the diets <strong>for</strong>mulated <strong>for</strong> pigs <strong>and</strong> poultry are also successfully<br />
used as alternate <strong>feeds</strong> <strong>for</strong> Nile tilapia <strong>and</strong> North African catfish, Clarias gariepinus,<br />
either as single <strong>feeds</strong> or mixed with Lake shrimp.
Analysis <strong>of</strong> <strong>feeds</strong> <strong>and</strong> <strong>fertilizers</strong> <strong>for</strong> <strong>sustainable</strong> aquaculture development in Kenya 431<br />
TABLE 13<br />
Trout <strong>and</strong> tilapia pellet production (2004–2005)<br />
Feed Production (tonnes) Cost (Ksh/tonne)<br />
2004 2005 2004 2005<br />
Trout pellet (Tam<strong>feeds</strong>) 45 45 35 000 41 000<br />
Tilapia pellet, Atta Kenya Ltd. 59 17 000 17 000<br />
Tilapia pellet, Unga Ltd.<br />
(made-to-order)<br />
* * 30 000 30 000<br />
*No orders received during the period<br />
Source: Lafarge Eco Systems, Tam<strong>feeds</strong> Limited <strong>and</strong> Unga Limited (pers. comm.)<br />
TABLE 14<br />
Industrial <strong>and</strong> farm made fish feed <strong>for</strong>mulations in Kenya<br />
Trout pellets<br />
(composition not<br />
available)<br />
Industrial<br />
tilapia pellets<br />
Farm-made tilapia<br />
feed (Western<br />
Kenya)<br />
Farm-made catfish<br />
feed (Western<br />
Kenya)<br />
Catfish feed-<br />
(Moi University)<br />
Knowledge <strong>of</strong> the nutritional requirements <strong>of</strong> various fish species <strong>and</strong> technological<br />
advances in feed <strong>for</strong>mulation among the feed manufacturers <strong>and</strong> the fish farmers has<br />
increased considerably. Consequently, the development <strong>and</strong> use <strong>of</strong> farm-made <strong>and</strong><br />
<strong>for</strong>mulated <strong>feeds</strong> to supplement or to replace natural <strong>feeds</strong> has made rapid strides.<br />
Even though it is claimed in some quarters that there is an abundance <strong>of</strong> <strong>feeds</strong>tuffs <strong>and</strong><br />
although farmers <strong>and</strong> hobbyists are now able to <strong>for</strong>mulate their own fish <strong>feeds</strong> from<br />
locally available ingredients, the cost <strong>of</strong> these ingredients is <strong>of</strong>ten prohibitive.<br />
Most plant protein sources, apart from a few like soybean meal, do not comprise<br />
more than 25 percent <strong>of</strong> the diet. Cotton oilseed cake is included at a maximum <strong>of</strong><br />
10 percent (though 5 percent is advisable) due to gossypol <strong>and</strong> other growth inhibitors.<br />
Most commercial farms use cooked soybeans, which can be incorporated at levels as<br />
high as 42 percent <strong>of</strong> the diet. Table 14 shows some <strong>of</strong> the industrial <strong>and</strong> farm-made<br />
feed <strong>for</strong>mulations that are used in Kenya.<br />
Most <strong>feeds</strong> used in intensive production systems <strong>and</strong> in home aquaria are<br />
commercially produced dry <strong>feeds</strong>. These consist <strong>of</strong> simple mixtures <strong>of</strong> dry ingredients<br />
(mash or meal) to more complex compressed pellets or granules. Pellets are <strong>of</strong>ten<br />
broken into smaller crumbles. The only pellets produced in Kenya are sinking steam<br />
extruded pellets <strong>for</strong> tilapia <strong>and</strong> trout.<br />
Semi-moist <strong>and</strong> wet <strong>feeds</strong> are made from single or mixed ingredients, such as trash<br />
fish (though rarely), cooked legumes, rice bran, maize flour, wheat bran, brewers waste,<br />
soybeans, cotton <strong>and</strong> groundnut oilseed cake, bloodmeal, fishmeal or kitchen waste.<br />
After cooking they are shaped into cakes or balls, which are then fed to the fish. These<br />
<strong>feeds</strong> are made by a few farmers especially <strong>for</strong> feeding catfish.<br />
Farm-made <strong>feeds</strong> are prepared in various ways (Figure 2). Most farmers begin with<br />
milling the ingredients, mixing them to desired <strong>for</strong>mulations, adding warm water<br />
to make a moist dough <strong>and</strong> extruding the dough through a meat mincer. The moist<br />
“spaghetti” is chopped into small pellets <strong>and</strong> these are normally sun dried. Other<br />
Catfish feed<br />
(Sagana Fish Farm)<br />
Fishmeal Wheat pollard<br />
50%<br />
Fishmeal 40% Lake shrimp 80% Fishmeal 50% Lake shrimp 34%<br />
Wheat pollard Copra cake 17% Maize meal 60% Chicken<br />
growers mash<br />
20%<br />
Maize germ 15% Wheat bran 66%<br />
Soybean meal Cotton seed cake<br />
17%<br />
Cotton seed cake/<br />
sunflower seed<br />
cake 9%<br />
Wheat bran Fishmeal 16% Wheat bran 25%<br />
Calcium carbonate Vitamins/salt 1%<br />
Vitamin <strong>and</strong> mineral<br />
premix<br />
Yes ? ? Yes Yes<br />
? = in<strong>for</strong>mation not available<br />
Source: MLFD (2005)
432<br />
COURTESY OF M. MBUGUA<br />
<strong>Study</strong> <strong>and</strong> <strong>analysis</strong> <strong>of</strong> <strong>feeds</strong> <strong>and</strong> <strong>fertilizers</strong> <strong>for</strong> <strong>sustainable</strong> aquaculture development<br />
FIGURE 2<br />
A feed mill <strong>for</strong> production <strong>of</strong> farm-made aquafeed, Kirinyaga District, Central Province<br />
(left) <strong>and</strong> a locally assembled pelletizer at the Sagana fish farm, Kenya (right)<br />
farmers simply mix the dry ingredients <strong>and</strong> feed their fish with the mash, without<br />
further processing. Ingredients are obtained from feed stores, grocery stores <strong>and</strong> feed<br />
stores as well as from various feed manufacturing companies or millers.<br />
3.3 Feeding practices<br />
The basic feed management options employed in Kenya can be grouped into four<br />
categories:<br />
1. Zero input systems: The fish are entirely dependent on natural aquatic<br />
productivity. This <strong>for</strong>m <strong>of</strong> aquaculture is carried out by farmers practicing<br />
subsistence fish farming (non-commercial small-holder farmers). Yields range<br />
between 0.5 <strong>and</strong> 1.5 tonnes/ha/year. The majority (67 percent) <strong>of</strong> fish farmers<br />
practice this option <strong>and</strong> contribute about 27 percent <strong>of</strong> the total aquaculture<br />
production in the country.<br />
2. Enhanced primary production systems: In these systems <strong>fertilizers</strong> are used to<br />
increase natural food production. About 75 percent <strong>of</strong> fish farmers in Kenya<br />
fertilize their ponds to some degree or other, either with organic or inorganic<br />
<strong>fertilizers</strong>.<br />
3. Supplementary feed systems: In these systems an external feed is provided to<br />
supplement natural productivity. This type <strong>of</strong> management is practiced by smallscale<br />
commercial fish farmers who fertilize their ponds with organic manure <strong>and</strong><br />
also feed their fish with milled animal <strong>feeds</strong> (e.g. growers mash, maize, wheat <strong>and</strong><br />
rice bran or dairy meal). Farmers who practice this option obtain yields <strong>of</strong> up to<br />
15 tonnes/ha/year.<br />
4. Complete feed systems: Fish are provided with a “nutritionally complete” diet<br />
in pellet or moist dough <strong>for</strong>m. Tilapia pellets contain 25 percent protein <strong>and</strong><br />
5 percent lipid. Trout grower pellets contain 38 percent protein <strong>and</strong> starter<br />
crumbles have a crude protein content <strong>of</strong> 50 percent. Production under these<br />
conditions varies between 10 <strong>and</strong> 80 tonnes/ha/year. In intensive systems, tilapia<br />
has the advantage in that they can be fed a prepared feed that includes a high<br />
percent <strong>of</strong> plant proteins, while North African catfish requires some fishmeal<br />
in the diet <strong>for</strong> optimal growth. Complete diets are used in all intensive systems<br />
(concrete raceways <strong>and</strong> circular tanks) as well as in recirculation hatcheries.<br />
Complete diets are also used under high density cage culture conditions (e.g.<br />
Dominion Farms in Western Kenya). Sagana Fish Farm, in collaboration with<br />
Moi University, is actively undertaking research on feed <strong>for</strong>mulations using local<br />
ingredients.<br />
In intensive systems, fish are fed twice a day (morning <strong>and</strong> afternoon) but younger<br />
fish are fed more frequently. In semi-intensive systems the fish are fed once daily.
Analysis <strong>of</strong> <strong>feeds</strong> <strong>and</strong> <strong>fertilizers</strong> <strong>for</strong> <strong>sustainable</strong> aquaculture development in Kenya 433<br />
TABLE 15<br />
Feeding frequencies, ration <strong>and</strong> FCR under different culture systems. All fish in Kenya are fed manually<br />
Culture system Species Ration Feeding frequency FCR<br />
Intensive Tilapia (Lafarge<br />
Ecosystems)<br />
Tilapia in cages<br />
(Dominion Farms)<br />
Table 15 provides an insight into fish feeding methods in Kenya under different culture<br />
conditions.<br />
3.4 Feed storage<br />
Manufactured <strong>feeds</strong> as well as farm-made <strong>feeds</strong> with a high lipid <strong>and</strong> protein content<br />
are highly perishable <strong>and</strong> should be stored under optimal conditions to minimize<br />
losses. Only the larger commercial farms have the appropriate infrastructure <strong>for</strong> bulk<br />
storage <strong>of</strong> <strong>feeds</strong> or feed ingredients. There is a need to in<strong>for</strong>m smaller farmers <strong>of</strong> best<br />
feed storage practices.<br />
3.5 Review <strong>of</strong> the development <strong>of</strong> the animal <strong>and</strong> aquafeed industries<br />
The most important <strong>and</strong> recent developments in the feed manufacturing industry has<br />
been the <strong>for</strong>mation <strong>of</strong> the Association <strong>of</strong> Kenya Feed Manufacturers (AKEFEMA) in<br />
2003 under the umbrella <strong>of</strong> the Kenya Association <strong>of</strong> Manufacturers (KAM), which<br />
is the country’s leading representative industrial organisation. KAM’s mission is to<br />
promote competitive local manufacturing in a liberalised market.<br />
Currently, there are about 80 active, registered / licensed small <strong>and</strong> large feed<br />
manufacturers, which use about 450 000 tonnes <strong>of</strong> raw materials. In 2005, the value <strong>of</strong><br />
the products used by the animal feed industry was estimated at Ksh 6 billion. Omena<br />
(Rastrineobola argentea) represents about 6.6 percent <strong>of</strong> the raw materials by volume,<br />
which is equivalent to approximately 30 000 tonnes.<br />
There are 17 large feed manufacturers<br />
in Kenya. The feed manufacturers<br />
declined to provide the necessary<br />
in<strong>for</strong>mation on the capacity <strong>of</strong> feed<br />
production as they considered this<br />
to be confidential <strong>and</strong> so the exact<br />
capacity <strong>of</strong> feed manufacturers could<br />
not be established. Total animal feed<br />
production in Kenya during 2004/5<br />
was 466 151 tonnes, with poultry feed<br />
comprising 55 percent, pig 7 percent,<br />
cattle concentrates 35 percent <strong>and</strong><br />
3 percent others such as pet, horse<br />
<strong>and</strong> rabbit feed (see Table 16 <strong>for</strong> the<br />
proximate composition <strong>of</strong> the major<br />
animal <strong>feeds</strong>).<br />
The “fishmeal-based” animal <strong>feeds</strong><br />
industry in Kenya was developed<br />
15 kg/day <strong>for</strong><br />
8 000 average weight 100 g fish<br />
Trout 3.5 kg/day <strong>for</strong> 50 kg <strong>of</strong> fingerlings<br />
50 kg/day <strong>for</strong> 1 ton <strong>of</strong> fish<br />
Semi-Intensive Tilapia Shrimps/maize meal 0.4 kg/day <strong>for</strong><br />
25 kg <strong>of</strong> fish<br />
Every hour, due to flowthrough<br />
water system<br />
2.2 kg/day <strong>for</strong> 120 kg fish 2 x per day 2.2:1<br />
2:1<br />
Fry are fed hourly till satiation.<br />
Mature fish are fed 2/day<br />
2:1<br />
1x per day 2:1<br />
Catfish 0.4 kg/day <strong>for</strong> 20 kg <strong>of</strong> catfish 1x per day 2:1<br />
Gold fish 3 kg/day (5 ,000 fishes) 2x per day (morning &<br />
afternoon)<br />
Source: Lafarge Ecosystems, Dominion Farms Catfish <strong>and</strong> Tilapia Farmers in Western Kenya (2005, pers. comm.)<br />
TABLE 16<br />
Proximate composition <strong>of</strong> the major animal <strong>feeds</strong> in Kenya<br />
Feed<br />
Composition<br />
Crude protein Crude lipid Crude fibre<br />
Chick & duck mash/crumbles 18.0 6.0 6.0<br />
Growers mash/pellets 15.5 5.0 6.0<br />
Layers complete meal/pellets 17.0 6.0 6.0<br />
Broiler starter mash/crumble 18.8 7.0 5.0<br />
Broiler finisher mash/pellets 17.5 5.0 4.5<br />
Sow & weaner meal/cubes 17.5 4.5 6.5<br />
Pig finishing meal 15.0 6.0 6.5<br />
Calf early weaner pellets 17.0 5.0 6.5<br />
Young stock meal/pencils 16.0 5.0 6.0<br />
Dairy meal/cubes 15.0 4.0 6.5<br />
Unga tilapia pellet 25.0 5.0 6.0<br />
Tam<strong>feeds</strong> trout crumble 50.0 12.0 -<br />
Tam<strong>feeds</strong> trout pellet 38.0 9.0 -<br />
Source: College <strong>of</strong> Agriculture <strong>and</strong> Veterinary Sciences, Department <strong>of</strong> Food<br />
Technology <strong>and</strong> Nutrition (2005, pers. comm.)<br />
-
434<br />
<strong>Study</strong> <strong>and</strong> <strong>analysis</strong> <strong>of</strong> <strong>feeds</strong> <strong>and</strong> <strong>fertilizers</strong> <strong>for</strong> <strong>sustainable</strong> aquaculture development<br />
during the last 10 years. This has generated an unprecedented dem<strong>and</strong> <strong>for</strong> the second<br />
most important commercial fish species in Lake Victoria, whole omena <strong>and</strong> its dust<br />
are used in animal feed production whereas the skeleton <strong>of</strong> Nile Perch is used <strong>for</strong><br />
fishmeal production. The development <strong>of</strong> the animal <strong>feeds</strong> <strong>and</strong> fishmeal industry has<br />
drastically reduced the quantity <strong>of</strong> whole omena <strong>and</strong> skeleton <strong>of</strong> Nile perch available<br />
<strong>for</strong> human consumption. In a 1997 survey, Abila <strong>and</strong> Jansen (1997) found that six<br />
animal feed manufacturing companies in Kenya were using about 70 percent <strong>of</strong> the<br />
omena catch to manufacture fishmeal, while another two companies were using<br />
60 percent <strong>of</strong> all Nile Perch skeletons available within the Lake region <strong>for</strong> fishmeal.<br />
This is in sharp contrast to the early 1990s when the entire omena catch was used <strong>for</strong><br />
human consumption.<br />
The dem<strong>and</strong> <strong>for</strong> local fishmeal by the animal feed industry cannot be met. This<br />
is because the omena <strong>and</strong> Nile perch fishmeal are high in protein <strong>and</strong> significantly<br />
cheaper than imported fishmeal. It is obvious, there<strong>for</strong>e, that more <strong>and</strong> more <strong>of</strong> the<br />
Nile perch skeletons <strong>and</strong> omena <strong>and</strong> perhaps other fish products are finding their way<br />
into the animal feed industry.<br />
As mentioned previously, only two aquaculture feed lines are commercially<br />
manufactured in Kenya. The tilapia pellet is manufactured as a dry 3 mm pellet using<br />
a commercial steam pelletizer (capacity 4 tonnes/hour) <strong>and</strong> an indoor pellet drier.<br />
Approximately 58.8 tonnes <strong>of</strong> tilapia pellets were produced by Atta Kenya Ltd.<br />
during 2005 (4.9 tonnes/month), with an ex-factory price <strong>of</strong> Ksh 17/kg). The trout<br />
starter crumble <strong>and</strong> grower pellet is manufactured by Tam<strong>feeds</strong> Ltd. <strong>for</strong> use on its<br />
own trout farms <strong>and</strong> <strong>for</strong> sale to other trout farmers in Kenya. The feed is produced as<br />
a moist pellet using a simple motorized meat extruder <strong>and</strong> dried outdoors; the pellet<br />
is composed <strong>of</strong> local ingredients (see Table 14). Approximately 45 tonnes <strong>of</strong> dry trout<br />
feed was produced by Tam<strong>feeds</strong> Ltd. during 2005 (at an ex-factory price <strong>of</strong> Ksh 41/kg.<br />
In 2005, a total <strong>of</strong> 104 tonnes <strong>of</strong> aqua<strong>feeds</strong> were produced by the <strong>for</strong>mal feed sector.<br />
Given that catfish farming is growing rapidly there is a need <strong>for</strong> the industry to develop<br />
a feed <strong>for</strong> this species.<br />
Currently, there are no quality st<strong>and</strong>ards <strong>and</strong> the industry is largely unregulated.<br />
However, this problem is now receiving the necessary attention. Feeds are basically<br />
<strong>for</strong>mulated on biological <strong>and</strong> economic considerations only.<br />
4. CONSTRAINTS TO SUSTAINABLE AQUACULTURE DEVELOPMENT<br />
Regional availability <strong>and</strong> accessibility <strong>of</strong> feed ingredients<br />
Fishmeal is more readily available in the Lake Victoria region than in other areas,<br />
whereas wheat bran is more readily available in some parts <strong>of</strong> the Rift Valley <strong>and</strong><br />
Central Province, than in other regions. Farm-made <strong>feeds</strong> are also not readily available<br />
<strong>and</strong> industrially manufactured tilapia <strong>and</strong> trout <strong>feeds</strong> are only available in Nakuru <strong>and</strong><br />
Nairobi. High transportation costs put many feed ingredients <strong>and</strong> <strong>feeds</strong> beyond the<br />
means <strong>of</strong> the majority <strong>of</strong> fish farmers in Kenya. Commercially manufactured diets <strong>and</strong><br />
high protein ingredients such as<br />
Omena <strong>and</strong> oilseed cake are too expensive <strong>for</strong> small-scale farmers. At present many<br />
potential feed resources still remain unexplored in Kenya. These include abattoir wastes<br />
(meat, bones, blood, hair, feathers, gastro-intestinal tracts, rumen contents), sugar cane<br />
factory wastes (bagasse), c<strong>of</strong>fee processing wastes (c<strong>of</strong>fee pulp), <strong>and</strong> occasionally corn<br />
mill sweepings.<br />
Storage<br />
Facilities <strong>for</strong> the storage <strong>of</strong> <strong>feeds</strong> or ingredients are generally inadequate on smallholder<br />
farms, either due to lack <strong>of</strong> knowledge or resources, resulting in a high degree<br />
<strong>of</strong> spoilage.
Analysis <strong>of</strong> <strong>feeds</strong> <strong>and</strong> <strong>fertilizers</strong> <strong>for</strong> <strong>sustainable</strong> aquaculture development in Kenya 435<br />
Feeding<br />
Feed application rates are highly variable. There is also lack <strong>of</strong> consistency in feeding.<br />
Feeding rates are not adjusted regularly as required.<br />
Dem<strong>and</strong><br />
The current estimated annual production <strong>of</strong> just over 1 000 tonnes <strong>of</strong> fish probably<br />
explains the undeveloped state <strong>of</strong> the aquafeed industry. Assuming a feed conversion<br />
ratio <strong>of</strong> 2.5:1, only 2 500 tonnes <strong>of</strong> feed would be required per annum. This is<br />
approximately 0.5 percent <strong>of</strong> current national animal feed production <strong>and</strong> is too little<br />
to justify any significant investment. Opportunities to develop the aquafeed industry<br />
are technically determined by the rate <strong>of</strong> development <strong>of</strong> aquaculture itself.<br />
Farm-made <strong>feeds</strong> tend to be <strong>of</strong> variable quality, depending on availability <strong>of</strong> byproducts<br />
on the market or from the farm. Overall, feed remains one <strong>of</strong> the biggest<br />
obstacles <strong>for</strong> the expansion <strong>of</strong> aquaculture in Kenya, especially in medium- <strong>and</strong><br />
large-scale production systems. Unless af<strong>for</strong>dable <strong>feeds</strong> can be provided, farm-raised<br />
fish products cannot compete with those from marine <strong>and</strong> inl<strong>and</strong> capture fisheries.<br />
In conclusion, there are significant challenges with respect to the availability <strong>of</strong> feed<br />
ingredients <strong>and</strong> <strong>feeds</strong>, accessibility, quality, <strong>and</strong> quantity that impede the development<br />
<strong>of</strong> the sector.<br />
5. RECOMMENDATIONS FOR IMPROVED UTILIZATION OF FERTILIZER AND<br />
FEED RESOURCES<br />
• The government must provide an enabling legislative environment <strong>for</strong> the<br />
<strong>sustainable</strong> <strong>and</strong> responsible development <strong>of</strong> the aquaculture sector.<br />
• There is an urgent need <strong>for</strong> increased collaboration within <strong>and</strong> between the private<br />
<strong>and</strong> public sectors engaged in aquaculture development activities, including<br />
research that addresses aquaculture feed technology <strong>and</strong> applied nutrition.<br />
• The Livestock Feeds Bill needs to be finalized by the Department <strong>of</strong> Livestock<br />
Production to facilitate the development <strong>of</strong> high quality aqua<strong>feeds</strong>.<br />
• The dissemination <strong>of</strong> in<strong>for</strong>mation to enhance supplementary feeding methods <strong>and</strong><br />
appropriate feed storage must be improved.<br />
• Training <strong>of</strong> technicians in feed technology <strong>and</strong> nutrient application.<br />
• Farmers with limited cash resources should be trained <strong>and</strong> encouraged to use<br />
low-cost agricultural by-products such as abattoir wastes, mill sweepings <strong>and</strong> rice<br />
bran.<br />
• Surveys <strong>of</strong> available feed resources should be undertaken on a district basis. This<br />
in<strong>for</strong>mation can be used to assist farmers to develop their own feeding strategies<br />
that will lead to improved fish production <strong>and</strong> optimal use <strong>of</strong> agricultural byproducts<br />
within the region.<br />
REFERENCES<br />
AKEFEMA (Association <strong>of</strong> Kenya Feed Manufacturers). 2005. Feed industry concerns<br />
on recent ban on fishing, distribution <strong>and</strong> use <strong>of</strong> omena. Kenya, Minister, Livestock <strong>and</strong><br />
Fisheries Development. 4 pp. (Memor<strong>and</strong>um).<br />
Liti, D. & Munguti, J. 2003. Utilization <strong>of</strong> Organic Resources in Fish Farming in Kenya.<br />
In Organic resource management in Kenya, perspectives <strong>and</strong> guidelines. FORMAT 2003<br />
(available at http://www.<strong>for</strong>matkenya.org/ormbook/Chapters/chapter6.htm).<br />
MLFD (Ministry <strong>of</strong> Livestock <strong>and</strong> Fisheries Development). 1999-2004. Fisheries annual<br />
statistics bulletin, <strong>of</strong> the department <strong>of</strong> fisheries. Nairobi, Government <strong>of</strong> Kenya.<br />
MLFD (Ministry <strong>of</strong> Livestock <strong>and</strong> Fisheries Development). 2004. Annual reports <strong>of</strong> the<br />
department <strong>of</strong> fisheries. Nairobi, Government <strong>of</strong> Kenya.<br />
MLFD (Ministry <strong>of</strong> Livestock <strong>and</strong> Fisheries Development). 2005. Annual reports <strong>of</strong> the<br />
department <strong>of</strong> fisheries. Nairobi, Government <strong>of</strong> Kenya.
436<br />
<strong>Study</strong> <strong>and</strong> <strong>analysis</strong> <strong>of</strong> <strong>feeds</strong> <strong>and</strong> <strong>fertilizers</strong> <strong>for</strong> <strong>sustainable</strong> aquaculture development<br />
MOA (Ministry <strong>of</strong> Agriculture). 2003. Annual report <strong>of</strong> the crop development division.<br />
Nairobi, Government <strong>of</strong> Kenya.<br />
MOA (Ministry <strong>of</strong> Agriculture). 2004. Annual report <strong>of</strong> the crop development division.<br />
Nairobi, Government <strong>of</strong> Kenya.<br />
MOA (Ministry <strong>of</strong> Agriculture). 2005. Annual report <strong>of</strong> the crop development division.<br />
Nairobi, Government <strong>of</strong> Kenya.<br />
Veverica, K., Were, E. & Gichuri, M. 2002. Aquaculture fact sheet, Sagana fish farm. 15<br />
pp. (unpublished)
Analysis <strong>of</strong> <strong>feeds</strong> <strong>and</strong> <strong>fertilizers</strong><br />
<strong>for</strong> <strong>sustainable</strong> aquaculture<br />
development in Malawi<br />
S.K. Chimatiro <strong>and</strong> B.B. Chirwa<br />
Department <strong>of</strong> Fisheries<br />
PO Box 593, Lilongwe<br />
Malawi<br />
Summary 438<br />
1. General overview <strong>of</strong> aquaculture <strong>and</strong> farming systems 439<br />
2. Review <strong>and</strong> <strong>analysis</strong> <strong>of</strong> <strong>fertilizers</strong>, <strong>feeds</strong> <strong>and</strong> feeding 440<br />
3. The animal feed manufacturing sector 447<br />
4. Resource availability <strong>and</strong> expansion <strong>of</strong> the aquaculture industry 449<br />
5. Recommendations 449<br />
References 450<br />
Chimatiro, S.K. <strong>and</strong> Chirwa, B.B. 2007. Analysis <strong>of</strong> <strong>feeds</strong> <strong>and</strong> <strong>fertilizers</strong> <strong>for</strong> <strong>sustainable</strong><br />
aquaculture development in Malawi. In M.R. Hasan, T. Hecht, S.S. De Silva <strong>and</strong> A.G.J.<br />
Tacon (eds). <strong>Study</strong> <strong>and</strong> <strong>analysis</strong> <strong>of</strong> <strong>feeds</strong> <strong>and</strong> <strong>fertilizers</strong> <strong>for</strong> <strong>sustainable</strong> aquaculture<br />
development. FAO Fisheries Technical Paper. No. 497. Rome, FAO. pp. 437–452.<br />
437
438<br />
<strong>Study</strong> <strong>and</strong> <strong>analysis</strong> <strong>of</strong> <strong>feeds</strong> <strong>and</strong> <strong>fertilizers</strong> <strong>for</strong> <strong>sustainable</strong> aquaculture development<br />
SUMMARY<br />
Aquaculture was introduced to Malawi in 1950 as a means to provide protein <strong>for</strong> human<br />
consumption. Despite several attempts to initiate commercial aquaculture between the<br />
mid 1970s <strong>and</strong> the late 1990s the sector continues to be mainly a small-scale activity.<br />
However, since 2003 significant investments have been made by the private sector to<br />
produce fish on a commercial scale. A cage culture operation has been set up in Lake<br />
Malawi to produce 3 000 tonnes <strong>of</strong> indigenous tilapia (chambo Oreochromis karongae<br />
<strong>and</strong> O. shiranus shiranus) <strong>and</strong> a 120 tonne per annum semi-intensive pond based farm<br />
(Mozambique tilapia O. mossambicus, common carp Cyprinus carpio <strong>and</strong> North African<br />
catfish Clarias gariepinus) has been successfully initiated in the Lower Shire valley.<br />
Small-scale, integrated pond culture prevails <strong>and</strong> at this stage accounts <strong>for</strong> 90 percent<br />
<strong>of</strong> the total aquaculture production. There are approximately 4 000 small-scale fish<br />
farmers, several <strong>of</strong> whom have become commercially orientated in recent years. There<br />
is uncertainty with regard to total fish production <strong>and</strong> estimates range from 50 to 800<br />
tonnes. Small-scale pond yields vary from 0.5–2.3 tonnes/ha/year, while commercial<br />
farmers realise approximately 10–12 tonnes/ha/year. The most common species in<br />
small-holder aquaculture is O. shiranus shiranus, though many small-scale farmers now<br />
prefer to grow redbreast tilapia (T. rendalli). The average pond size is around 200 m 2 <strong>and</strong><br />
stocking densities are low (2–3 fingerlings/m 2 ). The most commonly used feed is maize<br />
bran. The overwhelming majority <strong>of</strong> small-holder farmers in Malawi are resource limited<br />
<strong>and</strong> chemical <strong>fertilizers</strong> are not commonly used <strong>for</strong> pond fertilization <strong>and</strong> as such, most<br />
use vegetable compost cribs in their ponds. The use <strong>of</strong> animal manure (chicken, pig, goat<br />
<strong>and</strong> cattle) is restricted due to inadequate purchasing power, high transportation cost <strong>and</strong><br />
inadequate storage facilities. Hence, farmers do not have access to sufficient quantities <strong>for</strong><br />
optimum pond fertilization <strong>and</strong> production.<br />
While suitable agricultural products <strong>and</strong> by-products such as maize bran, oilseed<br />
cakes, carcass meal are available all year round, competition from the poultry feed<br />
industry is intense <strong>and</strong> most farmers are unable to purchase <strong>and</strong> use them. On-farm<br />
agricultural by-products such as maize bran, green vegetables, high protein leaves, fruit<br />
<strong>and</strong> kitchen waste are the principal <strong>feeds</strong> used in small-holder aquaculture. The seasonal<br />
availability <strong>of</strong> farm by-products is dictated by the agricultural calendar.<br />
The poultry feed industry is reasonably well developed, annually producing in<br />
excess <strong>of</strong> 100 000 tonnes. Fishmeal, soybean <strong>and</strong> oilseed cake production does not meet<br />
the industry’s dem<strong>and</strong> <strong>and</strong> are mainly imported; hence fish <strong>feeds</strong> are not made on a<br />
commercial basis, although one company supplies <strong>for</strong>mulated concentrates <strong>and</strong> a small<br />
quantity <strong>of</strong> pellets. Presently, the two commercial farms <strong>and</strong> some <strong>of</strong> the small-scale<br />
commercial farmers <strong>for</strong>mulate, compound <strong>and</strong> manufacture their own farm-made <strong>feeds</strong>.<br />
Feed <strong>for</strong>mulations vary widely from complete diets to mixtures <strong>of</strong> chicken growers mash<br />
mixed with cooked soybean meal. Farm-made <strong>feeds</strong> range from stiff cooked porridge,<br />
moist dough, moistened <strong>for</strong>mulated mixtures to farm-made pellets. Feeding practices<br />
also vary widely. Non-commercial farmers feed their fish at irregular intervals, depending<br />
on the availability <strong>of</strong> resources <strong>and</strong> by-products. Commercial farmers, irrespective <strong>of</strong><br />
scale, feed their fish according to scheduled programmes depending on pond or cage<br />
biomass. Feeding practices also vary by region or district depending on the level <strong>of</strong><br />
extension <strong>and</strong> farmer knowledge.<br />
Problems <strong>and</strong> constraints facing the animal feed industry include the high cost <strong>of</strong><br />
transport, the per<strong>for</strong>mance <strong>of</strong> the agriculture sector, the capacity to store adequate<br />
quantities <strong>of</strong> ingredients by small-holder farmers <strong>and</strong> lack <strong>of</strong> farmer knowledge regarding<br />
the value <strong>of</strong> feeding fish.<br />
Malawi has recently developed <strong>and</strong> adopted a National Strategic Aquaculture Plan.<br />
For the aquaculture sector to grow requires the aggressive implementation <strong>of</strong> the<br />
strategic plan.
Analysis <strong>of</strong> <strong>feeds</strong> <strong>and</strong> <strong>fertilizers</strong> <strong>for</strong> <strong>sustainable</strong> aquaculture development in Malawi 439<br />
1. GENERAL OVERVIEW OF AQUACULTURE AND FARMING SYSTEMS<br />
Rural, small-scale fish farming in Malawi commenced in the late 1950s. From the<br />
early 1970s through to the mid-1990s, donor <strong>and</strong> NGO support played a major role<br />
in the development <strong>of</strong> the sector in Malawi. Consequently, small-scale fish farming is<br />
now widely practised throughout many parts <strong>of</strong> the country<br />
(Figure 1). Commercial fish farming began in 1906 with the<br />
introduction <strong>of</strong> rainbow trout (Onchorhynchus mykiss) <strong>for</strong><br />
angling purposes (Balarin, 1987). After a series <strong>of</strong> false starts <strong>and</strong><br />
failures the commercial sector now finally seems to be on the<br />
right track.<br />
Pond culture is the prevailing aquaculture practice in Malawi.<br />
Cage culture has only recently been introduced. The number <strong>of</strong><br />
fish farmers has increased from less than 100 in the 1960s to 2 000<br />
in 1997 (Dickson, Brooks <strong>and</strong> Sikawa,1997) <strong>and</strong> currently there<br />
are approximately 4 000 farmers<br />
(SSC, 2003; ADiM, 2005b). Most<br />
farmers have integrated fish<br />
farming with horticulture <strong>and</strong>/<br />
or animal husb<strong>and</strong>ry. The four<br />
major species cultured in Malawi,<br />
are chambo (Oreochromis<br />
karongae) <strong>and</strong> makumba (O.<br />
shiranus shiranus), redbreast<br />
tilapia (Tilapia rendalli) <strong>and</strong><br />
North African catfish (Clarias<br />
gariepinus). However, O. shiranus<br />
shiranus <strong>and</strong> Tilapia rendalli<br />
are the most popular species,<br />
accounting <strong>for</strong> over 90 percent <strong>of</strong><br />
total fish production (Table 1).<br />
O. shiranus shiranus is<br />
endemic to Lake Malawi <strong>and</strong> the<br />
Upper Shire River <strong>and</strong> is widely<br />
distributed amongst the natural<br />
water bodies <strong>and</strong> in fishponds in all<br />
parts <strong>of</strong> the country. It is the most<br />
common fish in Malawian fish<br />
ponds. Due to its early maturity,<br />
precocious breeding traits <strong>and</strong><br />
the poor farming conditions the<br />
species does not reach its growth<br />
<strong>and</strong> or production potential.<br />
The average weight <strong>of</strong> the fish in<br />
farmer ponds is 19.3 g (Range 6–<br />
140 g) (n=2 398) (ADiM, 2005b).<br />
Tilapia rendalli is becoming<br />
the most favoured aquaculture<br />
species in the country. This is<br />
because <strong>of</strong> its superior growth<br />
rate over O. shiranus shiranus,<br />
under the prevailing farming<br />
conditions, consumer dem<strong>and</strong><br />
<strong>and</strong> price.<br />
Remarks<br />
International Boundary<br />
Regional Boundary<br />
Fish Farming Intensity<br />
Large (
440<br />
TABLE 2<br />
Estimated aquaculture<br />
production in Malawi<br />
Year<br />
Production<br />
(tonnes)<br />
1995 200<br />
1996 210<br />
1997 250<br />
1998 340<br />
1999 550<br />
2000 640<br />
2001 750<br />
2002 800<br />
Source: NAC (2002)<br />
<strong>Study</strong> <strong>and</strong> <strong>analysis</strong> <strong>of</strong> <strong>feeds</strong> <strong>and</strong> <strong>fertilizers</strong> <strong>for</strong> <strong>sustainable</strong> aquaculture development<br />
Common carp (Cyprinus carpio) was introduced into<br />
Malawi in 1976, <strong>and</strong> is restricted to the Lower Shire<br />
catchment. The importation <strong>and</strong> distribution <strong>of</strong> carp was<br />
prohibited in 1992 <strong>and</strong> this is en<strong>for</strong>ced under the Fisheries<br />
Conservation <strong>and</strong> Management Act (1997). Rainbow trout<br />
continues to be farmed on the Zomba Plateau <strong>and</strong> some<br />
remnant populations occur on Mount Mulanje <strong>and</strong> some<br />
dams <strong>and</strong> rivers on the Nyika Plateau.<br />
The average fish farmer in Malawi has one or two<br />
fishponds with a mean size <strong>of</strong> approximately 200 m 2<br />
depending on l<strong>and</strong> availability (Figure 2), although some<br />
<strong>of</strong> the more progressive farmers have up to 18 ponds.<br />
Fishponds are usually stocked with fingerlings left over<br />
from the harvest or from other ponds on the farm. More <strong>of</strong>ten than not, this means that<br />
mature stunted fish with little scope <strong>for</strong> growth are mistakenly stocked as fingerlings.<br />
Ponds are stocked at 2 to 5 fish per m 2 depending on supply, availability, price <strong>and</strong><br />
transport (Brummett <strong>and</strong> Noble, 1995; ADiM, 2005b). Fishponds are fertilized using<br />
plant material in compost cribs or with poultry, goat <strong>and</strong>/or cattle manure <strong>and</strong> fish are<br />
fed with on-farm agricultural by-products, such as maize or rice bran, if available.<br />
Integrating aquaculture with agricultural is now a common practice amongst over<br />
2 500 farmers. A medium-scale pond farm (GK Aquafarms in the Lower Shire) <strong>and</strong><br />
a large-scale cage culture operation (MALDECO Aquaculture in Mangochi) were<br />
established in 2004. MALDECO Aquaculture aims to produce 3 000 tonnes <strong>of</strong> chambo<br />
(Oreochromis karongae <strong>and</strong>/or O. shiranus) per annum <strong>and</strong> GK Aquafarms produces<br />
around 120 tonnes <strong>of</strong> O. mossambicus <strong>and</strong> common carp per annum.<br />
There is some uncertainty with respect to total aquaculture production in Malawi.<br />
In 2002, the NAC estimated total production to be 800 tonnes (Table 2), while the<br />
ADiM project (ADiM, 2005a) estimated total production in 2003 to be between 50<br />
<strong>and</strong> 200 tonnes. The apparent over-estimation by NAC (2002) is attributed to the small<br />
sample size <strong>of</strong> farmers used <strong>for</strong> the estimation <strong>of</strong> mean yield <strong>and</strong> total production.<br />
Yields vary from 500–2316 kg/ha/year depending on the level <strong>of</strong> intensification, with<br />
an average yield <strong>of</strong> 1.4 tonnes/ha/year (ADiM, 2005a). This translates into an annual<br />
income <strong>of</strong> US$1 363 ha/year (approximately US$25 farmer/year).<br />
2. REVIEW AND ANALYSIS OF FERTILIZERS, FEEDS AND FEEDING<br />
All small-holder agricultural enterprises in Malawi are resource limited (ICLARM &<br />
GTZ 1991, ADiM, 2005a). As elsewhere, <strong>feeds</strong> <strong>and</strong> <strong>fertilizers</strong> are the most important<br />
inputs in commercial <strong>and</strong> non-commercial aquaculture. ARTDMIS (2005) demonstrated<br />
that production could be increased to 2000 kg/ha by optimising fertilization practices.<br />
However, higher production from small-holder fishponds is limited by the af<strong>for</strong>dability,<br />
availability <strong>and</strong> access to quality inputs (feed, manure <strong>and</strong> fertilizer). During the early<br />
1990s, Brummett <strong>and</strong> Noble (1995) estimated that only 27 percent <strong>of</strong> the pond nitrogen<br />
requirements were met in integrated aquaculture systems. There is no evidence to<br />
suggest that the situation has changed since then.<br />
2.1 Availability <strong>of</strong> <strong>fertilizers</strong>, feed ingredients <strong>and</strong> <strong>feeds</strong><br />
2.1.1 Chemical <strong>fertilizers</strong><br />
Fertilizer <strong>and</strong> feed availability are two major determinants <strong>of</strong> successful fish farming<br />
operations in Malawi (Masuda, Chirwa <strong>and</strong> Ntenjera, 2004). In fishponds, nitrogen<br />
<strong>and</strong> phosphorus are the most limiting nutrients; hence fish farmers in Malawi are<br />
encouraged to apply either inorganic or organic <strong>fertilizers</strong> depending on availability. The<br />
commonly available inorganic <strong>fertilizers</strong> are single, double or triple super phosphate,<br />
four NPK compounded <strong>fertilizers</strong> (A, B, C <strong>and</strong> D), di-ammonium phosphate (DAP),
Analysis <strong>of</strong> <strong>feeds</strong> <strong>and</strong> <strong>fertilizers</strong> <strong>for</strong> <strong>sustainable</strong> aquaculture development in Malawi 441<br />
TABLE 3<br />
Chemical composition <strong>of</strong> various <strong>fertilizers</strong><br />
Type <strong>of</strong> fertilizer<br />
Nitrogen Phosphorus<br />
Chemical composition<br />
Potassium Sulfur Boron<br />
NPK compound A 2 18 15 4 0.1<br />
NPK compound B 4 18 15 4 0.1<br />
NPK compound C 6 18 15 4 0.1<br />
NPK compound D 8 18 15 4 0.1<br />
Source: Ministry <strong>of</strong> Agriculture (2003)<br />
mono-ammonium phosphate (MAP) <strong>and</strong><br />
23:21:0+ 4S. The chemical compositions <strong>of</strong><br />
the NPK <strong>fertilizers</strong> are shown in Table 3.<br />
All chemical <strong>fertilizers</strong> used in Malawi<br />
are imported. The annual increase in<br />
fertilizer prices, over the past eight years is<br />
indicated in Table 4.<br />
However, inorganic <strong>fertilizers</strong> are<br />
rarely used in fish farming because <strong>of</strong><br />
the high unit price. Generally, smallholder<br />
farmers use chemical fertilizer at<br />
an average application rate <strong>of</strong> 70 kg/ha<br />
<strong>for</strong> crop farming, but do not apply any to<br />
their fishponds (Chimatiro, 1992; ADiM,<br />
TABLE 4<br />
Quantities <strong>of</strong> <strong>fertilizers</strong> <strong>and</strong> cost, imported by<br />
Malawi during 1998-2005<br />
2005a). The majority use animal manure to fertilize their fishponds at variable<br />
application rates, depending on availability.<br />
2.1.2 Organic <strong>fertilizers</strong><br />
Animal manure (chicken, goat, sheep <strong>and</strong> cattle) <strong>and</strong> compost are the most commonly<br />
used organic <strong>fertilizers</strong> in Malawian aquaculture. The nutritive values <strong>of</strong> chicken <strong>and</strong><br />
goat manure are presented in Table 5, though composition varies depending on source,<br />
processing <strong>and</strong> the manner in which it was stored. More recently, farmers have been<br />
encouraged to keep ducks around their fishponds <strong>and</strong> to keep their goats in pens, such<br />
that manure can be collected <strong>and</strong> applied to the ponds (Figure 2).<br />
The availability <strong>of</strong> manure was estimated from on-farm livestock populations. On<br />
a national basis, the livestock <strong>of</strong> each small-holder household generates approximately<br />
7 kg <strong>of</strong> wet manure on a daily basis (2.6 tonnes/year) or 4.39 kg/day (1.62 tonnes/year)<br />
<strong>of</strong> solid manure. Table 6 summarizes the average quantity <strong>of</strong> available manure.<br />
FIGURE 2<br />
Ducks kept within the enclosure <strong>of</strong> the fishpond <strong>for</strong> deposition <strong>of</strong> manure in the pond (left)<br />
<strong>and</strong> fish farmers collecting goat manure from a goat house to be applied to fishponds (right)<br />
Year<br />
Quantity<br />
(thous<strong>and</strong> tonnes)<br />
Unit cost<br />
(US$/tonne)<br />
1998 79.9 253.5<br />
1999 165.0 163.2<br />
2000 58.2 215.5<br />
2001 18.2 244.5<br />
2002 143.2 296.9<br />
2003 169.5 247.6<br />
2004 173.8 368.7<br />
2005* 200 465.6<br />
*Projected by the authors from fertilizer imports<br />
Source: ADiM (2005a)
442<br />
<strong>Study</strong> <strong>and</strong> <strong>analysis</strong> <strong>of</strong> <strong>feeds</strong> <strong>and</strong> <strong>fertilizers</strong> <strong>for</strong> <strong>sustainable</strong> aquaculture development<br />
TABLE 5<br />
Nutrient values (dry matter basis) <strong>of</strong> some farm manures in Malawi<br />
Manure type<br />
Nitrogen<br />
(g/kg)<br />
Phosphorus<br />
(g/kg)<br />
Dry matter<br />
proportion<br />
Organic<br />
matter proportion<br />
Goat manure 40.8 4.47 0.50 0.32<br />
Chicken manure 3.0 4.82 0.74 0.27<br />
Source: Brummett (1998)<br />
TABLE 6<br />
Average available manure per household<br />
Livestock<br />
species<br />
Total number *<br />
Number per<br />
household<br />
Live weight<br />
per animal (kg) **<br />
Wet manure/<br />
household/day<br />
(kg)**<br />
Solid waste/<br />
household/day<br />
(kg)**<br />
Cattle 764 061 0.33 210 4.21 2.91<br />
Goats 1 922 264 0.82 30 1.71 0.81<br />
Sheep 226 913 0.10 30 0.20 0.10<br />
Pigs 477 863 0.21 58 0.71 0.38<br />
Chickens 9 947 612 4.22 1.25 0.37 0.19<br />
Total 7.20 4.39<br />
Source: *Malawi Government (2005); **calculated from Aguilar-Manjarrez <strong>and</strong> Nath (1998) <strong>and</strong> Coche, Muir <strong>and</strong><br />
Laughlin (1996)<br />
Approximately 85.6 percent <strong>of</strong> fish farmers in Malawi are reported to regularly<br />
apply animal manure to their fishponds, although the quantities applied are too low<br />
to satisfy the nutrient requirements (ADiM, 2005a). In most cases it is difficult to<br />
collect the manure produced because most the animals are kept under free-range<br />
conditions. Alternatively, chicken manure could be purchased from commercial<br />
poultry farms. However, high transport costs (US$1.00 per km <strong>for</strong> loads <strong>of</strong> up to<br />
1 tonne), makes it difficult <strong>for</strong> rural fish farmers to access this resource. In a survey in<br />
the Southern region, Masuda, Chirwa <strong>and</strong> Ntenjera (2004) found that only 2 percent<br />
<strong>of</strong> farmers regularly purchased animal manure. Most fish farmers use compost made<br />
by regularly or irregularly adding grass <strong>and</strong> plant material in compost cribs in their<br />
ponds (Figure 3).<br />
FIGURE 3<br />
Composting crib using maize stalks<br />
2.1.3 Supplemental <strong>feeds</strong><br />
Maize bran is the most commonly<br />
available cereal by-product <strong>and</strong> is<br />
used by over 84 percent <strong>of</strong> fish<br />
farmers (Masuda, Chirwa <strong>and</strong><br />
Ntenjera, 2004). Its nutritive value<br />
varies depending on the milling<br />
process <strong>and</strong> contains 7–10 percent<br />
crude protein (Table 7).<br />
Chimatiro (1992) <strong>and</strong> Kapalamula<br />
(1993) developed comprehensive<br />
farming calendars <strong>for</strong> fish farms in<br />
Malawi (Table 8). Most fish farmers<br />
in Malawi commence their activities<br />
by preparing the garden during<br />
May by tilling the soil <strong>and</strong> planting<br />
occurs soon after the first rains in November or December.<br />
Where farmers integrate fish farming with agriculture a range <strong>of</strong> vegetables <strong>and</strong><br />
fruits are grown in beds adjacent to the ponds or on the pond dykes. These gardens,<br />
locally known as dimba gardens, produce relatively more food per hectare than other<br />
areas on the farm, because pond seepage keeps the soil moist all year round (Chimatiro,<br />
1992).
Analysis <strong>of</strong> <strong>feeds</strong> <strong>and</strong> <strong>fertilizers</strong> <strong>for</strong> <strong>sustainable</strong> aquaculture development in Malawi 443<br />
TABLE 7<br />
Proximate nutritional composition <strong>of</strong> the major fish feed ingredients (percent dry matter basis)<br />
Material Dry matter Crude protein Crude lipid Crude fibre Ash NFE* Source<br />
Maize bran germ 86.9 7.4 3.4 6.5 1.0 81.7 1<br />
Maize bran husk 87.7 7.1 4.1 15.3 1.9 71.6 1<br />
Maize bran 92.0 10.1 9.6 14.7 11.0 54.5 2<br />
Wheat bran 87.7 13.8 10.8 9.1 1.1 52.9 1<br />
Fishmeal 87.0 47.3 21.9 0.8 26.9 0.1 3<br />
Meat & bone meal 98.7 55.6 25.3 0.1 14.7 - 5<br />
Cotton seed oil cake - 19.5 10.4 8.2 3.7 - 5<br />
Sunflower oil seed cake 98.5 25.3 15.3 22.9 5.3 - 5<br />
Soybean 94.2 52.9 1.4 4.0 6.7 - 5<br />
Rice bran 91.0 14.0 - - - - 4<br />
NFE = Nitrogen free extract; - = data not available<br />
Source: (1) Metcalfe (1977), (2) Ohashi et al. (1999), (3) Masuda et al. (2004), (4) Mtimuni (1995), (5) Nyirenda et al. (2000)<br />
TABLE 8<br />
Agricultural calendar <strong>for</strong> typical small-holder farming systems in Malawi<br />
Month Main farming activities Agricultural by-product availability<br />
Oct Preparing maize fields, harvesting vegetables<br />
gardens, tending to tobacco nurseries.<br />
Nov Planting maize & tobacco, weeding, <strong>and</strong> fertilising<br />
maize crop.<br />
Dec & Jan Transplanting rice field.<br />
Planting yams, cassava, <strong>and</strong> sweet potatoes in<br />
maize fields.<br />
Weeding.<br />
Feb Harvesting tobacco & beans<br />
Weeding in maize field.<br />
Planting yams, cassava, <strong>and</strong> sweet potatoes in<br />
maize field.<br />
Mar Harvesting maize, beans, chillies & tobacco,<br />
selling sugarcane, Fertilising & weeding rice,<br />
sweet potatoes, cassava <strong>and</strong> vegetable garden<br />
preparation.<br />
Apr Harvesting maize, groundnuts, rice, <strong>and</strong> tobacco.<br />
Growing vegetables in nurseries.<br />
May & June Harvesting maize, ground nuts, sugarcane, rice,<br />
yams, cassava, sweet potatoes, sorghum <strong>and</strong><br />
tobacco.<br />
Selling sugarcane, maize, <strong>and</strong> groundnuts <strong>and</strong><br />
growing vegetables.<br />
July Growing vegetables.<br />
Harvesting cassava, sweet potatoes, sugarcane <strong>and</strong><br />
vegetable.<br />
Selling maize, rice sorghum, groundnuts & tobacco.<br />
Aug & Sept Growing vegetables, harvesting, selling rice, sweet<br />
potatoes & cassava <strong>and</strong> prepare maize fields.<br />
Source: Adapted from Chimatiro (1992) <strong>and</strong> Kapalamula (1993)<br />
Limited supply <strong>of</strong> organic <strong>fertilizers</strong> (compost) to<br />
fish ponds as most <strong>of</strong> it is applied to maize fields.<br />
Vegetable wastes available to feed Tilapia rendalli.<br />
Weeds available in limited supply as labour is<br />
committed to maize <strong>and</strong> tobacco growing <strong>and</strong><br />
distances between maize fields <strong>and</strong> fishponds.<br />
Limited supply <strong>of</strong> in organic fertilizer to fish ponds<br />
as most <strong>of</strong> it is applied to maize fields.<br />
Weeds available but limited in supply, as labour is<br />
committed to rice transplanting <strong>and</strong> growing <strong>of</strong><br />
other crops.<br />
Crop leaf matter from cassava, sweet potatoes are<br />
available.<br />
Weeds available but limited in supply, as labour is<br />
committed to rice transplanting <strong>and</strong> growing <strong>of</strong><br />
other crops. Crop leaf matter from cassava, sweet<br />
potatoes are available.<br />
Maize bran <strong>and</strong> vegetable leaf from cassava, sweet<br />
potatoes available.<br />
Selling <strong>of</strong> other crops e.g. sugarcane provides cash<br />
to buy maize bran.<br />
Maize bran <strong>and</strong> Vegetable leaf from cassava, sweet<br />
potatoes available.<br />
Selling <strong>of</strong> other crops e.g. sugarcane, assists to<br />
provide cash to buy maize bran.<br />
Peels <strong>and</strong> leaves <strong>of</strong> cassava <strong>and</strong> yams are available,<br />
maize bran, rice bran <strong>and</strong> pulses are plenty during<br />
this time <strong>and</strong> vegetable wastes available<br />
Maize bran, rice bran <strong>and</strong> pulses are plenty during<br />
this time.<br />
Peels <strong>and</strong> leaves <strong>of</strong> cassava <strong>and</strong> yams are available.<br />
Vegetable wastes available, Rice bran available,<br />
Maize bran scarce.<br />
Harvesting <strong>of</strong> most crops starts in April or May (Table 8). A range <strong>of</strong> on-farm<br />
pond inputs are available, such as over ripe fruit (bananas, paw paws, mangos),<br />
kitchen left-over, maize <strong>and</strong> rice bran, potato, cassava <strong>and</strong> coco yam leaves or peelings,<br />
vegetable leaves (cabbage, pumpkin), maize <strong>and</strong> rice bran as well as wild vegetation<br />
<strong>and</strong> termites.<br />
Availability <strong>of</strong> on-farm agricultural by-products is seasonal (Figure 4). More byproducts<br />
are available during <strong>and</strong> just after the rainy season than during the dry season,<br />
with an input-gap at the beginning <strong>of</strong> the rainy season when most <strong>of</strong> the arable l<strong>and</strong>s on the
444<br />
<strong>Study</strong> <strong>and</strong> <strong>analysis</strong> <strong>of</strong> <strong>feeds</strong> <strong>and</strong> <strong>fertilizers</strong> <strong>for</strong> <strong>sustainable</strong> aquaculture development<br />
TABLE 9<br />
Household <strong>and</strong> agricultural by-products<br />
produced on an average Malawian smallholder<br />
farm <strong>of</strong> 1.57 ha<br />
Material<br />
FIGURE 4<br />
Seasonal availability <strong>of</strong> pond inputs on small-holder fish farms in Zomba District,<br />
south Malawi<br />
Commodity<br />
Waste tomato<br />
Pawpaw<br />
Amaranthus<br />
Pumpkin leaf<br />
Potato<br />
Avocado<br />
Cowleaf pea<br />
Rice bran<br />
Commelina<br />
Guava<br />
Wood ash<br />
Mustard leaf<br />
Termites<br />
Kitchen leftovers<br />
Bran (maize & rice)<br />
Mar Apr May Jun Jul Aug Sep Oct Nov Dec Jan Feb<br />
Mar Apr May Jun Jul Aug Sep Oct Nov Dec Jan Feb<br />
Source: Chimatiro (1992)<br />
Quantity<br />
(kg)<br />
Approximate<br />
dry matter<br />
(kg)<br />
Firewood ash 438 438<br />
Maize bran 296 192<br />
Rice bran 54 35<br />
Rice straw 888 275<br />
Maize stover 2 513 2 262<br />
Weeds 1 595 494<br />
Total 5 784 3 696<br />
Source: Noble <strong>and</strong> Chimatiro (1991)<br />
farms are dry (Chimatiro, 1992). Maize bran<br />
is obtained from on-farm maize production<br />
or is purchased. The majority <strong>of</strong> rural fish<br />
farmers do not produce adequate amounts <strong>of</strong><br />
maize bran to feed their fish at recommended<br />
levels through out the production cycle.<br />
Maize bran is readily available from March<br />
to early August (Table 8). However, during<br />
the times <strong>of</strong> food shortage (usually between<br />
August <strong>and</strong> February), there is competition<br />
<strong>for</strong> maize bran since the bran is then also used<br />
<strong>for</strong> human consumption.<br />
Due to the increasing dem<strong>and</strong> <strong>for</strong> maize<br />
bran as an ingredient in livestock feed, small-<br />
scale farmers find it difficult to obtain adequate quantities during certain times <strong>of</strong><br />
the year. During such times alternative brans (rice <strong>and</strong> wheat) are used, though these<br />
commodities are now also in greater dem<strong>and</strong> by the local animal feed industry.<br />
Fishmeal <strong>and</strong> other agro-industrial by-products such as sunflower, cotton <strong>and</strong><br />
groundnut oilseed cake <strong>and</strong> abattoir by-products such as meat <strong>and</strong> bone meal are rarely<br />
used on small-holder fish farms. Realising the value good <strong>feeds</strong> some small-holder fish<br />
farmers have recently started growing soybeans as a feed ingredient. Except <strong>for</strong> GK<br />
Aquafarms, little use is made <strong>of</strong> pulses such as pigeon peas, cowpeas <strong>and</strong> chickpeas<br />
as feed ingredients. The available on-farm resources <strong>and</strong> their nutritive values are<br />
summarised in Tables 9 <strong>and</strong> 10.<br />
2.2 Feed management strategies<br />
Most fish farmers source their feed ingredients (mainly bran) during the harvest season<br />
when prices are lower. Fertilizers are difficult to obtain <strong>and</strong> if sourced, priority is<br />
given to crop production. Most fish farmers do not produce enough manure <strong>and</strong> the<br />
more progressive farmers purchase the required quantities. Because <strong>of</strong> it bulky nature,<br />
manure is difficult to store. Most farmers there<strong>for</strong>e purchase manure when required<br />
<strong>and</strong> apply it immediately (Masuda, Chirwa <strong>and</strong> Ntenjera, 2004).
Analysis <strong>of</strong> <strong>feeds</strong> <strong>and</strong> <strong>fertilizers</strong> <strong>for</strong> <strong>sustainable</strong> aquaculture development in Malawi 445<br />
TABLE 10<br />
Proximate composition <strong>of</strong> some household <strong>and</strong> on-farm resources in Malawi<br />
Material<br />
Nitrogen<br />
g/kg (DM)<br />
The amounts <strong>of</strong> manure <strong>and</strong> feed applied<br />
by the majority <strong>of</strong> fish farmers, or other<br />
technologies such as periphyton enhancement<br />
techniques (Jamu, Chaula <strong>and</strong> Hunga, 2003;<br />
Chirwa, 2003) are not adequate to achieve <strong>and</strong><br />
sustain optimum primary productivity <strong>and</strong> fish<br />
growth. Farmers are also encouraged to adopt<br />
technologies such as deepening their ponds to<br />
improve production <strong>and</strong> to reduce the rate <strong>of</strong><br />
seepage to retain nutrients (ARTDMIS, 2005).<br />
Phosphorus<br />
g/kg (DM)<br />
Dry matter Organic matter<br />
Nsima (maize porridge) left overs 91.0 - 0.23 0.05<br />
Watermelon 33.9 3.0 0.06 0.10<br />
Pumpkin, fruit 23.2 2.6 0.11 0.09<br />
Pumpkin, leaves 41.4 2.8 0.14 -<br />
Pumpkin, flowers 54.0 - 0.03 0.54<br />
Termites 600.0 - 0.50 -<br />
Napier grass 24.3 1.7 0.31 0.25<br />
Crotalaria 30.3 2.8 0.24 0.22<br />
Guava 15.0 - 0.12 -<br />
Coco-yam leaves 31.4 1.1 0.15 0.12<br />
Pea/bean pods 24.1 0.9 0.90 0.86<br />
Pigeon pea leaves 30.2 2.4 0.35 0.32<br />
Sweet potato leaves - 2.8 0.11 0.09<br />
Coatbuttons (Tridax procumbens) 119.0 - 0.14 -<br />
Cassava leaves 40.5 6.0 0.16 0.15<br />
Turnip tops 43.3 3.6 0.20 0.14<br />
Mixed grass 13.5 1.9 0.48 0.38<br />
Mango fruit 350.0 1.0 0.17 0.17<br />
Leucaena leaf 41.1 1.5 0.31 0.27<br />
Maize stovers 7.0 5.1 0.90 0.72<br />
DM = dry matter<br />
Source: Adapted from Brummett (1998)<br />
TABLE 11<br />
Compounded <strong>feeds</strong> <strong>for</strong> Clarias gariepinus<br />
Ingredient<br />
2.3 Feed <strong>for</strong>mulations<br />
Malawi does not have a <strong>for</strong>mal aquafeed *Lake sardine (Engraulicypris sardella)<br />
industry <strong>and</strong> given the size <strong>of</strong> the commercial Source: Ohashi et al. (1999); Ohashi et al. (2001)<br />
aquaculture sector the hesitancy by the animal<br />
feed industry to invest in this sector is underst<strong>and</strong>able. The Department <strong>of</strong> Fisheries,<br />
through the National Aquaculture Centre (NAC) has there<strong>for</strong>e developed several feed<br />
<strong>for</strong>mulations <strong>for</strong> catfish (Table 11), tilapia <strong>and</strong> carp (Table 12).<br />
Fry<br />
(%)<br />
Fingerlings &<br />
brood stock<br />
(%)<br />
Grow<br />
out<br />
(%)<br />
Usipa fishmeal* 50.0 30.0 20.0<br />
Meat & bone meal 12.5 15.0 15.0<br />
Bloodmeal 0.0 5.0 5.0<br />
Soybean meal (full fat) 15.0 22.0<br />
Maize bran 11.5 13.5<br />
Milk powder 10.0<br />
Wheat flour 25.0 22.0 22.0<br />
Vitamin mix 2.0 1.0 2.0<br />
Mineral mix 0.5 0.5 0.5<br />
TABLE 12<br />
Compounded <strong>feeds</strong> <strong>for</strong> broodstock <strong>and</strong> fingerlings <strong>of</strong> catfish, carp <strong>and</strong> tilapias<br />
Ingredient % Crude protein Crude lipid Ash Crude fibre NFE<br />
Fishmeal 30.0 13.1 12.4 2.5 14.9 0.7<br />
Meat <strong>and</strong> bone meal 15.0 3.1 2.6 1.3 5.1 0.1<br />
Blood meal 5.0 0.6 0.0 0.0 0.1 0.02<br />
Soya meal 15.0 2.2 4.5 5.6 0.9 1.8<br />
Wheat flour 22.0 2.0 1.4 1.8 0.6 11.3<br />
Maize bran 10.5 0.1 0.6 3.9 0.2 3.3<br />
Vitamin mix 2.0 0.0 0.0 0.0 0.04 0.02<br />
Mineral mix 0.5 0.0 0.0 0.0 0.01 0.00<br />
Total<br />
Source: NAC (2001)<br />
100.0 37.0 9.4 2.4 13.9 28.2
446<br />
<strong>Study</strong> <strong>and</strong> <strong>analysis</strong> <strong>of</strong> <strong>feeds</strong> <strong>and</strong> <strong>fertilizers</strong> <strong>for</strong> <strong>sustainable</strong> aquaculture development<br />
2.3.1 Feed preparation, cost <strong>and</strong> storage<br />
The largest commercial aquaculture project in Malawi purchases milled raw materials<br />
from a livestock feed manufacturing company. If necessary, the dry ingredients are<br />
milled to a smaller particle size, mixed with a binder <strong>and</strong> pelleted on the farm. The<br />
company is presently experimenting with various <strong>for</strong>mulations. Various size pellets are<br />
made according to requirements.<br />
GK Aquafarms sources ingredients from various quarters (farmers, importers<br />
<strong>and</strong> animal feed manufacturers), which are then milled, compounded <strong>and</strong> cooked<br />
<strong>and</strong> fed to the fish as moist feed balls or in per<strong>for</strong>ated bags, suspended in the<br />
water column. Both <strong>of</strong> the two large-scale operations have adequate feed storage<br />
facilities.<br />
A small number <strong>of</strong> innovative farmers have realised the value <strong>of</strong> <strong>for</strong>mulated <strong>feeds</strong><br />
<strong>and</strong> have been experimenting with feed <strong>for</strong>mulation. They similarly purchase feed<br />
ingredients such as soybeans (which are cooked or roasted), maize, dried fish (pounded<br />
to fishmeal), as well as maize <strong>and</strong> rice bran <strong>and</strong> manufacture their own pellets using<br />
home made pellet machines, such as plungers or meat mincers. Alternatively they<br />
purchase chicken mash <strong>and</strong> mix this with cooked soybean flour to make their pellets.<br />
There is one feed company in Malawi that manufactures a tilapia pellet. However,<br />
the feed is sub-optimal in terms <strong>of</strong> its <strong>for</strong>mulation, physical properties <strong>and</strong> price<br />
(ADiM, 2005b). MALDECO has taken the challenge to undertake joint research<br />
with the Department <strong>of</strong> Fisheries, University <strong>of</strong> Malawi’s Bunda College <strong>and</strong> the<br />
WorldFish Centre, to develop a feed <strong>for</strong>mulation using locally available ingredients <strong>and</strong><br />
a minimum quantity <strong>of</strong> fishmeal.<br />
The average labour cost to produce one tonne <strong>of</strong> farm-made feed has been estimated<br />
at about US$7.34 (Masuda et al., 2004), which is equivalent to around a weeks wage<br />
<strong>for</strong> a farm worker.<br />
2.3.2 Feeding methods, feeding frequency<br />
Chimatiro (1992) <strong>and</strong> Masuda, Chirwa <strong>and</strong> Ntenjera (2004) reported that cereal bran<br />
(maize <strong>and</strong> rice) (Figure 5) <strong>and</strong> manure are simply broadcast over the water surface,<br />
while waste fruits <strong>and</strong> vegetables as well as grass <strong>and</strong> maize stovers are placed into the<br />
pond cribs. The quantities applied depend on the availability <strong>of</strong> the materials <strong>and</strong> not<br />
on fish biomass. This makes it very difficult to establish exactly how much is applied.<br />
However, in a survey <strong>of</strong> a number <strong>of</strong> fish farmers in Zomba District, Chimatiro (1992)<br />
established that farmers applied bran <strong>and</strong> kitchen waste at a daily average <strong>of</strong> 1.05 <strong>and</strong><br />
0.07 kg/200 m 2 <strong>and</strong> 0.2 kg <strong>of</strong> manure/200 m 2 /day (Table 13).<br />
FIGURE 5<br />
A fish farmer in Zomba West applying<br />
maize bran to her fishpond – a very<br />
wasteful method <strong>of</strong> applying feed,<br />
emphasising the need <strong>for</strong> improved<br />
extension services<br />
TABLE 13<br />
Average quantities <strong>of</strong> inputs applied to<br />
fishponds in Zomba District, Malawi<br />
Resource<br />
Application rate<br />
(g/200 m2 /day)<br />
Cereal (maize & rice) bran 1 058.6<br />
Termites 122.6<br />
Waste vegetables 421.4<br />
Waste fruits 60.7<br />
Livestock manure 201.2<br />
Kitchen left-over 67.9<br />
Napier grass 183.0<br />
Compost 7.1<br />
Mushrooms 3.6<br />
Source: Adapted from Chimatiro (1992)
Analysis <strong>of</strong> <strong>feeds</strong> <strong>and</strong> <strong>fertilizers</strong> <strong>for</strong> <strong>sustainable</strong> aquaculture development in Malawi 447<br />
TABLE 14<br />
Feeding frequencies in southern<br />
Malawi<br />
Feeding frequency<br />
per day<br />
Percent <strong>of</strong><br />
farmers<br />
Less than once a day 5<br />
Once a day 35<br />
Twice a day 40<br />
More <strong>of</strong>ten 8<br />
Not known 12<br />
Source: Adapted from Masuda, Chirwa<br />
<strong>and</strong> Ntenjera (2004)<br />
Feeding frequency varies widely amongst fish<br />
farmers. The majority <strong>of</strong> farmers feed their fish<br />
whenever feed is available <strong>and</strong> when they have the<br />
time. Masuda, Chirwa <strong>and</strong> Ntenjera (2004) reported<br />
that 5 percent <strong>of</strong> farmers in southern Malawi feed<br />
their fish less than once per day, while 40 percent <strong>of</strong><br />
farmers feed their fish twice a day.<br />
All commercial fish farmers (small <strong>and</strong> large-scale)<br />
either apply the feed in the <strong>for</strong>m <strong>of</strong> a moist mash in<br />
feeding bags or on trays or in pellet <strong>for</strong>m. The fish are<br />
fed on a regular basis (the daily frequency depends on<br />
average fish size) <strong>and</strong> a ration based on pond or cage biomass (which is adjusted every<br />
second week).<br />
TABLE 15<br />
Animal feed production by some feed<br />
manufacturing companies<br />
Total annual<br />
Feed Production Unit<br />
production<br />
(tonnes)<br />
Bwemba Chicken Farm 252<br />
Central Poultry Ltd 30 000<br />
Proto Feeds 35 000<br />
Foundation <strong>for</strong> Improvement <strong>of</strong><br />
Animal Health (FIAH)<br />
*<br />
NALI RHO *<br />
Mbado Feeds *<br />
Grain Tech *<br />
Lama Feeds *<br />
J & M Feeds *<br />
National Stock Feeds *<br />
Trans Globe *<br />
International Multi Food<br />
Corporation<br />
*<br />
*Companies regarded production volumes as confidential<br />
Source: Company representatives<br />
3. THE ANIMAL FEED<br />
MANUFACTURING SECTOR<br />
The animal feed industry is relatively<br />
well established. However, the aquafeed<br />
industry is still nascent. There are<br />
several big <strong>and</strong> small-scale companies<br />
that produce concentrates <strong>for</strong> onfarm<br />
mixing as well as complete <strong>feeds</strong><br />
(Safalaoh, 2002). The companies include<br />
Rab Processors, Bwemba Chicken<br />
Farm, Foundation <strong>for</strong> Improvement<br />
<strong>of</strong> Animal Health (FIAH) feed mill,<br />
Proto <strong>feeds</strong>, NALI RHO, Mbado<br />
Feeds, Grain Tech, Lama Feeds, J &<br />
M Feeds, National Stock <strong>feeds</strong>, Trans<br />
Globe, Central Poultry Ltd. <strong>and</strong><br />
International Multifood Corporation.<br />
Table 15 below provides production<br />
figures <strong>of</strong> some <strong>of</strong> these companies. It<br />
was not possible to establish the total<br />
volume <strong>of</strong> compounded <strong>feeds</strong> produced in Malawi as many <strong>of</strong> the producers were<br />
reluctant to reveal this in<strong>for</strong>mation. However, it would be safe to say that the total<br />
probably exceeds 100 000 tonnes.<br />
Most <strong>of</strong> these companies operate in the urban areas <strong>of</strong> Blantyre (southern region),<br />
Lilongwe (central region) <strong>and</strong> Mzuzu (northern region) <strong>and</strong> mainly manufacture poultry<br />
<strong>feeds</strong>. There are no feed manufacturing associations in Malawi <strong>and</strong> as a result these<br />
companies operate as separate entities. The Government <strong>of</strong> Malawi recently enhanced<br />
the development <strong>of</strong> the poultry feed industry by establishing the Poultry Development<br />
Programme. The programme enables small-holder <strong>and</strong> medium size chicken farmers to<br />
access funding in order to improve production. This will lead to a higher dem<strong>and</strong> <strong>for</strong><br />
quality poultry <strong>feeds</strong> <strong>and</strong> an increase in the number <strong>of</strong> feed producers.<br />
The Malawi Bureau <strong>of</strong> St<strong>and</strong>ards (MBS) regulates feed manufacturing. The<br />
m<strong>and</strong>ate <strong>of</strong> the MBS is to prescribe <strong>and</strong> en<strong>for</strong>ce product st<strong>and</strong>ardisation in Malawi.<br />
It also regulates feed manufacturing indirectly through various requirements on feed<br />
ingredient imports <strong>and</strong> exports. The Chemicals <strong>and</strong> Drugs Board <strong>of</strong> Malawi regulates<br />
the imports <strong>of</strong> vitamins <strong>and</strong> minerals as well as all drugs, which are added to the<br />
manufactured <strong>feeds</strong>. All stock feed ingredients that are imported must meet sanitary<br />
requirements. The importation <strong>of</strong> feed ingredients that might contain genetically<br />
modified organisms (GMOs) is regulated by the National Bio-Safety Act.
448<br />
TABLE 16<br />
Major feed ingredient imports in 2002<br />
Feed ingredient<br />
Quantity<br />
(tonnes)<br />
Soybean 4 786<br />
Wheat bran 556<br />
Maize bran 648<br />
Other cereal brans 5<br />
Source: National Statistical Office,<br />
unpublished data<br />
TABLE 17<br />
Average cost <strong>of</strong> animal feed<br />
additives, 2005<br />
Ingredient<br />
Cost<br />
(US$/kg)<br />
Premixes 5.94<br />
Methionine 7.58<br />
Lysine 6.97<br />
Eskaline 6.56<br />
Flavamycine 5.33<br />
Mono calcium phosphate 1.23<br />
Common salt 0.62<br />
Source: Golden Chicks <strong>and</strong> Bwemba<br />
hatcheries (pers. comm.)<br />
<strong>Study</strong> <strong>and</strong> <strong>analysis</strong> <strong>of</strong> <strong>feeds</strong> <strong>and</strong> <strong>fertilizers</strong> <strong>for</strong> <strong>sustainable</strong> aquaculture development<br />
Feed <strong>and</strong> ingredient imports <strong>and</strong> export<br />
Current data on animal feed imports <strong>and</strong> exports are not<br />
readily available. At this stage it would appear that Malawi<br />
does not export livestock feed or feed ingredients. Table 16<br />
summarizes major feed ingredient imports, although these<br />
figures are considered be inaccurate.<br />
Malawi is a member <strong>of</strong> the World Trade Organisation<br />
(WTO), the Common Market <strong>for</strong> Eastern <strong>and</strong> Southern Africa<br />
(COMESA) Free Trade Area. There<strong>for</strong>e, the country operates<br />
under a framework <strong>of</strong> liberalised trade. Malawi also has bilateral<br />
<strong>and</strong> preferential trade agreements with other countries, such<br />
as South Africa, Zimbabwe <strong>and</strong> Botswana. Imported <strong>feeds</strong><br />
normally attract certain tariffs, depending on the country <strong>of</strong><br />
origin. A surtax <strong>of</strong> approximately 17 percent is levied on most<br />
<strong>of</strong> the <strong>feeds</strong> produced <strong>and</strong> purchased locally. The government<br />
issues import <strong>and</strong> export licences <strong>for</strong> all compounded products<br />
<strong>for</strong> animal feed.<br />
Additives such as vitamins, minerals, antibiotics <strong>and</strong> binders<br />
are readily available in Malawi. These can be purchased from<br />
pharmacies <strong>and</strong> feed manufacturers. It is common <strong>for</strong> farmers<br />
to purchase the vitamins <strong>and</strong> minerals as premixes. Table 17<br />
indicates the cost <strong>of</strong> some <strong>of</strong> the animal feed additives.<br />
3.1 Problems <strong>and</strong> constraints<br />
In general, the animal feed industry in Malawi is constrained by the lack <strong>of</strong> locally<br />
produced commodities. This in turn is caused by the variable per<strong>for</strong>mance <strong>of</strong> the<br />
agricultural sector in Malawi. For example, the growth in the agricultural sector<br />
ranged from -6.7 percent to +6.2 percent per annum between 2000 <strong>and</strong> 2005 (Malawi<br />
Government, 2005). Consequently, the bulk <strong>of</strong> the ingredients <strong>for</strong> livestock <strong>and</strong> fish<br />
<strong>feeds</strong> have to be imported to ensure a consistent supply. Malawi is a l<strong>and</strong>locked country<br />
where transport costs tend to account <strong>for</strong> nearly to 30 percent <strong>of</strong> the overall cost <strong>of</strong><br />
imported goods. Most <strong>of</strong> the suppliers <strong>and</strong> feed manufacturing companies are situated<br />
in the major urban centres <strong>of</strong>, whilst most farmers are in rural areas. The added cost <strong>of</strong><br />
transport <strong>and</strong> h<strong>and</strong>ling places <strong>feeds</strong> out <strong>of</strong> reach <strong>for</strong> most farmers.<br />
While significant progress has been made by the two large-scale commercial farms<br />
to manufacture their own farm-made <strong>feeds</strong>, small-holder fish farmers have lagged<br />
behind. One <strong>of</strong> the contributing factors has been the lack <strong>of</strong> basic equipment, such as<br />
milling, mixing <strong>and</strong> pelleting machinery. Several small-holder farmers have however<br />
developed innovative techniques <strong>for</strong> making on-farm <strong>feeds</strong>, although the majority are<br />
still not conversant with these basic methods. These techniques are not very different<br />
to those used by small-scale farmers in Asia. The fact that Malawian small-scale farmers<br />
have only now been sensitised to these methods suggests that extension services must<br />
to be improved.<br />
The requirement <strong>for</strong> storage <strong>of</strong> feed ingredients <strong>and</strong> farm-made aqua<strong>feeds</strong> is based<br />
on the assumption that farmers are able to accrue <strong>and</strong>/or purchase their feed ingredients<br />
when prices are low. However, the high transport costs <strong>and</strong> the capital required to build<br />
adequate storage facilities prevents most farmers from following such a plan <strong>and</strong> hence<br />
they purchase just enough <strong>for</strong> their immediate need. Purchasing <strong>and</strong> h<strong>and</strong>ling <strong>feeds</strong> in<br />
bulk by farmer groups or clubs would enable them to operate on economies <strong>of</strong> scale,<br />
leading to reduced transportation <strong>and</strong> h<strong>and</strong>ling cost <strong>and</strong> better pr<strong>of</strong>its.<br />
The major problem that has been identified is that small-scale farmers do not feed<br />
their fish <strong>and</strong> fertilize their ponds as regularly as recommended (Noble <strong>and</strong> Chimatiro,<br />
1991; Brummett <strong>and</strong> Noble, 1995; Masuda et al., 2004, ADiM, 2005b). This is mainly
Analysis <strong>of</strong> <strong>feeds</strong> <strong>and</strong> <strong>fertilizers</strong> <strong>for</strong> <strong>sustainable</strong> aquaculture development in Malawi 449<br />
because most farmers cannot af<strong>for</strong>d the necessary <strong>feeds</strong> <strong>and</strong> nutrients <strong>and</strong> lack basic<br />
knowledge.<br />
4. RESOURCE AVAILABILITY AND EXPANSION OF THE AQUACULTURE<br />
INDUSTRY<br />
Future aquaculture projections can be made on the basis <strong>of</strong> several scenarios. ADiM<br />
(2005b) made projections <strong>for</strong> small-holder aquaculture in Malawi based on a growth rate<br />
<strong>of</strong> around 15 percent per year, which could be sustained by the existing infrastructural<br />
<strong>and</strong> institutional support. Assuming two conservative production levels (15 <strong>and</strong><br />
60 kg/200 m 2 pond/year) <strong>and</strong> a current baseline <strong>of</strong> around 200 tonnes, production from<br />
small-holder fish farms will reach 1 000–5 000 tonnes per annum over a 22-year period.<br />
Given that around 25 percent <strong>of</strong> small-scale farmers are already producing at these<br />
levels the projected production level is there<strong>for</strong>e likely to be achieved.<br />
Similar calculations <strong>and</strong> observations were made by ARTDMIS (2005), who<br />
reported that production could be increased to 200 g/m 2 (42 kg/200 m 2 /year) simply<br />
by the appropriate application <strong>of</strong> <strong>fertilizers</strong>. Similar production levels (20 kg/200m 2 /<br />
year) have also been reported among farmers who used organic fertilizer (manure or<br />
compost) <strong>and</strong> supplemented this with an 18 percent protein-based feed (COMPASS<br />
II, 2006). However, this can only happen if farmers can af<strong>for</strong>d the required volumes <strong>of</strong><br />
manure <strong>and</strong> the constraint <strong>of</strong> access to <strong>fertilizers</strong> can be resolved. Current Government<br />
initiatives, including the Presidential Initiative on Aquaculture Development (PIAD)<br />
which was launched in February 2006, will hopefully enable farmers to have easier <strong>and</strong><br />
cheaper access to <strong>fertilizers</strong> in future.<br />
In the short to medium term, the small-scale commercial sector will most definitely<br />
show rapid growth <strong>and</strong> this will be driven by the increasing dem<strong>and</strong> <strong>and</strong> the rapidly<br />
escalating price <strong>of</strong> fish (currently US$2.00/kg). Farmers will also soon realise that fish<br />
farming provides better opportunities than crop farming. In fact several small-holder<br />
farmers have already realised this <strong>and</strong> are gearing up to increase production.<br />
The third scenario is based on the expansion <strong>of</strong> large-scale fish production. Depending<br />
on the success <strong>of</strong> the current initiatives it is highly likely that others will follow. It is<br />
projected that large-scale production <strong>of</strong> fish may reach between 10 000 <strong>and</strong> 15 000 tonnes<br />
per year by the year 2015 (Department <strong>of</strong> Fisheries, 2003). Assuming a conservative Feed<br />
Conversion Ratio <strong>of</strong> 2:1, then this level <strong>of</strong> production will require a minimum <strong>of</strong> 25 000<br />
tonnes <strong>of</strong> <strong>for</strong>mulated <strong>feeds</strong> per year, creating opportunities <strong>for</strong> feed commodity importers<br />
<strong>and</strong> feed manufacturers to invest in the necessary equipment <strong>and</strong> infrastructure.<br />
5. RECOMMENDATIONS<br />
Recommendations to improve the utilization <strong>of</strong> fertilizer <strong>and</strong> feed resources in<br />
Malawian aquaculture can be grouped into three major categories, namely, (i)<br />
technological developments; (ii) in<strong>for</strong>mation dissemination <strong>and</strong> outreach; (iii) socioeconomic<br />
<strong>and</strong> fiscal <strong>and</strong> (iv) policy <strong>and</strong> legal framework.<br />
5.1 Technological developments<br />
In the short term it is critical that farmers are made aware <strong>of</strong> the opportunities presented<br />
by farm-made <strong>feeds</strong>; <strong>and</strong> already some farmers are producing their own <strong>feeds</strong> (ADiM,<br />
2005b). However, there is a need <strong>for</strong> dem<strong>and</strong> driven research to develop appropriate<br />
technologies <strong>for</strong> <strong>for</strong>mulating <strong>and</strong> making farm-made <strong>feeds</strong>, using local ingredients. As<br />
far as possible this research should be undertaken on the farms <strong>and</strong> this will facilitate<br />
adoption <strong>of</strong> new technologies.<br />
5.2 In<strong>for</strong>mation dissemination <strong>and</strong> outreach<br />
Several studies have provided clear evidence that the use <strong>of</strong> <strong>fertilizers</strong> <strong>and</strong> <strong>feeds</strong> by smallholder<br />
fish farmers in Malawi is sub-optimal. There<strong>for</strong>e, there is a need to strengthen
450<br />
<strong>Study</strong> <strong>and</strong> <strong>analysis</strong> <strong>of</strong> <strong>feeds</strong> <strong>and</strong> <strong>fertilizers</strong> <strong>for</strong> <strong>sustainable</strong> aquaculture development<br />
the capacity <strong>of</strong> the extension service in Malawi to more effectively disseminate available<br />
in<strong>for</strong>mation. Currently, the aquaculture extension services <strong>of</strong> the Department <strong>of</strong><br />
Fisheries (DoF) in Malawi face severe challenges. To improve outreach, the Department<br />
<strong>of</strong> Fisheries has undertaken to (i) focus on high potential areas, (ii) devolution <strong>of</strong><br />
extension services to the District Assemblies as part <strong>of</strong> the Decentralisation Policy, (iii)<br />
promotion <strong>and</strong> support <strong>of</strong> farmer-to-farmer contact <strong>and</strong> dissemination <strong>of</strong> in<strong>for</strong>mation.<br />
Furthermore, the DoF has established <strong>and</strong> has undertaken to strengthen fish farmers’<br />
associations in the country. The first <strong>of</strong> such associations, the Innovative Fish Farmers<br />
Network (IFFN) was successfully in 2003. The IFFN is a legally constituted body<br />
with the aim to improve linkages between farmers <strong>and</strong> service providers, including the<br />
government.<br />
5.3 Policy <strong>and</strong> legal framework<br />
The animal feed industry, in general, is constrained by poor infrastructure, high<br />
costs <strong>and</strong> tariffs on imports. There is a need <strong>for</strong> the government to make a special<br />
ef<strong>for</strong>t to assist the development <strong>of</strong> the industry by promoting <strong>and</strong> supporting greater<br />
participation in this industry through various incentives such as favourable fiscal <strong>and</strong><br />
procurement policies, ease <strong>of</strong> access to low cost capital, promotion <strong>of</strong> infrastructure<br />
development, especially in utilities such as water <strong>and</strong> electricity. Favourable tariff<br />
<strong>and</strong> tax incentives must be put in place to allow animal feed manufactures easier <strong>and</strong><br />
cheaper access to suitable feed ingredients, locally, regionally <strong>and</strong> internationally.<br />
The importance <strong>of</strong> fish farming must be reflected in national development policies.<br />
Some <strong>of</strong> the more recent initiatives to promote the development <strong>of</strong> the sector include,<br />
a special Presidential initiative to promote aquaculture in Malawi, the initiation <strong>of</strong><br />
the Chambo Restoration Programme, the completion <strong>and</strong> adoption (<strong>and</strong> soon to be<br />
implemented) National Aquaculture Strategic Plan <strong>and</strong> the current revision <strong>of</strong> the<br />
National Fisheries <strong>and</strong> Aquaculture Policy (2001) to develop a st<strong>and</strong>-alone National<br />
Aquaculture Policy <strong>and</strong> Act. These <strong>and</strong> other important initiatives attest to the fact that<br />
Malawi is serious in its quest to develop the sector aggressively <strong>and</strong> responsibly.<br />
REFERENCES<br />
ADiM. 2005a. National Fish Farmer’s Socio Economic Survey Report. Working Paper No.<br />
3. Lilongwe, Department <strong>of</strong> Fisheries. 54 pp.<br />
ADiM. 2005b. National Aquaculture Strategic Plan 2005-2015. Lilongwe, Malawi<br />
Government, Department <strong>of</strong> Fisheries <strong>and</strong> Systems Science Consultants Inc. 152 pp.<br />
Aguilar-Manjarrez, J. & Nath, S.S. 1998. A strategic reassessment <strong>of</strong> fish farming potential<br />
in Africa. CIFA Technical Paper No. 32. Rome, FAO.<br />
ARTDMIS. 2005. Aquaculture research <strong>and</strong> technological development <strong>of</strong> indigenous<br />
species. Lilongwe, Department <strong>of</strong> Fisheries.<br />
Balarin, J.D. 1987. National reviews <strong>for</strong> aquaculture development in Africa: 12. Malawi.<br />
FAO Fisheries Circular, No. 770.12, Rome, FAO. 82 pp.<br />
Brummett, R.E. & Noble, R. 1995. Aquaculture <strong>for</strong> African Small-holders. ICLARM<br />
Technical Paper No. 46. 69 pp.<br />
Brummett, R.E. 1998. Making experiment station results more useful to African Fish<br />
farmers. NAGA the WorldFish Quarterly April- June 1998. 21 pp.<br />
Chimatiro, S.K. 1992. The ecology <strong>of</strong> small-holder fish farms in Zomba District, Malawi.<br />
University <strong>of</strong> Malawi, Zomba, Malawi. 144 pp. (Unpublished MSc thesis).<br />
Chirwa, B. 2003. Preliminary study on the utilisation <strong>of</strong> bamboo substrate to enhance<br />
heterotrophic food production in fish ponds <strong>for</strong> the culture <strong>of</strong> Tilapia rendalli in Malawi.<br />
In K. Masuda, B.B. Chirwa <strong>and</strong> G. Ntenjera, eds. A contribution to the development <strong>of</strong><br />
rearing techniques in fish farming in Malawi, The Project on Aquaculture Research <strong>and</strong><br />
Technical Development <strong>of</strong> Malawian Indigenous Species. Lilongwe, National Aquaculture<br />
Centre, Department <strong>of</strong> Fisheries <strong>and</strong> Japanese International Cooperation Agency (JICA).
Analysis <strong>of</strong> <strong>feeds</strong> <strong>and</strong> <strong>fertilizers</strong> <strong>for</strong> <strong>sustainable</strong> aquaculture development in Malawi 451<br />
Coche, A.G., Muir, J.F. & Laughlin, T. 1996. Management <strong>of</strong> fresh water fish culture.<br />
Pond <strong>and</strong> water practices. Simple methods <strong>for</strong> aquaculture. FAO Training Series No 21/1,<br />
Rome, FAO. 233 pp.<br />
COMPASS II (Community Partnership <strong>for</strong> Sustainable Resource Management in<br />
Malawi). 2006. Malawi gold st<strong>and</strong>ard aquaculture production system. Blantyre, Malawi.<br />
(Unpublished report).<br />
Dickson, M.W., Brooks, A.C. & Sikawa, D.C. 1997. The farmer <strong>and</strong> fish farming status.<br />
In M.W Dickson, ed. Fish farming in Malawi: a case study <strong>of</strong> the central <strong>and</strong> northern<br />
regions fish farming project, 5–22 pp. Stirling, Stirling Aquaculture.<br />
ICLARM & GTZ. 1991. The context <strong>of</strong> small-scale integrated agriculture-aquaculture<br />
systems in Africa: a case study <strong>of</strong> Malawi. ICLARM Stud. Rev. 18, Manila, ICLARM.<br />
302 pp.<br />
Jamu, D.M. Chaula, K. & Hunga, H. 2003. A preliminary study on the feasibility <strong>of</strong> using<br />
fenced brush parks <strong>for</strong> fish production in Lake Chilwa, Malawi. Naga- The WorldFish<br />
Center Quarterly, 26 (1): 4-8.<br />
Kapalamula, M. 1993. Comparative study <strong>of</strong> household economics <strong>of</strong> integrated agriculture-<br />
aquaculture farming systems in Zomba District. Zomba, Bunda College <strong>of</strong> Agriculture<br />
University <strong>of</strong> Malawi, 237 pp. (MSc thesis).<br />
Malawi Government. 2005. Annual economic report. Lilongwe, Ministry <strong>of</strong> Economic<br />
Planning <strong>and</strong> Development.<br />
Masuda, K., Chirwa, B.B. & Ntenjera, G. 2004. A contribution to the development <strong>of</strong><br />
rearing techniques in fish farming in Malawi, the Project on Aquaculture Research<br />
<strong>and</strong> Technical Development <strong>of</strong> Malawian Indigenous Species. Lilongwe, National<br />
Aquaculture Centre, Department <strong>of</strong> Fisheries <strong>and</strong> Japanese International Cooperation<br />
Agency (JICA).<br />
Masuda, K., Mbamba, D., Lusangasi, B., Chirwa, W., & Likongwe, C. 2004. Fishmeal<br />
made from rejects from Lake Malawi as an ingredient in supplemental feed <strong>of</strong> Oreochromis<br />
shiranus. In A contribution to the development <strong>of</strong> rearing techniques in fish farming in<br />
Malawi., Technical Paper No 10. The Project on Aquaculture Research <strong>and</strong> Technical<br />
Development <strong>of</strong> Malawian Indigenous Species, Lilongwe, National Aquaculture Centre,<br />
Department <strong>of</strong> Fisheries <strong>and</strong> Japanese International Cooperation Agency (JICA).<br />
Metcalfe, J.M. 1977. The growth <strong>and</strong> feeding behaviour <strong>of</strong> Sarotherodon shiranus chilwae<br />
(Trewavas) in experimental ponds. New Castle, Department <strong>of</strong> Agricultural Biochemistry,<br />
Faculty <strong>of</strong> Agriculture, University <strong>of</strong> Newcastle upon Tyne. (MSc thesis).<br />
Ministry <strong>of</strong> Agriculture. 2003. Guide to Agricultural Production <strong>and</strong> natural resources.<br />
Lilongwe, Ministry <strong>of</strong> Agriculture.<br />
Mtimuni, J.P. 1995. Ration <strong>for</strong>mulation <strong>and</strong> feed guides. Lilongwe, Department <strong>of</strong><br />
Agriculture.<br />
NAC. 2001. National Aquaculture Center Annual Report, 2000/2001, Lilongwe, Department<br />
<strong>of</strong> Fisheries.<br />
NAC. 2002. National Aquaculture Center Annual Report, 2001/2002, Lilongwe, Department<br />
<strong>of</strong> Fisheries.<br />
Noble, R.P. & Chimatiro, S. 1991. On farm biotic resources <strong>for</strong> small scale fish farming<br />
in Malawi. In B.A. Costa-Pierce, C. Lightfoot, K. Ruddle <strong>and</strong> R.S.V. Pullin eds.<br />
Aquaculture research <strong>and</strong> development in Rural Africa, 18 p. ICLARM. Conf. Proc.,<br />
No. 27. Manila, Deutsche Gesellschaft, Fur Technische Zusammernartbeit (GTZ) <strong>and</strong><br />
International Centre <strong>for</strong> Living Aquatic Resources Management.<br />
Nyirenda, J., Mwabumba, M., Mwamumba, K., Kaunda, E. & Sales, J. 2000. Effect <strong>of</strong><br />
substituting animal protein sources with soybean meal in diets <strong>of</strong> Oreochromis karongae,<br />
(Trewavas, 1941). NAGA-The ICLARM Quarterly, 23 (4): 13-15<br />
Ohashi, M.T., Miyashita, T., Puliazi, A.D., Chirwa, B.B., Chirwa, W.M. & Chaggwa, I.J.<br />
1999. Technical report <strong>and</strong> instruction <strong>of</strong> aquaculture in Malawi on fish feed development,<br />
No 1 Research project <strong>for</strong> small scale aquaculture <strong>of</strong> Malawian Indigenous species.
452<br />
<strong>Study</strong> <strong>and</strong> <strong>analysis</strong> <strong>of</strong> <strong>feeds</strong> <strong>and</strong> <strong>fertilizers</strong> <strong>for</strong> <strong>sustainable</strong> aquaculture development<br />
Lilongwe, National Aquaculture centre, Department <strong>of</strong> Fisheries, Malawi <strong>and</strong> Japan<br />
International Cooperation Agency (JICA).<br />
Safalaoh, A.C.L. 2002. Livestock production, protein sources <strong>and</strong> the animal feed industry<br />
in Malawi. A paper presented at FAO Expert consultation <strong>and</strong> workshop on protein<br />
sources <strong>for</strong> the animal feed industry, Siam City Hotel, Bangkok, Thail<strong>and</strong>, April 29-May<br />
3, 2002.<br />
System Science Consultants Inc (SSC). 2003. Master Plan <strong>Study</strong> on Aquaculture<br />
development in Malawi. Interim Report, Japan International Cooperation Agency.<br />
November 2003. Tokyo, System Science Consultants Inc.
Analysis <strong>of</strong> <strong>feeds</strong> <strong>and</strong> <strong>fertilizers</strong><br />
<strong>for</strong> <strong>sustainable</strong> aquaculture<br />
development in Nigeria<br />
Olajide A. Ayinla<br />
Nigerian Institute <strong>for</strong> Oceanography <strong>and</strong> Marine Research<br />
Victoria Isl<strong>and</strong>, P M B 12729, Lagos<br />
Nigeria<br />
Summary 454<br />
1. Introduction 455<br />
2. Overview <strong>of</strong> aquaculture practices <strong>and</strong> farming systems 455<br />
3. Analysis <strong>of</strong> <strong>fertilizers</strong> <strong>and</strong> <strong>feeds</strong> 457<br />
4. Overview <strong>of</strong> the animal feed industry 466<br />
5. Recommendations 468<br />
Acknowledgements 468<br />
References 468<br />
Ayinla, O.A. 2007. Analysis <strong>of</strong> <strong>feeds</strong> <strong>and</strong> <strong>fertilizers</strong> <strong>for</strong> <strong>sustainable</strong> aquaculture<br />
development in Nigeria. In M.R. Hasan, T. Hecht, S.S. De Silva <strong>and</strong> A.G.J. Tacon (eds).<br />
<strong>Study</strong> <strong>and</strong> <strong>analysis</strong> <strong>of</strong> <strong>feeds</strong> <strong>and</strong> <strong>fertilizers</strong> <strong>for</strong> <strong>sustainable</strong> aquaculture development.<br />
FAO Fisheries Technical Paper. No. 497. Rome: FAO. pp. 453–470.<br />
453
454<br />
<strong>Study</strong> <strong>and</strong> <strong>analysis</strong> <strong>of</strong> <strong>feeds</strong> <strong>and</strong> <strong>fertilizers</strong> <strong>for</strong> <strong>sustainable</strong> aquaculture development<br />
SUMMARY<br />
The study provides a synthesis <strong>of</strong> the status <strong>and</strong> trends in the use <strong>of</strong> <strong>feeds</strong> <strong>and</strong> nutrients <strong>for</strong><br />
<strong>sustainable</strong> aquaculture development in Nigeria. The rapid <strong>and</strong> progressive development<br />
<strong>of</strong> aquaculture in Nigeria is necessary to bridge the gap between fish dem<strong>and</strong> (1.5 million<br />
tonnes annually) <strong>and</strong> supply (0.5 million tonnes annually). Following a series <strong>of</strong> false<br />
starts, aquaculture is now passing through an exciting phase <strong>of</strong> evolution <strong>and</strong> in 2004<br />
Nigeria produced 43 950 tonnes <strong>of</strong> fish. Nigerian farmers have recognised the importance<br />
<strong>of</strong> using <strong>for</strong>mulated <strong>feeds</strong> <strong>for</strong> commercial aquaculture development.<br />
The culture system <strong>of</strong> choice is polyculture <strong>of</strong> tilapia (mainly Nile tilapia<br />
Oreochromis niloticus) with clariid catfishes (North African catfish Clarias gariepinus,<br />
Heterobranchus bidorsalis, vundu H. longifilis). Brackish-water aquaculture is at a<br />
very low level, while mariculture is yet to be developed.<br />
Despite competing needs <strong>for</strong> organic <strong>fertilizers</strong> by agriculture, organic manure<br />
(mainly chicken droppings) is extensively used <strong>for</strong> pond enrichment, while the use <strong>of</strong><br />
chemical <strong>fertilizers</strong> is limited. Most <strong>of</strong> the feed ingredients required <strong>for</strong> the manufacture<br />
<strong>of</strong> livestock <strong>and</strong> fish feed are locally available. Feed ingredients that are in short supply,<br />
such as fish meal, soybean meal <strong>and</strong> additives, are imported. Feedstuffs are mainly<br />
produced in rural areas <strong>and</strong> distributed to local markets <strong>and</strong> urban centres by commodity<br />
traders.<br />
The review identified a number <strong>of</strong> unconventional <strong>feeds</strong>tuffs that are important<br />
<strong>for</strong> the <strong>for</strong>mulation <strong>and</strong> development <strong>of</strong> cheaper aqua<strong>feeds</strong>. In 2000/01, approximately<br />
35 750 tonnes <strong>of</strong> aqua<strong>feeds</strong> were produced using only 52.4 percent <strong>of</strong> the installed<br />
manufacturing capacity <strong>of</strong> Nigerian feedmills. Some <strong>for</strong>mulated <strong>feeds</strong> <strong>for</strong> high density<br />
catfish farming are imported. Most <strong>of</strong> the 620 feed mills that were operational in 2001<br />
were designed <strong>for</strong> poultry feed production, while only a few produced aqua<strong>feeds</strong> as<br />
an incidental product. This explains the insufficiency in the supply <strong>of</strong> good quality<br />
aqua<strong>feeds</strong> <strong>and</strong> the importation <strong>of</strong> high quality floating <strong>feeds</strong> <strong>for</strong> the early production<br />
phase <strong>of</strong> catfish. There are 10 dedicated aquafeed plants <strong>and</strong> these are located in Lagos,<br />
Ibadan, Jos <strong>and</strong> Ilorin.
Analysis <strong>of</strong> <strong>feeds</strong> <strong>and</strong> <strong>fertilizers</strong> <strong>for</strong> <strong>sustainable</strong> aquaculture development in Nigeria 455<br />
1. INTRODUCTION<br />
The importance <strong>of</strong> aquaculture in Nigeria has been recognised <strong>for</strong> many years.<br />
Although aquaculture was introduced in the 1950’s the sector has only recently made<br />
an impact on national fish production. This review is based on secondary-sources <strong>of</strong><br />
in<strong>for</strong>mation, a review <strong>of</strong> the literature, government <strong>and</strong> NGO reports, contacts <strong>and</strong><br />
meetings with relevant persons <strong>and</strong> agencies in Nigeria <strong>and</strong> visits to fish farmers <strong>and</strong><br />
feed manufacturers in Lagos.<br />
2. OVERVIEW OF AQUACULTURE PRACTICES AND FARMING SYSTEMS<br />
Capture fisheries in Nigeria are more important than aquaculture. In 2004, the total<br />
l<strong>and</strong>ings from marine <strong>and</strong> inl<strong>and</strong> capture fisheries amounted to some 465 250 tonnes<br />
(FAO, 2006). However, after a series <strong>of</strong> false starts, aquaculture is now entering an<br />
exciting phase <strong>of</strong> its evolution. It is widely recognized that the progressive development<br />
<strong>of</strong> aquaculture is essential if the projected annual fish dem<strong>and</strong> <strong>of</strong> 1.5 million tonnes<br />
is to be met. Current total fish production from capture fisheries <strong>and</strong> aquaculture<br />
is in the region <strong>of</strong> 0.5 million tonnes. Moreover, there is a growing recognition <strong>of</strong><br />
the considerable potential <strong>of</strong> small-scale aquaculture, which may diversify farmer<br />
livelihoods <strong>and</strong> increase income, while simultaneously reducing risk <strong>and</strong> vulnerability<br />
to food insecurity. In 2004, annual aquaculture production in Nigeria was estimated at<br />
43 950 tonnes (Table 1).<br />
A wide variety <strong>of</strong> production systems such as ponds, tanks <strong>and</strong> raceways are used<br />
by fish farmers, though earthen pond culture is the dominant system. More recently,<br />
fish culture in water recirculation systems has been developed <strong>and</strong> is being practiced in<br />
several urban <strong>and</strong> peri-urban areas.<br />
Based on the financial disposition <strong>of</strong> the farmers, aquaculture practices can be<br />
classified into large, medium <strong>and</strong> small-scale businesses. Small-scale fish farmers<br />
account <strong>for</strong> over 70 percent <strong>of</strong> producers <strong>and</strong> this group can be further divided into<br />
commercial <strong>and</strong> non-commercial (subsistence) farmers. These farms comprise <strong>of</strong><br />
holdings ranging from one pond <strong>of</strong> 0.05 ha to several ponds with a total water surface<br />
area <strong>of</strong> around one hectare. The Nigerian experience serves as evidence that smallholder<br />
aquaculture is a cost effective first level solution <strong>for</strong> fish production (Ayinla <strong>and</strong><br />
Ajayi, 1996). Feeding practices <strong>of</strong> the small-scale operators include slight modifications<br />
<strong>of</strong> the culture environment with incomplete control over the environment <strong>and</strong> the<br />
fish. Manure (or compost) is usually added to stimulate primary productivity <strong>and</strong> low<br />
quality <strong>feeds</strong> such as agricultural by-products (cassava peels, rice bran, etc) <strong>and</strong> kitchen<br />
wastes are applied at irregular intervals. Non-conventional animal protein sources such<br />
as maggots <strong>and</strong> earthworm are also used as supplementary <strong>feeds</strong>. Stocking density<br />
TABLE 1<br />
Aquaculture production (tonnes) in Nigeria<br />
Species 2003 2004<br />
Tilapias (Oreochomis niloticus, Sarotherodon galilaeus, S. melanotheron) 11 363 16 420<br />
Tilapias (Tilapia zillii, T. guineenis) 3 025 3 126<br />
North African catfish (Clarias gariepinus) 6 553 13 650<br />
Other freshwater catfishes (Heterobranchus bidorsalis, H. longifilis<br />
<strong>and</strong> hybrid catfish*)<br />
2 832 3 268<br />
Bagrid catfish (Chrysichthys nigrodigitatus) 1 515 1 532<br />
Carps (common carp <strong>and</strong> Indian major carps) 1 280 1 342<br />
African bonytongue (Heterotis niloticus) 654 662<br />
Mullets (Mugil cephalus, Liza falcipinnis) 336 345<br />
Snake-head (Parachanna obscura) 297 321<br />
Other fishes 2 921 3 394<br />
Total 30 776 43 950<br />
*Hybrid <strong>of</strong> Clarias gariepinus x Heterobranchus longifilis (or H. bidorsalis)<br />
Source: Federal Departement <strong>of</strong> Fisheries (2004, pers. comm.)
456<br />
TABLE 2<br />
Fish production in medium-scale production systems<br />
Culture system Environment<br />
modification<br />
Integrated pond<br />
culture with<br />
poultry<br />
Fertilized pond<br />
culture (mainly<br />
chicken manure)<br />
Water<br />
recirculation or<br />
flow through<br />
tank culture<br />
Water flow<br />
through system<br />
in earthen pond<br />
Source: Oguntade et al. (2005)<br />
Paddle wheel <strong>for</strong><br />
aeration<br />
Stagnant water in<br />
earthen pond<br />
Concrete tanks 10<br />
m 3 –15 m 3 with water<br />
flow through system<br />
<strong>Study</strong> <strong>and</strong> <strong>analysis</strong> <strong>of</strong> <strong>feeds</strong> <strong>and</strong> <strong>fertilizers</strong> <strong>for</strong> <strong>sustainable</strong> aquaculture development<br />
Types <strong>of</strong> feed Species Stocking<br />
density<br />
(fish/m3 )<br />
Locally pelleted feed Polyculture<br />
(C. gariepinus & O.<br />
niloticus)<br />
Locally pelleted feed Polyculture<br />
(C. gariepinus & O.<br />
niloticus & Heterotis<br />
niloticus)<br />
Mainly locally<br />
pelleted feed,<br />
some farmers use<br />
imported feed as<br />
starter <strong>and</strong> local<br />
feed as finisher<br />
Earthen ponds Locally pelleted feed<br />
<strong>and</strong> fertilization<br />
with chicken manure<br />
Monoculture<br />
(C. gariepinus)<br />
Polyculture<br />
(O. niloticus & C.<br />
gariepinus)<br />
Production<br />
(tonnes/ha/year)<br />
10–15 10–15<br />
5–10 5–8<br />
20–25 25–50<br />
10–15 10–12<br />
TABLE 3<br />
Commonly cultured fish species in Nigeria<br />
Species Relative Environment Culture System<br />
North African catfish, Clarias gariepinus<br />
importance<br />
+++ Freshwater Polyculture in earthen ponds<br />
with tilapia <strong>and</strong> monoculture<br />
in recirculation systems<br />
Nile tilapia, Oreochromis niloticus +++ Freshwater Polyculture<br />
Gymnarchus atlanticus ++ Freshwater Polyculture with tilapia<br />
Heterobranchus spp. ++ Freshwater Polyculture with tilapia<br />
Hybrid catfish* ++ Freshwater Polyculture with tilapia<br />
Bragrid catfish, Chrysichthys<br />
nigrodigitatus<br />
+ Brackish water Polyculture with tilapia<br />
Common carp, Cyprinus carpio + Freshwater Polyculture with tilapia<br />
African bonytongue, Heterotis niloticus + Freshwater Polyculture with tilapia<br />
Flathead mullet, Mugil cephalus + Brackish water Polyculture with tilapia<br />
Nile perch, Lates niloticus + Freshwater Polyculture with tilapia<br />
Aba, Gymnarchus niloticus + Freshwater Polyculture with tilapia<br />
Tilapia, Tilapia guineensis + Brackish water Polyculture with mullet<br />
Tarpon, Megalops atlanticus + Brackish water & freshwater Polyculture with tilapia<br />
* Hybrid <strong>of</strong> Clarias gariepinus x Heterobranchus longifilis (or H. bidorsalis)<br />
+++ Highest preference <strong>for</strong> culture, ++ Moderate preference + Lowest preference<br />
Source: Author’s database (2005)<br />
ranges from 1–2 fish/m 2 <strong>and</strong> yield from 1–2 tonnes/ha/year. The most common species<br />
used by small-scale fish farmers include African bony tongue, North African catfish <strong>and</strong><br />
Nile tilapia. Medium-scale fish farming enterprises contribute between 10–20 percent<br />
<strong>of</strong> the total aquaculture production. These enterprises mainly use concrete tanks <strong>for</strong><br />
intensive catfish culture <strong>and</strong>/or earthen ponds (2–10 ha total surface area). The farms<br />
are sometimes complemented by a medium sized hatchery <strong>and</strong> feedmill. Management<br />
practices show a greater level <strong>of</strong> environmental control. Ponds are generally fertilized<br />
with manure <strong>and</strong> the fish are fed on farm-made <strong>feeds</strong> or locally produced, complete,<br />
pellets. Stocking densities in these systems range from 4–20 fish/m 2 with production<br />
levels <strong>of</strong> 4–20 tonnes/ha/year <strong>and</strong> a culture period <strong>of</strong> 9–12 months. Table 2 summarizes<br />
the practices in medium-scale production systems. The species produced by these<br />
farmers include O. niloticus, C. gariepinus <strong>and</strong> H. bidorsalis. Large-scale fish farms,<br />
<strong>of</strong> which there are approximately 50 in the country, are enterprises covering 15 ha or<br />
more <strong>and</strong> they account <strong>for</strong> 5–10 percent <strong>of</strong> aquaculture production. They normally<br />
have around 20 to 30 ponds (nursery <strong>and</strong> production ponds), a hatchery <strong>and</strong> a feedmill
Analysis <strong>of</strong> <strong>feeds</strong> <strong>and</strong> <strong>fertilizers</strong> <strong>for</strong> <strong>sustainable</strong> aquaculture development in Nigeria 457<br />
to supply the required inputs. The high density, water recirculation systems, with fish<br />
yields ranging from 10–50 tonnes/ha/year also fall within this category.<br />
Many fish species are cultured in Nigeria. The major groups <strong>of</strong> economic importance<br />
are shown in Table 3. Brackish-water aquaculture, with a production <strong>of</strong> around 2 000<br />
tonnes/year, is not <strong>of</strong> any economic consequence.<br />
3. ANALYSIS OF FERTILIZERS AND FEEDS<br />
3.1 Fertilizers<br />
Organic manure is extensively used to enhance pond productivity <strong>and</strong> plays a much<br />
greater role in pond aquaculture than inorganic <strong>fertilizers</strong>. While all major manure types<br />
are available, chicken manure is preferred due to its availability <strong>and</strong> because there are no<br />
religious restrictions to its use in crop <strong>and</strong> fish production. The recommended application<br />
rates <strong>of</strong> animal manure in Nigeria are; pig manure 560–1 630 kg/ha/week, poultry manure<br />
112–224 kg/ha/week <strong>and</strong> cattle manure at an average <strong>of</strong> 672 kg/ha/week.<br />
The most commonly used inorganic <strong>fertilizers</strong> in Nigerian aquaculture are super<br />
phosphate, triple super phosphate, urea, ammonium nitrate, potassium nitrate <strong>and</strong><br />
potassium sulphate. Phosphate <strong>fertilizers</strong> are commonly used in ponds because plankton<br />
growth is limited by phosphorus. Fertilizer is usually applied at least two weeks after<br />
the flooding <strong>of</strong> a limed pond. It must be emphasized that inorganic <strong>fertilizers</strong> are in<br />
short supply because <strong>of</strong> the high competition with crop production <strong>and</strong> are expensive.<br />
In 2005, the price <strong>of</strong> NPK <strong>fertilizers</strong> was approximately US$600/tonne <strong>and</strong> the bulk <strong>of</strong><br />
the supply is normally allocated to crop farmers. Inorganic <strong>fertilizers</strong>, when available,<br />
are there<strong>for</strong>e normally used on an alternate basis with organic manure.<br />
3.2 Feed ingredients<br />
Intensive <strong>and</strong> semi-intensive aquaculture depends on <strong>for</strong>mulated <strong>feeds</strong>, either as a<br />
supplement to natural food generated by high pond fertilization rates or as a complete<br />
diet (in mash or wet or dry pellet <strong>for</strong>m). Fish <strong>feeds</strong> generally account <strong>for</strong> approximately<br />
60 percent <strong>of</strong> the variable production cost in intensive systems in Nigeria. The cost<br />
<strong>of</strong> feed ingredients is high (Table 4) <strong>and</strong> competition from other sectors is intense.<br />
For commercial production, ingredients are procured in bulk by commodity traders.<br />
For farm-made <strong>feeds</strong> farmers normally buy the feed ingredients directly from the<br />
producers, thereby cutting out the middle-man.<br />
The ingredients shown in Table 4 are available all year round but, because <strong>of</strong> the<br />
prevailing agricultural calendar, are relatively cheaper from December to January<br />
<strong>and</strong> more expensive from April to September. Most <strong>of</strong> the crops are planted in April<br />
to October coinciding with the rainy season <strong>and</strong> harvested in November/December<br />
annually. The production <strong>of</strong> cost effective <strong>feeds</strong> is predicated by availability, cost <strong>and</strong><br />
accessibility to ingredients <strong>and</strong> the protein content <strong>of</strong> the feed. The ingredients most<br />
commonly used in fish <strong>feeds</strong> are described below.<br />
TABLE 4<br />
Availability <strong>and</strong> price <strong>of</strong> local feed ingredients in Nigeria, 2005<br />
Ingredient Available volumes<br />
(tonnes)<br />
Retail price<br />
(US$/tonne)<br />
Availability Producer price<br />
(US$)<br />
White maize 6 100 000 340–350 Adequate 250–270<br />
Yellow maize 3 500 000 340–360 Adequate 250–270<br />
Blood meal 70 000 320 Adequate 100–200<br />
Groundnut oilseed cake 720 000 320–340 Adequate 260–280<br />
Cotton oilseed cake 582 000 300–310 Adequate *<br />
Palm kernel cake 452 320 60–80 Adequate 40–45<br />
Soybean local 90 250 450–470 Low *<br />
Fishmeal 220 360 870–1 350 Low *<br />
* =No data<br />
Source: Author’s market survey in Lagos (2005)
458<br />
<strong>Study</strong> <strong>and</strong> <strong>analysis</strong> <strong>of</strong> <strong>feeds</strong> <strong>and</strong> <strong>fertilizers</strong> <strong>for</strong> <strong>sustainable</strong> aquaculture development<br />
3.2.1 Fishery by-products<br />
Fishmeal<br />
Approximately 80–90 percent <strong>of</strong> the artisanal <strong>and</strong> industrial marine <strong>and</strong> inl<strong>and</strong> fisheries<br />
catch is used <strong>for</strong> human consumption. The remainder as well as fish <strong>of</strong>fal (heads <strong>and</strong><br />
tails) from processing factories <strong>and</strong> trash fish is processed into fishmeal (at cottage<br />
level). Local fishmeal production is minimal <strong>and</strong> cannot meet the dem<strong>and</strong> <strong>of</strong> the feed<br />
industry <strong>and</strong> hence the bulk <strong>of</strong> the country’s fishmeal requirement is imported. In 2000,<br />
an estimated 65 253 tonnes <strong>of</strong> fishmeal was available in Nigeria, <strong>of</strong> which 13.4 percent<br />
was locally produced <strong>and</strong> the rest imported, mainly from Norway <strong>and</strong> Denmark<br />
(Fagbenro <strong>and</strong> Adebayo, 2005). In 2000, there was only one operational commercial<br />
fishmeal processing plant in Nigeria, which in that year produced over 8 000 tonnes <strong>of</strong><br />
fishmeal (Fagbenro, Adeparusi <strong>and</strong> Fapohunda, 2003). This company has since closed<br />
down because the cost <strong>of</strong> fishmeal production was higher than the imported product.<br />
In 2004, the cost <strong>of</strong> imported fishmeal ranged from US$870–1 350 per tonne, while the<br />
cost <strong>of</strong> locally produced fishmeal was US$1 500 per tonne.<br />
The escalating price <strong>of</strong> fishmeal, coupled with its scarcity, has stimulated research<br />
into ways <strong>of</strong> replacing fishmeal with other high protein ingredients. However, the<br />
inclusion <strong>of</strong> fishmeal (at up to 25 percent) is still necessary <strong>for</strong> all stages <strong>of</strong> intensive<br />
Clarias gariepinus culture. The proximate composition <strong>of</strong> the different local fishmeal<br />
varieties <strong>and</strong> other meals <strong>of</strong> marine animal origin is presented in Table 5.<br />
Nigeria’s small-scale fishmeal industry could possibly be exp<strong>and</strong>ed by developing<br />
a fishery <strong>for</strong> the unexploited lantern fish resources in national waters <strong>and</strong> investing<br />
in fishmeal manufacturing plant. However, this would only be possible after a<br />
comprehensive stock assessment <strong>of</strong> the resource.<br />
Shrimp head meal<br />
Shrimp, Penaeus notialis are caught, processed <strong>and</strong> packed headless <strong>for</strong> export. Undecomposed<br />
heads are dried <strong>and</strong> milled <strong>and</strong> used as an ingredient <strong>for</strong> fish <strong>feeds</strong>,<br />
however, only farmers in coastal states have access to this commodity. It is included<br />
at 5–10 percent in fish <strong>feeds</strong> (A. Oresegun, pers. comm.). Annual shrimp production<br />
is estimated to be 72 000 tonnes, from which 34 000 tonnes <strong>of</strong> wet waste is generated,<br />
resulting in a production <strong>of</strong> some 8 820 tonnes <strong>of</strong> dry shrimp head meal. It is primarily<br />
used as an attractant <strong>and</strong> secondarily as a protein source. It is also used by poultry feed<br />
producers. Apparent digestibility coefficients <strong>of</strong> shrimp head <strong>and</strong> other commonly<br />
used feed ingredients <strong>for</strong> African catfish are shown in Table 6.<br />
Fish silage<br />
Fish silage can be used to replace fishmeal in the diet <strong>of</strong> Clarias gariepinus (Ayinla<br />
<strong>and</strong> Ak<strong>and</strong>e, 1988; Fagbenro <strong>and</strong> Jauncey, 1994, 1995; Fagbarno, Jauncey <strong>and</strong> Hayler,<br />
1994). Excellent apparent digestibility <strong>of</strong> silage based diets has been reported <strong>for</strong><br />
Oreochromis niloticus (Fagberno, 1994; Fagbarno, Jauncey <strong>and</strong> Hayler, 1994). The<br />
application <strong>of</strong> these findings in practical feed <strong>for</strong>mulation is however limited in view <strong>of</strong><br />
TABLE 5<br />
Average proximate composition <strong>of</strong> selected animal by-products<br />
By-products Moisture Crud protein Crude lipid Crude fibre NFE Ash Ca P<br />
Fishmeal (tuna) 7.0 59.0 6.9 0.8 4.4 21.9 7.9 4.1<br />
Fishmeal (tilapia) 10.8 57.7 1.8 5.2 - 33.6 8.5 5.1<br />
Fishmeal (clupeid) 9.8 71.3 8.0 1.1 - 20.2 3.6 2.2<br />
Fishmeal (clupeid) 9.8 68.5 8.0 0.4 - 17.8 2.3 1.6<br />
Crab meal 9.1 31.7 2.4 - 10.5 46.2 - -<br />
Cray fishmeal 15.0 41.2 11.7 - 0.4 31.7 - -<br />
NFE = Nitrogen free extract<br />
Source: Eyo (1999); Ayinla (1991)
Analysis <strong>of</strong> <strong>feeds</strong> <strong>and</strong> <strong>fertilizers</strong> <strong>for</strong> <strong>sustainable</strong> aquaculture development in Nigeria 459<br />
TABLE 6<br />
Mean apparent digestibility coefficient (%) <strong>of</strong> various <strong>feeds</strong>tuffs <strong>for</strong> catfish, Clarias agboyiensis<br />
fingerlings - data are presented as the mean <strong>and</strong> range in parenthesis<br />
Apparent digestibility coefficient (%)<br />
Dry Matter Crude protein Gross energy<br />
White fishmeal 85 (82–88) 82 (81–83) 93 (89–98)<br />
Poultry by-product meal 70 (68–74) 79 (74–81) 85 (84–87)<br />
Hydrolyzed feather meal 63 (61–65) 85 (82–87) 78 (75–81)<br />
Bloodmeal 69 (68–70) 77 (74–78) 67 (64–71)<br />
Shrimp head meal 77 (73–80) 90 (87–92) 59 (57–64)<br />
Meat <strong>and</strong> bone meal 65 (62–67) 68 (63–71) 74 (72–75)<br />
Soybean meal 67 (66–71) 90 (88–93) 85 (83–87)<br />
Cottonseed meal 50 (46–54) 76 (75–77) 70 (68–72)<br />
Peanut meal 58 (52–64) 75 (72–80) 66 (63–69)<br />
Yellow maize 40 (39–42) 92 (90–93) 58 (56–61)<br />
Corn starch 45 (41–47) – 86 (84–88)<br />
Cassava meal 40 (35–43) – 74 (73–76)<br />
Sorghum 39 (32–41) 58 (50–61) 49 (48–50)<br />
Rice bran 38 (37–40) 75 (74–76) 53 (50–55)<br />
Cocoa pod meal 36 (33–43) 79 (76–81) 50 (47–53)<br />
Source: Fagbenro, Adeparusi <strong>and</strong> Fapohunda (2003)<br />
the complex processing procedures <strong>and</strong> associated high costs, hence it is not used as a<br />
major ingredient in commercial aqua<strong>feeds</strong>.<br />
3.2.2 Terrestrial animal by-products<br />
Abattoir by-products<br />
Approximately 50 000 tonnes <strong>of</strong> bloodmeal is produced annually (Fagbenro <strong>and</strong><br />
Adebayo, 2005), however the potential <strong>of</strong> abattoir wastes such as carcass, blood <strong>and</strong><br />
bonemeal <strong>for</strong> aquafeed production has been largely neglected. Bloodmeal contains<br />
about 80 percent crude protein, though the local processing methods affect lysine<br />
availability. The local bloodmeal is also deficient in isoleucine, cystine <strong>and</strong> tryptophan<br />
(Eyo, 2003). It is widely used by small-scale fish farmers, whereas its use by larger<br />
commercial farms is negligible (personal observation). The use <strong>of</strong> bonemeal as a<br />
mineral source is limited to farm-made feed producers <strong>and</strong> most <strong>of</strong> the commercial<br />
aquafeed producers use imported vitamin <strong>and</strong> mineral premixes.<br />
3.2.3 Oil seed cakes<br />
Oilseed cake meals comprise the major plant protein constituents <strong>of</strong> fish <strong>feeds</strong> in Nigeria.<br />
Copra meal<br />
It is obtained from coconut milling. The extraction <strong>of</strong> the oil produces copra / coconut<br />
meal. It is fairly high in protein (21 percent) (Adikwu, 2003), is available all year round<br />
<strong>and</strong> relatively cheap (US$0.30/kg). It can be used at a moderate level <strong>of</strong> inclusion to<br />
replace all brewers dried grain <strong>and</strong> / or palm kernel cake in tilapia <strong>feeds</strong>.<br />
Groundnut cake<br />
Annual groundnut production is around 1.8 million tonnes, from which approximately<br />
632 750 tonnes <strong>of</strong> cake is produced <strong>for</strong> domestic animal feed production. It has a<br />
crude protein content <strong>of</strong> 40–45 percent. However, due to a high dem<strong>and</strong> <strong>for</strong> human<br />
consumption <strong>and</strong> <strong>for</strong> livestock <strong>feeds</strong> the price is high (US$320–340/tonne). It is widely<br />
used in aqua<strong>feeds</strong> throughout Nigeria.<br />
Cotton seed cake<br />
Cotton seed cake is used mainly as a protein source in fish <strong>feeds</strong> by small-scale<br />
producers. It is relatively low in cystine, methionine <strong>and</strong> lysine as well as calcium (Eyo,
460<br />
<strong>Study</strong> <strong>and</strong> <strong>analysis</strong> <strong>of</strong> <strong>feeds</strong> <strong>and</strong> <strong>fertilizers</strong> <strong>for</strong> <strong>sustainable</strong> aquaculture development<br />
2003). It is a good substitute <strong>for</strong> groundnut cake in the diet <strong>of</strong> Clarias gariepinus. There<br />
are many cotton seed crushers in northern Nigeria. The annual processing capacity is<br />
520 160 tonnes. Nigeria exports cotton oilseed cake mainly to Egypt <strong>and</strong> South Africa<br />
(Fagbenro, Adeparusi <strong>and</strong> Fapohunda, 2003).<br />
Sesame seed cake<br />
Sesame is widely cultivated in the north, central <strong>and</strong> north eastern states <strong>of</strong> Nigeria<br />
<strong>and</strong> approximately 40 000 tonnes are produced annually (Fagbenro, Adeparusi <strong>and</strong><br />
Fapohunda, 2003). The cake contains 35–40 percent protein <strong>and</strong> is high in methionine<br />
<strong>and</strong> tryptophan, but limited in lysine. It contains niacin, which is not found in soybeans<br />
<strong>and</strong> is also rich in linoleic acid, vitamin E <strong>and</strong> vitamin A, B, B2 <strong>and</strong> does not contain<br />
any anti-nutrient factors. Despite the fact that it can fully replace soybean meal <strong>and</strong><br />
partly replace fishmeal, it is not widely used in aqua<strong>feeds</strong> in Nigeria (Eyo, 2003).<br />
Palm kernel cake<br />
This is the by-product <strong>of</strong> oil extraction from palm kernels. In rural areas, small-scale<br />
farmers use the cake to feed tilapia <strong>and</strong> catfish in powder <strong>for</strong>m, along with chicken<br />
manure pond fertilization. Approximately 774 000 tonnes <strong>of</strong> African oilpalm nuts<br />
were produced in 2001 (Fagbenro, Adeparusi <strong>and</strong> Fapohunda, 2003), from which over<br />
400 000 tonnes <strong>of</strong> palm kernel cake is produced <strong>for</strong> the animal feed industry (Fagbenro<br />
<strong>and</strong> Adebayo, 2005). The cake has a crude protein content <strong>of</strong> 19 percent <strong>and</strong> high<br />
fibre content (14.7 percent) <strong>and</strong> hence its inclusion level in fish <strong>feeds</strong> is less than 10<br />
percent.<br />
Soybean meal<br />
Soybean meal is a major protein source <strong>for</strong> commercial feed production in Nigeria.<br />
It is rich in lysine <strong>and</strong> low in methionine. It contains all other essential amino acids<br />
<strong>and</strong> is <strong>of</strong>ten combined with fishmeal <strong>and</strong> other plant protein sources in commercial<br />
feed rations. Because soybeans are also consumed by humans, the price is high. The<br />
local production <strong>of</strong> 255 200 tonnes falls short <strong>of</strong> the required 750 000 tonnes, hence<br />
Nigeria is a net importer <strong>of</strong> soybeans (Fagbenro, Adeparusi <strong>and</strong> Fapohunda, 2003)<br />
<strong>and</strong>, in 2004, 550 000 tonnes <strong>of</strong> soybean meal was imported (LASADA- pers. comm.).<br />
The anti-nutrient factors <strong>of</strong> soybeans are effectively destroyed by controlled heat<br />
treatment (roasting, parboiling <strong>and</strong> extrusion) (Eyo, 1999; Balogun <strong>and</strong> Ologhobo<br />
1989; Fagbenro <strong>and</strong> Davies, 2003). Soybean oil is not produced in Nigeria; hence full<br />
fat soybean meal is used in aqua<strong>feeds</strong>.<br />
3.2.4 Oils<br />
The oils used <strong>for</strong> animal <strong>and</strong> fish feed production are listed in Table 7, together with<br />
prices <strong>and</strong> relative availability. Corn oil is most commonly used <strong>for</strong> commercial fish<br />
feed production.<br />
TABLE 7<br />
Fish <strong>and</strong> vegetable oil availability <strong>and</strong> price<br />
Price<br />
(US$/litre)<br />
Availability<br />
Fish oil (imported) 3.50–4.00 Scarce<br />
Palm oil 1.10–1.20 Adequate<br />
Groundnut oil 1.60–1.80 Adequate<br />
Soybean oil 1.40–1.50 Adequate<br />
Coconut oil 2.20–2.40 Scarce<br />
Corn oil 1.35–1.40 Scarce<br />
Olive oil (imported) 1.00–1.20 Scarce<br />
Mixed vegetable oil 1.10–1.15 Low<br />
Source: Fagbenro <strong>and</strong> Adebayo (2005)<br />
3.2.5 Cereal grains <strong>and</strong> by-products<br />
Total grain production in 2000<br />
was a little over 35 million tonnes,<br />
comprising maize, sorghum, millet,<br />
rice <strong>and</strong> wheat (Fagbenro, Adeparusi<br />
<strong>and</strong> Fapohunda, 2003). The proximate<br />
composition <strong>of</strong> local cereals grains<br />
<strong>and</strong> their by-products is shown in<br />
Table 8. Sorghum <strong>and</strong> millet can be<br />
used as alternatives to maize as energy<br />
sources in aqua<strong>feeds</strong> (Table 9).
Analysis <strong>of</strong> <strong>feeds</strong> <strong>and</strong> <strong>fertilizers</strong> <strong>for</strong> <strong>sustainable</strong> aquaculture development in Nigeria 461<br />
TABLE 8<br />
Proximate composition (% as fed basis) <strong>of</strong> cereal grains <strong>and</strong> by-products<br />
Feedstuff Moisture Crude protein Crude lipid Crude fibre NFE Ash<br />
White maize 8.6 9.3 5.0 2.4 70.9 1.7<br />
Yellow maize 9.6 10.1 3.6 3.5 71.2 0.2<br />
Guinea corn 11.2 11.2 2.5 2.3 74.1 1.8<br />
Millet 8.7 4.8 1.3 38.3 41.2 5.7<br />
Rice bran – 6.9 4.4 40.2 6.7 21.8<br />
Sorghum 12.0 7.8 4.8 7.6 65.7 2.1<br />
NFE=Nitrogen free extract<br />
Source: Eyo (2003)<br />
TABLE 9<br />
Conventional <strong>and</strong> alternative ingredients <strong>and</strong> their maximum recommend inclusion rates<br />
Maximum<br />
Nutrient Conventional <strong>feeds</strong>tuffs % <strong>of</strong> feed Alternative <strong>feeds</strong>tuffs<br />
inclusion (%)<br />
Protein Fishmeal<br />
Soybean meal<br />
Energy Maize<br />
Cod liver oil<br />
Minerals Oyster shell<br />
Bone meal<br />
Dicalcium phosphate<br />
Additives Vitamin premix<br />
Mineral premix<br />
Source: Fagbenro, Adeparusi <strong>and</strong> Fapohunda (2003)<br />
40<br />
45<br />
50<br />
10<br />
7.5<br />
2.5<br />
2.5<br />
1<br />
1<br />
Groundnut cake<br />
Palm kernel cake<br />
Cottonseed cake<br />
Jack bean<br />
Poultry <strong>of</strong>fal<br />
Sorghum<br />
Cassava<br />
Sweet potato<br />
Corn oil<br />
Soybean oil<br />
Palm oil<br />
Periwinkle shell<br />
Limestone<br />
Malt dust<br />
Common salt<br />
3.2.6 Brewery by-products<br />
The most important by-products <strong>of</strong> the brewing industry are brewers’ wet waste, dried<br />
grains <strong>and</strong> maize grits. Brewers dried grain is the extracted residue <strong>of</strong> fermented barley<br />
or barley mixed with other cereals. It is low in energy but high in fibre. Only limited<br />
quantities are available <strong>and</strong> it is included into fish <strong>feeds</strong> at 5 percent or less. Corn grits<br />
are the medium sized, hard, flinty portions <strong>of</strong> ground corn, containing little or none <strong>of</strong><br />
the bran or germ. Production <strong>of</strong> this by-product is increasing as a consequence <strong>of</strong> the<br />
malt importation ban. Corn grits could replace 25–50 percent <strong>of</strong> cereals in fish <strong>feeds</strong>,<br />
which would significantly reduce the cost <strong>of</strong> feed.<br />
3.2.7 Flour milling by-products<br />
Wheat bran <strong>and</strong> wheat middlings are the major by-products. Wheat bran is high in<br />
fibre, which limits its inclusion level in most aqua<strong>feeds</strong>, with the exception <strong>of</strong> tilapia<br />
<strong>feeds</strong>. It is high in niacin. Wheat middlings, although having higher protein content<br />
than wheat bran, is also fibrous <strong>and</strong> is included at 10 percent in tilapia <strong>feeds</strong>.<br />
3.2.8 Starch roots <strong>and</strong> tubers<br />
Root crops (cassava, yam, potato) constitute the main staple foods in Nigeria. Nigeria<br />
has become the world’s leading producer <strong>of</strong> cassava (30 million tonnes in 2004). It<br />
is estimated that cassava peel, leaves, pomace from starch <strong>and</strong> garri (cassava flour)<br />
residues amount to some 6 million tonnes (Fagbenro, Adeparusi <strong>and</strong> Fapohunda,<br />
2003). Some <strong>of</strong> these by-products are either fed directly to fish in ponds or used in<br />
aquafeed production at an inclusion level <strong>of</strong> 10 percent or less.<br />
25<br />
15<br />
20<br />
10<br />
10<br />
50<br />
40<br />
20<br />
10<br />
10<br />
10<br />
7.5<br />
5<br />
2<br />
2
462<br />
<strong>Study</strong> <strong>and</strong> <strong>analysis</strong> <strong>of</strong> <strong>feeds</strong> <strong>and</strong> <strong>fertilizers</strong> <strong>for</strong> <strong>sustainable</strong> aquaculture development<br />
3.2.9 Non-conventional feed resources<br />
The high price <strong>of</strong> compounded <strong>feeds</strong> (Table 10) is a major constraint to fish farmers<br />
(Ayinla <strong>and</strong> Bekibele, 1992; Ayinla <strong>and</strong> Ajayi, 1996). Other cheaper resources, not used<br />
<strong>for</strong> human consumption, have there<strong>for</strong>e been identified, explored <strong>and</strong> tested as fish<br />
feed ingredients. However, these non-conventional resources, <strong>of</strong> either animal or plant<br />
origin, are uncommon on the market <strong>and</strong> are there<strong>for</strong>e not readily available to larger<br />
feed manufacturers.<br />
Some <strong>of</strong> the non-conventional fish feed ingredients <strong>of</strong> animal origin include:<br />
maggots, termites, earthworms, chicken <strong>of</strong>fal, hydrolyzed feather meal <strong>and</strong> toad meal.<br />
The proximate composition <strong>of</strong> some <strong>of</strong> these is shown in Table 11 <strong>and</strong> several can<br />
readily be included into aqua<strong>feeds</strong> (Table 12). However, because <strong>of</strong> the high production<br />
costs their use in commercial aquafeed production is limited (Bekibele, Wuyep <strong>and</strong><br />
Ayinla, 2000).<br />
TABLE 10<br />
Price <strong>of</strong> some aqua<strong>feeds</strong> in comparison to chicken <strong>and</strong> pig feed<br />
Feed type<br />
Aquafeed<br />
Price (US$/kg)<br />
4 mm grow-out (floating pellet, imported) 1.50<br />
4 mm grow-out (floating pellet, local) 1.30<br />
4 mm grow-out (farm-made sinking pellet) 1.10<br />
2–3 mm juvenile feed (floating pellet <strong>for</strong> catfish, imported) 3.00<br />
0.2–0.3 mm fingerling feed (floating pellet <strong>for</strong> catfish, imported) 3.00<br />
0.3–0.5 mm fingerling (floating pellet <strong>for</strong> catfish, imported) 3.00<br />
1.0–1.2 mm juvenile (floating pellet <strong>for</strong> catfish, imported) 3.50<br />
2 mm grow-out (floating pellet, imported) 1.50<br />
Mash <strong>for</strong> farm-made <strong>feeds</strong> <strong>for</strong> polyculture <strong>of</strong> tilapia <strong>and</strong> African catfish<br />
Chicken feed<br />
0.60<br />
Starter mash 1.20<br />
Grower mash 0.80<br />
Finisher mash 1.00<br />
Pig feed 0.50<br />
Source: Lagos market survey (2005)<br />
TABLE 11<br />
Proximate composition (% fresh weight/as fed basis) <strong>of</strong> aquatic <strong>and</strong> terrestrial plants <strong>and</strong><br />
animals<br />
Feedstuffs Moisture Crude<br />
protein<br />
Crude<br />
lipid<br />
Crude<br />
fibre<br />
NFE Ash<br />
Aquatic fern (Azolla sp), fresh 93.5 1.7 0.3 0.6 3.2 0.1<br />
Aquatic fern (Azolla sp), dry - 25.3 3.8 2.3 49.1 12.5<br />
Water hyacinth (Eichhornia crassipes), fresh 91.5 1.2 0.3 1.9 3.8 1.3<br />
Water hyacinth, dry 10.5 14.2 1.3 9.4 20.0 44.6<br />
Water lettuce (Psitra stratisles), fresh 93.6 1.2 0.3 1.0 2.0 1.6<br />
Water lettuce, dry - 15.9 4.2 20.8 36.1 23.0<br />
Maggot, dry 9.3 43.8 1.9 14.3 22.3 14.3<br />
Earthworm, dried 5.0 56.4 7.8 1.6 25.4 8.8<br />
Chicken <strong>of</strong>fal, dried 8.6 47.5 22.8 5.0 6.1 10.9<br />
Chicken <strong>of</strong>fal, cooked & dried 8.3 61.6 16.5 3.5 2.2 9.0<br />
Toad meal, dried 5.4 59.3 11.5 0 5.3 18.5<br />
Hydrolysed feather meal 8.1 84.2 2.8 1.0 0.5 3.4<br />
Mucuna feed meal - 32.1 4.6 6.9 54.1 2.3<br />
Mango kernel meal - 10.3 10.9 2.0 68.0 2.6<br />
Cocoa cake, defatted 12.9 24.9 5.0 9.0 42.1 6.1<br />
Bloodmeal 11.8 86.0 0.7 2.1 6.5 5.2<br />
Source: Tacon (1987); Ayinla (1991); Joseph <strong>and</strong> Abolaji (1997); Bekibele, Wuyep <strong>and</strong> Ayinla, 2000; Eyo (2003);<br />
Siddhuraju <strong>and</strong> Becker (2001); Faturoti (2002); Madu <strong>and</strong> Ufodike, (2003)
Analysis <strong>of</strong> <strong>feeds</strong> <strong>and</strong> <strong>fertilizers</strong> <strong>for</strong> <strong>sustainable</strong> aquaculture development in Nigeria 463<br />
TABLE 12<br />
Unconventional <strong>feeds</strong>tuffs <strong>and</strong> their optimum inclusion levels in aqua<strong>feeds</strong><br />
Feedstuff Fish species Maximum inclusion rate <strong>and</strong> ingredients/nutrients substituted<br />
Jackbean (Canavalia ensi<strong>for</strong>mis) C. gariepinus 15–30% (replacement <strong>of</strong> soybean meal)<br />
Fish silage C. gariepinus 41% (replacement <strong>of</strong> fishmeal)<br />
Shrimp head meal C. gariepinus 10% (replacement <strong>of</strong> fishmeal)<br />
Mango kernel Labeo senegalensis Replacement <strong>of</strong> protein 10% unprocessed or 20% boiled<br />
Duck weed S. galilaeus 15% (replacement <strong>of</strong> carbohydrate source)<br />
Winged bean (Psophocarpus<br />
tertragonolobus)<br />
C. gariepinus 50% (replacement <strong>of</strong> fishmeal)<br />
Macadamia presscake O. niloticus 50% (protein)<br />
Poultry by-product silage meal C. gariepinus 15–30% (protein)<br />
Poultry viscera silage meal C. gariepinus 15–30% (protein)<br />
Source: Ayinla <strong>and</strong> Ak<strong>and</strong>e (1988); Mbagwu, Okoye <strong>and</strong> Adeniyi (1990); Balogun <strong>and</strong> Fagbenro (1995); Fagbenro<br />
<strong>and</strong> Fasakin (1996); Joseph <strong>and</strong> Abolaji (1997); Fagbenro (1999); Alegbeleye, Oresegun <strong>and</strong> Ajitomi (2001)<br />
3.3 Aquafeed production<br />
3.3.1 Commercial aquafeed production<br />
Aquafeed production is a recent initiative <strong>and</strong> since 2000 has mirrored the upsurge in<br />
commercial fish farming. There are at least 10 commercial aquafeed producers <strong>and</strong> a new<br />
factory with a capacity <strong>of</strong> 13 000 tonnes per annum has recently been commissioned<br />
in Ilorin, Kwara State. In addition, a <strong>for</strong>eign company is planning to establish in Lagos<br />
an aquafeed production unit, with an annual capacity <strong>of</strong> 15 000 tonnes. There is one<br />
industry that has the necessary infrastructure to produce extruded floating pellets <strong>and</strong><br />
has recently started producing extruded floating pellet on pilot scale with a production<br />
capacity <strong>of</strong> 6 tonnes per day (Hasan, 2005) (Figure 1). All <strong>of</strong> the commercial feed<br />
producers target the needs <strong>of</strong> catfish farmers. However, specifically <strong>for</strong>mulated <strong>and</strong><br />
extruded pellets <strong>for</strong> the early rearing stages <strong>of</strong> Clarias gariepinus are imported from<br />
Aquanutro (Pty), Ltd in South Africa.<br />
Shipton <strong>and</strong> Hecht (2005) reported that Nigeria has 620<br />
animal feed manufacturers with an installed capacity <strong>of</strong><br />
7.25 million tonnes per year, producing approximately 3.8<br />
million tonnes annually. The majority <strong>of</strong> feedmills are small<br />
<strong>and</strong> produce between 0.5–5.0 tonnes/hour. As previously<br />
mentioned, poultry feed production is the major animal feed<br />
business, although now there is a trend <strong>for</strong> these mills to<br />
install pelletizers <strong>and</strong> dryers to produce fish <strong>feeds</strong>. Currently<br />
(2006) there are some 32 larger feed producers <strong>and</strong> around 500<br />
smaller producers (O.A. Fagbenro, pers. comm., 2006).<br />
Based on data <strong>for</strong> 2001, Shipton <strong>and</strong> Hecht (2005) projected<br />
(on the basis <strong>of</strong> a 10 percent growth rate) that Nigeria<br />
would produce some 128 559 tonnes <strong>of</strong> fish by 2015. The<br />
probability <strong>of</strong> surpassing this projected production level is<br />
high in view <strong>of</strong> unprecedented private sector participation<br />
<strong>and</strong> investment in aquaculture. Furthermore, the Federal<br />
Government has put in place intervention programmes such<br />
as the Special Programme <strong>for</strong> Food Security (NSPFS) with a<br />
focus on private sector participation in the promotion <strong>of</strong> food<br />
production (aquaculture inclusive). Each state <strong>of</strong><br />
the federation promotes aquaculture in various<br />
ways. This will add enormous pressure on the<br />
production <strong>of</strong> adequate quantities <strong>of</strong> fish <strong>feeds</strong>.<br />
Until very recently feed millers produced a<br />
general purpose fish feed with crude protein<br />
content ranging from 15–30 percent. Aquafeed<br />
FIGURE 1<br />
Extruded floating pellet produced<br />
by CHI Industries Ltd., Ibadan,<br />
Oyo State<br />
TABLE 13<br />
Fish feed production (tonnes) in Nigeria in 2000/01<br />
Fish species Farm-made Commercial Total<br />
Tilapia 14 258 6 554 20 812<br />
Catfish 10 552 4 206 14 758<br />
Total 24 810 10 760 35 570<br />
Source: Fagbenro <strong>and</strong> Adebayo (2005)<br />
COURTESY OF MOHAMMAD R. HASAN
464<br />
<strong>Study</strong> <strong>and</strong> <strong>analysis</strong> <strong>of</strong> <strong>feeds</strong> <strong>and</strong> <strong>fertilizers</strong> <strong>for</strong> <strong>sustainable</strong> aquaculture development<br />
TABLE 14<br />
Some feed <strong>for</strong>mulations <strong>for</strong> catfish <strong>and</strong> tilapia in Nigeria (% dry<br />
matter basis)<br />
Ingredient Catfish <strong>feeds</strong> (40% CP) Tilapia feed<br />
Grower Broodstock<br />
(30% CP)<br />
Fishmeal (65% CP) 25 25 15<br />
Soybean meal (45% CP) 35 35 45<br />
Maize 15 10 25<br />
Bloodmeal (85% CP) 10 10 -<br />
Fish oil 6 9 4<br />
Vegetable oil 4 6 6<br />
Vitamin <strong>and</strong> mineral premix 3 3 3<br />
Binder 2 2 2<br />
CP=crude protein<br />
Source: Fagbenro, Adeparusi <strong>and</strong> Fapohunda (2003)<br />
production in Nigeria is summarized<br />
in Table 13. It was not possible to<br />
obtain accurate figures <strong>for</strong> imported<br />
fish <strong>feeds</strong>. The upsurge <strong>of</strong> interest in<br />
fish farming, in general, <strong>and</strong> intensive<br />
culture <strong>of</strong> C. gariepinus in particular,<br />
has stimulated the production <strong>of</strong><br />
specific tilapia <strong>and</strong> catfish <strong>feeds</strong><br />
(Table 14).<br />
The price <strong>of</strong> catfish grow-out feed<br />
has increased <strong>for</strong>m US$0.50–1.00/kg<br />
in 2000, to between US$0.60–1.50/kg<br />
in 2004. The highly variable prices are<br />
a consequence <strong>of</strong> fluctuations on the<br />
international commodity markets <strong>and</strong> the fluctuating rate <strong>of</strong> the local currency.<br />
3.3.2 Farm-made feed production<br />
Some small-scale farmers, particularly in rural areas, still adopt traditional feeding<br />
methods using cassava peels, palm fruits, household waste, pawpaw leaves <strong>and</strong> corn<br />
wastes. However, in view <strong>of</strong> the general awareness <strong>of</strong> the importance <strong>of</strong> feeding fish to<br />
enhance production these practices are slowly disappearing. Many small-scale farmers<br />
now compound their <strong>feeds</strong> using locally available ingredients such as rice bran, corn<br />
meal, bloodmeal, brewers waste, groundnut cake, palm kernel cake etc. These <strong>feeds</strong>tuffs<br />
are ground separately, weighed <strong>and</strong> mixed according to specific <strong>for</strong>mulations. Many<br />
farmers feed the <strong>for</strong>mulated mash directly, while others manufacture their own pellets<br />
or moist feed balls (see later). Corn or cassava starch is used as a binder.<br />
All medium <strong>and</strong> large-scale fish farmers use sinking or floating pellets with FCRs<br />
<strong>of</strong> 1.5 to 2.5:1, depending on the level <strong>of</strong> management. Most <strong>of</strong> the successful medium<br />
<strong>and</strong> large-scale farmers have their own small feedmills, which enable them to control<br />
their production systems <strong>and</strong> cycles. The machinery used ranges from adapted poultry<br />
feed machinery, locally fabricated pelletizers to imported hammer mills, mixers <strong>and</strong><br />
pelletizers. Many successful fish farmers also produce chickens <strong>and</strong> use the innards <strong>and</strong><br />
other <strong>of</strong>fal as ingredients <strong>for</strong> farm-made aqua<strong>feeds</strong>. This has significantly reduced their<br />
feed costs <strong>and</strong> some reportedly spend US$0.30 as feed input to produce a kilogramme<br />
<strong>of</strong> fish, which sells at US$2.00 (Hammed, pers. comm.). However, these are exceptional<br />
cases.<br />
The process <strong>of</strong> manufacturing farm-made <strong>feeds</strong> in Nigeria is as follows. After<br />
heating or cooking the ingredients, to destroy the anti-nutrient factors <strong>and</strong> to improve<br />
digestibility, they are cooled <strong>and</strong> milled (Figure 2a). The ingredients are compounded<br />
<strong>and</strong> mixed, either by h<strong>and</strong> or mechanically in simple mixers such as a concrete mixer<br />
(Figure 2b). Hot water is then added <strong>and</strong> the mixture is kneaded into dough. Cassava<br />
or corn starch is added as a binder if the cereals are not sufficient to bind the particles.<br />
The dough is then passed through a<br />
FIGURE 2<br />
Local grinder used <strong>for</strong> grinding feed ingredients (left) <strong>and</strong><br />
cement mixer adapted <strong>for</strong> feed mixing (right)<br />
meat mincer (Figure 3) or per<strong>for</strong>ated<br />
metal sheets to <strong>for</strong>m moist ”spaghetti”<br />
like str<strong>and</strong>s, which are either fed to<br />
the fish in the moist <strong>for</strong>m or are sun<br />
dried, by placing them on corrugated<br />
iron sheets or using home made or<br />
locally manufactured electric dryers<br />
(Figure 4).<br />
One <strong>of</strong> the major problems in the<br />
use <strong>of</strong> farm-made <strong>feeds</strong> is the short
Analysis <strong>of</strong> <strong>feeds</strong> <strong>and</strong> <strong>fertilizers</strong> <strong>for</strong> <strong>sustainable</strong> aquaculture development in Nigeria 465<br />
shelf life <strong>of</strong> the <strong>feeds</strong> <strong>and</strong> this is mainly because farmers do<br />
not use any anti-oxidants. Inadequate storage also results<br />
in insect <strong>and</strong> rodent infestation. Most aquafeed producers<br />
in Nigeria are not conscious <strong>of</strong> these problems hence<br />
the careless method <strong>of</strong> packaging <strong>and</strong> storage <strong>of</strong> feed.<br />
To improve the shelf life <strong>of</strong> feed some producers have<br />
recently started using sodium propionate at an inclusion<br />
level <strong>of</strong> 0.1 percent as an anti-fungal agent.<br />
Feed <strong>for</strong>mulations vary according to the availability <strong>of</strong><br />
ingredients. Some <strong>of</strong> the on-farm <strong>for</strong>mulations <strong>for</strong> catfish<br />
<strong>and</strong> tilapia are shown in Table 14. Vitamin premixes<br />
commonly used by the poultry industry are also used in<br />
the manufacture <strong>of</strong> fish <strong>feeds</strong>. In the absence <strong>of</strong> premixes,<br />
vitamins are provided by the addition<br />
<strong>of</strong> milk, liver, kidney, yeast, egg, green<br />
vegetables, fruits <strong>and</strong> poultry viscera.<br />
3.4 Feeds, feeding frequency <strong>and</strong><br />
ration<br />
As previously indicated, fish farmers<br />
use a vast variety <strong>of</strong> <strong>feeds</strong>, ranging<br />
from non-conventional ingredients<br />
to extruded floating pellets. The<br />
small-scale, largely subsistence,<br />
farmers mainly rely on natural<br />
pond productivity <strong>and</strong> occasional<br />
supplementary feeding with single, low nutrient, <strong>feeds</strong> such as rice or maize bran. This<br />
practice is being rapidly replaced by more scheduled feeding practices. The following<br />
<strong>feeds</strong> are used by commercial farmers in Nigeria.<br />
Extruded floating pellets: Imported extruded floating pellets have gained popularity<br />
among fish farmers engaged in intensive culture <strong>of</strong> C. gariepinus, with FCRs <strong>of</strong> 0.95 to<br />
1:1. However, because <strong>of</strong> the high price, imported floating pellets are now only used<br />
as a starter feed <strong>for</strong> the first month <strong>of</strong> production <strong>and</strong> thereafter locally manufactured<br />
<strong>feeds</strong> are used <strong>for</strong> the 4–5 month production cycle. This practice has increased<br />
their pr<strong>of</strong>it margin. At this stage there is no better<br />
alternative feed <strong>for</strong> the first month <strong>of</strong> production.<br />
These pellets are used only in high density flowthrough<br />
or recirculation systems.<br />
Sinking pellet: Locally manufactured sinking<br />
pellets are commonly used. They are cheaper than<br />
the imported floating pellets, but their use requires a<br />
greater degree <strong>of</strong> management. They are widely used<br />
in semi-intensive polyculture <strong>of</strong> C. gariepinus <strong>and</strong> O.<br />
niloticus in fertilized ponds, with FCRs <strong>of</strong> 1.6 to 2.5:1<br />
<strong>and</strong> are also used <strong>for</strong> grow-out <strong>of</strong> catfish under high<br />
density tank farming conditions (Figures 5 <strong>and</strong> 6).<br />
Mash: Mash or meals are prepared by grinding or<br />
crushing pellets to fine particles (0.35–0.5mm) or by<br />
mixing various ingredients to required <strong>for</strong>mulations.<br />
Leaching <strong>of</strong> nutrients is a major problem as they are<br />
fed either in a dry <strong>for</strong>m or as dough. These <strong>feeds</strong><br />
are <strong>of</strong>ten used <strong>for</strong> O. niloticus <strong>and</strong> C. gariepinus<br />
fingerlings when adequate particle size pellets are<br />
FIGURE 3<br />
On-farm pelleting process using a meat<br />
mincer<br />
FIGURE 4<br />
Sun drying <strong>of</strong> pelleted feed on top <strong>of</strong> concrete ponds (left)<br />
<strong>and</strong> a locally fabricated electric dryer (right)<br />
FIGURE 5<br />
Broodstock <strong>of</strong> African catfish, Clarias<br />
gariepinus kept in outdoor recirculatory<br />
rearing tank <strong>and</strong> fed with sinking<br />
pelleted feed, Ibadan<br />
COURTESY OF MOHAMMAD R. HASAN
COURTESY OF MOHAMMAD R. HASAN<br />
466<br />
FIGURE 6<br />
High density rearing <strong>of</strong> African catfish in<br />
an indoor recirculatory tank. Fish are fed<br />
with sinking pelleted diet using a locally<br />
manufactured dem<strong>and</strong> feeder, Ibadan<br />
<strong>Study</strong> <strong>and</strong> <strong>analysis</strong> <strong>of</strong> <strong>feeds</strong> <strong>and</strong> <strong>fertilizers</strong> <strong>for</strong> <strong>sustainable</strong> aquaculture development<br />
TABLE 15<br />
Fish farm labour requirements in Nigeria<br />
Farm size Level <strong>of</strong><br />
intensity<br />
unavailable <strong>and</strong> <strong>for</strong> table fish production in fertilized<br />
ponds.<br />
Crumbles: Crumbles are also commonly used <strong>for</strong><br />
fattening fingerlings to table size fish with FCRs ranging<br />
from 3.0 to 3.5:1. They are used in rural areas where<br />
there are no facilities <strong>for</strong> pelleting.<br />
Artemia: Artemia nauplii are only used <strong>for</strong> a few<br />
days during the early larval rearing phase <strong>of</strong> African<br />
catfish. All Artemia cysts are imported.<br />
Many <strong>of</strong> the small-scale commercial farmers cannot<br />
af<strong>for</strong>d the locally manufactured pelleted <strong>feeds</strong>, hence<br />
the bulk <strong>of</strong> fish <strong>feeds</strong> (69.75 percent) are farm-made<br />
(dry mash, dough balls <strong>and</strong> meat mincer pellets, fed in<br />
moist or sun dried <strong>for</strong>m). Two main types <strong>of</strong> <strong>feeds</strong> are<br />
produced commercially, viz. tilapia <strong>feeds</strong> that contain<br />
25–30 percent crude protein <strong>and</strong> catfish <strong>feeds</strong> that<br />
contain 40–50 percent protein <strong>for</strong> the various phases<br />
<strong>of</strong> growth. In view <strong>of</strong> the recent expansion <strong>of</strong> intensive<br />
Labour<br />
required<br />
Cost implication<br />
(US$ per month)<br />
Small (1–2 ponds <strong>of</strong> 0.1 ha each) Semi intensive 2 60–70<br />
Small (1–2 ponds or 4–6 tanks <strong>of</strong> 10 m3 ) Intensive 4 130–140<br />
Medium 3–10 ponds 0.1 ha each Semi intensive 4 130–140<br />
7–12 tanks <strong>of</strong> 10 m3 each Intensive 6 160–170<br />
Source: Interviews with fish farmers in Lagos <strong>and</strong> Yola<br />
catfish farming the commercial feed producers are focusing their ef<strong>for</strong>ts on producing<br />
improved catfish <strong>feeds</strong>.<br />
Feeding rates <strong>for</strong> fish are either based on percent body weight, or alternatively, they<br />
are fed to satiation on an ad libitum basis. In most cases 5 percent <strong>of</strong> the body weight<br />
<strong>of</strong> the st<strong>and</strong>ing crop is adopted as a st<strong>and</strong>ard <strong>for</strong> grow-out. Under semi-intensive pond<br />
farming conditions the fish are normally fed twice a day, while C. gariepinus under<br />
intensive culture conditions are fed four to six times per day.<br />
Feed is either applied manually or mechanically. Manual feeding is the most common<br />
<strong>and</strong> popular method <strong>and</strong> is carried out by broadcasting the feed over the water surface<br />
or at established feeding points. Although it is labour intensive, it allows the farmer<br />
to observe the feeding behaviour <strong>of</strong> the fish. Mechanical feeding with dem<strong>and</strong> or<br />
automatic feeders is not widely used in Nigeria, except on one or two commercial<br />
farms or otherwise on an experimental level.<br />
3.5 Labour<br />
Labour is required <strong>for</strong> feed preparation, feed application, general pond management <strong>and</strong><br />
harvesting. The number <strong>of</strong> labourers required is a factor <strong>of</strong> farm size <strong>and</strong> production<br />
intensity. A general breakdown <strong>of</strong> fish farm labour requirements <strong>and</strong> costs are shown<br />
in Table 15.<br />
4. OVERVIEW OF THE ANIMAL FEED INDUSTRY<br />
Livestock <strong>and</strong> poultry husb<strong>and</strong>ry is widespread in Nigeria. The bulk <strong>of</strong> the ruminants<br />
(cattle, sheep, <strong>and</strong> goats) depend on rangel<strong>and</strong>s <strong>and</strong> grazing reserves (Fagbenro <strong>and</strong><br />
Adebayo, 2005), while pigs are reared using traditional systems or in commercial<br />
piggeries. The bulk <strong>of</strong> the poultry consumed in Nigeria is produced on commercial
Analysis <strong>of</strong> <strong>feeds</strong> <strong>and</strong> <strong>fertilizers</strong> <strong>for</strong> <strong>sustainable</strong> aquaculture development in Nigeria 467<br />
broiler farms, hence the animal feed industry<br />
is dominated by poultry feed producers.<br />
Animal feed production in 2001 is presented<br />
in Table 16.<br />
In semi-intensive <strong>and</strong> intensive pig <strong>and</strong><br />
poultry production systems <strong>feeds</strong> comprise<br />
20–30 percent <strong>of</strong> the total production cost.<br />
Although the production <strong>of</strong> conventional<br />
TABLE 16<br />
Animal <strong>and</strong> aquaculture feed production in<br />
Nigeria in 2001<br />
Feed type Quantity (tonnes) Percent <strong>of</strong> total<br />
Poultry 2 591 732 68.20<br />
Pig 1 084 214 28.53<br />
Rabbits 88 409 2.33<br />
Fish 35 570 0.94<br />
Source: Fagbenro <strong>and</strong> Adebayo (2005)<br />
livestock <strong>feeds</strong> has risen steadily over the years, the poor distribution channels <strong>and</strong><br />
feed quality constitute major constraints to the growth <strong>and</strong> pr<strong>of</strong>itability <strong>of</strong> intensive<br />
livestock <strong>and</strong> poultry enterprises (Fagbenro <strong>and</strong> Adebayo, 2005). In 2000, the industry’s<br />
operational production efficiency was 52.4 percent (Fagbenro <strong>and</strong> Adebayo, 2005).<br />
The animal feed industry in Nigeria is unregulated. There are no quality control<br />
st<strong>and</strong>ards <strong>and</strong> there is no animal feed producer association. The total supply <strong>of</strong> all<br />
locally produced <strong>feeds</strong> does not appear to adequately meet the present dem<strong>and</strong>. This<br />
may be due to shortages in the imported supply <strong>of</strong> fishmeal <strong>and</strong> soybeans.<br />
The cost <strong>of</strong> feed commodities reflects free market <strong>for</strong>ces <strong>of</strong> supply <strong>and</strong> dem<strong>and</strong> in<br />
Nigeria. As a result <strong>of</strong> the heavy dependence on imported concentrates, fluctuations<br />
in prices are common. The cost <strong>of</strong> <strong>feeds</strong>tuffs also varies due to general inflation,<br />
the <strong>of</strong>ficial regulation <strong>of</strong> commodity markets by import control subsidies <strong>and</strong> state<br />
purchases <strong>of</strong> staple feed commodities.<br />
4.1 Problems <strong>and</strong> constraints<br />
Competition <strong>for</strong> the use <strong>of</strong> conventional feed ingredients <strong>for</strong> human <strong>and</strong> animal<br />
consumption has resulted in significant price escalations. This <strong>and</strong> the general shortage<br />
<strong>of</strong> fishmeal <strong>and</strong> soybeans warrant the need <strong>for</strong> on-going research on alternative<br />
ingredients <strong>for</strong> use in aqua<strong>feeds</strong>. In particular the research must focus on those<br />
commodities that are not in dem<strong>and</strong> <strong>for</strong> human consumption. Also, there is a need<br />
to develop cost effective technologies <strong>for</strong> the production <strong>of</strong> non-conventional feed<br />
ingredients (e.g. toad <strong>and</strong> tadpole meal, fish silage). Much work has been done in<br />
Nigeria to replace fishmeal with other proteins <strong>of</strong> plant <strong>and</strong> animal origin. Protein<br />
sources <strong>of</strong> animal origin include terrestrial <strong>and</strong> aquatic worms, fish silage, bloodmeal,<br />
insect larvae, poultry by-product meal, meat <strong>and</strong> bonemeal, tadpole meal, while plant<br />
protein commodities include jackbean (Canavalia ensi<strong>for</strong>mis), algae meals, bambara<br />
bean etc. The results range from poor to very good in terms <strong>of</strong> fish growth <strong>and</strong> feed<br />
conversion efficiency. While unconventional <strong>feeds</strong>tuffs can be used in aquaculture, it<br />
seems that the use <strong>of</strong> fishmeal is largely still indispensable in intensive culture <strong>of</strong> species<br />
such as C. gariepinus. With the long-term aquaculture production target <strong>of</strong> 2 million<br />
tonnes, the dem<strong>and</strong> <strong>for</strong> aquafeed will be around 4 million tonnes. It is there<strong>for</strong>e vital<br />
<strong>for</strong> the feed industry to become better organized <strong>and</strong> regulated.<br />
There are other problems that also constrain the animal feed industry. For example,<br />
the lengthy customs clearing process <strong>of</strong>ten results in spoilage <strong>of</strong> ingredients. If this<br />
problem is not addressed <strong>and</strong> resolved it will severely constrain the development <strong>of</strong><br />
urban <strong>and</strong> peri-urban aquaculture in the country. Clearly, there is a need <strong>for</strong> the Federal<br />
Government to assess the needs <strong>and</strong> constraints faced by the sector <strong>and</strong> to develop the<br />
necessary institutional plat<strong>for</strong>ms <strong>for</strong> aquaculture to exp<strong>and</strong> such that the production<br />
targets can be met.<br />
Despite the relatively good road <strong>and</strong> transport network, farmers in rural areas are<br />
constrained by the supply <strong>and</strong> cost <strong>of</strong> feed. While some still use “junk food”, such as<br />
kitchen waste, brans <strong>and</strong> other farm residues, many fish farmers now source ingredients<br />
directly from the producers <strong>and</strong> make their own farm-made <strong>feeds</strong>. It is estimated that<br />
close on 70 percent <strong>of</strong> all aqua<strong>feeds</strong> presently used in Nigeria are compounded, farmmade<br />
<strong>feeds</strong>.
468<br />
<strong>Study</strong> <strong>and</strong> <strong>analysis</strong> <strong>of</strong> <strong>feeds</strong> <strong>and</strong> <strong>fertilizers</strong> <strong>for</strong> <strong>sustainable</strong> aquaculture development<br />
5. RECOMMENDATIONS<br />
• Contrary to other countries in sub-Saharan Africa, aquaculture in Nigeria is a<br />
private sector driven initiative. The rapid growth <strong>of</strong> the sector in Nigeria has given<br />
rise to several problems that now constrain its expansion. In particular, these<br />
constraints revolve around the issue <strong>of</strong> <strong>feeds</strong>.<br />
• For the sector to exp<strong>and</strong> <strong>and</strong> to reach its production targets there is a need<br />
<strong>for</strong> the Federal Government to assess <strong>and</strong> identify the needs <strong>of</strong> the sector <strong>and</strong><br />
the constraints faced by fish farmers <strong>and</strong> to develop appropriate institutional<br />
plat<strong>for</strong>ms <strong>and</strong> incentives to promote its rapid development.<br />
• There is a need <strong>for</strong> the government to develop an animal <strong>feeds</strong> policy <strong>and</strong> to<br />
promulgate an animal <strong>feeds</strong> act, so that the feed industry can be regulated to<br />
assure the supply <strong>of</strong> quality <strong>feeds</strong>.<br />
• There is a need <strong>for</strong> feedmills to improve their storage facilities to stockpile<br />
materials <strong>and</strong> <strong>for</strong> the industry to supply the market with better quality <strong>feeds</strong>.<br />
• Given the dependency <strong>of</strong> the country on soybean imports, Nigeria should<br />
examine <strong>and</strong> provide incentives to promote soybean farming.<br />
• There should be a greater emphasis on research into anti-nutrient factors in<br />
pulses, which are plentiful in Nigeria, e.g. jackbean, mucuna, bambara beans etc.<br />
• A nutrient master plan must be developed to facilitate the development <strong>of</strong> smallscale,<br />
rural aquaculture. This plan should consist primarily <strong>of</strong> an inventory<br />
<strong>of</strong> locally available, conventional <strong>and</strong> non-conventional, <strong>feeds</strong>tuffs <strong>and</strong> their<br />
proximate <strong>and</strong> chemical composition. This will allow <strong>for</strong> the <strong>for</strong>mulation <strong>of</strong><br />
“regionally specific fish rations”.<br />
• Incentives should be provided by the Federal Government <strong>for</strong> the importation<br />
<strong>of</strong> feed manufacturing equipment <strong>and</strong> raw materials to encourage investment in<br />
aquafeed production.<br />
• A comprehensive stock assessment <strong>of</strong> lantern fish in Nigeria’s exclusive economic<br />
zone should be undertaken. If the stocks are found to be economically viable then<br />
the government should promote the development a reduction fishery, such that<br />
the country becomes less reliant on fishmeal imports.<br />
ACKNOWLEDGEMENTS<br />
The author is particularly grateful to Dr Mohammad R. Hasan (FAO), Mr Jim Miller,<br />
<strong>for</strong>mer Technical Advisor Aquaculture <strong>and</strong> Inl<strong>and</strong> Fisheries Project (AIFP) <strong>of</strong> the<br />
National Special Programme <strong>for</strong> Food Security (NSPFS) <strong>and</strong> Alhaji Tunde At<strong>and</strong>a <strong>of</strong><br />
NSPFS <strong>for</strong> their support <strong>and</strong> help in completing this assignment. The author is also<br />
thankful to Dr A. Oresegun <strong>and</strong> Mr O. R. Oguntade <strong>for</strong> their ef<strong>for</strong>ts in collecting<br />
in<strong>for</strong>mation from various establishments <strong>and</strong> fish farmers <strong>and</strong> to Mr. Buraimo <strong>for</strong> his<br />
assistance in putting this report together.<br />
REFERENCES<br />
Adikwu, L.A. 2003. A review <strong>of</strong> aquaculture nutrition in aquaculture development in<br />
Nigeria. In A. A. Eyo, eds. Proceeding <strong>of</strong> national Workshop on Fish Feed Development<br />
<strong>and</strong> Feeding Practices in Aquaculture, pp. 34–41.<br />
Alegbeleye, W.O., Oresegun, A. & Ajitomi, O.D. 2001. An assessment <strong>of</strong> jackbean<br />
(Canavalia ensi<strong>for</strong>mis) meal as an ingredient in the diet <strong>for</strong> Clarias gariepinus (Buchall<br />
1822) fingerlings. In A.A. Eyo, eds. Fish nutrition <strong>and</strong> fish feed technology, pp 92–97.<br />
Proceedings <strong>of</strong> the 1st National symposium on fish nutrition <strong>and</strong> fish feed technology,<br />
26–29 October 1999. Lagos, Fisheries Society <strong>of</strong> Nigeria (FISON).<br />
Ayinla, O.A. & Ak<strong>and</strong>e. G.R. 1988. Growth response <strong>of</strong> C. gariepinus (Burchell 1822) on<br />
silage-based diets. NIOMR Technical Paper No 37. 19 pp.<br />
Ayinla, O.A. 1991. Fish feed <strong>and</strong> nutrition. Fisheries society <strong>of</strong> Nigeria symposium, Sokoto<br />
State, Nigeria. pp. 28.
Analysis <strong>of</strong> <strong>feeds</strong> <strong>and</strong> <strong>fertilizers</strong> <strong>for</strong> <strong>sustainable</strong> aquaculture development in Nigeria 469<br />
Ayinla, O.A. & Ajayi, T.O. 1996. African aquaculture revitalization: a model <strong>for</strong> family<br />
holding integration <strong>and</strong> viability. In. K. O. Adeniji, ed. Aquaculture in Africa, pp. 109–<br />
114. Proceedings <strong>of</strong> the 4th session <strong>of</strong> the Inter-African committee on oceanography sea<br />
<strong>and</strong> inl<strong>and</strong> fisheries.<br />
Ayinla, O.A. & Bekibele, D.O. 1992. Fish feed <strong>and</strong> nutrition in Nigeria: the preferred state<br />
<strong>of</strong> knowledge <strong>and</strong> the ways <strong>for</strong>ward. NIOMR Technical Paper No 83. 13 pp.<br />
Balogun, A.M. & Ologhobo, A.D. 1989. Growth per<strong>for</strong>mance <strong>and</strong> nutrient utilization <strong>of</strong><br />
fingerlings <strong>of</strong> C. gariepinus fed raw <strong>and</strong> cooked soybean diets. Aquaculture, 76: 119 –126.<br />
Balogun, A.M. & Fagbenro, O.A. 1995. The use <strong>of</strong> macadamia presscake as a protein<br />
<strong>feeds</strong>tuff in practical diet <strong>for</strong> tilapia, O. niloticus. Aquaculture Research, 26: 371–377.<br />
Bekibele, D.O., Wuyep, T.M. & Ayinla, O.A. 2000. Nutritive value <strong>of</strong> earthworms<br />
(Lumbricus terrestris <strong>and</strong> Allolobophora longa) in diets <strong>of</strong> the African catfish hybrid<br />
fingerlings (H. bidorsalis <strong>and</strong> C. gariepinus). Journal <strong>of</strong> Agric. Biotech. Engr., 2: 49–54.<br />
Eyo, A.A. 1999. The nutritive value <strong>of</strong> traditionally prepared fishmeals. In FAO, ed.<br />
Proceedings <strong>of</strong> the 5th FAO Expert Consultation on Fish Technology in Africa, Accra,<br />
Ghana, 22–25 October 1991.<br />
Eyo, A.A. 2003. Fundamentals <strong>of</strong> fish nutrition <strong>and</strong> diet development – an overview. In<br />
A.A. Eyo, eds. Proceedings <strong>of</strong> the national workshop on fish feed development <strong>and</strong><br />
feeding practices in aquaculture.<br />
Fagbenro, O.A. 1994. Dried fermented fish silage in diets <strong>for</strong> Oreochromis niloticus. Israel<br />
Journal <strong>of</strong> Aquaculture, 46: 140–147.<br />
Fagbenro, O.A. & Jauncey, K. 1994. Growth <strong>and</strong> protein utilization by juvenile catfish (C.<br />
gariepinus) fed moist diet containing autolysed protein from stored lactic acid fermented<br />
fish silage. Bioresource Technology, 48: 43–48.<br />
Fagbenro, O. A, Jauncey, K & Hayler, G.S. 1994. Nutritive value <strong>of</strong> diets containing<br />
dried lactic acid fermented fish silage <strong>and</strong> soybean meal <strong>for</strong> juvenile O. niloticus <strong>and</strong> C.<br />
gariepinus. Aquatic Living Resources, 7: 79–85.<br />
Fagbenro, O.A & Jauncey, K. 1995. Growth <strong>and</strong> protein utilization by juvenile catfish<br />
(C. gariepinus) fed dried diets containing co-dried lactic acid fermented fish silages <strong>and</strong><br />
protein <strong>feeds</strong>tuffs. Bioresource Technology, 51: 29–35.<br />
Fagbenro, O.A & Fasakin, S.A. 1996. Citric acid ensiled poultry use a as protein<br />
supplement <strong>for</strong> catfish (C. gariepinus). Bioresource Technology, 58: 13–16.<br />
Fagbenro, O.A. 1999. Comparative evaluation <strong>of</strong> heat processed winged bean, Psophocarpus<br />
tetragonolobus meals as partial substitute <strong>for</strong> fishmeal in diets <strong>for</strong> the African catfish, C.<br />
gariepinus. Aquaculture, 170: 297–305.<br />
Fagbenro, O.A. & Davies S.J. 2003. Use <strong>of</strong> high percentage <strong>of</strong> soy protein concentrate<br />
as fishmeal substitute in practical diets <strong>for</strong> African catfish C. gariepinus: growth, feed<br />
utilization <strong>and</strong> digestibility. Journal <strong>of</strong> Applied Technology, 16(1) in press.<br />
Fagbenro, O.A., Adeparusi, E.O. & Fapohunda, O.O. 2003. Feedstuffs <strong>and</strong> dietary<br />
substitution <strong>for</strong> farmed fish in Nigeria. In A.A. Eyo, eds. Proceedings national workshop<br />
on fish feed development <strong>and</strong> feeding practices in aquaculture, pp. 60–72.<br />
Fagbenro, O.A. & Adebayo, O.T. 2005. A review <strong>of</strong> the animal <strong>and</strong> aquafeed in Nigeria. In<br />
A synthesis <strong>of</strong> the <strong>for</strong>mulated animal <strong>and</strong> aquafeed industry in Sub-Sahara Africa. CIFA<br />
Occasional Paper No 26 P2C 36.<br />
FAO. 2006. Fishery in<strong>for</strong>mation, data <strong>and</strong> statistics unit. Capture production 1950-2004.<br />
FISHSTAT Plus (available at http://www.fao.org/fi/statist/FISOFT/FISHPLUS.asp).<br />
Faturoti, E.O. 2002. Beneath the ripples <strong>and</strong> <strong>sustainable</strong> fish production. Inaugural Lecture,<br />
Ibadan, University <strong>of</strong> Ibadan. 54 pp.<br />
Hasan, M.R. 2005. Unpublished travel report to Nigeria <strong>and</strong> Ghana. Internal FIRI, Rome,<br />
FAO. 35 pp.<br />
Joseph, J.K. & Abolaji, J. 1997. Effects <strong>of</strong> replacing maize with graded levels <strong>of</strong> cooked<br />
Nigerian mango-feed kernels (Mangifera indica) on the per<strong>for</strong>mance, carcass yield <strong>and</strong><br />
meal quality <strong>of</strong> broiler chickens. Bioresources Technology, 61: 99–102.
470<br />
<strong>Study</strong> <strong>and</strong> <strong>analysis</strong> <strong>of</strong> <strong>feeds</strong> <strong>and</strong> <strong>fertilizers</strong> <strong>for</strong> <strong>sustainable</strong> aquaculture development<br />
Madu, C.T. & Ufodike, E.B. 2003. Growth <strong>and</strong> survival <strong>of</strong> catfish (C. anguillaris) juveniles<br />
fed live tilapia <strong>and</strong> maggot as unconventional diet. Journal <strong>of</strong> Aquatic Science, 18:<br />
47–51.<br />
Mbagwu, I.G., Okoye, F.C. & Adeniyi, H.A. 1990. Studies on the use <strong>of</strong> duckweed (Lemna<br />
paucicostatia) by tilapia (Sarotherodon galilaeus). NIFFR Technical Report Series No<br />
22.<br />
Oguntade O.R., Ayinla O.A, Oresegun A., Adeogun O.A, Ogunbadejo H.K, Alhaji, T.<br />
2006. Trends in Fish Culture in Urban <strong>and</strong> Periurban Areas <strong>of</strong> Lagos State. In: E.J. Ansa,<br />
P.E. Anyanwu, B.W. Ayonadu, E.S. Erondu & S.N. Deekae S.N., eds. Proceedings <strong>of</strong> 20 th<br />
Fisheries Society <strong>of</strong> Nigeria Annual Conf., PortHarcourt, 14th – 18th November, 2005.<br />
pp. 56–67.<br />
Shipton, T.A. & Hecht, T. 2005. A synthesis <strong>of</strong> the <strong>for</strong>mulated animal <strong>and</strong> aquafeed<br />
industry in sub-Saharan African. In J. Moehl <strong>and</strong> M. Halwart, eds. A synthesis <strong>of</strong> the<br />
<strong>for</strong>mulated animal <strong>and</strong> aquafeed industry in Sub-Saharan Africa, pp. 1–13. CIFA<br />
Occasional Paper No 26.<br />
Siddhuraju, P. & Becker, K. 2001. Preliminary nutritional evaluation <strong>of</strong> mucuna feed meal<br />
(Mucuna pruriens Var utilis) in common carp (Cyprinus carpio, L): an assessment by<br />
growth per<strong>for</strong>mance <strong>and</strong> feed utilization. Aquaculture, 196: 105–123.<br />
Tacon A.G.J. 1987. The nutrition <strong>and</strong> feeding <strong>of</strong> farmed fish <strong>and</strong> shrimp - a training manual<br />
2. Nutrient Sources <strong>and</strong> Composition. Brasilia, FAO/UNDP.
Analysis <strong>of</strong> <strong>feeds</strong> <strong>and</strong> <strong>fertilizers</strong><br />
<strong>for</strong> <strong>sustainable</strong> aquaculture<br />
development in Ug<strong>and</strong>a<br />
J. Rutaisire<br />
Department <strong>of</strong> Wildlife <strong>and</strong> Animal Resources<br />
Makerere University, Kampala<br />
Ug<strong>and</strong>a<br />
Summary 472<br />
1. Overview <strong>of</strong> aquaculture practices <strong>and</strong> farming systems 473<br />
2. Analysis <strong>of</strong> <strong>fertilizers</strong>, <strong>feeds</strong> <strong>and</strong> feeding 475<br />
3. The animal feed industry in Ug<strong>and</strong>a 482<br />
4. Problems <strong>and</strong> constraints 482<br />
5. Resource availability <strong>and</strong> expansion <strong>of</strong> aquaculture 483<br />
6. Recommendations <strong>for</strong> the improved utilization <strong>of</strong> fertilizer <strong>and</strong><br />
feed resources 483<br />
Acknowledgements 484<br />
References 484<br />
Appendix 486<br />
Rutaisire, J. 2007. Analysis <strong>of</strong> <strong>feeds</strong> <strong>and</strong> <strong>fertilizers</strong> <strong>for</strong> <strong>sustainable</strong> aquaculture<br />
development in Ug<strong>and</strong>a. In M.R. Hasan, T. Hecht, S.S. De Silva <strong>and</strong> A.G.J. Tacon (eds).<br />
<strong>Study</strong> <strong>and</strong> <strong>analysis</strong> <strong>of</strong> <strong>feeds</strong> <strong>and</strong> <strong>fertilizers</strong> <strong>for</strong> <strong>sustainable</strong> aquaculture development.<br />
FAO Fisheries Technical Paper. No. 497. Rome, FAO. pp. 471–487.<br />
471
472<br />
<strong>Study</strong> <strong>and</strong> <strong>analysis</strong> <strong>of</strong> <strong>feeds</strong> <strong>and</strong> <strong>fertilizers</strong> <strong>for</strong> <strong>sustainable</strong> aquaculture development<br />
SUMMARY<br />
This paper reviews the current status <strong>of</strong> feed <strong>and</strong> fertilizer use in aquaculture in Ug<strong>and</strong>a.<br />
Aquaculture in Ug<strong>and</strong>a is still largely at a subsistence level despite having been practiced<br />
<strong>for</strong> more than 50 years. However, there have been some significant changes since the late<br />
1990s. Sixteen species have been tested <strong>for</strong> farming in Ug<strong>and</strong>a, but only four (Nile tilapia<br />
Oreochromis niloticus, redbelly tilapia Tilapia zillii, common carp Cyprinus carpio <strong>and</strong><br />
North African catfish Clarias gariepinus) are cultured. These species are reared mainly<br />
under polyculture conditions in earthen ponds. Monoculture is restricted to North<br />
American catfish fingerling production, which are used as live bait in the Nile perch, long<br />
line fishery in Lake Victoria.<br />
The majority <strong>of</strong> small-scale subsistence farmers rely on organic fertilization <strong>of</strong> ponds<br />
<strong>and</strong> the provision <strong>of</strong> green leafy materials regardless <strong>of</strong> whether the fish are herbivorous or<br />
not. Cattle <strong>and</strong> pig manure are available free <strong>of</strong> charge, whilst chicken manure is available<br />
at a relatively cheap price. Supplementary <strong>feeds</strong> are normally provided by broadcasting<br />
the feed, such as rice or maize bran, over the pond surface. All commercial <strong>and</strong> emerging<br />
commercial farmers feed their fish according to specific protocols. Commercial farmers<br />
make their own <strong>feeds</strong> <strong>and</strong> some produce their own pellets. Commercial fish <strong>feeds</strong> are<br />
not readily available. Only one feed producer makes a sinking pellet, the per<strong>for</strong>mance <strong>of</strong><br />
which still has to be evaluated.<br />
Availability <strong>and</strong> price <strong>of</strong> feed ingredients is determined by the agricultural calendar.<br />
Transport costs are high, <strong>and</strong> this affects feed prices. The proximate composition <strong>of</strong><br />
local feed ingredients is known. Fishmeal is not imported into Ug<strong>and</strong>a <strong>and</strong> the bulk <strong>of</strong><br />
the fishmeal is made from the pelagic minnow (silver cyprinid Rastrineobola argentea),<br />
the second most important commercial fish species in Lake Victoria The country’s<br />
climate <strong>and</strong> soils favour large scale production <strong>of</strong> soybeans <strong>and</strong> this should be strongly<br />
promoted.<br />
On the whole, the major constraints facing the development <strong>of</strong> the aquafeed industry<br />
include the lack <strong>of</strong> prerequisite in<strong>for</strong>mation, appropriate technologies, af<strong>for</strong>dable credit<br />
facilities <strong>and</strong> poor infrastructure. However, the current positive trends in aquaculture<br />
development, exhibited by substantial private sector investment <strong>and</strong> an enabling policy<br />
framework are indicative <strong>of</strong> the viability <strong>and</strong> potential <strong>of</strong> aquaculture in Ug<strong>and</strong>a.
Analysis <strong>of</strong> <strong>feeds</strong> <strong>and</strong> <strong>fertilizers</strong> <strong>for</strong> <strong>sustainable</strong> aquaculture development in Ug<strong>and</strong>a 473<br />
1. OVERVIEW OF AQUACULTURE PRACTICES AND FARMING SYSTEMS<br />
Aquaculture in Ug<strong>and</strong>a began in 1953 with the establishment <strong>of</strong> the Kajjansi<br />
experimental station <strong>of</strong> Aquaculture Research <strong>and</strong> Development Centre (ARDC).<br />
Despite its long history the sector has largely remained at a small-scale, subsistence<br />
level. The contribution by aquaculture to national fish supply is insignificant. There are<br />
approximately 7 152 fish farmers in Ug<strong>and</strong>a with about 30 000 ponds (UBOS, 2004).<br />
The average pond size is 222 m 2 <strong>and</strong> average production has been estimated at 1 800 kg/<br />
ha/year (NARO-MAIIF, 2002). Total fish production in 2003 was 5 500 tonnes (FAO,<br />
2005). However, since the late 1990s aquaculture in Ug<strong>and</strong>a has changed rapidly due<br />
to the greater interest <strong>and</strong> participation by the private sector. Several commercial<br />
fish farms are emerging in the country <strong>and</strong> these are targeting the regional table fish<br />
market as well as the baitfish market. This is in line with the Government’s Plan <strong>for</strong><br />
Modernisation <strong>of</strong> Agriculture (PMA).<br />
The recent renewed interest in aquaculture is mainly attributed to the advances<br />
in North African catfish (Clarias gariepinus) culture. Due to its desired qualities<br />
the African catfish has become one <strong>of</strong> the key aquaculture species in Ug<strong>and</strong>a <strong>and</strong> is<br />
likely to become the main contributor to aquaculture production both in terms <strong>of</strong><br />
volume <strong>and</strong> value. Polyculture <strong>of</strong> North African catfish with Nile tilapia (Oreochromis<br />
niloticus) has also resulted in the production <strong>of</strong> larger size fish. The size <strong>of</strong> table fish is<br />
very important in Ug<strong>and</strong>a, since fish <strong>of</strong> less than 300 g are shunned by the consumers.<br />
The aquaculture potential <strong>of</strong> several fish species has been tested at ARDC, Kajjansi <strong>and</strong><br />
other parts <strong>of</strong> Ug<strong>and</strong>a but only a few are cultured in the country (Table 1).<br />
TABLE 1<br />
Fish species that have been tested <strong>and</strong> their current culture status in Ug<strong>and</strong>a<br />
Species Not currently<br />
cultured<br />
Cultured Remarks<br />
Nile tilapia, Oreochromis<br />
niloticus<br />
a Widely cultured<br />
Victoria tilapia, Oreochromis<br />
variabilis<br />
a Not currently cultured<br />
Wami tilapia, Oreochromis<br />
urolepis hornorum<br />
a Hybridized & disappeared from ARDC, Kajjansi<br />
Blue tilapia, Oreochromis aureus a Disappeared from ARDC, Kajjansi<br />
Oreochromis spilurus a<br />
Oreochromis leucostictus a Considered a wild species that contaminated cultured<br />
cichlids.<br />
Redbelly tilapia, Tilapia zillii a Herbivorous cichlid cultured widely but <strong>of</strong>ten stunts in<br />
ponds.<br />
Redbreast tilapia, Tilapia rendalli a Imported <strong>for</strong> hybridization experiments at ARDC,<br />
Kajjansi but disappeared from the station<br />
Common carp, Cyprinus carpio a Cultured <strong>and</strong> popular in the cooler mountainous parts<br />
<strong>of</strong> the country.<br />
Grass carp, Ctenopharyngodon<br />
idella<br />
a Failed to breed/disappeared from ARDC, Kajjansi<br />
Giant gourami, Osphronemus<br />
goramy<br />
a Bred on their own in ponds but disappeared<br />
Black bass, Micropterus<br />
salmoides<br />
a Did not breed <strong>and</strong> disappeared from ARDC, Kajjansi<br />
Semutundu, Bagrus docmak a Research to breed & culture in captivity on-going<br />
North African catfish, Clarias<br />
gariepinus<br />
a Cultured <strong>and</strong> popular<br />
Rainbow trout, Oncorynchus<br />
mykiss<br />
a Not cultured but is caught in Mt. Elgon rivers.<br />
Crayfish, Procambarus clarkii a Burrows <strong>and</strong> destroys pond banks. It has there<strong>for</strong>e<br />
been discouraged in aquaculture. It was introduced<br />
into Lake Bunyonyi, a crater lake where it supports a<br />
fishery.<br />
ARDC=Aquaculture Research <strong>and</strong> Development Centre<br />
Source: Owori-Wadunde (2001)
474<br />
<strong>Study</strong> <strong>and</strong> <strong>analysis</strong> <strong>of</strong> <strong>feeds</strong> <strong>and</strong> <strong>fertilizers</strong> <strong>for</strong> <strong>sustainable</strong> aquaculture development<br />
NARO-MAAIF (2002) survey revealed that 50 percent <strong>of</strong> small-scale fish farmers<br />
in Ug<strong>and</strong>a make special preparations prior to stocking their ponds. These include<br />
draining <strong>and</strong> drying the ponds to allow mineralization <strong>of</strong> the accumulated organic<br />
matter. The drained ponds are usually de-silted or dredged. A small proportion <strong>of</strong><br />
farmers (3 percent) lime their ponds. Fourty percent <strong>of</strong> the ponds are operated on a<br />
flow-through system. The majority <strong>of</strong> fish farmers (70 percent) rely on ground water<br />
<strong>for</strong> filling their ponds. Most farmers mow the grass both on <strong>and</strong> around pond dykes<br />
<strong>and</strong> protect their ponds from predators <strong>and</strong> theft. Most subsistence farmers use a<br />
mix <strong>of</strong> species in an unmanaged manner), with stocking densities ranging from 1–3<br />
fingerlings/m 2 (NARO-MAAIF, 2002).<br />
More recently commercial farms, which practise both poly- <strong>and</strong> monoculture, have<br />
started to emerge. Polyculture is mainly undertaken with North African catfish <strong>and</strong><br />
Nile tilapia in a predator-prey relationship. This has been made possible by the ready<br />
availability <strong>of</strong> seed <strong>of</strong> both species. Rutaisire (2005) found that the average fish stocking<br />
density in African catfish/Nile tilapia polyculture systems is 10 fish/m at a ratio <strong>of</strong><br />
6:4, respectively. Monoculture <strong>of</strong> Nile tilapia is not popular due to its precocious<br />
breeding habits <strong>and</strong> stunting. Monosex culture <strong>of</strong> Nile tilapia is yet to be developed <strong>and</strong><br />
promoted in Ug<strong>and</strong>a. Monoculture is mainly practiced with common carp Cyprinus<br />
carpio, especially in the mountainous cooler regions <strong>of</strong> the country where temperatures<br />
fall below 20ºC. Overall, 57 percent <strong>of</strong> fish farmers practice polyculture (Nile tilapia<br />
<strong>and</strong> African catfish) <strong>and</strong> 43 practice some sort <strong>of</strong> monoculture (NARO-MAAIF, 2002).<br />
The production <strong>of</strong> African catfish fingerlings is increasing, particularly <strong>for</strong> live-bait in<br />
the Nile perch long line fishery in Lake Victoria. During the last three to four years, 11<br />
farmers began producing African catfish fingerlings as a major business activity, with<br />
an estimated production <strong>of</strong> 500 000 fingerlings per month. The live fish are packed in<br />
jerry cans or buckets <strong>and</strong> transported in pick-up trucks to fishermen at the lake.<br />
The price <strong>of</strong> the baitfish (average total length 10 cm) ranges from US$0.06 in the<br />
dry season to US$0.17 per fingerling in the wet season. These farmers have constructed<br />
hatcheries with all the necessary tanks <strong>for</strong> induced spawning, stripping, egg incubation,<br />
hatching <strong>and</strong> fry rearing (14–21 days). Fry from the hatcheries are grown in concrete<br />
tanks, at densities <strong>of</strong> up to 2 500/m 3 , or plastic lined ponds <strong>and</strong> raised to baitfish <strong>of</strong><br />
10 cm or larger. Cage culture <strong>of</strong> catfish under commercial conditions is currently being<br />
tested by the USAID (United States Agency <strong>for</strong> International Development)/Ug<strong>and</strong>a<br />
Fisheries Investment <strong>for</strong> Sustainable Harvest (FISH) project.<br />
TABLE 2<br />
Estimated national <strong>and</strong> regional annual yield <strong>and</strong> value <strong>of</strong> major cultured fish species<br />
Region Species Fish production<br />
(kg/ha/year)<br />
Price (US$/kg)<br />
(1999/2000)<br />
Central Tilapias (O. niloticus <strong>and</strong> T. zilli) 276 1.60<br />
North African catfish 350 1.10<br />
Common carp 71 1.10<br />
Eastern Tilapias (O. niloticus <strong>and</strong> T. zilli) 625 1.60<br />
North African catfish 417 1.60<br />
Common carp 532 1.50<br />
Northern Tilapias (O. niloticus <strong>and</strong> T. zilli) 588 1.70<br />
North African catfish 432 1.10<br />
Common carp 69 1.10<br />
Western Tilapias (O. niloticus <strong>and</strong> T. zilli) 972 1.50<br />
North African catfish 140 0.90<br />
Common carp 297 0.80<br />
West Nile Tilapias (O. niloticus <strong>and</strong> T. zilli) 889 1.60<br />
North African catfish - 1.65<br />
Common carp 374 1.60<br />
National Average Tilapias (O. niloticus <strong>and</strong> T. zilli) 646 1.60<br />
North African catfish 406 1.10<br />
Common carp 333 1.10<br />
*Price per kg fish is based on the market price not ex-farm gate price, which may be much lower.<br />
US$1.00 = Ug<strong>and</strong>a Shilling (USh) 1 820 (average exchange rate, 2005)<br />
Source: NARO-MAAIF (2002)
Analysis <strong>of</strong> <strong>feeds</strong> <strong>and</strong> <strong>fertilizers</strong> <strong>for</strong> <strong>sustainable</strong> aquaculture development in Ug<strong>and</strong>a 475<br />
In general, there is a lack <strong>of</strong> accurate production data from small-holder ponds. This<br />
is because farmers do not keep records. However, some estimates were obtained by the<br />
NARO-MAAIF (2002) baseline survey <strong>and</strong> these are summarised, on a regional basis,<br />
in Table 2. For the most commonly cultured fish species (O. niloticus, C. gariepinus<br />
<strong>and</strong> C. carpio) the current production level was estimated at 13.8 kg/100 m 2 /year, which<br />
is significantly better than the historical records <strong>of</strong> 0.7 to 7.1 kg/100 m 2 /year (Owori-<br />
Wadunde, 2001). More recent production data were not available at the time this report<br />
was compiled.<br />
2. ANALYSIS OF FERTILIZERS, FEEDS AND FEEDING<br />
2.1 Availability <strong>and</strong> accessibility <strong>of</strong> manure <strong>and</strong> inorganic <strong>fertilizers</strong><br />
Fish farming in Ug<strong>and</strong>a mainly consists <strong>of</strong> mixed species “polyculture” in organically<br />
fertilized ponds. This is because the majority <strong>of</strong> fish farmers are poor, small-holder<br />
farmers who keep livestock <strong>and</strong> grow crops (Isyiagi, 2004). Approximately 58 percent<br />
<strong>of</strong> fish farmers use cattle manure to fertilize their ponds, while others used chicken,<br />
goat, pig <strong>and</strong> duck manure, coupled in most instances (40 percent) with compost cribs<br />
that are filled with grass, kitchen wastes <strong>and</strong> farm by-products such as cabbage stumps.<br />
Chicken manure was used least <strong>of</strong>ten due to the high price <strong>and</strong> competition with<br />
crop farming (NARO-MAAIF, 2002). Chicken manure is available from commercial<br />
poultry farmers at US$16.50 per tonne (Mr. Tugumisisrize, Sunfish Farms Ltd., pers.<br />
comm.), which makes it unaf<strong>for</strong>dable <strong>for</strong> most small-scale farmers. Pig <strong>and</strong> cattle<br />
manure are free. Organic manure is generally applied at approximately 20 kg/100 m 2 .<br />
Further application depends on the “greenness” <strong>of</strong> the pond. Manure is available<br />
throughout the year <strong>and</strong> more than 80 percent <strong>of</strong> farmers have access to organic<br />
<strong>fertilizers</strong>, although not in sufficient quantities. Most small scale farmers fertilize their<br />
ponds using manure swept from livestock enclosures. Approximately 40 percent <strong>of</strong><br />
the farmers install cribs in their ponds <strong>and</strong> these are filled with grass, kitchen wastes,<br />
animal manure <strong>and</strong> farm by-products such as cabbage stumps. The rate <strong>of</strong> refilling the<br />
cribs depends on the colour <strong>of</strong> the water which they monitor visually.<br />
Inorganic <strong>fertilizers</strong> are rarely used in Ug<strong>and</strong>an aquaculture. However, there are<br />
some farmers who use di-ammonium phosphate (DAP) <strong>and</strong> nitrogen phosphate<br />
potassium (NPK) in catfish nursery ponds. DAP is applied at the same time when the<br />
fry are introduced to the nursery ponds. It is dissolved in water <strong>and</strong> applied at a rate<br />
0.5 kg/100 m 2 . NPK is used at the same rate. Inorganic <strong>fertilizers</strong> are readily available<br />
in agricultural shops. A combination <strong>of</strong> phosphoric acid <strong>and</strong> urea has been reported<br />
used to sustain plankton growth in ponds (Mr. Tugumisisrize, pers. comm.). The<br />
mix consists <strong>of</strong> 50 l <strong>of</strong> phosphoric acid <strong>and</strong> 5 kg <strong>of</strong> urea, which is applied to 7 000 m 2<br />
ponds every 2–3 weeks. According to the manager <strong>of</strong> the farm this treatment results<br />
in sustained plankton production, dominated by cladocerans <strong>and</strong> lesser quantities <strong>of</strong><br />
rotifers <strong>and</strong> copepods. In 2005, the price <strong>of</strong> chemical <strong>fertilizers</strong> ranged from US$430–<br />
500/tonne.<br />
2.2 Availability <strong>and</strong> accessibility <strong>of</strong> feed ingredients<br />
A multitude <strong>of</strong> ingredients are used as fish <strong>feeds</strong> in Ug<strong>and</strong>a. These include vegetables,<br />
grass, cereals, cereal brans, oilseed cakes, industrial <strong>and</strong> kitchen wastes, insects <strong>and</strong><br />
fishmeal. The proportional use <strong>of</strong> these ingredients is illustrated in Figure 1. Availability<br />
<strong>of</strong> most <strong>of</strong> these feed ingredients is seasonal. Cereals are readily available <strong>and</strong> cheap at<br />
harvest time, but prices gradually increase by the time the next harvest comes around.<br />
Maize<br />
Ug<strong>and</strong>a harvests two maize crops per year with a total production <strong>of</strong> approximately<br />
500 000–600 000 tonnes (Table 3). For more than a decade Ug<strong>and</strong>a has been exporting<br />
50 000–100 000 tonnes <strong>of</strong> maize per annum to Kenya through in<strong>for</strong>mal trade (Magnay,
476<br />
<strong>Study</strong> <strong>and</strong> <strong>analysis</strong> <strong>of</strong> <strong>feeds</strong> <strong>and</strong> <strong>fertilizers</strong> <strong>for</strong> <strong>sustainable</strong> aquaculture development<br />
FIGURE 1<br />
The proportional use <strong>of</strong> different types <strong>of</strong> <strong>feeds</strong> by<br />
Ug<strong>and</strong>an fish farmers<br />
Source: ARDC, Kajjansi database (pers. comm.)<br />
TABLE 3<br />
Estimated maize production <strong>and</strong> trade (tonnes) during 2001–2004<br />
Year<br />
Production<br />
(tonnes)<br />
Internal<br />
dem<strong>and</strong><br />
Relief<br />
agencies<br />
2004). Relief agencies also purchase<br />
approximately 100 000 tonnes per year<br />
<strong>for</strong> the region <strong>and</strong> Ug<strong>and</strong>a also supplies<br />
maize to Tanzania <strong>and</strong> Rw<strong>and</strong>a.<br />
The price <strong>of</strong> maize in Ug<strong>and</strong>a is high<br />
<strong>and</strong> this is because <strong>of</strong> the substantial<br />
volumes that are exported or bought by<br />
relief agencies. The average price <strong>of</strong> maize<br />
<strong>and</strong> maize bran, <strong>for</strong> the period January<br />
to October 2004 was US$0.28/kg <strong>and</strong><br />
US$0.08/kg, respectively.<br />
Rice<br />
Domestic rice production in 2005 was<br />
estimated at 51 917 tonnes (Table 4).<br />
This is not adequate to meet the local<br />
dem<strong>and</strong> <strong>and</strong> in 2005 Ug<strong>and</strong>a imported<br />
an additional 40 538 tonnes.<br />
Formal<br />
export<br />
Export<br />
In<strong>for</strong>mal<br />
export<br />
Surplus<br />
2001 550 000 400 000 50 000 10 000 40 000 50 000<br />
2002 530 000 400 000 50 000 20 000 60 000 0<br />
2003 580 000 400 000 100 000 _ 80 000 0<br />
2004 (drought) 530 000 350 000 80 000 20 000 80 000 0<br />
2005 (projections) 600 000 400 000 60 000 30 000 60 000 500 000<br />
Source: Ug<strong>and</strong>a Grain Traders Ltd. (pers. comm.)<br />
TABLE 4<br />
Trends <strong>and</strong> projections in rice market volumes (tonnes)<br />
2003 2004 2005 2006 2007 2008 2009 2010<br />
Total rice dem<strong>and</strong> 88 000 90 200 92 455 94 766 97 136 99 564 102 053 104 604<br />
Domestic production 48 000 49 920 51 917 53 993 56 153 58 399 60 735 63 165<br />
Import 40 000 40 280 40 538 40 773 40 982 41 165 41 318 41 440<br />
Source: Spilsbury et al. (2004) <strong>and</strong> author's estimate based on survey findings<br />
The price <strong>of</strong> rice varies seasonally, ranging from US$0.41–0.44/kg, <strong>and</strong> is linked to<br />
the main harvest times. Rice bran is increasingly used to feed fish <strong>and</strong> costs less than<br />
maize bran.<br />
Kitchen <strong>and</strong> bakery waste<br />
Kitchen waste is obtained from homes <strong>and</strong> public eating places such as restaurants,<br />
hotels <strong>and</strong> schools. However, most kitchen waste is collected as pig feed. During the<br />
farm visits carried out by the author, it was found that some farmers were feeding fish<br />
on waste bread from bakeries in Kampala <strong>and</strong> in some instances this constituted over<br />
50 percent <strong>of</strong> the feed. In most instances kitchen <strong>and</strong> bakery wastes were obtained free<br />
as a way <strong>of</strong> disposal.<br />
Mill sweepings<br />
Farmers in the neighbourhood <strong>of</strong> feed or flour mills collect the floor sweepings, which<br />
they use as feed. Sweepings are <strong>of</strong> various types, e.g. millet, cassava, sorghum, maize or<br />
a combination <strong>of</strong> all <strong>of</strong> these. The volume <strong>of</strong> sweepings produced in the country is not<br />
known. Sweepings are obtained free <strong>of</strong> charge.
Analysis <strong>of</strong> <strong>feeds</strong> <strong>and</strong> <strong>fertilizers</strong> <strong>for</strong> <strong>sustainable</strong> aquaculture development in Ug<strong>and</strong>a 477<br />
Abattoir by-products <strong>and</strong> waste<br />
Bloodmeal is the principal abattoir by-product <strong>and</strong> is used <strong>for</strong> making fish <strong>and</strong> livestock<br />
feed. However, most <strong>of</strong> the abattoirs are located in urban areas <strong>and</strong> most farmers are<br />
unable to transport the product to their farms. About 400 tonnes <strong>of</strong> bloodmeal are<br />
produced around Kampala. The amount produced in the northern part <strong>of</strong> Ug<strong>and</strong>a is<br />
not known. The price <strong>of</strong> bloodmeal is US$0.33/kg <strong>and</strong> no recent changes in volume<br />
<strong>and</strong> price have been reported.<br />
Termites / white ants<br />
According to Isyiagi (2004) some farmers feed their fish on termites, which are either<br />
collected by the farmer or purchased from collectors at a cost <strong>of</strong> US$0.27/kg, during<br />
the periods March/April <strong>and</strong> August/September. The quantity obtained depends on<br />
the number <strong>and</strong> size <strong>of</strong> anthills on the farm, moonlight intensity <strong>and</strong> type <strong>of</strong> white ant.<br />
On average, an anthill yields approximately 50 kg per annum.<br />
Oilseed cakes<br />
Cotton <strong>and</strong> sunflower oilseed cakes are the two major cakes used as fish feed in<br />
Ug<strong>and</strong>a. They are purchased from trading centres <strong>and</strong> major distributors in urban<br />
areas. The price <strong>of</strong> oilseed cakes varies seasonally. Oilseed cakes are used by industrial<br />
feed mills as well as small, backyard feed mixers, commonly referred to as Kitiyo<br />
(literally meaning those who use a spade to mix <strong>feeds</strong>). Oilseed cakes are not used <strong>for</strong><br />
human consumption.<br />
Brewers waste<br />
Brewery waste is obtained from local sorghum breweries <strong>and</strong> from the industrial lager<br />
breweries. The wet product (fermented barley <strong>and</strong> sorghum) is used as a fish <strong>and</strong> a<br />
livestock feed. It was estimated that the two industrial breweries produce around<br />
22 568 tonnes <strong>of</strong> waste per annum. Brewery waste is sold at US$5.50 per tonne at the<br />
factory gate; while the cost to the end user (farmer) is US$11 per tonne. Local brewery<br />
waste is available throughout the year.<br />
Green leafy material<br />
Green leaves are readily available throughout the year in most parts <strong>of</strong> the country.<br />
Nelly (2004) found that farmers use green leaves as a fish feed regardless <strong>of</strong> whether the<br />
fish are herbivorous or not. The most widely used leaves are cocoa-yam, sweet potato,<br />
Kafumbe grass (Galisoga pariflora) <strong>and</strong> Kanyebwa grass (Oxalis latifolia).<br />
Fishmeal<br />
The pelagic minnow silver cyprinid, mukene or dagaa omena (Rastrineobola argentea)<br />
is the most important local species <strong>for</strong> the manufacture <strong>of</strong> fishmeal, but is also an<br />
extremely important source <strong>of</strong> fish <strong>for</strong> human consumption. This is similar to the<br />
situation in Kenya <strong>and</strong> Tanzania. Monthly l<strong>and</strong>ings <strong>of</strong> R. argentea show two peak<br />
periods (W<strong>and</strong>era, 1993; W<strong>and</strong>era, pers. comm., 2005), December to January <strong>and</strong> a<br />
minor peak in July <strong>and</strong> August (Figure 2). It is readily available all year around, though<br />
prices increase in April <strong>and</strong> May <strong>and</strong> in October when catches are low. Catch surveys<br />
show that the yearly average catch in Ug<strong>and</strong>a is approximately <strong>of</strong> 90 372 tonnes. The<br />
fish are sun dried <strong>and</strong> milled <strong>and</strong> sold at US$0.47 /kg. It is important to note that<br />
fishmeal is not imported into the country. Emerging commercial fish farmers use the<br />
fish together with other ingredients such as maize, rice bran to produce farm-made<br />
<strong>feeds</strong>. However, the fishmeal is improperly processed <strong>and</strong> h<strong>and</strong>led. Samples <strong>of</strong> mukene<br />
fishmeal taken at fish markets <strong>and</strong> discussion with users indicated that it is almost always<br />
contaminated with s<strong>and</strong>. Some <strong>of</strong> the users believe that s<strong>and</strong> is added deliberately by<br />
the vendors to increase the weight <strong>of</strong> the fishmeal. To avoid contamination, some <strong>of</strong>
478<br />
<strong>Study</strong> <strong>and</strong> <strong>analysis</strong> <strong>of</strong> <strong>feeds</strong> <strong>and</strong> <strong>fertilizers</strong> <strong>for</strong> <strong>sustainable</strong> aquaculture development<br />
FIGURE 2<br />
Monthly l<strong>and</strong>ings <strong>of</strong> silver cyprinid Rastrineobola argentea at<br />
Masese, 1990–1991<br />
Source: W<strong>and</strong>era (1993)<br />
Source: FEWS (2004)<br />
the emerging commercial farmers<br />
now buy fresh R. argentea directly<br />
from the fishers, which they then<br />
dry on the farm using locally made<br />
driers.<br />
Vitamins & minerals<br />
All vitamin <strong>and</strong> mineral premixes<br />
are imported <strong>and</strong> are readily<br />
available in veterinary drug shops<br />
throughout the year. The cost<br />
ranges from US$17.63–$22.04 per<br />
kg. Raw materials <strong>for</strong> minerals<br />
such as cattle horns, fresh water<br />
snail shells are readily available<br />
in the country <strong>and</strong> these products<br />
cost around US$2.80 per kg.<br />
The agricultural calendar<br />
The agricultural calendar determines<br />
the availability <strong>and</strong> price <strong>of</strong><br />
commodities. Ug<strong>and</strong>a has two agricultural seasons. One describes the situation in the<br />
bi-modal rain areas, while the other focuses on the unimodal rain regions (Figure 3). The<br />
main ingredient in animal <strong>feeds</strong> in Ug<strong>and</strong>a is maize. Quite <strong>of</strong>ten there is a scarcity <strong>of</strong><br />
maize on the market (mainly during the period June to October) due to several factors,<br />
including the dem<strong>and</strong> from neighbouring countries <strong>and</strong> relief needs by WFP, amongst<br />
others. This results in large price increases in the in<strong>for</strong>mal market (Magnay, 2004) <strong>and</strong><br />
also leads to seasonal price fluctuations <strong>of</strong> local animal <strong>feeds</strong>.<br />
FIGURE 3<br />
Ug<strong>and</strong>a agricultural calendar<br />
2.3 Nutritional composition<br />
<strong>of</strong> feed ingredients<br />
The proximate composition<br />
<strong>of</strong> the available conventional<br />
<strong>and</strong> non-conventional feed<br />
ingredients is shown in Table 5.<br />
Most <strong>of</strong> the farm by-products<br />
used as fish feed in Ug<strong>and</strong>a have<br />
a low protein content. Silkworm<br />
pupae have only recently been<br />
processed <strong>and</strong> used <strong>for</strong> feeding<br />
<strong>of</strong> North African catfish brood<br />
stock. According to the farmer<br />
the results are encouraging but<br />
un<strong>for</strong>tunately not yet quantified.<br />
2.4 Price, transportation <strong>and</strong><br />
storage <strong>of</strong> feed ingredients<br />
The cost <strong>of</strong> feed ingredients<br />
varies with the agricultural<br />
calendar <strong>and</strong> by region. Table 6<br />
shows the range <strong>of</strong> prices <strong>for</strong><br />
the commonly used feed<br />
ingredients.
Analysis <strong>of</strong> <strong>feeds</strong> <strong>and</strong> <strong>fertilizers</strong> <strong>for</strong> <strong>sustainable</strong> aquaculture development in Ug<strong>and</strong>a 479<br />
TABLE 5<br />
Proximate composition <strong>of</strong> local <strong>feeds</strong> <strong>and</strong> feed ingredients commonly used as aqua<strong>feeds</strong> (% dry matter)<br />
Feed/ingredients<br />
DE<br />
(kcal/g)<br />
DM CP CL Ash CF NFE P C<br />
Ants/termites - - 36.0 1.1 - - - - -<br />
Barley 3 274 88.0 10.6 2.4 - 4.5 - 0.4 0.1<br />
Blood meal 2 981 87.6 60.5 2.3 25.5 0.0 11.7 0.1 0<br />
Brewers waste - - 27.8 12.6 - - - - -<br />
Broken maize 1 900 85.0 12.0 4.0 - 7.5 - 0.4 0.3<br />
Cassava 3 188 88.0 2.5 - - 4.5 - 0.1 0.2<br />
Cassava leaves - - 25.8 15.2 - - - - -<br />
Coco-yam leaves - - 19.5 17.8 - - - - -<br />
Cotton seed cake 2 422 94.0 41.1 6.2 7.9 6.2 38.0 0.5 0.1<br />
Cotton seed oil 9 000 68.6 - 99.5 - - - - -<br />
Fishmeal (Alectes jacksoni) 3 400 90.0 62.0 8.2 - 0 - 3.0 4.9<br />
Fishmeal (gomba) 2 800 90.0 39.0 15.0 - 0 - 4.0 7.0<br />
Fishmeal (R. argentea) 3 402 93.1 60.9 10.3 - 0 - 2.3 2.5<br />
Kafumbe grass (Galisoga pariflora) - - 22.4 14.9 - - - - -<br />
Maize 3 593 85.0 8.8 3.9 - 2.1 - 0.4 0.3<br />
Maize bran - 87.2 6.9 5.8 1.6 7.5 85.7 0.4 0.02<br />
Cane molasses 1 800 - 4.0 - - - - 0.1 0.7<br />
Rice bran - - 10.1 18.3 - - - - -<br />
Rice hull 1 950 89.9 7.0 1.0 - 20.0 - 0.5 0.03<br />
Sesame cake 3 337 89.5 38.5 9.0 - 4.0 - 0.9 1.7<br />
Silkworm pupae meal - - 52.1 15.5 7.2 2.9 22.1 - -<br />
Soy cake, pressed 2 900 87.0 43.0 1.8 - 6.5 - 0.7 0.3<br />
Soybean, whole 4 241 90.0 36.0 18.8 - 5.8 - 0.5 0.2<br />
Sunflower cake, pressed 2 086 88.0 25.0 10.2 - 22.0 - 1.0 0.3<br />
Sunflower oil cake - 94.8 41.7 12.9 4.6 16.5 30.8 4.6 0.2<br />
Sweet potato 3 440 87.5 3.8 0.7 - 2.7 - 0.2 0.1<br />
Sweet potato leaves - - 20.4 15.9 - - - - -<br />
Wheat bran - 79.6 14.6 - - 10.5 - - 0.1<br />
Wheat flour 3 441 88.0 12.0 2.0 - 2.0 0.4 0.3<br />
Wheat pollard 1 450 90.0 13.0 4.0 - 7.0 0.4 0.1<br />
DE= digestible energy, DM= dry matter, CP = crude protein, CL = crude lipid, NFE = nitrogen free extracts, P = phosphorus,<br />
C= calcium<br />
Source: Apolot (2003); Isyiagi (2004)<br />
At the peak <strong>of</strong> the harvest season<br />
commodity prices tend to be lower<br />
<strong>and</strong> then increase with dem<strong>and</strong><br />
<strong>and</strong> decreasing supply. The cost <strong>of</strong><br />
fishmeal also fluctuates seasonally.<br />
It is lower during January <strong>and</strong><br />
February <strong>and</strong> higher from March to<br />
May (Table 6) due to lower catches<br />
during this time <strong>of</strong> the year.<br />
Transportation <strong>of</strong> <strong>feeds</strong> <strong>and</strong><br />
feed ingredients takes various<br />
<strong>for</strong>ms including carrying the sacks<br />
on people’s head, bicycles <strong>and</strong><br />
trucks. Some villages or trading<br />
centres have mills where cereals<br />
are processed <strong>for</strong> food, leaving<br />
behind bran which is used to feed<br />
livestock <strong>and</strong> fish. Bran from the<br />
TABLE 6<br />
Production <strong>and</strong> price <strong>of</strong> various feed ingredients<br />
Ingredients Annual<br />
Annual price range (US$ per kg)<br />
production<br />
(tonnes)<br />
Mean Minimum Maximum<br />
Sesame seed cake 1 000 0.14 0.11 0.19<br />
Cotton seed cake 12 000 0.14 0.08 0.17<br />
Sunflower cake 5 000 0.11 0.10 0.14<br />
Groundnut cake - - -<br />
Maize bran - 0.080 0.07 0.09<br />
Fishmeal - 0.385 0.1 0.67<br />
Cotton seed cake - 0.017 0.014 0.02<br />
Shells (mineral) - 0.090 0.09 0.09<br />
Vitamin premix - 5.560 5.56 5.56<br />
Soybean cake - 0.500 0.44 0.56<br />
Blood meal* 400 0.420 0.42 0.42<br />
Snail shell - 0.095 0.08 0.11<br />
Bone meal - 0.190 0.19 0.19<br />
* This figure is <strong>for</strong> the Kampala district<br />
Source: Mutima Best Quality feed dealers, Kisenyi, Kampala (pers. comm.)
COURTESY OF J. RUTAISIRE AND OWORI-WADUNDE<br />
480<br />
<strong>Study</strong> <strong>and</strong> <strong>analysis</strong> <strong>of</strong> <strong>feeds</strong> <strong>and</strong> <strong>fertilizers</strong> <strong>for</strong> <strong>sustainable</strong> aquaculture development<br />
FIGURE 4<br />
Loading <strong>and</strong> <strong>of</strong>f loading <strong>of</strong> <strong>feeds</strong> <strong>and</strong> feed ingredients from <strong>and</strong> to trucks<br />
ready <strong>for</strong> transportation<br />
mills in urban centres is<br />
packed in 100 kg bags <strong>and</strong><br />
transported by traders<br />
from all over the country<br />
in trucks while loading<br />
<strong>and</strong> <strong>of</strong>floading the trucks<br />
is done by hired labourers<br />
(Figure 4). The cost <strong>of</strong><br />
transportation is US$1.11<br />
km/tonne.<br />
In the past rural<br />
people in Ug<strong>and</strong>a stored<br />
<strong>and</strong> preserved food in<br />
traditional granaries. Cereals or dried cassava were kept in such granaries <strong>for</strong> years<br />
without loss. Un<strong>for</strong>tunately this practice is disappearing. Farmers now sell their<br />
produce immediately after harvest <strong>and</strong> store very little <strong>of</strong> it <strong>for</strong> later use. This practice<br />
is based on the need <strong>for</strong> school fees <strong>and</strong> other requirements <strong>and</strong> a false sense <strong>of</strong> security<br />
that food can always be bought. The country does not have silos or other facilities <strong>for</strong><br />
storing enough food <strong>for</strong> the population <strong>for</strong> any length <strong>of</strong> time. Fortunately, Ug<strong>and</strong>a is<br />
blessed with two rainy seasons; hence prolonged dry seasons are uncommon.<br />
The lack <strong>of</strong> adequate storage facilities is a major constraint to growth <strong>of</strong> the<br />
aquaculture sector in rural areas, because farmers cannot purchase ingredients<br />
when prices are low <strong>and</strong> store them <strong>for</strong> use later in the year. With the emergence <strong>of</strong><br />
commercial fish farming it is hoped that farmers will construct proper feed stores. This<br />
initiative is being spearheaded by the FISH project, which has already selected model<br />
farmers on condition that they have or will construct feed stores.<br />
2.5 Feed <strong>for</strong>mulation <strong>and</strong> manufacturing<br />
Feed <strong>for</strong>mulation depends entirely on the availability <strong>of</strong> ingredients <strong>and</strong> their cost.<br />
Commercial fish farmers combine <strong>feeds</strong>tuffs in various ways. For example, some<br />
emerging commercial fish farmers mix 70 percent maize bran <strong>and</strong> 30 percent fishmeal<br />
or sunflower or cotton oilseed cake. The ingredients are pounded or milled, mixed at<br />
the required proportions (when adequate<br />
FIGURE 5<br />
Feed processing <strong>and</strong> drying (a) feed pelleter (b) direct sun<br />
drying on corrugated iron sheet (c) solar dryer (d) improved<br />
solar dryer<br />
quantities are available) <strong>and</strong> broadcast<br />
over the surface <strong>of</strong> the pond. Some farmers<br />
moisten the mixture to minimise loss by<br />
wind dispersal, while others mix the feed<br />
ingredients <strong>and</strong> cook the mixture to make a<br />
cake. In other instances, hot water is added<br />
to the <strong>for</strong>mulated mixture <strong>and</strong> kneaded<br />
into dough that is passed through a meat<br />
mincer to make “spaghetti” (Figure 5a).<br />
The “spaghetti” is dried on corrugated<br />
iron or plastic sheets (Figure 5b) or in<br />
solar driers (Figure 5c & d). For fish fry<br />
the dried “spaghetti” is blended <strong>and</strong> sieved<br />
using mesh sizes <strong>of</strong> 200 μm <strong>and</strong> 350 μm.<br />
The pellets tend to remain stable in water<br />
<strong>for</strong> some time <strong>and</strong> hence loss into the pond<br />
bottom is minimized. Commercial catfish<br />
hatchery owners <strong>for</strong>mulate a starter diet<br />
consisting <strong>of</strong> 5 kg <strong>of</strong> fishmeal, 3 kg <strong>of</strong><br />
whole soybean flour <strong>and</strong> 2 kg <strong>of</strong> whole
Analysis <strong>of</strong> <strong>feeds</strong> <strong>and</strong> <strong>fertilizers</strong> <strong>for</strong> <strong>sustainable</strong> aquaculture development in Ug<strong>and</strong>a 481<br />
maize flour <strong>and</strong> five eggs. However, Aquafarm <strong>and</strong><br />
Umoja farmers follow the recipe recommended by<br />
Hecht, Uys <strong>and</strong> Britz (1988) (visit www.ru.ac.za/<br />
academic/departments/difs <strong>for</strong> further details).<br />
Only one company in Ug<strong>and</strong>a produces a sinking<br />
pellet. The process involves milling the ingredients,<br />
<strong>for</strong>mulating, mixing <strong>and</strong> steam pelleting (77 o C)<br />
<strong>and</strong> fat injection, cooling (25 o C) <strong>and</strong> bagging. The<br />
pellets are produced in two sizes, 2 mm <strong>and</strong> 3 mm<br />
<strong>and</strong> have a water stability <strong>of</strong> around 45 seconds. The<br />
installed production capacity <strong>for</strong> pellet production<br />
is five tonnes per hour but only a few tonnes are<br />
produced upon request. This is mainly due to a lack<br />
<strong>of</strong> dem<strong>and</strong> <strong>and</strong> the hesitancy by the producer to<br />
store <strong>feeds</strong>. The company is now cooperating with<br />
the FISH project to produce an extruded diet.<br />
FIGURE 6<br />
Pond attendant feeding cat fish fry reared in a<br />
plastic lined nursery pond<br />
2.6 Feeding practices<br />
The main herbivorous fish produced by small-scale, subsistence farmers is Tilapia zillii<br />
<strong>and</strong> it is mainly fed on coco yam <strong>and</strong> potato leaves or on Kafumbe grass (G. pariflora)<br />
<strong>and</strong> Kanyebwa grass (O. latifolia). Most green vegetable <strong>feeds</strong> are either chopped<br />
or presented whole to the fish. There is on-going research to determine optimum<br />
conditions <strong>for</strong> polyculture <strong>of</strong> T. zillii with C. gariepinus. Most small-scale farmers do<br />
not feed their fish at regular intervals but do so depending on availability <strong>of</strong> material<br />
<strong>and</strong> when they have time. According to Nelly (2004), 22 percent <strong>of</strong> small-scale farmers<br />
do not feed their fish at all, 46 percent feed daily, 10 percent feed once a week, 9 percent<br />
feed several times a week, 4 percent feed <strong>for</strong>tnightly <strong>and</strong> 9 percent feed their fish<br />
irregularly. The leaves are tied together <strong>and</strong> simply thrown into the pond. The fish eat<br />
<strong>of</strong>f the leaves leaving the stalks, which are removed by the farmer.<br />
The major commercial aquaculture species are O. niloticus <strong>and</strong> C. gariepinus <strong>and</strong><br />
the main <strong>feeds</strong> <strong>for</strong> these species are maize bran, cotton <strong>and</strong> sunflower oilseed cake <strong>and</strong><br />
fishmeal. Commercial farmers feed their fish with pellets, steamed oilseed cake or dry<br />
mash. Pellets <strong>and</strong> powder/mash are broadcast over the pond or tank surface regardless<br />
<strong>of</strong> the species or culture system (Figure 6), whilst the steamed oilseed cakes are<br />
presented on feeding trays. There is no in<strong>for</strong>mation on FCRs <strong>of</strong> the farm-made <strong>feeds</strong>.<br />
On commercial farms, fry are fed at 15 percent <strong>of</strong> body weight per day, decreasing<br />
to 6 percent <strong>and</strong> below towards the end <strong>of</strong> the culture cycle. Feeding frequencies<br />
vary between farmers <strong>and</strong> by region, but normally fish are fed twice daily. The major<br />
problem is that most farmers do not know the biomass <strong>of</strong> fish in the ponds <strong>and</strong> cannot<br />
there<strong>for</strong>e determine appropriate rations.<br />
Despite the recent advances, the development <strong>of</strong> aquaculture in Ug<strong>and</strong>a is constrained<br />
by the absence <strong>of</strong> good commercial <strong>feeds</strong> <strong>and</strong> a lack <strong>of</strong> technical know-how to make<br />
appropriate farm-made <strong>feeds</strong>. Emerging commercial fish farmers have there<strong>for</strong>e had<br />
no option but to haphazardly <strong>for</strong>mulate <strong>feeds</strong> on their farms. During 2005, a number<br />
<strong>of</strong> commercial fish farmers resorted to importing feed from a South African company<br />
(Aquanutro (Pty) Ltd.), <strong>for</strong> catfish fingerlings. Other <strong>for</strong>eign feed companies are now<br />
also showing interest in supplying catfish producers with <strong>for</strong>mulated <strong>feeds</strong>.<br />
2.7 Labour costs<br />
Labour is available in most parts <strong>of</strong> the country, though it is largely unskilled. Labour<br />
costs are highly variable (most expensive in urban areas <strong>and</strong> cheapest in rural areas).<br />
The cost <strong>of</strong> hiring unskilled labour in Kampala is US$2.70 per day, but decreases with<br />
distance from the city.
482<br />
<strong>Study</strong> <strong>and</strong> <strong>analysis</strong> <strong>of</strong> <strong>feeds</strong> <strong>and</strong> <strong>fertilizers</strong> <strong>for</strong> <strong>sustainable</strong> aquaculture development<br />
3. THE ANIMAL FEED INDUSTRY IN UGANDA<br />
As mentioned previously, there are no industrial aquafeed manufacturers in Ug<strong>and</strong>a.<br />
What is presented below pertains to the general animal feed industry, which started in<br />
the late 1960s. The earliest feed company was registered in 1967. Currently there are<br />
about 28 industrial <strong>and</strong> small-scale feed manufacturers in Ug<strong>and</strong>a. Currently, some<br />
80 000 tonnes <strong>of</strong> animal <strong>feeds</strong> are produced by all large <strong>and</strong> small-scale mills (Kitiyo),<br />
<strong>of</strong> which 85 percent (68 000 tonnes) comprises poultry feed. The small mixers account<br />
<strong>for</strong> 60 percent <strong>of</strong> the production. However, inadequate services (delivery, quantity <strong>and</strong><br />
quality) have had their toll on the development <strong>of</strong> the livestock feed industry. The<br />
availability <strong>of</strong> good quality animal <strong>feeds</strong> at af<strong>for</strong>dable prices can only be improved by<br />
creating an enabling environment <strong>for</strong> private sector investment. A national <strong>feeds</strong> policy<br />
to guide the industry was drafted in 2000 but has yet to be approved by the Parliament.<br />
The objective <strong>of</strong> the animal <strong>feeds</strong> policy is to maximise the potential <strong>of</strong> Ug<strong>and</strong>a’s<br />
livestock resources on a <strong>sustainable</strong> basis within the context <strong>of</strong> sound environment<br />
management (MAAIF, 2000). The policy emphasises increased production, supply <strong>and</strong><br />
availability <strong>of</strong> good quality <strong>feeds</strong> <strong>for</strong> all categories <strong>of</strong> livestock at the lowest cost. The<br />
following articles <strong>of</strong> the draft policy are particularly noteworthy:<br />
• Article 3 provides guidelines on importation, manufacture <strong>and</strong> sale <strong>of</strong> animal<br />
<strong>feeds</strong> <strong>and</strong> feed ingredients.<br />
• Article 4 calls upon all persons, firms, corporations etc. engaged in the<br />
production, selling or distribution <strong>of</strong> animal <strong>feeds</strong> to indicate on the package a<br />
written statement containing the following: name <strong>and</strong> address <strong>of</strong> manufacturer,<br />
br<strong>and</strong> name, net weight, description <strong>and</strong> percent <strong>of</strong> each ingredient in the feed, the<br />
species <strong>and</strong> the type <strong>of</strong> animal <strong>for</strong> which the feed is intended, date <strong>of</strong> manufacture<br />
<strong>and</strong> expiry <strong>and</strong> the recommended conditions <strong>for</strong> h<strong>and</strong>ling, storage <strong>and</strong> use.<br />
• Article 5 specifies quality control services; this article puts in place mechanisms <strong>of</strong><br />
maintaining <strong>and</strong> controlling animal feed quality.<br />
• Article 6 deals with adulterated feed/<strong>feeds</strong>tuffs; in this article guidelines <strong>for</strong><br />
storage <strong>and</strong> transportation <strong>of</strong> feed <strong>and</strong> <strong>feeds</strong>tuff <strong>and</strong> the penalties, which include<br />
fines <strong>and</strong> maximum jail terms are stipulated.<br />
Catfish hatchery operators are hardest hit by the absence <strong>of</strong> af<strong>for</strong>dable manufactured<br />
commercial <strong>feeds</strong> <strong>and</strong> as mentioned above have resorted to importing starter diets. The<br />
FISH project also initially imported 16 tonnes <strong>of</strong> fish feed from a USA based feed<br />
company (ZEIGLER BROS., INC.), during December 2005. By using the imported<br />
<strong>feeds</strong> farmers have demonstrated the value <strong>of</strong> well balanced <strong>feeds</strong> <strong>and</strong> this may motivate<br />
local entrepreneurs to invest in an appropriate aqua-feedmill. According to a private<br />
commercial fish farm (Sunfish Farms Ltd.), which imported <strong>feeds</strong> from South Africa<br />
in November 2005, <strong>feeds</strong> are charged with a holding tax <strong>of</strong> 6 percent, value added tax<br />
at 18 percent <strong>and</strong> import duty <strong>of</strong> 10 percent. There is no in<strong>for</strong>mation with regard to<br />
taxes on locally manufactured <strong>feeds</strong>. Farmers have made a request to government to<br />
waiver the import duty on aqua<strong>feeds</strong>, while the governments’ st<strong>and</strong>, on the other h<strong>and</strong>,<br />
is to waiver taxes <strong>and</strong> duty on feed manufacturing machinery so as to encourage local<br />
manufacturing. Clearly there is a need <strong>for</strong> more dialogue to resolve these issues such<br />
that a win-win situation is created.<br />
4. PROBLEMS AND CONSTRAINTS<br />
• The lack <strong>of</strong> an af<strong>for</strong>dable industrially manufactured pelleted feed remains one<br />
<strong>of</strong> the major constraints to the development <strong>of</strong> aquaculture in Ug<strong>and</strong>a. The<br />
manufactures are unsure <strong>of</strong> a sufficient <strong>and</strong> sustained dem<strong>and</strong> to warrant the high<br />
investment costs. On the other h<strong>and</strong>, many fish farmers claim that they cannot<br />
exp<strong>and</strong> their business without high quality manufactured <strong>feeds</strong>.<br />
• Farmers are unaware <strong>of</strong> the opportunities <strong>of</strong>fered by farm-made <strong>feeds</strong>.<br />
• There are many locally available ingredients that can be incorporated in fish <strong>feeds</strong>.
Analysis <strong>of</strong> <strong>feeds</strong> <strong>and</strong> <strong>fertilizers</strong> <strong>for</strong> <strong>sustainable</strong> aquaculture development in Ug<strong>and</strong>a 483<br />
However, supply <strong>and</strong> price fluctuations can be crippling. Hence there is a need <strong>for</strong><br />
farmers to invest in storage facilities, which will allow them to purchase adequate<br />
quantities <strong>of</strong> ingredients when prices are favourable.<br />
• Poor processing, h<strong>and</strong>ling <strong>and</strong> storage affects the quality (mould, high s<strong>and</strong><br />
content, mixed ingredients) <strong>of</strong> many raw material, such as fishmeal, rice bran <strong>and</strong><br />
others. This in turn affects the quality <strong>of</strong> farm-made <strong>feeds</strong>.<br />
• Accessibility to feed ingredients is constrained by poor infrastructure (roads,<br />
storage facilities) in remote parts <strong>of</strong> the country where feed crops are produced as<br />
well as by the high transport <strong>and</strong> fuel costs (US$1.00 <strong>and</strong> 1.22 per litre <strong>of</strong> petrol<br />
<strong>and</strong> diesel, respectively).<br />
• Most fish farmers are poor <strong>and</strong> cannot af<strong>for</strong>d to buy <strong>and</strong> store feed ingredients<br />
<strong>for</strong> <strong>sustainable</strong> on-farm feed processing <strong>and</strong> hence only purchase small quantities<br />
at high retail prices <strong>for</strong> immediate use. This reduces their pr<strong>of</strong>it margins <strong>and</strong> in<br />
some instances aquaculture becomes uneconomical. It is very difficult to make<br />
reasonable suggestions on how such farmers might escape the poverty trap, except<br />
that the state should provide adequate infrastructure <strong>and</strong> invest more heavily in<br />
education <strong>and</strong> health services in rural areas.<br />
• Preparation <strong>of</strong> farm-made <strong>feeds</strong> is constrained by a lack <strong>of</strong> electricity <strong>and</strong><br />
machinery on most fish farms in the country. Some fish farmers use h<strong>and</strong> operated<br />
mincers to make <strong>feeds</strong>, but this restricts the size <strong>of</strong> the fish farming operation.<br />
Un<strong>for</strong>tunately only a h<strong>and</strong>ful <strong>of</strong> farms are on the national power grid <strong>and</strong> farmers<br />
that use generators are constrained by the high fuel cost.<br />
• The method <strong>of</strong> broadcasting milled <strong>feeds</strong> on the water surface is wasteful. This<br />
calls <strong>for</strong> improved skills <strong>and</strong> knowledge transfer.<br />
• There is a paucity <strong>of</strong> data on the current use <strong>of</strong> feed ingredients as most farmers<br />
do not keep records. It is there<strong>for</strong>e difficult to determine the total cost <strong>of</strong> inputs<br />
(including <strong>feeds</strong>) <strong>and</strong> outputs, hence important indices such the feed conversion<br />
ratios cannot be determined.<br />
• Inorganic <strong>fertilizers</strong> are readily available in Ug<strong>and</strong>a. However, the high unit cost is<br />
a major constraint. Organic fertilizer (manure) is available all year round though<br />
farmers <strong>of</strong>ten cannot source, purchase <strong>and</strong> or store adequate quantities.<br />
5. RESOURCE AVAILABILITY AND EXPANSION OF AQUACULTURE<br />
Ug<strong>and</strong>a is endowed with a wide variety <strong>of</strong> aquatic <strong>and</strong> agricultural resources that can<br />
support rapid growth <strong>of</strong> the aquaculture sector. Nearly 18 percent <strong>of</strong> Ug<strong>and</strong>a’s total<br />
surface area is covered by rivers <strong>and</strong> lakes <strong>and</strong> wetl<strong>and</strong>s <strong>and</strong> rainfall ranges between<br />
600–2 500 mm per annum. The water <strong>and</strong> soil resources <strong>of</strong>fer great opportunity <strong>for</strong><br />
l<strong>and</strong> <strong>and</strong> water based aquaculture. This, coupled with the widening gap between fish<br />
dem<strong>and</strong> <strong>and</strong> supply in Ug<strong>and</strong>a, <strong>and</strong> in the region as a whole, <strong>and</strong> the over fished (<strong>and</strong><br />
or destroyed) natural fish stocks provides the impetus <strong>for</strong> investment in <strong>and</strong> expansion<br />
<strong>of</strong> aquaculture.<br />
Successful aquaculture industries are <strong>of</strong>ten <strong>and</strong> usually preceded by a successful<br />
fishing industry, which establishes fishery products, markets <strong>and</strong> infrastructure<br />
<strong>for</strong> processing <strong>and</strong> distribution. The established markets <strong>for</strong> Nile perch <strong>and</strong> other<br />
indigenous fish species coupled with the established processing, transport <strong>and</strong><br />
other infrastructure, entrepreneurial interest <strong>and</strong> supportive economic policy will<br />
synergistically work to promote aquaculture development in Ug<strong>and</strong>a.<br />
6. RECOMMENDATIONS FOR THE IMPROVED UTILIZATION OF FERTILIZER AND<br />
FEED RESOURCES<br />
1. Suitable feed ingredients from different agro-ecological zones must be identified<br />
<strong>and</strong> analysed <strong>and</strong> an aqua<strong>feeds</strong> database must be developed <strong>for</strong> each agroecological<br />
zone.
484<br />
<strong>Study</strong> <strong>and</strong> <strong>analysis</strong> <strong>of</strong> <strong>feeds</strong> <strong>and</strong> <strong>fertilizers</strong> <strong>for</strong> <strong>sustainable</strong> aquaculture development<br />
2. The soils <strong>of</strong> the various agro-ecological zones must be analyzed to determine<br />
nutrients that are likely to be limiting <strong>and</strong> these data must be used to develop a<br />
country pr<strong>of</strong>ile <strong>for</strong> aquaculture development <strong>and</strong> investment.<br />
3. Farmers must be trained in the use <strong>of</strong> <strong>fertilizers</strong>, h<strong>and</strong>ling, application <strong>and</strong><br />
monitoring <strong>of</strong> fish production.<br />
4. Fish farmers must be trained to keep records to estimate production <strong>and</strong><br />
pr<strong>of</strong>itability. There is a need <strong>for</strong> a comprehensive programme to generate vital<br />
statistics to serve as benchmarks <strong>for</strong> aquaculture investment in the industry.<br />
Currently it is not clear what it takes to produce a kilogramme <strong>of</strong> tilapia or any<br />
fish species cultured in Ug<strong>and</strong>a.<br />
5. An inventory <strong>of</strong> fish farmers in the country must be established <strong>and</strong> maintained<br />
to estimate their potential, full production capacity <strong>and</strong> feed requirements.<br />
6. Guidelines <strong>for</strong> farm-made feed <strong>for</strong>mulation, processing, h<strong>and</strong>ling, storage <strong>and</strong><br />
application <strong>and</strong> optimal fertilizer use must be developed.<br />
7. The production <strong>and</strong> processing <strong>of</strong> soybeans must be promoted as an alternative<br />
to fishmeal. This is <strong>of</strong> particular importance because <strong>of</strong> the dem<strong>and</strong> <strong>for</strong><br />
R. argentea as food.<br />
8. There is a need to revive <strong>and</strong> modernise traditional granaries <strong>for</strong> effective feed<br />
storage.<br />
ACKNOWLEDGEMENTS<br />
I am grateful to my assistant Mr David Kahwa <strong>for</strong> working tirelessly during the<br />
production <strong>of</strong> this report. Dr Roselline Nyamutale <strong>and</strong> Mr Owori-Wadunde are<br />
thanked <strong>for</strong> pro<strong>of</strong> reading the report. Special thanks go to MAAIF, NARO, Animal<br />
feed traders <strong>and</strong> all the fish farmers visited <strong>for</strong> the compilation <strong>of</strong> this report.<br />
REFERENCES<br />
Apolot, A. 2003. The Use <strong>of</strong> poultry processing waste <strong>for</strong> Clarias gariepinus culture in<br />
earthen ponds. Fisheries Training Institute. Ug<strong>and</strong>a, Ministry <strong>of</strong> Education <strong>and</strong> Sports.<br />
(Diploma thesis)<br />
FAO. 2005. FishStat Plus: universal s<strong>of</strong>tware <strong>for</strong> fishery statistical time series. Aquaculture<br />
production: quantities 1950-2003, aquaculture production: values 1984-2003; capture<br />
production: 1950-2003; commodities production <strong>and</strong> trade: 1950-2004; total production:<br />
1970-2003, Vers. 2.30. Data <strong>and</strong> statistics unit. FAO Fisheries Department, Fishery<br />
In<strong>for</strong>mation (available at www.fao.org/fi/statist/FISOFT/FISHPLUS.asp).<br />
FEWS. 2004. Ug<strong>and</strong>a food security update: good crop production prospects. Famine Early<br />
Warning System (http://www.reliefweb.int).<br />
Hecht, T., Uys, W. & Britz, P.J. 1988. A guide to the culture <strong>of</strong> the sharptooth catfish in<br />
southern Africa. South African National Scientific Programmes Report, 153: 1–106.<br />
Isyiagi N. 2004. The aquaculture potential <strong>of</strong> indigenous catfish (Clarias gariepinus) in the<br />
Lake Victoria basin, Ug<strong>and</strong>a. United Kingdom, University <strong>of</strong> Stirling. (PhD Thesis)<br />
MAAIF. 2000. National animal feed policy. Kampala, Ministry <strong>of</strong> Agriculture, Animal<br />
Industry <strong>and</strong> Fisheries. 26 pp.<br />
Magnay, J. 2004. The Ug<strong>and</strong>a grain industry Ug<strong>and</strong>a grain traders ltd. Nairobi, NEPAD<br />
meeting.<br />
NARO-MAAIF. 2002. Aquaculture in Ug<strong>and</strong>a: baseline survey report 1999–2000. Kajjansi,<br />
Aquaculture Research <strong>and</strong> Development Centre, National Agricultural Research<br />
Organisation.<br />
Owori-Wadunde. 2001. Historical perspective <strong>of</strong> aquaculture development in Ug<strong>and</strong>a.<br />
National aquaculture in<strong>for</strong>mation workshop. Kampala, Gr<strong>and</strong> Imperial Hotel.<br />
(unpublished data).<br />
Rutaisire, J. 2005. Lake Victoria Research Initiatives (SIDA-SAREC). Aquaculture<br />
Baseline survey report, Lake Victoria Basin East Africa.
Analysis <strong>of</strong> <strong>feeds</strong> <strong>and</strong> <strong>fertilizers</strong> <strong>for</strong> <strong>sustainable</strong> aquaculture development in Ug<strong>and</strong>a 485<br />
Spilsbury J., Ferris S., Walker S. & Nyapendi, R. 2004. Evaluating the marketing<br />
opportunities <strong>for</strong> rice <strong>and</strong> its products in the principle rice growing countries <strong>of</strong> ASARECA.<br />
Ug<strong>and</strong>an Rice Report. IITA/FOODNET.<br />
UBOS. 2004. Report on the agricultural module, piggy-backed onto the population <strong>and</strong><br />
housing census (PHC), 2002: household based agricultural activities crop, livestock <strong>and</strong><br />
poultry characteristics. Ug<strong>and</strong>a. Bureau <strong>of</strong> Statistics. 57 pp.<br />
W<strong>and</strong>era, S.B., 1993. Seasonal abundance, vertical migration <strong>and</strong> the fishery <strong>of</strong> dagaa<br />
Rastrineobola argentea in the Ug<strong>and</strong>an waters <strong>of</strong> Lake Victoria. In B.E. Marshall <strong>and</strong><br />
R. Mubamba, eds. Paper presented at the symposium on biology, stock assessment <strong>and</strong><br />
exploitation <strong>of</strong> small pelagic fish species in the great Lakes region. 25–28 November 1992.<br />
Bujumbura, Burundi. CIFA Occasional Paper No. 19. Rome, FAO. 270 pp. (available at<br />
http://www.fao.org/docrep/005/v2648e/V2648E00.htm#TOC).
486<br />
APPENDIX B: Agricultural calendar<br />
<strong>Study</strong> <strong>and</strong> <strong>analysis</strong> <strong>of</strong> <strong>feeds</strong> <strong>and</strong> <strong>fertilizers</strong> <strong>for</strong> <strong>sustainable</strong> aquaculture development<br />
B.1. Agricultural calendar <strong>for</strong> selected crops with potential <strong>for</strong> inclusion into fish <strong>feeds</strong><br />
Crops Month<br />
APPENDIX<br />
APPENDIX A: Feed <strong>for</strong>mulation <strong>for</strong> North African catfish<br />
A.1. Recommended <strong>for</strong>mulation <strong>of</strong> a dry feed <strong>for</strong> Clarias gariepinus larvae <strong>and</strong> early juveniles,<br />
procedure to manufacture feed <strong>and</strong> its application<br />
Ingredients<br />
Torula yeast (C<strong>and</strong>ida utilis)<br />
Fishmeal<br />
Vitamin <strong>and</strong> mineral premix<br />
Fish oil<br />
Sunflower oil<br />
Total<br />
Zone/regions<br />
Northern Eastern Western Central<br />
Cotton May-June Planting Planting - -<br />
June-July - - Planting Planting<br />
October Harvesting Harvesting - -<br />
Maize November - - Harvesting Harvesting<br />
February Planting starts Planting starts Planting starts<br />
March Planting starts Planting continues Planting continues Planting continues<br />
April Planting continues Planting continues Planting continues Planting continues<br />
May - - Planting continues -<br />
June Harvesting green<br />
maize<br />
Harvesting green<br />
maize<br />
July-August Harvest, dry Harvesting in high<br />
altitude areas starts<br />
September Plant in wetter<br />
areas ends mid<br />
month<br />
Harvesting &<br />
planting in<br />
highl<strong>and</strong>s & ends<br />
same month.<br />
Harvesting green<br />
maize<br />
Continue<br />
harvesting<br />
Complete<br />
harvesting &<br />
plants <strong>for</strong> second<br />
rains & ends same<br />
month.<br />
Composition (% as fed basis)<br />
50<br />
43<br />
1<br />
3<br />
3<br />
100<br />
Procedure:<br />
1. Mix yeast <strong>and</strong> fishmeal with water to produce dough.<br />
2. Roll dough out into thin cakes <strong>and</strong> dry at 45oC in oven.<br />
3. Grind the dry cakes <strong>and</strong> sieve into particles <strong>of</strong> size ranges 125–200 μm <strong>and</strong> 200–350 μm.<br />
4. On a daily basis, mix the proportional amount <strong>of</strong> oil <strong>and</strong> vitamins with an appropriate amount <strong>of</strong> stock<br />
mixture.<br />
5. Discard what is not used within 24 hours.<br />
Application:<br />
Use fine particles (125–200 μm) <strong>for</strong> the first four days <strong>and</strong> large particles (200–350 μm) on subsequent days.<br />
Apply at least 20 g per 500 litre container every 2 hours, day <strong>and</strong> night, <strong>and</strong> in any case, not less than 40%<br />
<strong>of</strong> body weight per day.<br />
Source: www.ru.ac.za/academic/departments/difs (<strong>and</strong> see CD ROM Resources)<br />
Harvesting green<br />
maize<br />
Complete harvesting<br />
& plants <strong>for</strong> second<br />
rains in August<br />
End <strong>of</strong> planting<br />
October Start harvesting - - -<br />
November Harvesting Harvesting Harvesting Start harvesting<br />
December End <strong>of</strong> harvesting End <strong>of</strong> harvesting End <strong>of</strong> harvesting End <strong>of</strong> harvesting<br />
Cassava/sweet February Start planting in Details <strong>of</strong> the crop - Details <strong>of</strong> the crop<br />
potatoes<br />
wetter areas calendar are same as in<br />
calendar are same<br />
(leaves) March-May Planting continues<br />
& ends in May<br />
the northern region. Planting starts in<br />
March & ends in<br />
April<br />
as in the northern<br />
region.<br />
May–July Harvesting starts in<br />
Partial harvesting<br />
May & harvesting<br />
start in June <strong>and</strong><br />
is completed in<br />
harvesting is<br />
July<br />
completed in July<br />
August– Plating 2<br />
October<br />
nd rains<br />
Plating 2<br />
start & ends in<br />
October<br />
nd rains<br />
start & ends in<br />
October<br />
December– Starts harvesting - Starts harvesting -<br />
February & ends in February<br />
& ends in February<br />
following year<br />
following year
Analysis <strong>of</strong> <strong>feeds</strong> <strong>and</strong> <strong>fertilizers</strong> <strong>for</strong> <strong>sustainable</strong> aquaculture development in Ug<strong>and</strong>a 487<br />
B.1. Continued<br />
Crops Month<br />
Beans/<br />
soybeans<br />
Vegetables<br />
(leaves)<br />
January- May Planting start mid<br />
March or end<br />
month & ends in<br />
April<br />
June-August Green harvest start<br />
in June<br />
August–<br />
October<br />
November–<br />
December<br />
January<br />
following year<br />
January-<br />
March<br />
Harvesting<br />
continue & harvest<br />
completed in<br />
October<br />
Planting start in<br />
February & end in<br />
March. Green harvest<br />
start in April<br />
Harvesting continues<br />
& harvest completed<br />
in July.<br />
Planting <strong>for</strong> 2 nd<br />
rains & ends in mid<br />
September<br />
No activities Start green<br />
harvesting &<br />
complete harvesting<br />
in December<br />
Planting start mid<br />
March in dry areas<br />
& end in May.<br />
Green harvest<br />
starts in June<br />
& completed in<br />
August.<br />
Planting <strong>for</strong> 2nd rains & in October<br />
in drier areas<br />
Start green<br />
harvesting<br />
No activities - Complete<br />
harvesting<br />
Harvest & bed<br />
preparation, Sow<br />
nursery beds &<br />
begin transplant in<br />
March<br />
April-May Transplant,<br />
maintain old<br />
gardens, harvest<br />
up to June.<br />
June-<br />
September<br />
October-<br />
December<br />
Northern Eastern<br />
Zone/regions<br />
Western Central<br />
Maintain fields<br />
& nursery beds,<br />
harvest, sow<br />
nursery beds<br />
Prepare valley<br />
swamps fringes,<br />
harvest old<br />
fields, plant out<br />
in swamps in<br />
December<br />
Sow nursery<br />
beds & harvest in<br />
valley swamps,<br />
transplanting starts &<br />
main transplanting in<br />
March<br />
Transplant continued,<br />
hardening <strong>of</strong><br />
seedling <strong>for</strong> may<br />
transplant, start<br />
regular harvesting<br />
in May, complete<br />
1st rains planting<br />
except near valleys<br />
& continues regular<br />
harvesting.<br />
End <strong>of</strong> 1st rains<br />
planting in June<br />
except in valleys/<br />
swamps, harvesting,<br />
sow new nurseries<br />
in July & start<br />
transplanting in<br />
August.<br />
Continues planting<br />
& sow nursery beds<br />
<strong>for</strong> valley <strong>and</strong> swamp<br />
fringes harvest up<br />
to December, l<strong>and</strong><br />
preparation <strong>and</strong><br />
sowing beds in<br />
December.<br />
Maintain nursery<br />
swamp crops, sow<br />
nursery, prepare<br />
field in February &<br />
transplant in March<br />
Transplant up<br />
to June, Harvest<br />
earlier crops, sow<br />
nursery beds &<br />
plant swamp crops<br />
Sow nursery beds &<br />
plant swamp crops<br />
in June, harvest<br />
<strong>and</strong> prepare fields<br />
in July, maintain<br />
swamp crops,<br />
prepare new fields<br />
<strong>for</strong> nurseries,<br />
maintain old<br />
fields & harvest.<br />
Harden seedlings<br />
in September <strong>for</strong><br />
October planting<br />
Continue planting<br />
(valley/ swamps),<br />
Start harvest in<br />
November <strong>and</strong><br />
Open nursery beds<br />
in December.<br />
Early planting start<br />
January & ends in<br />
March, Green harvest<br />
in April<br />
Harvesting continues<br />
& harvest completed<br />
in July.<br />
Planting <strong>for</strong> 2 nd rains<br />
in September<br />
Start green<br />
harvesting in<br />
November &<br />
complete harvesting<br />
in December.<br />
-<br />
Maintain nursery<br />
swamp crops, sow<br />
nursery, prepare<br />
field in February &<br />
transplant in February<br />
& continue sowing<br />
<strong>and</strong> transplanting in<br />
March<br />
Continue sow,<br />
transplant up to may,<br />
harvesting continue<br />
up to June<br />
Continue harvesting<br />
in June, maintain<br />
swamp crops,<br />
prepare new fields<br />
<strong>for</strong> nurseries, sow<br />
nurseries up to<br />
August & transplant<br />
in September<br />
Continue planting,<br />
start harvesting<br />
in October up<br />
to December,<br />
Preparation <strong>of</strong> new<br />
fields <strong>and</strong> nurseries in<br />
December.
WORKSHOP REPORT<br />
489
Report <strong>of</strong> the FAO Expert<br />
Workshop on<br />
“Use <strong>of</strong> <strong>feeds</strong> <strong>and</strong> <strong>fertilizers</strong><br />
<strong>for</strong> <strong>sustainable</strong> aquaculture<br />
development”<br />
WUXI, JIANGSU PROVINCE, PEOPLE’S REPUBLIC OF CHINA, 18–21 MARCH 2006<br />
ORGANIZED IN COLLABORATION WITH THE<br />
FRESHWATER FISHERIES RESEARCH CENTRE, WUXI, CHINA<br />
AND THE<br />
NETWORK OF AQUACULTURE CENTRES IN ASIA-PACIFIC (NACA)<br />
THE WORKSHOP<br />
The Aquaculture Management <strong>and</strong> Conservation Service (FIMA) <strong>of</strong> FAO organized<br />
an expert workshop on the “Use <strong>of</strong> feed <strong>and</strong> fertilizer <strong>for</strong> <strong>sustainable</strong> aquaculture<br />
development” in Wuxi, Jiangsu Province, People’s Republic <strong>of</strong> China, on 18–21 March<br />
2006 in collaboration with the Freshwater Fisheries Research Centre (FFRC) <strong>of</strong> China<br />
<strong>and</strong> the Network <strong>of</strong> Aquaculture Centres in Asia-Pacific (NACA). The workshop was<br />
hosted by Freshwater Fisheries Centre (FFRC), Chinese Academy <strong>of</strong> Science at the<br />
FFRC Campus in Wuxi, Jiangsu Province, China. The workshop was undertaken as<br />
a part <strong>of</strong> FIMA’s work programme entitled “<strong>Study</strong> <strong>and</strong> <strong>analysis</strong> <strong>of</strong> feed <strong>and</strong> nutrients<br />
(including <strong>fertilizers</strong>) <strong>for</strong> <strong>sustainable</strong> aquaculture development” under the programme<br />
entity “Monitoring, Management <strong>and</strong> Conservation <strong>of</strong> Resources <strong>for</strong> Aquaculture<br />
Development”.<br />
OBJECTIVES AND OUTPUTS OF THE WORKSHOP<br />
The principal objective <strong>of</strong> the workshop was to review <strong>and</strong> analyse the current status<br />
<strong>and</strong> trends in aquaculture production <strong>and</strong> to identify key issues <strong>and</strong> challenges <strong>of</strong> feed<br />
<strong>and</strong> fertilizer resource use <strong>for</strong> <strong>sustainable</strong> aquaculture development. Several key issues<br />
were identified <strong>and</strong> prioritized during the technical <strong>and</strong> working group sessions <strong>and</strong><br />
appropriate actions were recommended.<br />
The anticipated outputs were to publish the proceedings <strong>of</strong> the workshop <strong>and</strong><br />
to provide recommendations to the Third Session <strong>of</strong> the COFI Sub-committee on<br />
Aquaculture (SCA) that was held in New Delhi, India, September 2006. The identified<br />
key issues <strong>and</strong> recommendations made to the third session <strong>of</strong> COFI-SCA (i.e., policy<br />
guidelines, research, capacity building, extension <strong>and</strong> application) are expected to<br />
enable policy makers on a global <strong>and</strong> regional level to implement improved aquaculture<br />
491
492<br />
<strong>Study</strong> <strong>and</strong> <strong>analysis</strong> <strong>of</strong> <strong>feeds</strong> <strong>and</strong> <strong>fertilizers</strong> <strong>for</strong> <strong>sustainable</strong> aquaculture development<br />
practices <strong>and</strong> farming systems through optimal use <strong>of</strong> <strong>feeds</strong> <strong>and</strong> <strong>fertilizers</strong> resources<br />
<strong>and</strong> to assist FAO member countries in the implementation <strong>and</strong> promotion <strong>of</strong> the<br />
provisions <strong>of</strong> the Code <strong>of</strong> Conduct <strong>for</strong> Responsible Fisheries (CCRF Article 9.4.3 1 ).<br />
PARTICIPANTS<br />
The workshop was attended by a wide range <strong>of</strong> research <strong>and</strong> development <strong>and</strong><br />
industrial experts in aquaculture nutrition from around the globe (Annex V).<br />
OPENING OF THE WORKSHOP<br />
The participants were welcomed by Pr<strong>of</strong> Xu Pao, Director, Freshwater Fisheries<br />
Research Center (FFRC), Chinese Academy <strong>of</strong> Fishery Sciences <strong>and</strong> the workshop was<br />
opened by Mr Li Jieren, Vice President <strong>of</strong> the Chinese Academy <strong>of</strong> Fishery Sciences.<br />
FORMAT OF THE WORKSHOP<br />
The workshop included technical presentations <strong>and</strong> working group discussions. The<br />
technical presentations were intended to orient the participants to the inter-regional<br />
commonalities, differences <strong>and</strong> problem issues pertaining to the use <strong>of</strong> <strong>feeds</strong> <strong>and</strong><br />
<strong>fertilizers</strong> in aquaculture. The technical presentations included:<br />
– Country Reviews: <strong>Study</strong> <strong>and</strong> <strong>analysis</strong> <strong>of</strong> <strong>feeds</strong> <strong>and</strong> <strong>fertilizers</strong> <strong>for</strong> <strong>sustainable</strong><br />
aquaculture development<br />
• China, India, the Philippines, Thail<strong>and</strong>, Viet Nam, Egypt <strong>and</strong> Ug<strong>and</strong>a<br />
– Country Reviews: Development <strong>of</strong> aquafeed industries<br />
• China, India <strong>and</strong> Egypt<br />
– Regional Syntheses<br />
• Feeds <strong>and</strong> sustainability <strong>of</strong> Asian aquaculture<br />
• Developments in sub-Saharan African aquaculture: <strong>feeds</strong> <strong>and</strong> fertilisers<br />
• Aquaculture <strong>feeds</strong> in Latin America: a look at key elements at the macro (the<br />
industry) <strong>and</strong> micro (farm practices) levels<br />
– Presentation <strong>of</strong> case studies on economics <strong>of</strong> aquaculture feeding practices<br />
• Case study on the use <strong>of</strong> farm-made <strong>feeds</strong> versus commercially-<strong>for</strong>mulated<br />
pellets <strong>for</strong> pangasiid catfish in the Mekong delta, Viet Nam<br />
• The economics <strong>of</strong> small-scale aquaculture feeding systems in China<br />
• An economic <strong>analysis</strong> <strong>of</strong> aquaculture feeding systems: a synthesis <strong>of</strong> three<br />
Asian countries<br />
– Invited presentation<br />
• Reducing waste production <strong>of</strong> aquaculture by improvement <strong>of</strong> feed<br />
<strong>for</strong>mulation <strong>and</strong> feeding regime<br />
– Global Synthesis<br />
• Feeds <strong>and</strong> nutrients <strong>for</strong> <strong>sustainable</strong> aquaculture development within<br />
developing countries: a global synthesis<br />
Participants were then divided into two working groups <strong>and</strong> tasked to examine one<br />
or more thematic area(s) on feed <strong>and</strong> fertilizer use in aquaculture, to identify critical<br />
issues <strong>and</strong> to suggest specific actions <strong>and</strong> make recommendations to address these<br />
issues (the working group procedure is detailed in Annex IV). The working group<br />
recommendations were presented to the plenary <strong>for</strong> approval.<br />
3<br />
CCRF Article 9.4.3: States should promote ef<strong>for</strong>ts which improve selection <strong>and</strong> use <strong>of</strong> appropriate <strong>feeds</strong>,<br />
feed additives <strong>and</strong> <strong>fertilizers</strong>, including manures.
Report <strong>of</strong> the FAO expert workshop on “Use <strong>of</strong> <strong>feeds</strong> <strong>and</strong> <strong>fertilizers</strong> <strong>for</strong> <strong>sustainable</strong> aquaculture development” 493<br />
SUMMARY OF WORKING GROUP OUTPUTS: IDENTIFICATION OF KEY ISSUES<br />
AND RECOMMENDATIONS<br />
WORKING GROUP A THEME: Industrial aquafeed- development <strong>of</strong> the<br />
industry, impact <strong>of</strong> availability <strong>of</strong> protein sources, alternatives <strong>and</strong> their<br />
feasibility<br />
The working group recognized that commercial feed production was generally driven<br />
by market <strong>for</strong>ces <strong>and</strong> this has a strong influence on the decisions made by aquafeed<br />
producers. However, there are a number <strong>of</strong> areas where external <strong>for</strong>ces have an<br />
influence on the feed sector or where the feed sector relies on external support/advice<br />
or resources. The group also affirmed that the real price <strong>of</strong> fish was not increasing.<br />
This means that feed utilization must become more efficient <strong>and</strong>, wherever possible,<br />
cheaper <strong>feeds</strong> will have to be produced. The working group identified five areas that<br />
require attention <strong>and</strong> remediation to ensure the <strong>sustainable</strong> development <strong>of</strong> the sector.<br />
These are:<br />
– Policy <strong>and</strong> regulation<br />
– Ensuring that research is effectively connected to commercial reality<br />
– Capacity building <strong>and</strong> management, particularly at farm level<br />
– Fish-based ingredients <strong>and</strong> alternatives<br />
– Availability <strong>and</strong> sourcing <strong>of</strong> ingredients<br />
1. Policy <strong>and</strong> regulation<br />
Legislating on <strong>feeds</strong> may not be an effective way to regulate resource use as overly<br />
high restrictions can increase the price <strong>of</strong> feed to a point where farmers may have<br />
difficulty in making a pr<strong>of</strong>it. There are three levels at which it is possible to influence<br />
the sector.<br />
– Government legislation regarding allowable environmental impacts <strong>and</strong> food<br />
safety requirements <strong>of</strong> the product<br />
– The market determines the dem<strong>and</strong> <strong>and</strong> price <strong>of</strong> the product <strong>and</strong> this influences<br />
the activity <strong>and</strong> decisions <strong>of</strong> the farmer.<br />
– Greater awareness <strong>of</strong> farmers regarding optimal production methods <strong>and</strong><br />
management<br />
1.1 Setting national feed st<strong>and</strong>ards<br />
In several countries, national st<strong>and</strong>ards have been set <strong>for</strong> the nutrient content <strong>of</strong> <strong>feeds</strong><br />
<strong>for</strong> a number <strong>of</strong> species. However, this does not deal adequately with the diversity <strong>of</strong><br />
production systems. While it is relatively easy to define st<strong>and</strong>ards <strong>for</strong> cold, clear water<br />
systems it is more complex in warm, greenwater systems in which the fish obtain<br />
considerable supplemental feeding.<br />
The setting <strong>of</strong> st<strong>and</strong>ards <strong>for</strong> <strong>feeds</strong> that have overly high nutrient levels (such that<br />
they reflect the complete requirement <strong>of</strong> the animal) may actually encourage inefficient<br />
resource use <strong>and</strong> also limits the ability to capture the benefit <strong>of</strong> supplementary nutrition<br />
in the pond/production environment.<br />
Any st<strong>and</strong>ards should reflect the reality <strong>of</strong> farming systems <strong>and</strong> the natural variability<br />
that exists between these systems. National st<strong>and</strong>ards can be misleading since they may<br />
be benchmarked against fishmeal based <strong>feeds</strong>. St<strong>and</strong>ards should be more flexible to<br />
indicate a range (protein, CHO, energy etc.) <strong>for</strong> different farming systems rather than<br />
an absolute figure based on the nutritional requirements <strong>of</strong> species. Hence, there is a<br />
need to review national st<strong>and</strong>ards <strong>and</strong> develop realistic guidelines or advisory material<br />
regarding the likely needs <strong>for</strong> different systems <strong>and</strong> species. This should be used to<br />
in<strong>for</strong>m national aquafeed legislation
494<br />
<strong>Study</strong> <strong>and</strong> <strong>analysis</strong> <strong>of</strong> <strong>feeds</strong> <strong>and</strong> <strong>fertilizers</strong> <strong>for</strong> <strong>sustainable</strong> aquaculture development<br />
1.2 Lack <strong>of</strong> quality st<strong>and</strong>ards <strong>for</strong> raw materials<br />
There is a need to review nutrient specifications <strong>of</strong> raw materials <strong>and</strong> to set classification<br />
st<strong>and</strong>ards <strong>for</strong> raw materials (i.e. a classification system Class A, Class B etc.), that could<br />
then be used <strong>for</strong> different <strong>feeds</strong> <strong>and</strong> culture systems. This would greatly assist feed<br />
manufacturers.<br />
Example<br />
Different types <strong>of</strong> lecithin quality in China<br />
1.3 Review existing mechanisms <strong>of</strong> incentives <strong>and</strong> subsidies in the animal feed sector<br />
The range <strong>of</strong> incentives <strong>and</strong> subsidies are vast <strong>and</strong> could not be dealt with in the allotted<br />
time. Nevertheless it was recognised that incentives can play an important role in<br />
enabling or constraining parts <strong>of</strong> the aquaculture sector <strong>and</strong> which may preferentially<br />
favour export orientated aquaculture over smaller scale domestic activities.<br />
Examples<br />
– Reduced duty on feed <strong>and</strong> or raw material imports or duty free imports<br />
– Tax exemptions on <strong>feeds</strong> <strong>for</strong> products destined <strong>for</strong> export<br />
– Feeds classified as ‘foodstuffs’ may be subject to high tariffs<br />
– Import substitution should be eligible <strong>for</strong> reduced duties<br />
– Zero tax on major feed ingredients<br />
– High import tariffs on feed additives/pre-mix (leads to smuggling <strong>and</strong> associated<br />
problems with regard to labelling <strong>and</strong> inclusion <strong>of</strong> banned substances)<br />
– Government incentives <strong>for</strong> R&D leading to a reduction in inclusion levels <strong>of</strong><br />
critical raw materials or their replacement<br />
1.4 Impose levies on <strong>feeds</strong> <strong>and</strong> direct the proceeds into research <strong>and</strong> development<br />
While the direct benefits <strong>of</strong> a levy are clear <strong>and</strong> very sensible, this is typically unpopular<br />
with the industry since the cost <strong>of</strong> the levy is inevitably transferred to the farmer. The<br />
imposition <strong>of</strong> feed levies to fund R&D requires clear demonstration that the public<br />
sector will use the research funds appropriately <strong>and</strong> that the research will be useful<br />
<strong>for</strong> all sectors <strong>of</strong> the industry. In addition there would have to be a strong partnership<br />
between research <strong>and</strong> the industry to set research priorities. Such a fund could also be<br />
used <strong>for</strong> training to improve feed utilization at the farm level.<br />
1.5 Provision <strong>of</strong> af<strong>for</strong>dable credit to break the barrier <strong>for</strong> extensive farmer to go into<br />
semi-intensive operations<br />
This is <strong>of</strong> particular importance in Africa but examples from other regions also exist.<br />
There is a strong need to in<strong>for</strong>m financial institutions <strong>of</strong> the economic benefits <strong>of</strong><br />
aquaculture, the need to feed fish <strong>and</strong> its impact on the ability to repay a loan<br />
Example<br />
– In Africa, lack <strong>of</strong> l<strong>and</strong> tenure prevents the use <strong>of</strong> l<strong>and</strong> as collateral <strong>and</strong> constrains<br />
borrowing.<br />
– Philippines – government bank provides loans to small producers wanting to<br />
move to semi-intensive operations, but they have to from fishery cooperatives to<br />
access (no collateral) loans.<br />
1.6 Environmental regulations to be developed to limit impacts <strong>of</strong> aquaculture<br />
Feed mills need to improve feed quality to reduce leaching <strong>of</strong> nutrients <strong>and</strong> to improve<br />
digestibility <strong>of</strong> the <strong>feeds</strong>.
Report <strong>of</strong> the FAO expert workshop on “Use <strong>of</strong> <strong>feeds</strong> <strong>and</strong> <strong>fertilizers</strong> <strong>for</strong> <strong>sustainable</strong> aquaculture development” 495<br />
Example<br />
– China is considering a ban on the use <strong>of</strong> trash fish in the near future<br />
– China is also considering discharge regulations<br />
2. Ensuring that research is effectively connected to commercial reality<br />
Laboratory based feed research relies on controlled conditions. In most instances<br />
laboratory trials cannot continue until the fish has reached market size <strong>and</strong> thus may<br />
have limited application to commercial culture conditions. Many feed companies<br />
undertake their own research under commercial farming conditions to fully test their<br />
<strong>feeds</strong>; however this in<strong>for</strong>mation is <strong>of</strong>ten proprietary <strong>and</strong> is not generally available.<br />
There is a need to partner public funded research with the commercial feed<br />
manufacturing sector. This will provide a better underst<strong>and</strong>ing <strong>of</strong> reality. It will<br />
also allow the setting <strong>of</strong> better st<strong>and</strong>ards <strong>and</strong> will allow research results to be more<br />
effectively transferred to farmers.<br />
Example<br />
Clearwater nutrition trials on tilapia nutrition do not allow <strong>for</strong> the contribution <strong>of</strong><br />
phytoplankton to nutrition. If tilapia are well fed they will not use the phytoplankton<br />
as a supplement, thus a balance in the diet <strong>and</strong> feeding regime needs to be reached to<br />
optimize the systems.<br />
2.1 Increase dialogue between the feed industry, academia <strong>and</strong> farmers <strong>and</strong><br />
encourage cooperative research<br />
It is <strong>of</strong> critical importance that industry <strong>and</strong> research organizations are effectively<br />
linked. In many countries research is <strong>of</strong>ten solely focussed on high value species <strong>and</strong><br />
export oriented production/producers. Governments have an obligation to ensure that<br />
attention is also paid to the domestic sector <strong>and</strong> lower value crops.<br />
Example<br />
– China - feed industry has regular meetings with academics <strong>and</strong> fish farmers.<br />
– Strong dialogue between Norwegian salmon farms <strong>and</strong> government with respect<br />
to management <strong>and</strong> research<br />
– Brazil shrimp farmers association – development <strong>of</strong> industry GMP’s, biosecurity<br />
protocols <strong>of</strong> disease emergence <strong>and</strong> water quality st<strong>and</strong>ards <strong>and</strong> consistent<br />
ingredient labelling<br />
– Thail<strong>and</strong> – farmers association (annual meeting between farmers <strong>and</strong> scientists)<br />
2.2 Determine proper feeding regimes <strong>and</strong> develop aqua<strong>feeds</strong> <strong>for</strong> specific culture<br />
systems<br />
Feeding regimes should reflect the purpose <strong>and</strong> goal <strong>of</strong> the producer. Feeds <strong>for</strong><br />
herbivorous/omnivorous species may not adequately incorporate the contribution <strong>of</strong><br />
nutrition from the pond environment.<br />
Example<br />
Export quality tilapia may require that complete <strong>feeds</strong> <strong>and</strong> clearwater systems are used,<br />
whereas a domestic market may produce fish in greenwater systems with a cheaper feed<br />
to reduce production costs.<br />
2.3 A general lack <strong>of</strong> baseline in<strong>for</strong>mation on the nutrient requirements <strong>of</strong> most<br />
species in developing countries<br />
There is a real need to assess <strong>and</strong> better underst<strong>and</strong> the nutritional requirements <strong>of</strong> fish<br />
in marine as well as freshwater, greenwater / heterotrophic systems over <strong>and</strong> above that<br />
which they obtain from supplemental pond nutrients. Of critical importance <strong>for</strong> the
496<br />
<strong>Study</strong> <strong>and</strong> <strong>analysis</strong> <strong>of</strong> <strong>feeds</strong> <strong>and</strong> <strong>fertilizers</strong> <strong>for</strong> <strong>sustainable</strong> aquaculture development<br />
farmer is that this type <strong>of</strong> research be conducted on a commercial scale, over the entire<br />
production cycle, <strong>and</strong> that it incorporates an economic <strong>analysis</strong>.<br />
3. Capacity building <strong>and</strong> management<br />
3.1 Capacity building at farmer level<br />
It must be recognized that the majority <strong>of</strong> aquafarmers operate at the household level<br />
<strong>and</strong> have relatively limited education. This means that the transfer <strong>of</strong> complex technical<br />
messages is problematic <strong>and</strong> requires continuous attention<br />
3.2 Facilitate establishment <strong>of</strong> fish farmer associations to exchange in<strong>for</strong>mation <strong>and</strong><br />
facilitate education<br />
This <strong>of</strong>ten enables farmers to access in<strong>for</strong>mation more effectively.<br />
3.3 Clustering <strong>of</strong> fish farms (small farms) to reduce risk<br />
Large operations have a higher degree <strong>of</strong> control over inputs. However, smaller<br />
operations lack critical mass to exercise any degree <strong>of</strong> control over input costs <strong>and</strong><br />
this increases risk. Risk can be reduced if farms are clustered or if farmers organize<br />
themselves into groups.<br />
3.4 Training <strong>and</strong> extension services <strong>for</strong> small scale farmers must be enhanced<br />
Government support <strong>for</strong> farmer training is inclined to favour those producing high<br />
value or export commodities. There is a need <strong>for</strong> better extension into domestic<br />
systems. Farmers associations can access in<strong>for</strong>mation easier than individual farmer <strong>and</strong><br />
can also train their members.<br />
3.5 Capacity building results in significant increases in feed utilization efficiency<br />
There is a need to disseminate in<strong>for</strong>mation to farmers on more efficient farm<br />
management practises <strong>and</strong> efficient use <strong>of</strong> <strong>feeds</strong> (e.g., monitoring, feed trays etc.). The<br />
industry is developing rapidly <strong>and</strong> farmers must keep pace with new technologies <strong>and</strong><br />
developments, which otherwise will lead to greater inefficiencies.<br />
4. Fish-based ingredients <strong>and</strong> alternatives<br />
4.1 Fishmeal replacement<br />
Fishmeal can be replaced to a large extent but at a cost (e.g. enzyme <strong>and</strong> amino acid<br />
supplementation), which brings the final cost <strong>of</strong> alternative <strong>feeds</strong> in line with fishmeal<br />
based diets. At this stage fishmeal is still relatively available <strong>and</strong> practices will continue<br />
until such time as the availability <strong>of</strong> fishmeal becomes seriously constrained.<br />
4.2 Alternatives <strong>for</strong> fishmeal <strong>and</strong> fish oil<br />
There is a pressing need to look at the use <strong>of</strong> unconventional feed ingredients, but there is<br />
limited knowledge or in<strong>for</strong>mation on possible alternatives <strong>and</strong> their availability. Fish oil<br />
is considered to be a serious limiting factor; however there are alternatives that have not<br />
been fully explored. There is a need to look more closely at these alternatives <strong>and</strong> address<br />
the issues that relate to the constraints to their use (e.g. anti-nutritional factors).<br />
4.3 Encouraging the move away from the use <strong>of</strong> trash fish<br />
There is increasing consumer pressure <strong>for</strong> aquaculture to become more responsible <strong>and</strong><br />
<strong>for</strong> the sector to use more <strong>sustainable</strong> resources as fish feed.<br />
Example<br />
China has taken note <strong>of</strong> the pressure <strong>and</strong> is considering a ban on trash fish use in the<br />
future. Moreover, the use <strong>of</strong> trash fish in the pangasid catfish industry raises potential<br />
future problems with respect to water quality <strong>and</strong> disease.
Report <strong>of</strong> the FAO expert workshop on “Use <strong>of</strong> <strong>feeds</strong> <strong>and</strong> <strong>fertilizers</strong> <strong>for</strong> <strong>sustainable</strong> aquaculture development” 497<br />
4.4 Research on fishmeal <strong>and</strong> fish oil replacements<br />
Research is ongoing but the findings have not been translated into commercial practice.<br />
Production <strong>and</strong> use <strong>of</strong> silage <strong>and</strong>/or fish hydrolysates using low value/trash fish or<br />
fish processing wastes<br />
Fish silage <strong>and</strong> hydrolysates can substitute fishmeal to a certain extent <strong>and</strong> also act<br />
as effective attractants. These products are available but because they are wet it raises<br />
problems <strong>for</strong> large scale feed manufacturers. The technology <strong>for</strong> the manufacture <strong>of</strong><br />
silage <strong>and</strong> hydrolysates is available but not yet transferred <strong>and</strong>/or the products are still<br />
expensive. These commodities provide options <strong>and</strong> opportunities <strong>for</strong> farm-made <strong>feeds</strong><br />
<strong>and</strong> or small scale producers <strong>of</strong> moist <strong>feeds</strong>.<br />
Improve fishmeal quality<br />
There is a need <strong>for</strong> a greater degree <strong>of</strong> engagement with local fishmeal producing<br />
plants to improve the quality <strong>of</strong> their product or production efficiency. The down side<br />
<strong>of</strong> improving fishmeal quality is that the price will increase, which may have serious<br />
financial repercussions <strong>for</strong> small scale farmers.<br />
Reducing the dependence on fishmeal imports<br />
It was generally agreed that there has not been much focus on alternatives since<br />
fishmeal up to now has been readily available. However, the situation is changing <strong>and</strong><br />
countries need to consider ways <strong>and</strong> means to reduce the dependence on imported<br />
fishmeal. India has largely succeeded in this endeavour, despite the fact that the local<br />
fishmeal is not <strong>of</strong> the same quality as that which is imported.<br />
Examples<br />
– Some countries regulate import <strong>of</strong> <strong>feeds</strong>tuffs to protect the national market<br />
– Classification <strong>of</strong> ingredients as feed grade/food grade<br />
– Specific tariffs on additives<br />
– Rising fishmeal prices does not seriously impact on the economics <strong>of</strong> farms<br />
that produce high value products. However, rising process seriously affects the<br />
pr<strong>of</strong>itability <strong>of</strong> lower value species farms.<br />
– Governments can <strong>and</strong> should play an active role in encouraging the industry to<br />
change to local products<br />
– Single cell proteins as fishmeal replacements are still too costly<br />
5. Availability <strong>and</strong> sourcing <strong>of</strong> ingredients<br />
5.1 Abuse <strong>of</strong> feed additives in aqua<strong>feeds</strong> - the need <strong>for</strong> regulation<br />
Traceability issues remain an issue with regard to the composition <strong>of</strong> some feed<br />
additives. The composition <strong>of</strong> many additives is unknown <strong>and</strong> there<strong>for</strong>e raises the risk<br />
<strong>of</strong> the inclusion <strong>of</strong> banned or restricted chemicals. Several recent trade disputes in this<br />
regard have led some countries to introduce stringent control measures.<br />
Feed millers are increasingly testing their raw materials to ensure that they are not a<br />
source <strong>of</strong> restricted chemicals (i.e. through contaminated feed ingredients). However in<br />
some countries restricted or banned chemicals/drugs are still available <strong>and</strong> are readily<br />
used.<br />
5.2 Sourcing from <strong>sustainable</strong> feed supplies<br />
There is a growing trend in dem<strong>and</strong> <strong>for</strong> the use <strong>of</strong> feed ingredients from more <strong>sustainable</strong><br />
sources. An emerging opportunity is the use <strong>of</strong> bone <strong>and</strong> animal by-product meals<br />
which were originally used in livestock <strong>feeds</strong>. Due to cross contamination concerns<br />
these commodities are no longer used by the animal feed industry <strong>and</strong> may provide an<br />
ideal alternative to fishmeal. The availability <strong>of</strong> these commodities is potentially vast.
498<br />
<strong>Study</strong> <strong>and</strong> <strong>analysis</strong> <strong>of</strong> <strong>feeds</strong> <strong>and</strong> <strong>fertilizers</strong> <strong>for</strong> <strong>sustainable</strong> aquaculture development<br />
5.3 Competition <strong>for</strong> raw materials with other sectors<br />
Competition with the livestock sector <strong>and</strong> in some cases with direct human<br />
consumption <strong>for</strong> commodities used in aqua<strong>feeds</strong> is increasing (e.g. maize, soybean,<br />
reduction fisheries, wheat). While it is recognised that there is a difference between<br />
food grade <strong>and</strong> feed grade materials there will be increasing pressure in the future on<br />
the use <strong>of</strong> food grade materials in animal <strong>feeds</strong>. Moreover, there will be increasing<br />
competition <strong>for</strong> agricultural l<strong>and</strong> <strong>for</strong> growing human food rather than growing crops<br />
intended <strong>for</strong> animal <strong>feeds</strong>.<br />
5.4 GMO ingredients<br />
The working group recognized that the use <strong>of</strong> genetically modified aquafeed<br />
commodities is <strong>and</strong> may become more problematic in future.<br />
WORKING GROUP B THEME: Farm-made aqua<strong>feeds</strong> (including manures<br />
<strong>and</strong> <strong>fertilizers</strong>) -opportunities <strong>and</strong> constraints, availability, feasibility <strong>and</strong><br />
management<br />
The use <strong>of</strong> farm-made <strong>feeds</strong> <strong>and</strong> <strong>fertilizers</strong> plays very significant roles in aquaculture<br />
production in developing countries. However, it has received inadequate attention<br />
hitherto. Recognizing its importance, there is an urgent need to address issues related<br />
to farm-made <strong>feeds</strong> <strong>and</strong> <strong>fertilizers</strong> to ensure increased production efficiency <strong>and</strong><br />
<strong>sustainable</strong> development <strong>of</strong> the aquaculture sector. The factors identified that are<br />
thought to be <strong>of</strong> immediate relevance can be categorized under five headings.<br />
These are:<br />
• Policy/guidelines<br />
• Research <strong>and</strong> development needs<br />
• Extension, application <strong>and</strong> adoption<br />
• Capacity building; <strong>and</strong><br />
• Public <strong>and</strong> private sector partnerships.<br />
1. Policy/Guidelines<br />
Governments are encouraged to develop <strong>and</strong> implement appropriate policies with<br />
respect to farm-made <strong>feeds</strong> <strong>and</strong> <strong>fertilizers</strong> are developed <strong>and</strong> effectively implemented.<br />
Such possible policies should encompass the following factors <strong>and</strong> issues:<br />
• use <strong>of</strong> farm-made <strong>feeds</strong> <strong>and</strong> <strong>fertilizers</strong> should ensure environmental integrity<br />
such as the prudent use <strong>of</strong> trash fish in farm-made <strong>feeds</strong> <strong>and</strong> integrating animal<br />
husb<strong>and</strong>ry with fish culture;<br />
• encourage the use <strong>of</strong> locally available raw materials <strong>and</strong> ingredients;<br />
• in certain regions where use <strong>of</strong> farm-made <strong>feeds</strong> is non-existent, encouragement<br />
should be given to make use <strong>of</strong> locally available ingredients to promote the<br />
development <strong>of</strong> aquaculture;<br />
• set quality <strong>and</strong> safety guidelines <strong>for</strong> effective use <strong>of</strong> farm-made <strong>feeds</strong> <strong>and</strong> <strong>fertilizers</strong>;<br />
• provide support <strong>for</strong> needs based research;<br />
• provide support <strong>for</strong> the procurement <strong>of</strong> suitable/appropriate equipment <strong>for</strong> farmmade<br />
feed <strong>and</strong> <strong>fertilizers</strong>;<br />
• governments will have to recognize the possible negative impacts/influence <strong>of</strong> vested<br />
interests in the development <strong>of</strong> the farm-made feed <strong>and</strong> fertilizer sectors; <strong>and</strong><br />
• develop mechanisms <strong>for</strong> interregional <strong>and</strong> international cooperation on the use <strong>of</strong><br />
farm-made <strong>feeds</strong>.<br />
2. Research <strong>and</strong> development needs<br />
Recognizing the importance <strong>of</strong> farm-made <strong>feeds</strong> <strong>and</strong> <strong>fertilizers</strong> in developing countries,<br />
there is a need to intensify research <strong>and</strong> dissemination <strong>of</strong> outcomes on the following<br />
aspects:
Report <strong>of</strong> the FAO expert workshop on “Use <strong>of</strong> <strong>feeds</strong> <strong>and</strong> <strong>fertilizers</strong> <strong>for</strong> <strong>sustainable</strong> aquaculture development” 499<br />
• collate <strong>and</strong> update in<strong>for</strong>mation on ingredients currently used <strong>and</strong> potentially<br />
usable in farm-made <strong>feeds</strong>; synthesis be carried out in respect <strong>of</strong> all available<br />
ingredients used on a regional basis taking into consideration factors such as<br />
seasonality, nutritional composition, price fluctuations (FAO/NACA/ <strong>and</strong> other<br />
regional organizations <strong>and</strong> or donor organisations);<br />
• conduct a compilation <strong>and</strong> detailed review in a number <strong>of</strong> developing countries<br />
on the characteristics (ingredients, composition, methods <strong>of</strong> preparation, storage,<br />
efficacy, economics <strong>of</strong> per<strong>for</strong>mance) <strong>of</strong> currently used farm-made <strong>feeds</strong>. Such<br />
studies are expected to lead to compilation <strong>of</strong> better practice approaches on the<br />
use <strong>of</strong> farm-made <strong>feeds</strong>, on a regional basis (FAO/NACA/ <strong>and</strong> other regional<br />
organizations <strong>and</strong> or donor organisations);<br />
• national institutions should be encouraged to undertake suitable research on<br />
<strong>for</strong>mulation <strong>and</strong> improvements on proper <strong>and</strong> safe use <strong>of</strong> farm-made <strong>feeds</strong> <strong>and</strong> <strong>fertilizers</strong>;<br />
• encourage <strong>and</strong> stimulate research on the nutritional requirements <strong>and</strong> feed <strong>and</strong><br />
feeding related aspects <strong>of</strong> major cultured species. Relevant findings should be<br />
tested on farm be<strong>for</strong>e dissemination;<br />
• compile <strong>and</strong> update available knowledge on the nutritional requirements <strong>of</strong> major<br />
cultured species in different regions (FAO); <strong>and</strong><br />
• where appropriate, use should be made <strong>of</strong> indigenous knowledge.<br />
3. Extension, application <strong>and</strong> adoption<br />
Organizations that interface with farmers or closely connected with farmers play an<br />
extremely important role <strong>and</strong> should be encouraged <strong>and</strong> supported in their work with<br />
regard to farm-made <strong>feeds</strong> <strong>and</strong> appropriate use <strong>of</strong> fertilizer. Acknowledging that the<br />
available extension materials are limited <strong>and</strong> <strong>of</strong>ten lack field testing, there is a need to<br />
identify <strong>and</strong> prepare appropriate extension tools with respect to the use <strong>of</strong> farm-made<br />
<strong>feeds</strong>. In order to achieve these objectives, the following actions may be taken by<br />
national <strong>and</strong> regional institutions:<br />
• relevant extension materials developed <strong>and</strong> field tested with due considerations <strong>of</strong><br />
cultural norms;<br />
• in developing extension materials on the preparation <strong>of</strong> farm-made <strong>feeds</strong> <strong>and</strong> use<br />
<strong>of</strong> fertilizer, indigenous knowledge should be considered <strong>and</strong> farmers should be<br />
appraised <strong>of</strong> environmental concerns;<br />
• use <strong>of</strong> mass media (e.g. radio, theatre, TV, newspaper) should be intensified;<br />
• utilize existing successful demonstration units/farm as well as promote innovative<br />
farmers <strong>and</strong> use these farms as extension centres; <strong>and</strong><br />
• increased interaction between research <strong>and</strong> development (R&D) <strong>and</strong> farmers; <strong>and</strong><br />
between farmers.<br />
4. Capacity building<br />
The full value <strong>of</strong> the use <strong>of</strong> <strong>fertilizers</strong> <strong>and</strong> farm-made <strong>feeds</strong> in rural aquaculture in<br />
developing countries has not been fully realized. There is an urgent need <strong>for</strong> capacity<br />
building <strong>for</strong> research <strong>and</strong> development <strong>and</strong> effective extension. These objectives could<br />
be achieved through the following actions by national <strong>and</strong> regional institutions:<br />
• capacity building <strong>of</strong> extension <strong>of</strong>ficers <strong>and</strong> private service providers <strong>and</strong> NGOs<br />
through, e.g., specialized short term training programmes <strong>and</strong> workshops<br />
• training on the preparation <strong>and</strong> use <strong>of</strong> farm-made <strong>feeds</strong> <strong>and</strong> <strong>fertilizers</strong>; <strong>and</strong><br />
• in certain regions such as Africa, there is a need <strong>for</strong> specialist capacity (e.g.<br />
specialized advanced training on fish nutrition <strong>and</strong> fish feed technology).<br />
5. Private <strong>and</strong> public sector partnerships<br />
Until now, there has been very little interaction between the private <strong>and</strong> the public<br />
sectors regarding the importance <strong>of</strong> farm-made <strong>feeds</strong> <strong>and</strong> <strong>fertilizers</strong> <strong>for</strong> the development
500<br />
<strong>Study</strong> <strong>and</strong> <strong>analysis</strong> <strong>of</strong> <strong>feeds</strong> <strong>and</strong> <strong>fertilizers</strong> <strong>for</strong> <strong>sustainable</strong> aquaculture development<br />
<strong>of</strong> rural <strong>and</strong> peri-urban aquaculture. The following will facilitate dialogue between the<br />
sectors:<br />
• private (small-scale feed makers <strong>and</strong> other service providers) <strong>and</strong> public sectors<br />
need greater appreciation <strong>of</strong> the importance <strong>of</strong> farm-made <strong>feeds</strong> <strong>and</strong> <strong>fertilizers</strong>;<br />
• provide a plat<strong>for</strong>m <strong>for</strong> dialogue between farmers <strong>and</strong> small scale feed producers<br />
<strong>and</strong> the animal husb<strong>and</strong>ry industry through workshops (FAO/NACA/<strong>and</strong> other<br />
regional organizations <strong>and</strong> or donor organizations);<br />
• encourage the establishment <strong>of</strong> farmer cooperatives/associations <strong>for</strong> on farmmade<br />
feed production; <strong>and</strong><br />
• provision <strong>of</strong> technical advisory services by public sector (agricultural agencies),<br />
e.g. providing printed/web-based in<strong>for</strong>mation on supplier/market/price <strong>and</strong><br />
other available services. To increase the responsibility <strong>of</strong> the public sector, using<br />
examples <strong>of</strong> lessons learned from other countries (e.g. leaflets, telecommunication,<br />
NACA/ACIAR booklet on grouper feed, etc).<br />
The workshop recommended that FAO be tasked to take up the following actions<br />
to assist national governments <strong>and</strong> regional organizations:<br />
• review existing national st<strong>and</strong>ards <strong>and</strong> legislation regarding the dietary nutrient<br />
specifications (where they exist) <strong>for</strong> the manufacture <strong>of</strong> compound aqua<strong>feeds</strong>/<br />
farm-made aqua<strong>feeds</strong> <strong>for</strong> the major cultivated fish species, including the provision<br />
<strong>of</strong> guidelines <strong>and</strong> advisory material <strong>for</strong> different farming systems <strong>and</strong> feed types;<br />
• review existing national mechanisms <strong>of</strong> incentives, subsidies <strong>and</strong> taxes affecting<br />
the animal feed manufacturing sector <strong>and</strong> feed ingredient usage, including feed<br />
ingredient imports <strong>and</strong> export/domestic promotion strategies;<br />
• compile available in<strong>for</strong>mation (in the <strong>for</strong>m <strong>of</strong> synopses) on the dietary nutritional<br />
requirements <strong>of</strong> major cultured fish species <strong>and</strong> the feed ingredients currently<br />
used within compound/farm-made aqua<strong>feeds</strong>, including national/regional feed<br />
ingredient source books containing in<strong>for</strong>mation on nutrient composition, quality<br />
control criteria, seasonality, <strong>and</strong> market price;<br />
• encourage the strengthening <strong>of</strong> national/regional dialogue, exchange <strong>of</strong> in<strong>for</strong>mation<br />
<strong>and</strong> research priority setting between researchers/public sector <strong>and</strong> the aquaculture<br />
sector (including farmers <strong>and</strong> feed manufacturers), through support to the activities<br />
<strong>of</strong> national/regional organizations, the implementation <strong>of</strong> joint research projects,<br />
the establishment <strong>of</strong> national farmer/aquafeed associations, <strong>and</strong> the development<br />
<strong>of</strong> web-based in<strong>for</strong>mation <strong>and</strong> research networks; <strong>and</strong><br />
• strengthen capacity building in aquaculture nutrition <strong>and</strong> feed technology, including<br />
on-farm feed management, <strong>for</strong> farmers, feed manufacturers, private service<br />
providers, researchers <strong>and</strong> extension workers within developing countries (<strong>and</strong> in<br />
particular within sub-Saharan Africa). This may also respond well to inter-regional<br />
cooperation.<br />
ACKNOWLEDGEMENTS<br />
We would like to gratefully acknowledge all staff <strong>of</strong> the Freshwater Fisheries Research<br />
Centre <strong>and</strong> in particular Mr Miao Weimin, Deputy Director <strong>and</strong> Associate Pr<strong>of</strong>essor Yuan<br />
Xinhua <strong>for</strong> their excellent cooperation <strong>and</strong> hospitality provided during the workshop. The<br />
Network <strong>of</strong> Aquaculture Centres in Asia-Pacific (NACA) is acknowledged <strong>for</strong> its active<br />
collaboration in organizing the workshop. The Ministry <strong>of</strong> Agriculture, Government <strong>of</strong><br />
P.R. China is acknowledged <strong>for</strong> arranging the necessary government clearance <strong>for</strong> visas<br />
<strong>of</strong> all workshop participants. All participants actively participated in the workshop <strong>and</strong><br />
contributed during the technical presentations <strong>and</strong> the working group sessions <strong>and</strong> we<br />
take this opportunity to thank all <strong>of</strong> them <strong>for</strong> their time <strong>and</strong> ef<strong>for</strong>t. The kind assistance<br />
<strong>and</strong> active contributions by Dr Simon Funge-Smith, Aquaculture Officer, FAO Regional<br />
Office <strong>for</strong> Asia <strong>and</strong> the Pacific, Bangkok, Thail<strong>and</strong> <strong>and</strong> Dr Melba Reantaso, Fishery<br />
Resources Officer (Aquaculture), FAO HQ, Rome, Italy is gratefully acknowledged.
Report <strong>of</strong> the FAO expert workshop on “Use <strong>of</strong> <strong>feeds</strong> <strong>and</strong> <strong>fertilizers</strong> <strong>for</strong> <strong>sustainable</strong> aquaculture development” 501<br />
ANNEX I<br />
WELCOME REMARKS PROFESSOR XU PAO, DIRECTOR, FRESHWATER<br />
FISHERIES RESEARCH CENTER, CHINESE ACADEMY OF FISHERY SCIENCES,<br />
WUXI 214081, CHINA<br />
Ladies <strong>and</strong> Gentlemen:<br />
Good morning<br />
FAO expert workshop on the use <strong>of</strong> <strong>feeds</strong> <strong>and</strong> <strong>fertilizers</strong> <strong>for</strong> <strong>sustainable</strong> development is<br />
now commencing in Freshwater Fisheries Research Center (FFRC), Chinese Academy<br />
<strong>of</strong> Fishery Sciences (CAFS), Wuxi, China. On behalf <strong>of</strong> Freshwater Fisheries Research<br />
Center, I’d like to extend a warm welcome to all the experts from FAO <strong>and</strong> other<br />
different countries.<br />
Freshwater Fisheries Research Center, Chinese Academy <strong>of</strong> Fishery Sciences is<br />
one <strong>of</strong> the major comprehensive fisheries institutions <strong>for</strong> research, education/training,<br />
<strong>and</strong> in<strong>for</strong>mation exchange. In the research activities, FFRC has the main functions<br />
oriented toward the basic <strong>and</strong> applied researches. The key research emphases are<br />
on fishery breeding biology <strong>and</strong> genetics, conservation <strong>of</strong> biodiversity <strong>and</strong> fishery<br />
stock resources, monitoring <strong>and</strong> protection <strong>of</strong> fishery environment, evaluation <strong>and</strong><br />
management <strong>of</strong> fishery resources, fish disease prevention <strong>and</strong> control, carrying capacity<br />
<strong>and</strong> healthy aquaculture, fish nutrition <strong>and</strong> in<strong>for</strong>mation exchanges etc.<br />
Asian-Pacific Regional Research <strong>and</strong> Training Center <strong>for</strong> Integrated Fish Farming<br />
as an important component <strong>of</strong> Freshwater Fisheries Research Center, has continuously<br />
undertaken China-TCDC training courses <strong>for</strong> 25 years. Over 30 courses have been<br />
successfully conducted <strong>for</strong> more than 1000 participants from 80 countries, besides<br />
there have been also a great number <strong>of</strong> times <strong>of</strong> international academic workshops,<br />
visiting scholar exchanges <strong>and</strong> research collaborations.<br />
Freshwater Fisheries Research Center is pleased to carry out collaboration in any<br />
<strong>for</strong>ms on fishery research, technical training, <strong>and</strong> human resource development with all<br />
the specialists present at the workshop <strong>and</strong> assures the workshops <strong>of</strong> logistic services<br />
Finally, I wish in advance the workshop a successful completion <strong>and</strong> good health <strong>of</strong><br />
all the guests present at the workshop<br />
Thank you
502<br />
<strong>Study</strong> <strong>and</strong> <strong>analysis</strong> <strong>of</strong> <strong>feeds</strong> <strong>and</strong> <strong>fertilizers</strong> <strong>for</strong> <strong>sustainable</strong> aquaculture development<br />
ANNEX II<br />
OPENING REMARK OF MR LI JIEREN, VICE PRESIDENT OF CHINESE ACADEMY<br />
FISHERIES SCIENCE<br />
Good Morning, Ladies <strong>and</strong> Gentlemen,<br />
On behalf <strong>of</strong> Chinese Academic <strong>of</strong> Fisheries Science (CAFS), I would like to welcome<br />
all the colleagues, friends <strong>and</strong> participants, including international <strong>and</strong> national<br />
aquaculture feed <strong>and</strong> fertilizer experts, to attend this very important workshop in Wuxi<br />
<strong>and</strong> discuss the aquaculture related issues.<br />
China is an important aquaculture country with a long aquaculture development<br />
history. Aquaculture has been documented more than 2000 year ago in China. At<br />
present, the total fisheries production reached 51 million, which about 67 percent come<br />
from aquaculture production. Aquaculture has become a very important component in<br />
the animal protein food production.<br />
About 60 percent <strong>of</strong> natural fisheries resource has been damaged worldwide, it<br />
is declining in general <strong>and</strong> hardly to meet the dem<strong>and</strong> <strong>for</strong> aquatic products through<br />
capture fisheries. Aquaculture contributes significantly to food availability, household<br />
food security, income generation, trade, <strong>and</strong> improved living st<strong>and</strong>ards in many<br />
developing countries, including China. The development <strong>of</strong> aquaculture has become<br />
more <strong>and</strong> more important in obtaining aquatic food <strong>for</strong> the people. Fisheries are<br />
transferring from capture fisheries to aquaculture, it just like the transferring agriculture<br />
from “collecting” to “farming” <strong>and</strong> from “hunting” to “animal husb<strong>and</strong>ry”. The<br />
development <strong>of</strong> aquaculture not only made its possible <strong>for</strong> increase <strong>of</strong> total fisheries<br />
production, but provides a complete new concept <strong>and</strong> efficient measure to reasonable<br />
utilization <strong>of</strong> water resources considering “expended ecosystem”. The utilization <strong>of</strong><br />
capture fishery resources is a process <strong>for</strong> use <strong>of</strong> solar energy by phytoplankton, in<br />
turn used by aquatic species in low-food chain to high food chain. The relationship<br />
<strong>for</strong> energy conversion <strong>and</strong> utilization among the species depends completely on a<br />
natural process. In aquaculture, feed technologies <strong>and</strong> various technical measures can<br />
be applied in the process <strong>of</strong> energy <strong>and</strong> food conversion to substantially improve the<br />
conversion ratio <strong>and</strong> food utilization so that the source <strong>of</strong> l<strong>and</strong>-based plant feed can<br />
be introduced to the production <strong>of</strong> aquatic products. There<strong>for</strong>e, the research <strong>and</strong><br />
application on aquaculture technologies which consume less cost <strong>and</strong> energy <strong>and</strong><br />
maximize aquaculture production will be required <strong>for</strong> seek <strong>of</strong> <strong>sustainable</strong> aquaculture<br />
development.<br />
Aquaculture <strong>feeds</strong> <strong>and</strong> <strong>fertilizers</strong> as indispensable parts have played a very important<br />
role in the country’s fisheries <strong>and</strong> aquaculture production <strong>and</strong> development. In China,<br />
Modern intensive aquaculture based on the aquaculture feed <strong>and</strong> nutrition has been<br />
practiced <strong>for</strong> about 20 years. But, China’s aquaculture production depends largely on<br />
traditional aquaculture. Despite the country’s reputation as a producer <strong>of</strong> large quantity<br />
aquaculture products <strong>and</strong> advanced traditional aquaculture technology, the aquaculture<br />
<strong>and</strong> its feed sector are faced with numerous problems hampering sector growth <strong>and</strong><br />
development. These constraints include: (i) low-cost traditional pond aquaculture still<br />
remains as semi-intensive <strong>and</strong> poly-culture practice due to the low price <strong>of</strong> common<br />
food fish <strong>and</strong> slow economic development in rural areas; (ii) the application <strong>of</strong> a large<br />
quantity <strong>of</strong> single <strong>and</strong> family <strong>for</strong>mulated feed still dominates aquaculture production;<br />
(iii) the aquaculture sector <strong>and</strong> its production are <strong>of</strong>ten developed <strong>and</strong> increased at the<br />
expenses <strong>of</strong> decrease <strong>of</strong> arable l<strong>and</strong> areas; <strong>and</strong> (iv) under a highly-intensive aquaculture<br />
condition, the application <strong>of</strong> high-nutrient <strong>feeds</strong> <strong>and</strong> over-feeding practice <strong>of</strong>ten<br />
cause eutrophication <strong>and</strong> fish disease breakout in waterbody, <strong>and</strong> in turn result in<br />
environmental pollution <strong>and</strong> other problems due to lack <strong>of</strong> experience <strong>for</strong> special highvalue<br />
aquatic species <strong>and</strong> inadequate studies on nutrition physiology <strong>and</strong> metabolism<br />
<strong>of</strong> target species.
Report <strong>of</strong> the FAO expert workshop on “Use <strong>of</strong> <strong>feeds</strong> <strong>and</strong> <strong>fertilizers</strong> <strong>for</strong> <strong>sustainable</strong> aquaculture development” 503<br />
A. The achievements made in animal feed <strong>and</strong> nutrition research in China<br />
Let me to brief you what work have been done <strong>and</strong> achievements made in animal feed<br />
<strong>and</strong> nutrition research in China. China has commenced the studies <strong>and</strong> research on<br />
aquaculture animal feed <strong>and</strong> nutrition since 1980s. The major researches conducted<br />
include: nutrition requirement <strong>of</strong> fish <strong>and</strong> shrimp <strong>and</strong> feed <strong>for</strong>mulation, the quality<br />
control <strong>and</strong> inspection <strong>of</strong> aquaculture animal <strong>feeds</strong>, alternative source <strong>of</strong> plant <strong>feeds</strong>,<br />
alternative biological feed <strong>and</strong> its culture techniques <strong>for</strong> aquaculture nursery, <strong>and</strong><br />
biological feed <strong>and</strong> supplementary feed <strong>for</strong> polyculture system. These developed<br />
technologies are being widely applied in aquaculture production. These major<br />
achievements also include:<br />
i) Obtained the nutrition requirements <strong>of</strong> major cultured-animal species at their<br />
different growing stages <strong>and</strong> the key nutrition parameters <strong>of</strong> supplementary <strong>feeds</strong><br />
to provide scientific basis <strong>for</strong> the <strong>for</strong>mulation <strong>of</strong> applied <strong>feeds</strong>;<br />
ii) Developed technical st<strong>and</strong>ard <strong>and</strong> criteria <strong>for</strong> the quality control <strong>and</strong> inspection <strong>of</strong><br />
aquaculture <strong>feeds</strong> <strong>and</strong> feed biological comprehensive assessment <strong>and</strong> established a<br />
number <strong>of</strong> feed inspection agencies at national <strong>and</strong> provincial levels to st<strong>and</strong>ardize<br />
the feed production;<br />
iii) Produced several kinds <strong>of</strong> fish feed additive <strong>and</strong> pre-mixed <strong>feeds</strong> to expend the<br />
feed sources <strong>and</strong> improve feed quality;<br />
iv) Produced various sinking <strong>and</strong> floating artificial <strong>feeds</strong> <strong>and</strong> commercial <strong>feeds</strong> <strong>for</strong><br />
well-known <strong>and</strong> special high value cultured-species;<br />
v) Cleared the nutrition value <strong>of</strong> sources <strong>of</strong> aquaculture feed <strong>and</strong> conventional<br />
aquaculture <strong>feeds</strong> <strong>and</strong> tested the energy value, nutriment <strong>and</strong> digestibility <strong>of</strong><br />
various <strong>feeds</strong> to provide scientific basis <strong>for</strong> the development <strong>of</strong> high-efficient <strong>and</strong><br />
artificial supplementary <strong>feeds</strong>; <strong>and</strong><br />
vi) Commenced the introduction <strong>and</strong> conversion <strong>of</strong> international research outcomes<br />
<strong>and</strong> new technologies on the nutrition <strong>and</strong> <strong>feeds</strong> <strong>for</strong> commercial production <strong>of</strong><br />
high-value marine animal.<br />
B. Priority Areas <strong>for</strong> China’s Aquaculture Feed <strong>and</strong> Nutrition Research<br />
Future priority research areas on aquaculture feed <strong>and</strong> nutrition in China include:<br />
i) to further conduct <strong>of</strong> aquaculture nutrition physiology <strong>and</strong> metabolism, specifically,<br />
the functions <strong>of</strong> micro-nutriment to provide reliable scientific basis <strong>for</strong> modifying<br />
nutrition requirement, <strong>for</strong>mulating low-cost <strong>and</strong> high-efficient applied <strong>feeds</strong> <strong>and</strong><br />
improving feed conversion ratio;<br />
ii) to strengthen research on the relationships between nutrition <strong>and</strong> immunity,<br />
incretion, environment, aquaculture product <strong>and</strong> its value;<br />
iii) to further conduct the research on the reduction <strong>of</strong> release <strong>of</strong> phosphorous to<br />
aquaculture <strong>and</strong> water system <strong>for</strong> environment protection <strong>and</strong> feeding strategy;<br />
iv) to conduct research on <strong>for</strong>mulation technology <strong>of</strong> alternative artificial microdot<br />
supplementary <strong>feeds</strong> to replace live biological <strong>feeds</strong> <strong>and</strong> utilization <strong>of</strong> sources <strong>of</strong><br />
plant feed; <strong>and</strong><br />
v) <strong>for</strong> a long term, to conduct research on the technology to produce fish as feed.<br />
As we all aware, aquaculture <strong>feeds</strong> <strong>and</strong> <strong>fertilizers</strong> play a very important role in the<br />
aquaculture sector. I fully believe that workshop will generate a number <strong>of</strong> meaningful<br />
<strong>and</strong> operational recommendations, including policy <strong>and</strong> institutional recommendations<br />
on aquaculture feed <strong>and</strong> fertilizer research during our discussions. These outcomes <strong>of</strong><br />
the workshop will eventually accelerate the development <strong>of</strong> world aquaculture feed<br />
<strong>and</strong> fertilizer sector <strong>and</strong> promote the <strong>sustainable</strong> aquaculture development.<br />
As a national research institution, CAFS has its responsibility <strong>for</strong> important basic<br />
<strong>and</strong> applied research <strong>and</strong> new- <strong>and</strong> high- technology developments <strong>for</strong> fisheries <strong>and</strong><br />
aquaculture sector. It also plays a vital role in solving key <strong>and</strong> important sector <strong>and</strong><br />
development issues within fisheries sector, <strong>and</strong> conducting national <strong>and</strong> international
504<br />
<strong>Study</strong> <strong>and</strong> <strong>analysis</strong> <strong>of</strong> <strong>feeds</strong> <strong>and</strong> <strong>fertilizers</strong> <strong>for</strong> <strong>sustainable</strong> aquaculture development<br />
fisheries <strong>and</strong> technology exchange, communications <strong>and</strong> collaboration programs. At<br />
present, CAFS has 9 research centers <strong>and</strong> 4 multiplication <strong>and</strong> experimental stations.<br />
There<strong>for</strong>e, take the opportunity, I would like to invite you <strong>and</strong> welcome all <strong>of</strong> you,<br />
international <strong>and</strong> national experts to make our best ef<strong>for</strong>t to strengthen our research<br />
collaboration in aquaculture feed <strong>and</strong> fertilizer research <strong>and</strong> development to achieve<br />
our common goal <strong>and</strong> contribute to world <strong>sustainable</strong> aquaculture development <strong>and</strong><br />
poverty reduction. Finally, I would like to wish to have a fruitful <strong>and</strong> fully successful<br />
workshop! Thanks
Report <strong>of</strong> the FAO expert workshop on “Use <strong>of</strong> <strong>feeds</strong> <strong>and</strong> <strong>fertilizers</strong> <strong>for</strong> <strong>sustainable</strong> aquaculture development” 505<br />
ANNEX III<br />
FAO EXPERT WORKSHOP ON “USE OF FEEDS AND FERTILIZERS FOR<br />
SUSTAINABLE AQUACULTURE DEVELOPMENT”<br />
Wuxi, Jiangsu Province, P.R. China, 18–21 March 2006<br />
Agenda<br />
time ACTIVITY<br />
17th March<br />
Arrival <strong>of</strong> Participants in Wuxi<br />
18th March - Workshop day 1<br />
08.00 - 08.30 Registration<br />
Session I: Opening <strong>and</strong> Welcome Remarks<br />
08.30 - 09.00 • Master <strong>of</strong> ceremony – Yuan Xinhua<br />
• Election <strong>of</strong> Chair<br />
• Welcome address – Director, Freshwater Fisheries Research Centre<br />
• Opening remarks – Vice President, Chinese Academy <strong>of</strong> Science<br />
• Introduction <strong>of</strong> the participants<br />
• Group photograph<br />
09.00 - 09.10 Introduction <strong>and</strong> Objectives <strong>of</strong> the Workshop – Dr Mohammad R. Hasan<br />
Session II: Presentation <strong>of</strong> Country Reviews: <strong>Study</strong> <strong>and</strong> <strong>analysis</strong> <strong>of</strong> <strong>feeds</strong> <strong>and</strong> <strong>fertilizers</strong> <strong>for</strong> <strong>sustainable</strong><br />
aquaculture development<br />
Co-chair: Dr Sena De Silva - Rapporteur: Dr Melba Reantaso<br />
09.10 - 10.10 Selected country reviews (20 minutes <strong>for</strong> each presentation)<br />
• China: Mr Miao Weimin<br />
• India: Dr Syed Ahamad Ali<br />
• Philippines: Dr Neila S. Sumagaysay-Chavoso<br />
10.10 -10.30 C<strong>of</strong>fee/Tea Break<br />
10.30 -11.50 Selected country reviews (20 minutes <strong>for</strong> each presentation)<br />
• Thail<strong>and</strong>: Dr Supis Thongrod<br />
• Viet Nam: Dr Le Thanh Hung<br />
• Egypt: Dr Abdel-Fattah M. El-Sayed<br />
• Ug<strong>and</strong>a: Dr Justus Rutaisire<br />
11.50 -12.30 General discussion on country reviews<br />
12.30 -14.00 Lunch<br />
Session III: Review <strong>of</strong> Development <strong>of</strong> Aquafeed Industry<br />
Co-chair: Dr. Albert Tacon Rapporteur: Dr. Melba Reantaso<br />
14.00 -15.00 • China: Ms Liang Mengqing<br />
• India: Dr Syed Ahamad Ali<br />
• Egypt: Dr Abdel-Fattah M. El-Sayed<br />
15.00 - 15.20 General Discussion on review <strong>of</strong> development <strong>of</strong> aquafeed industry<br />
15.20 - 15.40 C<strong>of</strong>fee/Tea Break<br />
Session IV: Presentation <strong>of</strong> Regional Synthesis<br />
15.40 - 16.10 Feeds <strong>and</strong> Sustainability <strong>of</strong> Asian Aquaculture: Dr Sena De Silva<br />
16.10 - 16.40 Developments in sub-Saharan African aquaculture: <strong>feeds</strong> <strong>and</strong> <strong>fertilizers</strong>:<br />
Dr Thomas Hecht<br />
16.40 - 17.10 Aquaculture <strong>feeds</strong> in Latin America: a look at key elements at the macro (the<br />
industry) <strong>and</strong> micro (farm practices) levels: Dr Alej<strong>and</strong>ro Flores Nava<br />
17.10 - 18.00 General Discussion<br />
18.00 – 20.30 Depart to Wuxi town <strong>for</strong> reception dinner
506<br />
19 th March - Workshop day 2<br />
<strong>Study</strong> <strong>and</strong> <strong>analysis</strong> <strong>of</strong> <strong>feeds</strong> <strong>and</strong> <strong>fertilizers</strong> <strong>for</strong> <strong>sustainable</strong> aquaculture development<br />
Session V: Presentation <strong>of</strong> Case <strong>Study</strong> on Economics <strong>of</strong> Aquaculture Feeding Systems<br />
Co-chair: Dr Alej<strong>and</strong>ro Flores-Nava - Rapporteur: Dr Thomas Hecht<br />
08.30 - 08.50 Case study on the use <strong>of</strong> farm-made feed versus commercially <strong>for</strong>mulated pellets<br />
<strong>for</strong> Pangasiid catfish in the Mekong delta, Viet Nam: Dr Le Thanh Hung<br />
08.50 - 09.10 The economics <strong>of</strong> small-scale aquaculture feeding systems in China: Mr Yuan<br />
Xinhua<br />
09.10 - 09.40 An economic <strong>analysis</strong> <strong>of</strong> aquaculture feeding systems: a synthesis <strong>of</strong> three Asian<br />
countries: Dr Walfredo Raquel Rola<br />
09.40 -10.10 Discussion<br />
10.10-10.30 C<strong>of</strong>fee/Tea Break<br />
Session VI: Invited Presentation <strong>and</strong> Global Synthesis<br />
10.30 -11.00 Invited presentation: Reducing waste production <strong>of</strong> aquaculture by improvement<br />
<strong>of</strong> feed <strong>for</strong>mulation <strong>and</strong> feeding regime- Dr Shouqi Xie<br />
11.00 -11.30 Feeds <strong>and</strong> nutrients <strong>for</strong> <strong>sustainable</strong> aquaculture development within developing<br />
countries: a global synthesis: Dr Albert G.J. Tacon<br />
11.30 -12.00 General Discussion<br />
Session VII: Working Group Discussions<br />
12.00 -12.30 Mechanisms <strong>and</strong> guidelines <strong>for</strong> Working Group (WG) Discussions: Dr Simon Funge-<br />
Smith<br />
12.30-14.00 Lunch<br />
14.00 -18.00 Working Groups break up <strong>for</strong> discussions<br />
20th March - Workshop day 3<br />
Session VII (cont.): Working Group discussions<br />
Co-chair: Dr Mohammad R. Hasan - Rapporteur: Dr Simon Funge-Smith<br />
09.00 – 10.30 Working Groups continue <strong>and</strong> preparation <strong>for</strong> plenary presentation<br />
10.30 -10.45 C<strong>of</strong>fee/Tea Break<br />
10.45 -11.15 Working Group I – presentation to plenary<br />
11.15 -12.15 Working Group II - presentation to plenary<br />
12.15 – 12.30 Short plenary discussion to prepare <strong>for</strong> afternoon session<br />
12.30 -14.00 Lunch<br />
14.00-15.00 General Discussion Working Group Presentations<br />
Identification <strong>of</strong> key points <strong>for</strong> action<br />
15.00 -16.00 Working Group Chairpersons, Rapporteurs <strong>and</strong> Technical Secretariat to finalize<br />
Workshop Recommendations<br />
Session VIII: Presentation <strong>of</strong> Final Workshop Recommendations in Plenary<br />
Rapporteur: Dr Simon Funge-Smith<br />
16.00 -17.30 Short presentation <strong>of</strong> summary recommendations <strong>of</strong> the workshop<br />
Discussion<br />
Closing<br />
18.00 – 20.30 Depart to Wuxi <strong>for</strong> closing dinner<br />
21st March - Workshop day 4<br />
08.30 -18.30 All-day field visit to feed machinery manufacturing plant, feed mill <strong>and</strong> fish farm<br />
22 nd March<br />
Participants depart Wuxi
Report <strong>of</strong> the FAO expert workshop on “Use <strong>of</strong> <strong>feeds</strong> <strong>and</strong> <strong>fertilizers</strong> <strong>for</strong> <strong>sustainable</strong> aquaculture development” 507<br />
ANNEX IV<br />
PROCEDURES FOR WORKING GROUP SESSIONS<br />
For the working sessions, workshop participants were divided into two groups. Each<br />
group examined one or more thematic area(s) assigned to them, <strong>and</strong> were requested to<br />
identify critical issues <strong>and</strong> prepare specific recommendations <strong>and</strong> follow up actions <strong>and</strong><br />
to present these in the final plenary session. A number <strong>of</strong> background documents were<br />
circulated among the participants prior to <strong>and</strong> during the workshop.<br />
Thematic areas assigned to the Working Groups<br />
Working Group A: Industrial aquafeed- development <strong>of</strong> the industry, impact<br />
<strong>of</strong> availability <strong>of</strong> protein sources, alternatives <strong>and</strong> their feasibility<br />
Working Group B: Farm-made aqua<strong>feeds</strong> (including manures <strong>and</strong> <strong>fertilizers</strong>)<br />
-opportunities <strong>and</strong> constraints, availability, feasibility <strong>and</strong> management<br />
Recognizing that aquaculture practices <strong>and</strong> farming systems vary widely between <strong>and</strong><br />
within regions (Asia, Africa <strong>and</strong> Latin America) working group participants were<br />
requested to consider the following general issues during their discussions:<br />
• limited l<strong>and</strong> area will prohibit further horizontal expansion <strong>of</strong> aquaculture in Asia;<br />
• resources (feed <strong>and</strong> <strong>fertilizers</strong>) are limited <strong>and</strong> competition with other resource<br />
users (poultry, livestock <strong>and</strong> crop) will increase;<br />
• bulk <strong>of</strong> aquaculture production in Asia <strong>and</strong> over 80 percent <strong>of</strong> fish produced<br />
in Africa depend on farm-made aqua<strong>feeds</strong> <strong>and</strong> this is likely to continue in the<br />
<strong>for</strong>eseeable future;<br />
• in Asia, market price <strong>and</strong> dem<strong>and</strong> <strong>of</strong>ten makes it uneconomic to use industrial <strong>feeds</strong><br />
while in Africa it is constrained by economies <strong>of</strong> scale <strong>and</strong> the lack <strong>of</strong> critical mass; <strong>and</strong><br />
• farm-made <strong>feeds</strong> are rarely used in Latin America <strong>and</strong> greater use <strong>of</strong> farm-made<br />
<strong>feeds</strong> may provide opportunities <strong>for</strong> small-scale farmers.<br />
The working groups were specifically also requested to consider the<br />
following issues:<br />
Working Group A: Development <strong>of</strong> the aquafeed industry<br />
• Dependence <strong>of</strong> industrial aqua<strong>feeds</strong> on key feed ingredients (fishmeal, fish oil, SBM)<br />
• Impacts <strong>of</strong> availability <strong>of</strong> key feed ingredients on industrial feed based aquaculture<br />
• Realistic alternatives <strong>of</strong> fishmeal <strong>and</strong> fish oil (except SBM) <strong>and</strong> the best approach<br />
to translate the results into practise<br />
• Quality assurance <strong>of</strong> locally produced industrial feed<br />
Working Group B: Farm-made aqua<strong>feeds</strong><br />
• Improving feed quality<br />
• Economic <strong>and</strong> environmental issues related to the use <strong>of</strong> farm-made aquafeed vs.<br />
industrially manufactured <strong>feeds</strong>.<br />
• Improvement in feeding <strong>and</strong> feed management practices<br />
• Development <strong>of</strong> location/region-specific appropriate farm-made feed <strong>for</strong>mulations<br />
through focused research.<br />
• Extension <strong>and</strong> support services to small (farm-made)- to medium-scale aquafeed<br />
producers to improve their production processes <strong>and</strong> technologies<br />
After the general discussion <strong>of</strong> the working group presentations in the plenary the<br />
WG Chairpersons, Rapporteurs <strong>and</strong> the technical secretariat finalized the workshop<br />
recommendations that were approved during the final plenary session.
508<br />
ANNEX V<br />
LIST OF PARTICIPANTS<br />
<strong>Study</strong> <strong>and</strong> <strong>analysis</strong> <strong>of</strong> <strong>feeds</strong> <strong>and</strong> <strong>fertilizers</strong> <strong>for</strong> <strong>sustainable</strong> aquaculture development<br />
AUSTRALIA<br />
Dr Sena S. De Silva, Pr<strong>of</strong>essor, School <strong>of</strong> Ecology<br />
<strong>and</strong> Environment, Faculty <strong>of</strong> Science & Technology,<br />
Deakin University Warrnambool, Victoria, Australia.<br />
Tel. +61 (3) 556 33527.<br />
E-mail: sena@deakin.edu.au<br />
CHINA<br />
Miao Weimin, Deputy Director, Freshwater Fisheries<br />
Research Centre, Qitang North No. 1, Wuxi, P.R.<br />
China, 21408.<br />
Tel. (86) 510-5878390. Fax: (86)510-5555112/<br />
(86)510-5553304.<br />
E-mail: miaowm@ffrc.cn, wmmiao@public1.wx.js.cn<br />
Yuan Xinhua, Associate Pr<strong>of</strong>essor, Freshwater<br />
Fisheries Research Centre, #9. Shanshui Xi Rd.,<br />
Wuxi, Jiangsu Province, P.R. China 214081.<br />
Tel. +86-510-5555796/2281121; Fax: +86-510-5555796.<br />
E-mail: yuanxh@ffrc.cn<br />
Ms. Liang Mengqing, Yellow Sea Fisheries<br />
Research Institute PO Box: 266071,106 Nanjing<br />
Road,Qingdao, P.R. China.<br />
E-mail: liangmq@ysfri.ac.cn<br />
Dr Shouqi Xie, Institute <strong>of</strong> Hydrobiology,<br />
The Chinese Academy <strong>of</strong> Sciences, Wuhan, Hubei,<br />
430072 P.R. China,<br />
Tel/Fax: +86 27 68780667.<br />
E-mail: sqxie@ihb.ac.cn, sqxie@public.wh.hb.cn<br />
EGYPT<br />
Dr Abdel-Fattah M. El-Sayed, Pr<strong>of</strong>essor,<br />
Oceanography Department, Faculty <strong>of</strong> Science,<br />
Alex<strong>and</strong>ria University, Alex<strong>and</strong>ria, Egypt.<br />
Tel. 00203-4273858; 002012/1699648,<br />
E-mail: a_elsayed50@yahoo.com<br />
INDIA<br />
Dr Syed Ahamad Ali, Principal Scientist & Head,<br />
Nutrition Genetics <strong>and</strong> Biotechnology Division,<br />
Central Institute <strong>of</strong> Brackishwater Aquaculture<br />
(CIBA), 75, Santhome High Road, RA Puram,<br />
Chennai 600 028, India,<br />
Tel. 091-44-24618817, 24616948, 24610565,<br />
Fax: 091-44-2461031.<br />
E-mail: Ali_madras@yahoo.com,<br />
ciba@tn.nic.in<br />
MEXICO<br />
Dr Alej<strong>and</strong>ro Flores Nava, Rector, Universidad<br />
Marista de Merida, Calle 14 No. 128 x 5 y 9 Fracc.<br />
Montecristi, Mérida, Yucatan, 97000 Mexico,<br />
Tel. 52-999-9412026, Fax: 52-999-9410307.<br />
E-mail: aflores@marista.edu.mx<br />
PHILIPPINES<br />
Dr Neila S. Sumagaysay-Chavoso, University <strong>of</strong><br />
the Philippines Aquaculture Society, Gabinete<br />
Residence, Miramar Subdivision, Jaro 5000, Iloilo<br />
City, The Philippines.<br />
Tel. No. (063) 335096700.<br />
E-mail: neila_sc@yahoo.com.sg<br />
Dr Walfredo Raquel Rola, Department <strong>of</strong><br />
Community <strong>and</strong> Environmental Resource Planning,<br />
College <strong>of</strong> Human Ecology, UPLB, Los Banos,<br />
Laguna, Philippines 4031.<br />
Tel. +63-049-536-1622.<br />
E-mail: wallyrola@yahoo.com<br />
SOUTH AFRICA<br />
Dr Thomas Hecht, Pr<strong>of</strong>essor Emeritus, Dept.<br />
Ichthyology & Fisheries Science, Rhodes University,<br />
Grahamstown, South Africa<br />
Tel. +27 (0) 46 6038415 (W) +27 (0) 46 6751010<br />
(Home).<br />
E-mail: T.Hecht@ru.ac.za<br />
THAILAND<br />
Dr Supis Thongrod, Director, Coastal Aquatic<br />
Feed Research Institute, Department <strong>of</strong> Fisheries,<br />
41/14 Moo 9, Bangphra District, Sriracha, Chonburi<br />
Province 20110, Thail<strong>and</strong>.<br />
Tel. 66-38-312532, Fax: 66-38-312532.<br />
E-mail: supist@fisheries.go.th,<br />
supisthongrod@yahoo.com<br />
UGANDA<br />
Dr Justus Rutaisire, Senior Lecturer, Makerere<br />
University, Department <strong>of</strong> Wildlife <strong>and</strong> Animal<br />
Resources Management, Faculty <strong>of</strong> Veterinary<br />
Medicine, P.O. Box 7062, Kampala, Ug<strong>and</strong>a.<br />
Tel. +25677501227/+25677634077,<br />
Fax +25641533402.<br />
E-mail: jruta@mulib.mak.ac.ug;<br />
jusruta@yahoo.com<br />
UNITED STATES OF AMERICA<br />
Dr Albert G.J. Tacon, Aquatic Farms Ltd, 49-139<br />
Kamehameha Hwy., Kaneohe, Hawaii 96744<br />
United States <strong>of</strong> America.<br />
Tel. +1-808-239 2929, Fax: +1-808-235 0177.<br />
E-mail: atacon@hawaii.rr.com;<br />
AGJTACON@aol.com
Report <strong>of</strong> the FAO expert workshop on “Use <strong>of</strong> <strong>feeds</strong> <strong>and</strong> <strong>fertilizers</strong> <strong>for</strong> <strong>sustainable</strong> aquaculture development” 509<br />
VIET NAM<br />
Dr Le Thanh Hung, Vice Dean, Faculty <strong>of</strong> Fisheries,<br />
Nong Lam University, Linh Trung Ward, Thu Duc<br />
District, HCMC, Viet Nam,<br />
Tel. 84-8-7220733/ 84-8-8657570.<br />
E-mail: lthungts@hcm.vnn.vn<br />
FAO REGIONAL OFFICE FOR ASIA AND<br />
THE PACIFIC (FAORAP)<br />
Dr Simon Funge-Smith, Aquaculture Officer, FAO<br />
Regional Office <strong>for</strong> Asia <strong>and</strong> the Pacific, 39 Phra<br />
Athit Road, Bangkok 10200, Thail<strong>and</strong>.<br />
Tel. +662-6974149, Fax:+662-6974445.<br />
E-mail: Simon.Funge-smith@fao.org<br />
FISHERIES DEPARTMENT, FAO headquarters<br />
Dr Melba Reantaso, Fishery Resources Officer<br />
(Aquaculture), Aquaculture Management <strong>and</strong><br />
Conservation Service, Fisheries <strong>and</strong> Aquaculture<br />
Department, Food <strong>and</strong> Agriculture Organization <strong>of</strong><br />
the United Nations, Viale delle Terme di Caracalla,<br />
00153 Rome, Italy,<br />
Tel. (39) 06 570 54843, Fax: (39) 06 570 53020.<br />
E-mail: Melba.Reantaso@fao.org<br />
Dr Mohammad R. Hasan, Fishery Resources Officer<br />
(Aquaculture), Aquaculture Management <strong>and</strong><br />
Conservation Service, Fisheries <strong>and</strong> Aquaculture<br />
Department, Food <strong>and</strong> Agriculture Organization <strong>of</strong><br />
the United Nations, Viale delle Terme di Caracalla,<br />
00153 Rome, Italy,<br />
Tel. (39) 06 570 56442, Fax: (39) 06 570 53020.<br />
E-mail: Mohammad.Hasan@fao.org<br />
NETWORK OF AQUACULTURE CENTRES IN<br />
ASIA-PACIFIC (NACA)<br />
Zhuo Xiaowei, Programme & Operation Manager,<br />
Network <strong>of</strong> Aquaculture Centres in Asia-Pacific,<br />
P.O. Box 1040, Kasetsart Post Office, Bangkok<br />
10903, Thail<strong>and</strong><br />
Tel. +66-(0)2-5611728 ext 111; Mobile: +66-(0)9-<br />
8153750, Fax: +66-(0)2-5611727.<br />
E-mail: xiaowei.zhou@enaca.org<br />
NON-GOVERNMENTAL AND PRIVATE<br />
ORGANIZATIONS (NGOs)<br />
Dr Chawalit Orachunwong, Chareon Pokph<strong>and</strong><br />
Foods Co. Ltd., 69/1, M4, Tambon Klongjig, Bang-<br />
Pa-In Ayudhaya Province, Thail<strong>and</strong> 13160.<br />
E-mail: fishtech@loxinfo.co.th<br />
Dr Michael Cremer, Technical Director-Aquaculture,<br />
U.S. Soybean Export Council, 9705 Eagle Creek<br />
Road, Leavenworth, WA 98826, United States <strong>of</strong><br />
America, Tel. 509-548-5863, ; c/o American Soybean<br />
Association - International Marketing, 1802 SITC,<br />
No. 2201 Yanan Xi Lu, Shanghai, P.R. China 200336,<br />
Tel. 86-21-621.<br />
E-mail: mycremer@earthlink.net
510<br />
ANNEX VI<br />
TECHNICAL SECRETARIAT<br />
<strong>Study</strong> <strong>and</strong> <strong>analysis</strong> <strong>of</strong> <strong>feeds</strong> <strong>and</strong> <strong>fertilizers</strong> <strong>for</strong> <strong>sustainable</strong> aquaculture development<br />
A technical secretariat comprising <strong>of</strong> Dr Mohammad R. Hasan (Aquaculture<br />
Management <strong>and</strong> Conservation Service, FAO Fisheries <strong>and</strong> Aquaculture<br />
Department), Dr Simon Funge-Smith (FAO Regional Office <strong>for</strong> Asia <strong>and</strong> the<br />
Pacific) <strong>and</strong> Dr Melba B. Reantaso (Aquaculture Management <strong>and</strong> Conservation<br />
Service, FAO Fisheries <strong>and</strong> Aquaculture Department) was responsible <strong>for</strong> technical<br />
coordination.
This technical paper provides a comprehensive overview <strong>of</strong> feed <strong>and</strong> fertilizer use<br />
<strong>for</strong> <strong>sustainable</strong> aquaculture development in developing countries. It comprises a series<br />
<strong>of</strong> review papers, including eight country reviews from Asia, six country reviews from<br />
Africa, one case study report from Asia, three regional reviews (Asia, Latin America <strong>and</strong><br />
sub-Saharan Africa), a global synthesis as well as the final report <strong>of</strong> the FAO Expert<br />
Workshop on Use <strong>of</strong> Feed <strong>and</strong> Fertilizer <strong>for</strong> Sustainable Aquaculture Development, held in<br />
Wuxi, Jiangsu Province, China, 18–21 March 2006. The country reviews provide an overview<br />
<strong>of</strong> the current status <strong>of</strong> aquaculture, a synthesis <strong>of</strong> the availability, accessibility <strong>and</strong> use <strong>of</strong><br />
feed <strong>and</strong> fertilizer resources in relation to the diversity <strong>of</strong> farming systems <strong>and</strong> practices<br />
<strong>and</strong> an <strong>analysis</strong> <strong>of</strong> the nutritional, economic <strong>and</strong> social constraints <strong>of</strong> using these inputs.<br />
The regional reviews provide a synthesis <strong>of</strong> the country reviews by considering production<br />
trends <strong>and</strong> feed <strong>and</strong> fertilizer use from a wider geographic perspective <strong>and</strong> also analyse<br />
the projected expansion <strong>of</strong> the aquaculture sector in relation to the future availability <strong>of</strong><br />
input commodities. The global synthesis provides a general overview <strong>and</strong> summarizes the<br />
future challenges facing the sector with respect to the use <strong>of</strong> <strong>feeds</strong> <strong>and</strong> <strong>fertilizers</strong>.<br />
ISBN 978-92-5-105862-6 ISSN 0429-9345<br />
9 7 8 9 2 5 1 0 5 8 6 2 6<br />
TC/M/A1444E/1/11.07/1700