

CALTRANS FACT BOOKLET
2016_CFB
2016_CFB

Create successful ePaper yourself
Turn your PDF publications into a flip-book with our unique Google optimized e-Paper software.
California Department of Transportation<br />
<strong>CALTRANS</strong><br />
<strong>FACT</strong> <strong>BOOKLET</strong><br />
May 2016
Caltrans Mission, Vision,<br />
Goals and Values<br />
Our Mission:<br />
Provide a safe, sustainable, integrated and efficient transportation<br />
system to enhance California’s economy and livability<br />
Our Vision:<br />
A performance-driven, transparent and accountable organization<br />
that values its people, resources and partners, and meets new<br />
challenges through leadership, innovation and teamwork<br />
Our Goals:<br />
Safety and Health - Stewardship and Efficiency -<br />
Sustainability, Livability and Economy - System Performance -<br />
Organizational Excellence<br />
Our Values:<br />
Integrity - Commitment - Teamwork - Innovation<br />
Table of Contents<br />
u Planning and Modal Programs ............................................ 2-9<br />
u Sustainability-<br />
People, Planet, and Prosperity................................................... 10-21<br />
u Financial Information ............................................................ 22-33<br />
u Maintenance, Operations, and Project Delivery ... 34-43<br />
u Appendix ........................................................................................ 44-49<br />
Booklet Frequently Asked Questions ............................................45<br />
Web Resources ............................................................................. 46-47<br />
Caltrans District Offices and District Directors .................... 48-49<br />
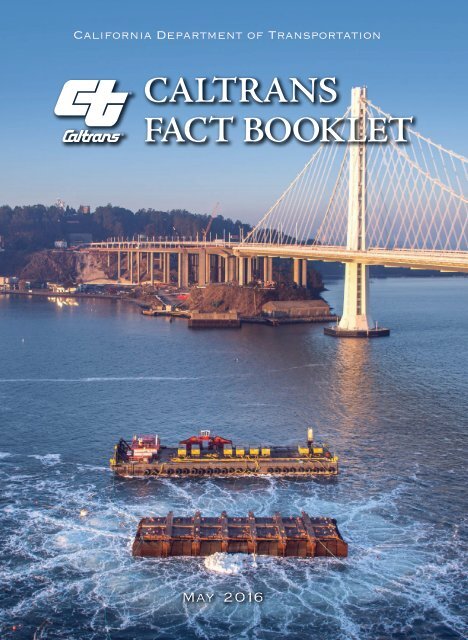
Cover photo:<br />
On November 14, 2015, the largest pier of the old San Francisco-<br />
Oakland Bay Bridge’s east span was removed through a careful and<br />
extensively planned implosion. Early in the morning at slack tide, years<br />
of preparation, more than half-a-dozen permits, and thousands of<br />
hours of labor culminated in a successful implosion. In just six seconds,<br />
nearly 600 controlled charges weakened the 50-feet of Pier E3, allowing<br />
gravity to collapse the pier into its hollow casing below the mud-line.<br />
The “bubble curtain” helps to control adverse effects on the environment<br />
with minimal disturbance to wildlife.<br />
Malcolm Dougherty, Director<br />
California Department of Transportation<br />
For individuals with sensory disabilities, this document is available in<br />
alternate formats. To obtain a copy in one of these alternative formats,<br />
please write to:<br />
Caltrans Public Affairs Office<br />
1120 N Street, Mail Stop 49<br />
Sacramento, CA 95814<br />
or call: Paulette Lautaret (916) 657-4726<br />
1
Districts and Counties<br />
Metropolitan Planning Organizations (MPOs)<br />
Districts<br />
Counties<br />
Acronym<br />
Name (Counties Represented)<br />
Planning and Modal Programs<br />
1 Del Norte, Humboldt, Lake, Mendocino<br />
2 Lassen, Modoc, Plumas, Shasta, Siskiyou, Tehama, Trinity<br />
3<br />
4<br />
5<br />
Butte, Colusa, El Dorado, Glenn, Nevada, Placer, Sacramento,<br />
Sierra, Sutter, Yolo, Yuba<br />
Alameda, Contra Costa, Napa, Marin, San Francisco,<br />
San Mateo, Santa Clara, Solano, Sonoma<br />
Monterey, San Benito, San Luis Obispo, Santa Barbara,<br />
Santa Cruz<br />
6 Fresno, Kern 1 , Kings, Madera, Tulare<br />
7 Los Angeles, Ventura<br />
8 Riverside, San Bernardino<br />
9 Inyo, Mono, a portion of Kern 1<br />
10<br />
Alpine, Amador, Calaveras, Mariposa, Merced, San Joaquin,<br />
Stanislaus, Tuolumne<br />
11 Imperial, San Diego<br />
12 Orange<br />
1<br />
The District 9 boundary changed on November 1, 2015 to include a part of Kern County in<br />
District 6. The official order was signed on October 30, 2015, encompassing all functions, and<br />
went into effect on November 1, 2015.<br />
District/County Data - Division of Transportation Planning:<br />
Katie Benouar, Chief (916) 653-1818<br />
AMBAG<br />
BCAG<br />
FCOG<br />
KCAG<br />
KCOG<br />
MCTC<br />
MCAG<br />
MTC<br />
SACOG<br />
SANDAG<br />
SBCAG<br />
SCAG<br />
SRTA<br />
SJCOG<br />
SLOCOG<br />
Association of Monterey Bay Area Governments<br />
(Monterey, Santa Cruz, and San Benito)<br />
Butte County Association of Governments (Butte)<br />
Fresno Council of Governments (Fresno)<br />
Kings County Association of Governments (Kings)<br />
Kern Council of Governments (Kern)<br />
Madera County Transportation Commission (Madera)<br />
Merced County Association of Governments (Merced)<br />
Metropolitan Transportation Commission (Alameda, Contra<br />
Costa, Marin, Santa Clara, Napa, San Francisco, Solano,<br />
San Mateo, and Sonoma)<br />
Sacramento Area Council of Governments (Sacramento,<br />
Placer, El Dorado, Sutter, Yolo, and Yuba)<br />
San Diego Association of Governments (San Diego)<br />
Santa Barbara County Association of Governments<br />
(Santa Barbara)<br />
Southern California Association of Governments<br />
(Imperial, Los Angeles, Orange, Riverside, San Bernardino,<br />
and Ventura)<br />
Shasta Regional Transportation Agency (Shasta)<br />
San Joaquin Council of Governments (San Joaquin)<br />
San Luis Obispo Council of Governments (San Luis Obispo)<br />
Planning and Modal Programs<br />
STANCOG<br />
Stanislaus Council of Governments (Stanislaus)<br />
TCAG<br />
Tulare County Association of Governments (Tulare)<br />
TMPO<br />
Tahoe Metropolitan Planning Organization (El Dorado, Placer<br />
in California and Douglas, Washoe, Carson City in Nevada)<br />
MPO Data - Division of Transportation Planning:<br />
Katie Benouar, Chief (916) 653-1818<br />
2 3
Planning and Modal Programs<br />
California Aviation<br />
2015 State Aviation Facilities<br />
Commercial Service Airports............................................................... 27<br />
General Aviation (GA) Airports........................................................ 217<br />
Joint Use Airport (MIPAA/March ARB) 1 ...........................................1<br />
Special-Use Airports............................................................................. 68<br />
Hospital Heliports............................................................................... 163<br />
Heliports (Fire, Police, Commuter, Private)..................................... 196<br />
Pilots and Registered Aircraft Statistics<br />
GA accounts for approximately 80 percent<br />
of aircraft operations statewide.<br />
Federal Aviation Administration (FAA)<br />
Certified Aircraft ............................................................29,167 2<br />
GA and Air Taxi Active Aircraft (2014) 3 ....................................20,560<br />
(Certified Pilots - 59,841; Hours Flown - 2.2 Million)<br />
Assessed Aircraft Value (2015/22,030 Aircraft).........$8.7 Billion<br />
Commercial Service Airports Air Traffic Statistics (2014) 4<br />
Scheduled Passenger Traffic..............................................201.9 Million<br />
Air Cargo Traffic .................................................. 4.4 Million U.S. Tons<br />
Federal Capital Improvement Investments<br />
FAA Airport Improvement Program (AIP) 2015 Grants 5<br />
FFY 2014-15 (October 1, 2014 - September 30, 2015)<br />
Commercial Service Airport Grants<br />
(39 Grants)...................................................................$193.9 Million<br />
General Aviation Airport Grants<br />
(75 Grants).....................................................................$52.8 Million<br />
1<br />
March Inland Port Airport Authority (MIPAA) has access to the adjacent military airfield runway<br />
to conduct general aviation operations; therefore, it does not require a State Public Use Airport<br />
permit. ARB = Air Resources Board.<br />
2<br />
January 2016: FAA Registry.<br />
3<br />
Excludes commercial air carrier aircraft and other exempt aircraft.<br />
4<br />
Includes enplaned and deplaned passengers or air cargo, respectively.<br />
5<br />
Includes entitlement and discretionary funds based on 90 percent of estimated project cost.<br />
Aviation Data - Division of Aeronautics: Gary Cathey, Chief (916) 654-4848<br />
Division of Aeronautics<br />
Income and Expenses<br />
FY 2014-15 ( July 1, 2014 - June 30, 2015)<br />
Income - State Aeronautics Account............................. $9.5 Million<br />
Source: State Excise Fuel Taxes and a $4 million transfer from<br />
the Local Airport Loan Account. ($0.18/Gallon Aviation Gasoline;<br />
$0.02/Gallon Jet Fuel)<br />
Expenses 1 - California Aid to Airports Program<br />
State Airport Improvement Program (AIP)<br />
Matching Grants 2 (46 Grants) .................................$1.25 Million<br />
Annual Credit Grants 3 (144 Grants)..........................$1.44 Million<br />
Acquisition and Development Grants (23 Grants)...$4.04 Million<br />
1<br />
Expenses exclude the Division of Aeronautics operating expenses.<br />
2<br />
State AIP Matching Grant match rate is 5.0 percent of the FAA AIP Grant.<br />
3<br />
According to CA Public Utilities Code (PUC) 21682-21683.2, Annual Credit Grants must be<br />
funded prior to awarding any other California Aid to Airports Program grants.<br />
2015 Government Investments in<br />
Public Use Airport System 1<br />
4 5<br />
250<br />
200<br />
150<br />
100<br />
50<br />
0<br />
$246.7<br />
$6.73<br />
Federal State<br />
* US dollars in millions<br />
(in Millions)<br />
1<br />
Funding Sources: Airport and Airway Trust Fund; State Investments - State Aeronautics Account.<br />
Aeronautics Data - Division of Aeronautics: Gary Cathey, Chief (916) 654-4848<br />
Planning and Modal Programs
Planning and Modal Programs<br />
California Mass Transportation<br />
(Including Motor Bus, Rail, Street Car, Trolley, Demand Response,<br />
Rail Rapid Transit, Ferry Boats, and Other)<br />
Selected Transit Statistics 1<br />
FY 2014-15<br />
Passenger Trips.............................................................. 1.8 Billion<br />
Passenger Fares..........................................................$1.75 Billion<br />
Vehicle Miles.................................................................603 Million<br />
Number of Revenue Vehicles.............................20.78 Thousand<br />
Operating Revenues and Capital Additions.... $10.54 Billion<br />
1<br />
Source: State Controller’s Office - Transit Operators Raw Data for Fiscal Years 2013-2014.<br />
State Transit Funds Distributed Statewide 1<br />
FY 2014-15<br />
Transportation Development Act (TDA)............. $1.92 Billion<br />
State Transportation Improvement Program<br />
(STIP)................................................................ $41.65 Billion<br />
($83.43 Million “Federalized” STIP is provided by the Federal Transit Administration.)<br />
Clean Air and Transportation Improvement Program<br />
(Proposition 116) ............................................ $1.72 Million<br />
Traffic Congestion Relief Program (TCRP)........$39.04 Million<br />
State Local Partnership Program (SLPP)...............................$0<br />
Proposition 1A - High Speed Rail Connectivity... $78.64 Million<br />
Proposition 1B - Public Transportation Modernization,<br />
Improvement and Service Enhancement Account<br />
(PTMISEA)......................................................$654 Million<br />
Low Carbon Transit Operations Program<br />
(LCTOP).......................................................... $24.17 Million<br />
Transit and Intercity Rail Capital Program<br />
(TIRCP)...............................................................................$0<br />
1<br />
Source: Division of Rail and Mass Transportation Program Managers<br />
California Mass Transportation (cont.)<br />
Federal Transit Funds Distributed Statewide 1<br />
FY 2014-15 (FFY 2015)<br />
FTA 5310 - Enhanced Mobility of Seniors and Individuals with<br />
Disabilities Transportation .................................$33.7 Million<br />
FTA 5311 and 5311(f ) - Non-Urbanized Area<br />
Formula Program...........................................$27.9 Million<br />
FTA 5311 (b) - Rural Transit Assistance<br />
Program (RTAP)....................................... $370 Thousand<br />
FTA 5339 - Bus and Bus Facilities......................... $7.4 Million<br />
FTA 5339 - Bus and Bus Facilities<br />
State Discretionary ........................................$1.25 Million<br />
1<br />
Federal Transit Administration (FTA) Apportionment.<br />
Source: Division of Rail and Mass Transportation Program Managers<br />
California Intercity Rail Ridership<br />
By Calendar Year (in Millions)<br />
6 7<br />
Year<br />
Ridership<br />
2015 5.50<br />
2014 5.36<br />
2013 5.52<br />
2012 5.60<br />
2011 5.57<br />
2010 5.23<br />
Note: Ridership shown is the combined ridership for the Pacific Surfliner, San Joaquin, and<br />
Capitol Corridor routes.<br />
California Mass Transit and Interciy Rail Data - Division of Rail and Mass<br />
Transportation: Bruce Roberts, Chief (916) 654-7293<br />
Planning and Modal Programs
State Supported Intercity Rail Service<br />
102 State-Owned Intercity Passenger Rail Cars<br />
17 State-Owned Intercity Passenger Rail Locomotives<br />
Name 1 Capitol Corridor Pacific Surfliner San Joaquin<br />
Planning and Modal Programs<br />
Route<br />
Auburn-Sacramento-Oakland-San Jose<br />
San Luis Obispo-Santa Barbara-<br />
Los Angeles-San Diego<br />
Oakland/Sacramento-Stockton-<br />
Fresno-Bakersfield<br />
Route Mileage 169 354 364<br />
No. of Daily Round Trips<br />
Auburn-Sacramento: 1<br />
Sacramento-Oakland: 15<br />
Oakland-San Jose: 7<br />
San Luis Obispo-Santa Barbara: 2<br />
Santa Barbara-Los Angeles: 5<br />
Los Angeles-San Diego: 11<br />
Oakland-Stockton-Bakersfield: 4<br />
Sacramento-Stockton-Bakersfield: 2<br />
No. of Stations 17 31 18<br />
Railroad Companies 2<br />
Union Pacific/Locally Owned<br />
Union Pacific/BNSF 4 Railway/<br />
Locally Owned<br />
Union Pacific/BNSF 4 Railway<br />
No. of Passenger Cars 3 Caltrans: 32.5 5 Amtrak: 2 Caltrans: 7 Amtrak: 49 Caltrans: 40.5 5 Amtrak: 10<br />
No. of Cab Cars 3,6 Caltrans: 7 Amtrak: 0 Caltrans: 3 Amtrak: 8 Caltrans: 12 Amtrak: 0<br />
No. of Locomotives 3 Caltrans: 9 Amtrak: 0 Caltrans: 0 Amtrak: 15 Caltrans: 8 Amtrak: 0<br />
FFY 2014-15<br />
Ridership 1.5 Million 2.8 Million 1.2 Million<br />
Passenger Miles 98.9 Million 246.5 Million 164.2 Million<br />
Average Passenger Trip Length 67 Miles 87 Miles 140 Miles<br />
Total Revenue $30.01 Million $75.84 Million $40.34 Million<br />
State Funding $32.60 Million $44.29 Million $42.60 Million<br />
1<br />
100% of the three corridors is State supported.<br />
2<br />
Amtrak operates all passenger service on railroad company and public agencies’ rights-of-way.<br />
Portions of the Pacific Surfliner and Capitol Corridor routes are owned by public agencies.<br />
3<br />
Equipment owned by Caltrans and Amtrak assigned to each route.<br />
4<br />
Burlington Northern and Santa Fe Railway (BNSF).<br />
5<br />
The San Joaquin Route and Capitol Corridor share a car fleet of 73 cars in Northern California,<br />
and car allocation is based upon need and maintenance. The pool is fluid, and cars can be assigned<br />
as needed on either route. The calculation of car use distribution, including cars out of service for<br />
maintenance, results with the half-car designation.<br />
6<br />
A cab car in an unpowered passenger coach with an operator’s cab on it, used when<br />
trains are pushed by the locomotive. Trains on the Capitol Corridor all operate with<br />
the locomotives on the train facing west, so that all westbound trains are pulled by the<br />
locomotive and all eastbound trains are pushed by the locomotive with an operator in<br />
the cab car.<br />
California Intercity Rail Data -<br />
Division of Rail and Mass Transportation: Bruce Roberts, Chief (916) 654-7293<br />
Planning and Modal Programs<br />
8 9
Sustainability: People, Planet, and Prosperity<br />
California Household Travel Survey 1<br />
(CHTS) Travel Mode Distribution<br />
Comparison of 2000-2002 to 2010-2012 Surveys<br />
Mode 2000-02 2010-12<br />
Auto/Van/Truck Driver 60.2% 49.3%<br />
Auto/Van/Truck Passenger 25.8% 25.9%<br />
Walk Trips 8.4% 16.6%<br />
Public Transportation 2.2% 4.4%<br />
Bicycle 0.8% 1.5%<br />
Private Transportation NA 0.6%<br />
School Bus NA 0.6%<br />
Carpool/Vanpool NA 0.6%<br />
All Other 0.7% 0.5%<br />
Total 100.0% 100.0%<br />
Bike- Walk-Transit Mode Share by District 2<br />
Caltrans<br />
Districts<br />
Walk Bike Transit<br />
1 14.4% 1.2% 2.4%<br />
2 5.6% 2.1% 0.5%<br />
3 8.7% 2.9% 1.4%<br />
4 20.1% 2.1% 5.4%<br />
5 14.9% 2.4% 1.8%<br />
6 13.4% 1.3% 1.8%<br />
7 20.9% 1.2% 6.4%<br />
8 9.6% 0.7% 2.1%<br />
9 16.5% 3.5% 0.8%<br />
10 12.0% 0.7% 1.8%<br />
11 13.3% 1.3% 3.9%<br />
12 10.9% 1.2% 2.3%<br />
% of<br />
State Total<br />
16.5% 1.5% 4.4%<br />
1<br />
The CHTS provides regional and inter-regional trip data that statewide and regional<br />
travel models require in order to develop and calibrate forecasts for 2015, 2020, 2035<br />
and 2040 Greenhouse Gas emissions (GHG). SB 375 (Sustainable Communities/<br />
Climate Protection Act of 2008) and SB 391 (CA Homes and Jobs Act of 2013) require<br />
GHG forecasts.<br />
2<br />
Source CHTS 2010-12<br />
California Household Travel Survey Data - Division of Transportation Planning:<br />
Katie Benouar, Chief (916) 653-1818<br />
Fuel Use<br />
Quantity of Fuel in Gallons and Total Cost<br />
Total Fuel Cost for FY 2014-2015 $36,206,000<br />
Total Fuel Used in FY 2014-2015<br />
Unleaded Gas<br />
Diesel<br />
Alternative Fuel Used in FY 2014-2015 1<br />
Biodiesel<br />
E-85<br />
CNG<br />
LPG<br />
11,833,109<br />
6,471,150<br />
2,333,533<br />
3,028,426<br />
2,738,218<br />
119,322<br />
152,863<br />
18,023<br />
Number of Bulk Fueling Stations 226<br />
1<br />
Alternate Fuel Definitions:<br />
Biodiesel - Produced from renewable resources and contains no<br />
petroleum; in its pure form it is known as B11 (100 % biodiesel)<br />
although it is often blended with petroleum diesel; e.g., B-5, B-10.<br />
E-85 - 85% ethanol and 15% gasoline.<br />
CNG - Compressed natural gas.<br />
LPG - Liquefied petroleum gas.<br />
Fuel Use data from Division of Equipment: Larry Orcutt, Chief (916) 227-9600<br />
Carbon Dioxide (CO 2 ) Emissions<br />
from Caltrans Operations<br />
Caltrans has reduced GHG emissions by 24.5% between 2010 and 2015!<br />
Greenhouse Gases 1 2010 through 2014 (in Metric Tons)<br />
2010 2011 2012 2013 2014 2015 2<br />
Vehicle Fuels 2 118,042 115,118 112,758 108,810 105,338 110,997<br />
Building Electricity<br />
and Gas<br />
35,336 38,019 29,028 36,075 30,039 30,751<br />
Street Lighting 64,107 61,270 56,638 54,339 21,808 22,425<br />
Total<br />
Emmissions 217,485 214,407 198,424 199,224 157,185 164,173<br />
1<br />
Data has been reported to the Climate Registry but has not been verified - changes may occur.<br />
2<br />
Due to a 2015 Statewide increase in the carbon intensity of the energy grid, Caltrans’ 2015 emissions from<br />
buildings and streetlights increased.<br />
Greenhouse Gases Data - Division of Transportation Planning:<br />
Katie Benouar, Chief (916) 653-1818.<br />
10 11<br />
Sustainability: People, Planet, and Prosperity
Sustainability: People, Planet, and Prosperity<br />
State Agency Buy Recycled Campaign<br />
(SABRC) FY 2014-15<br />
Compost,<br />
Co-compost mulch<br />
Reportable<br />
Commodity 1<br />
Commodity<br />
with Recycled<br />
Content 2<br />
Recycled<br />
Percentage 3<br />
Antifreeze $128,057 $885 1%<br />
Glass Products $176,748 - 0%<br />
Lubricating Oils $815,987 $767,362 94%<br />
Paper Products $4,097 $2,559 62%<br />
Plastic Products $51,177 $2,240 4%<br />
Printing and Writing<br />
Paper<br />
$17,092 $17,092 100%<br />
Metal Products $14,670,235 $14,670,235 100%<br />
Tire-derived Products $12,529 - 0%<br />
Tires 4 $2,507,426 $533,683 21%<br />
Total $18,383,349 $15,944,056 87%<br />
1<br />
Total amount spent within that category to perform all statewide Division of Equipment (DOE)<br />
operations.<br />
2<br />
Total amount spent within that category that contained post-consumable recycled content.<br />
3<br />
The percentage of the total amount spent that contained post-consumable recycled content.<br />
4<br />
Includes data collected from 10 of the 12 District shops.<br />
Equipment Materials Recycled data - Division of Equipment:<br />
Larry Orcutt, Chief (916) 227-9600<br />
LED Replacements FY 2012-13 1 2014-15<br />
Cumulative Installed<br />
Light Emitting Diodes (LEDs)<br />
[Number Installed]<br />
LED Replacements<br />
24,731 48,472<br />
1<br />
First year LED conversion was documented.<br />
LED data - Division of Maintenance: Tony Tavaras, Chief (916) 654-5849<br />
Statewide Registered<br />
Electric and Hybrid Vehicles by Year<br />
Year Hybrid Electric<br />
2015 958,490 111,256<br />
2014 838,795 79,594<br />
2013 709,766 48,951<br />
2012 585,329 30,672<br />
2011 488,510 24,408<br />
2010 395,483 18,905<br />
2009 337,881 18,780<br />
2008 284,324 not available<br />
Source: Statewide Registered Electric and Hybrid Vehicles Statistics -<br />
DMV Statistical Record of Motive Power Report<br />
Division of Research, Innovation, and System Information:<br />
Jim Appleton, Chief (916) 654-8877<br />
California Structures Statistics<br />
Maintenance and Repair of Bridges<br />
FY 2014-15 Annual Expenditure<br />
Actual Expenditures - (Includes SHOPP) 1 ............. $434.6 Million<br />
State-Owned Bridges and Other Structures......................13,225<br />
Including:<br />
Tunnels and Tubes (Each Bore).............................................. 43<br />
Ferry Boats.................................................................................. 2<br />
Large State-Owned Bay-Crossing Bridges.............................. 9<br />
12 13<br />
Antioch<br />
Dumbarton<br />
San Francisco-<br />
Oakland Bay<br />
Benicia-Martinez Richmond-San Rafael San Mateo-Hayward<br />
Carquinez San Diego Coronado Vincent Thomas<br />
1<br />
SHOPP - State Highway Operations and Protection Program<br />
Structures Statistics - Division of Maintenance: Tony Tavares, Chief (916) 654-5849<br />
Sustainability: People, Planet, and Prosperity
Sustainability: People, Planet, and Prosperity<br />
California Statistics<br />
California State Population<br />
37,253,956<br />
Source: 2010 United States Census from California Department of Finance<br />
http://www.dof.ca.gov/research/demographic/state_census_data_center/census_2010/<br />
State Highway System - 2014<br />
Number of State Highways.................................................... 265<br />
Lane-Miles...........................................................................51,900<br />
Centerline Miles..................................................................15,100<br />
Rural/Urban Centerline Miles<br />
Rural 1 68% 10,312<br />
Urban 2 32% 4,788<br />
Total 100% 15,100<br />
FWY-EXP/Non FWY-EXP Centerline Miles<br />
Fwy/Exp 27% 4,050<br />
Non Fwy/Exp 3 73% 11,050<br />
Total 100% 15,100<br />
Interstate/Non-Interstate Centerline Miles<br />
Interstate 16% 2,451<br />
Non-Interstate 84% 12,649<br />
Total 100% 15,100<br />
1<br />
Rural roads are those found in areas with a population of less than 5,000.<br />
2<br />
Urban roads are found in areas with a population of more than 5,000.<br />
3<br />
Non-freeway and Non-expressway includes conventional highways and highways located on oneway<br />
city streets.<br />
Mileage Statistics - Data Source: 2014 Public Road Data Publication - Compiled by Division of<br />
Research, Innovation, and System Information: Jim Appleton, Chief (916) 654-8877<br />
Non-State Highway System - 2014<br />
Non-State Centerline Miles:...........................................159,630<br />
Non-State Highway Centerline Miles<br />
City Roads 48% 76,842<br />
County Roads 41% 64,441<br />
Federal-Owned Roads 1 9% 14,915<br />
Other Jurisdictions 2 2% 3,432<br />
Total Non-State Centerline Miles 100% 159,630<br />
1<br />
Includes roads owned by Bureau of Indian Affairs, Forest Service, Fish and Wildlife Service,<br />
Bureau of Reclamation, Military, National Park Service, Department of Defense, and Army<br />
Corps of Engineers.<br />
2<br />
Includes roads owned by State Forestry and Fire Protection, State Parks and Recreation,<br />
University of California, Local Agency - Golden Gate Bridge, port authorities, and tribal lands.<br />
Non-State Highway System Data - Compiled by Division of Research, Innovation, and<br />
System Information: Jim Appleton, Chief (916) 654-8877<br />
Annual Vehicle Miles of Travel (AVMT) 1<br />
2014 (in Billions)<br />
1<br />
Totals may not equal sum of components due to independent rounding<br />
Non-State Highway Centerline Miles<br />
State Highways (Interstate AVMT= 86.2 billion of State Highway AVMT) 180.8<br />
Local Roads (Includes city streets and county roads only) 152.7<br />
Other Agencies (Includes Federal, other State and other local jurisdictions) 1.2<br />
Total of All Public Roads 2 334.7<br />
2<br />
All public roads include those owned by cities, counties, various State and Federal agencies,<br />
and tribal lands.<br />
AVMT Statistics - Data Source: 2014 Public Road Data Publication - Compiled by Division of<br />
Research, Innovation, and System Information: Jim Appleton, Chief (916) 654-8877<br />
14 15<br />
Sustainability: People, Planet, and Prosperity
Sustainability: People, Planet, and Prosperity<br />
Department of Motor Vehicles<br />
(DMV) Statistics<br />
as of January 1, 2015<br />
Registered Vehicles 1<br />
Licensed Drivers<br />
Autos 23,805,920 Class A 8 469,597<br />
CVRA Trucks 2 466,692 Class B 9 210,957<br />
Non-CVRA Trucks 3 5,048,754 Class C 10 24,332,537<br />
PTI Trailers 4 2,176,197 Class M 11 1,377<br />
Trailer Coach/CCH 5 389,876 Total 25,014,468<br />
Motorcycles 862,705<br />
Misc. Vehicles 6 154,124<br />
CA Based IRP Vehicles 7 76,087<br />
Fee-Paid Vehicles Registered 32,980,355<br />
Fee Exempt Vehicles Registered 570,131<br />
Total Vehicles Registered 33,550,486<br />
1<br />
The Commercial Vehicle Registration Act (CVRA) changed the way the Department of Motor<br />
Vehicles registers commercial motor vehicles and some trailers.<br />
2<br />
CVRA Trucks are motor vehicles with a declared gross vehicle weight (GVW) of 10,001 lbs or<br />
more and are affected by the new law.<br />
3<br />
Non-CVRA Trucks are motor vehicles with a declared GVW less than 10,001 lbs, taxis, rental<br />
limousines or vans, and are not affected by the new law.<br />
4<br />
PTI Trailers are trailers that are subject to Permanent Trailer Identification (PTI) fees under this<br />
law. All trailers except park trailers and trailer coaches are subject to PTI.<br />
5<br />
Trailer Coach/CCH are generally Motor Homes.<br />
6<br />
Includes Historical Vehicles (e.g., Spec/Farm Equipment, etc).<br />
7<br />
CA Based International Registration Plan (IRP) Vehicles are IRP Vehicles based in California.<br />
IRP is a U.S. Based plan that allows for distribution of registration fees to member states. If a<br />
vehicle is based in CA it has a California license plate but is allowed to travel in other states.<br />
8<br />
Class A license includes everything: Busses, Big Rigs, Multi Trailers, and Cars.<br />
9<br />
Class B license includes Bus/No Trailers.<br />
10<br />
Class C license includes normal cars or Motor Homes/No Motorcycles.<br />
11<br />
Class M license includes Two-Wheel Motorcycles or a Motor-Driven cycles.<br />
California DMV Statistics ~ https://www.dmv.ca.gov/portal/wcm/connect/fafd3447-8e14-<br />
4ff6-bb98-e85f3aa9a207/ca_dmv_stats.pdf?MOD=AJPERES<br />
Employee Safety<br />
Caltrans Worker Fatalities as of September 30, 2015 1<br />
Year Errant Drivers Other Accidents Total Fatalities<br />
2015 0 1 1<br />
2014 0 0 0<br />
2013 0 2 2<br />
2012 0 0 0<br />
2011 1 2 3<br />
2010 1 0 1<br />
2009 1 1 2<br />
2008 0 1 1<br />
2007 3 0 3<br />
2006 2 0 2<br />
2005 0 1 1<br />
2004 1 2 3<br />
2003 0 0 0<br />
2002 0 0 0<br />
2001 0 1 1<br />
1921–2000 -- -- 164<br />
Total -- -- 184<br />
1<br />
Does not include contractors’ employees.<br />
Caltrans on the Job Illness and Injury Incident Rates 1<br />
Departmental Goal 18% Reduction by December 2020<br />
Injuries/Illnesses<br />
No. of Employees<br />
Incident Rate<br />
1<br />
Incident Rate = [All injuries and illnesses requiring medical attention divided by (number of<br />
employees x 2,000) x 200,000]. Benchmark Incident Rate = 6.81<br />
2<br />
A three year average is the industry standard for Incident Rate comparison and these figures are<br />
taken from years 2012, 2013, and 2014.<br />
3<br />
2015 comparison to 2014 injuries: Injuries/Illnesses -68; Incident Rate -3.96%, 20.22% Over Goal<br />
Employee Safety - Division of Safety and Management Services:<br />
Cheryl McNulty, Chief (916) 227-2403<br />
16 17<br />
2012<br />
1,528<br />
20,898<br />
7.31<br />
2013<br />
1,466<br />
20,663<br />
7.09<br />
2014<br />
1,399<br />
20,014<br />
6.99<br />
3 Year<br />
Average 2 2015 3<br />
1,464 1,331<br />
20,525 19,826<br />
7.13 6.71<br />
Sustainability: People, Planet, and Prosperity
Sustainability: People, Planet, and Prosperity<br />
Caltrans Full-Time Employees 1<br />
Number and Percentage per Category 2<br />
as of September 30 each Year<br />
Caltrans Full-Time Employees<br />
Number and Percentage Per Category by Year<br />
Employee 2011 2012 2013 2014 2015<br />
Category No. % No. % No. % No. % No. %<br />
Engineering 8,100 42% 7,949 41% 7,746 41% 7,536 40% 7,405 40%<br />
Maintenance 4,747 25% 4,974 26% 4,883 26% 4,760 25% 4,770 26%<br />
All Others 6,382 33% 6,524 33% 6,350 33% 6,479 35% 6,240 34%<br />
Total 19,229 100% 19,447 100% 19,979 100% 18,775 100% 18,415 100%<br />
1<br />
The employment summary reflects all time bases and tenures for employee primary<br />
positions except additional and retired annuitant positions.<br />
2<br />
Percentage numbers are rounded.<br />
Caltrans Full-Time Employees Data - Division of Human Resources:<br />
Michelle Tucker, Chief (916) 227-7700<br />
Summary of Departmental<br />
Ethnicity/Gender Percentages 1<br />
FY 2008-2015 as of September 30 each Year<br />
Year Women Men Minorities Caucasian<br />
2015 25.3% 74.7% 53.4% 46.6%<br />
2014 25.4% 74.6% 52.8% 47.2%<br />
2013 25.4% 74.6% 52.3% 47.7%<br />
2012 26.02% 75.98% 51.4% 48.6%<br />
2011 25.7% 74.3% 51.8% 48.2%<br />
2010 25.9% 74.1% 51.7% 48.3%<br />
2009 26.3% 73.7% 51.3% 48.7%<br />
2008 26.5% 73.5% 50.9% 49.1%<br />
Small Business and Disabled Veteran<br />
Business Enterprise (DVBE)<br />
FY 2014-15 Participation Rates<br />
Small Business (SB)/Microbusiness (MB)<br />
Total Dollars Awarded for State Funded<br />
Contracts and Procurements .................... $1,230,371,824<br />
SB / MB Participation.....................................$349,378,944<br />
Percentage...................................................................28.40%<br />
DVBE<br />
Total Dollars Awarded for State Funded<br />
Contracts and Procurements .................... $1,230,371,824<br />
DVBE Participation.........................................$47,149,004<br />
Percentage.................................................................... 3.83%<br />
Source: Contracting Activity Report, DPAC, FY 2014-15<br />
SB-DVBE Statistics - Office of Business and Economic Opportunity (OBEO):<br />
Janice Salais, Acting Assistant Director (916) 324-0990<br />
Sustainability: People, Planet, and Prosperity<br />
Ethnicity/Gender Percentages Data - Equal Employment Opportunity Program:<br />
Gina Cardoza, Program Manager (916) 227-7413<br />
18 19
Sustainability: People, Planet, and Prosperity<br />
District<br />
Total Caltrans<br />
Workers 1<br />
Summary of Departmental Ethnicity/Gender Percentages<br />
2014-15 Fiscal Year by District as of September 30, 2015<br />
2005-06 to 2014-15 Fiscal Year Totals and Percentages<br />
African-<br />
American<br />
American<br />
Indian<br />
Asian Filipino Hispanic<br />
Pacific<br />
Islander<br />
Caucasian Other Men Women Disability<br />
District 1 574 0.9% 2.8% 1.0% 1.4% 6.3% 0.3% 82.2% 5.1% 76.3% 23.7% 21.1%<br />
District 2 716 0.8% 1.3% 1.1% 0.3% 5.2% 0.6% 89.4% 1.4% 82.8% 17.2% 14.4%<br />
District 3 1,488 3.4% 1.0% 8.5% 1.3% 10.8% 0.7% 71.3% 3.0% 81.3% 18.7% 14.8%<br />
District 4 2,976 14.0% 0.4% 28.0% 9.5% 12.4% 0.9% 30.8% 3.9% 75.1% 24.9% 12.4%<br />
District 5 645 1.9% 0.6% 4.7% 2.3% 23.9% 0.2% 63.7% 2.8% 76.7% 23.3% 20.3%<br />
District 6 1,152 5.1% 1.3% 14.1% 2.8% 26.9% 0.8% 45.6% 3.4% 77.7% 22.3% 21.5%<br />
District 7 2,299 15.7% 0.3% 24.8% 5.2% 26.6% 0.5% 22.7% 4.2% 79.8% 20.2% 13.1%<br />
District 8 1,374 10.3% 0.2% 16.3% 3.4% 27.4% 0.4% 37.3% 4.5% 80.1% 19.9% 22.5%<br />
District 9 272 0.4% 6.3% 1.1% 1.1% 8.1% 0.7% 81.3% 1.1% 85.3% 14.7% 14.7%<br />
District 10 747 4.4% 0.9% 14.2% 5.5% 15.9% 0.8% 55.3% 2.9% 79.8% 20.2% 20.7%<br />
District 11 1,185 6.2% 0.3% 10.5% 6.7% 27.5% 0.7% 44.2% 4.0% 73.8% 26.2% 14.5%<br />
District 12 755 5.4% 0.3% 25.4% 3.2% 20.4% 0.8% 38.4% 6.1% 76.8% 23.2% 18.1%<br />
HQ 5,331 6.0% 0.5% 21.8% 4.6% 14.4% 0.6% 48.6% 3.5% 65.6% 34.4% 18.2%<br />
Fiscal Year Totals and Percentages<br />
2014-15 19,514 7.8% 0.7% 18.2% 4.7% 17.7% 0.6% 46.6% 3.7% 74.7% 25.3% 16.8%<br />
2013-14 19,971 7.8% 0.7% 17.8% 4.7% 17.4% 0.6% 47.2% 3.7% 74.6% 25.4% 12.1%<br />
2012-13 20,387 7.8% 0.6% 17.1% 4.6% 17.1% 0.6% 47.7% 3.8% 74.6% 25.4% 12.6%<br />
2011-12 20,686 7.9% 0.6% 17.9% 4.7% 16.8% 0.6% 48.0% 3.6% 74.3% 25.7% 13.3%<br />
2010-11 20,511 7.7% 0.6% 18.1% 4.7% 16.7% 0.5% 48.2% 3.4% 74.3% 25.7% 14.1%<br />
2009-10 20,900 7.7% 0.6% 18.1% 4.7% 16.6% 0.5% 48.3% 3.4% 74.3% 25.9% 14.4%<br />
2008-09 21,502 7.7% 0.6% 17.9% 4.8% 16.3% 0.5% 48.7% 3.4% 73.7% 26.3% 15.1%<br />
2007-08 22,081 7.8% 0.6% 17.6% 4.9% 16.1% 0.5% 49.1% 3.3% 73.5% 26.5% 6.5%<br />
2006-07 21,703 7.9% 0.6% 17.3% 4.8% 16.0% 0.5% 49.7% 3.3% 73.5% 26.5% 6.7%<br />
2005-06 20,502 8.1% 0.6% 16.7% 4.7% 16.0% 0.5% 50.2% 3.3% 73.6% 26.4% 6.9%<br />
1<br />
The employment summary reflects all time bases and tenures for employee primary positions except<br />
additional and retired annuitant positions.<br />
Ethnicity/Gender Percentages Data - Equal Employment Opportunity Program:<br />
Gina Cardoza, Program Manager (916) 227-7413<br />
20 21<br />
Sustainability: People, Planet, and Prosperity
Financial Information<br />
Transportation Revenue Facts<br />
Federal Fuel Excise Taxes<br />
• 18.4 cents per gallon gasoline tax.<br />
• 24.4 cents per gallon diesel tax.<br />
• Taxes are collected and deposited in the Federal Highway<br />
Trust Fund.<br />
• Taxes are returned to the states in the form of Federal<br />
Obligation Authority (OA) for reimbursement.<br />
• Under the Federal Authorization MAP-21, California’s<br />
formula obligation authority for Federal Fiscal Year 2015<br />
was approximately $3.2 billion. On December 4, 2015,<br />
President Obama signed the first long term funding plan<br />
for transportation since 2009. The Fixing America’s Surface<br />
Transportation (FAST) Act, provides stable funding over<br />
the next five years, and authorizes approximately $3.4 billion<br />
for California in Federal Fiscal Year 2016.<br />
State Fuel Excise Tax on Gasoline<br />
• 27.8 cents per gallon effective July 1, 2016. This is a decrease<br />
of 2.2 cents per gallon from 2015-16.<br />
• Adjusted annually by State Board of Equalization.<br />
(BOE) to maintain revenue neutrality with the loss<br />
of State sales tax on gasoline.<br />
o 18 cents per gallon base state excise tax, unchanged since 1994.<br />
• Approximately 64% of revenues to the State.<br />
• Approximately 36% of revenues to Cities and Counties.<br />
o 9.8 cents per gallon price-based excise tax effective July 1,<br />
2016, a decrease of 2.2 cents per gallon from 2015-16.<br />
• The first allocation of funding is used to backfill<br />
transportation programs previously funded by weight<br />
fees (see section under Weight Fees on page 28), with the<br />
remaining split as follows:<br />
Transportation Revenue Facts (cont.)<br />
Price-based Excise Tax<br />
Revenue Distribution<br />
State Fuel Excise Tax on Diesel<br />
• 16 cents per gallon effective July 1, 2016. This is an increase of<br />
three cents per gallon from 2015-16.<br />
• Adjusted annually by BOE to maintain revenue neutrality<br />
with the increase to State sales tax on diesel:<br />
o About 48% of revenue to the State.<br />
o About 52% of revenue to cities and counties.<br />
State Sales Tax on Gasoline<br />
• General Statewide sales tax on gasoline was eliminated July 1, 2010.<br />
State Sales Tax on Diesel<br />
(Available for Transportation Purposes)<br />
• 6.5% sales tax on diesel:<br />
• 4.75% base tax.<br />
• 1.75% additional tax, effective July 1, 2014.<br />
o About 64% of revenues to State Transit Assistance.<br />
o About 36% of revenues to the Public Transportation Account<br />
(PTA).<br />
Transportation Revenue Facts - Division of Budgets: Steven Keck, Chief (916) 654-4556<br />
• 44% to State Transportation Improvement Program (STIP).<br />
• 44% to Local Streets and Roads.<br />
22<br />
• 12% to State Highway Operation Protection Program (SHOPP).<br />
23<br />
Financial Information
Financial Information<br />
Transportation Revenue Facts (cont.)<br />
Weight Fees<br />
In addition to the revenue generated through fuel taxes, the<br />
State collects commercial vehicle registration fees, also known<br />
as “weight fees”. Weight fees are calculated by the Department<br />
of Motor Vehicles, based on the gross vehicle weight of<br />
commercial vehicles, and are deposited into the State<br />
Highway Account (SHA).<br />
Weight Fee Swap<br />
• In 2010, California voters passed Proposition 22, which<br />
amended the California Constitution by significantly<br />
restricting the State from using fuel excise tax revenues for<br />
General Fund (GF) relief, which was previously allowed.<br />
• In 2011, the passage of AB105 created a “weight fee swap”<br />
which allowed the State to use weight fee revenues, rather<br />
than fuel excise tax revenues for GF relief.<br />
• The bill authorizes the transfer of weight fee revenues from the<br />
SHA to the GF for transportation bond debt service and loans.<br />
• To offset this diversion, an equivalent amount of the pricebased<br />
excise tax is transferred to the SHA.<br />
State Gasoline Excise Tax History<br />
Effective Date Rate/gallon<br />
Notes<br />
July 1, 2016 $0.278 Decreased by 2.2 cents/gallon<br />
July 1, 2015 $0.300 Decreased by 6 cents/gallon<br />
July 1, 2014 $0.360 Decreased by 3.5 cents/gallon<br />
July 1, 2013 $0.395 Increased by 3.5 cents/gallon<br />
July 1, 2012 $0.360 Increased by .003 cent/gallon<br />
July 1, 2011 $0.357 Increased by .004 cent/gallon<br />
July 1, 2010 1 $0.353 Increased by 17.3 cents/gallon<br />
January 1, 1994 $0.180 Increased by one cent/gallon<br />
January 1, 1993 $0.170 Increased by one cent/gallon<br />
January 1, 1992 $0.160 Increased by one cent/gallon<br />
January 1, 1991 $0.150 Increased by one cent/gallon<br />
August 1, 1990 $0.140 Increased by five cents/gallon<br />
January 1, 1983 $0.090 Increased by two cents/gallon<br />
October 1, 1963 $0.070 Increased by one cent/gallon<br />
July 1, 1953 $0.060 Increased by 1.5 cents/gallon<br />
July 1, 1947 $0.045 Collier-Burns Act; Fuel tax increase by 1.5 cents/gal.<br />
July 29, 1927 $0.030 One cent/gal. added for new highway construction<br />
Financial Information<br />
Transportation Revenue Facts - Division of Budgets: Steven Keck, Chief (916) 654-4556<br />
October 1, 1923 $0.020 First gas tax approved by voters<br />
Note: State and Federal taxes for aviation fuel are not included in this summary.<br />
1<br />
ABX8 6 and ABX8 9 Fuel Tax Swap eliminated State Sales Tax on gasoline and replaced it with an<br />
increase to the Excise Tax on gasoline. Beginning July 2010, taxes will be adjusted annually by the<br />
Board of Equalization to maintain revenue neutrality with the loss of State Sales Tax on gasoline.<br />
Source: Fuel Tax History - California State Board of Equalization (BOE) website.<br />
http://www.boe.ca.gov/sptaxprog/tax_rates_stfd.htm#9<br />
http://www.boe.ca.gov/sutax/gasswapfaq.htm#1<br />
Gasoline Excise Tax History - Division of Budgets: Steven Keck, Chief (916) 654-4556<br />
24 25
Financial Information<br />
State Transportation Construction Capital<br />
Allocations (in Millions)<br />
and Jobs Created<br />
Capital Allocations<br />
Actual Actual Projected<br />
2013-14 2014-15 2015-16<br />
Proposition 1B 1 $246 $40 $50<br />
State Transportation<br />
Improvement Program (STIP)<br />
$519 $469 $481<br />
State Highway Operations and<br />
Protection Program (SHOPP) 2 $1,835 $1,883 $1,772<br />
Total Capital Allocations $2,600 $2,392 $2,303<br />
Total Gross State<br />
Product Gain<br />
Jobs Created - Actual And Projected<br />
Total Jobs Created<br />
in California<br />
$5,408 $4,975 $2,047<br />
Actual Actual Projected 3<br />
2013-14 2014-15 2015-16<br />
46,800 43,100 25,600<br />
1<br />
Includes STIP Augmentation and SHOPP Augmentation projects<br />
2<br />
Includes SHOPP Minor projects. Allocations per 4th Quarter Finance Report.<br />
3<br />
The economic multipliers for estimating jobs and value added (GDP) impacts from<br />
transportation infrastructure investments have been updated using the IMPLAN input/<br />
output model, base year 2013.<br />
Capital Allocations - Division of Transportation Programming:<br />
Bruce DeTerra, Chief (916) 654-4013<br />
Product Gain/Jobs Created - Division of Transportation Planning:<br />
Katie Benouar, Chief (916) 653-1818<br />
Countywide Transportation<br />
Sales Tax Measures<br />
Transit Districts (Permanent 0.5% Tax)<br />
• BART (Alameda, Contra Costa, San Francisco)<br />
• San Mateo • Santa Clara • Santa Cruz<br />
Countywide Transportation<br />
Sales Tax Measures 1 (cont.)<br />
Self-Help Counties - Temporary 0.5% Tax (in Millions)<br />
County<br />
Duration<br />
Est. 2016<br />
Revenue<br />
Alameda (Measure BB, 1% Tax) 2015-2045 $315<br />
Contra Costa 1989-2034 $85<br />
Fresno 1987-2027 $73<br />
Imperial 1990-2050 $17<br />
Los Angeles (1% Tax) Permanent $1,606<br />
Los Angeles (Measure R) 2009-2039 $803<br />
Madera 1990-2027 $9<br />
Marin 2005-2025 $27<br />
Napa (Measure T) 2 2018-2043 (Est.) -<br />
Orange 1991-2041 $345<br />
Riverside 1989-2039 $181<br />
Sacramento 1989-2039 $118<br />
San Bernardino 1990-2040 $184<br />
San Diego 1988-2048 $292<br />
San Francisco 1990-2034 $102<br />
San Joaquin 1991-2041 $57<br />
San Mateo 1989-2033 $87<br />
Santa Barbara 1990-2040 $38<br />
Santa Clara 1996-2036 (Est.) $218<br />
Santa Clara - (BART Ext 0.125%) 2013-2043 (Est.) $54<br />
Sonoma (0.25%) 2005-2025 $23<br />
Sonoma-Marin (SMART 0.25%) 2009-2029 $37<br />
Tulare 2007-2037 $34<br />
Total Estimated 2014 Revenue $4,689<br />
1<br />
Article XIIIB of the State Constitution provides the authority and requirements for the imposition<br />
of local sales tax measures subject to voter approval.<br />
2<br />
Napa will impose a one-half of one percent transactions and use tax for 25 years (Measure T).<br />
This tax will fund local street and road improvements and will be implemented once the Flood<br />
Protection tax (Measure A) expires. Measure A is expected to expire by 2018.<br />
Sales Tax Measure Data - Economic Analysis Branch - Division of Transportation Planning:<br />
Katie Benouar, Chief (916) 653-1818<br />
26 27<br />
Financial Information
Financial Information, Expenditures 1<br />
(in Billions)<br />
2015-16 Enacted Transportation<br />
Budget Expenditures<br />
FY 2015-16 Budget Proposed Enacted<br />
State Funds $4.199 40.0% $3.967 37.8%<br />
$10.5 Billion<br />
Federal Expenditure Authority $4.627 44.1% $4.845 46.2%<br />
Reimbursements $1.595 15.2% $1.595 15.2%<br />
Traffic Congestion Relief Fund $0.081 0.8% $0.081 0.8%<br />
Financial Information<br />
Total $10.502 100.0% $10,488 100.0%<br />
Category Of Expenditures Proposed Enacted<br />
State Operations $4.144 39.5% $4.130 39.4%<br />
Local Assistance $2.306 22.0% $2.306 22.0%<br />
Capital Outlay $4.052 38.6% $4.052 38.6%<br />
Total $10.502 100.0% $10.488 100.0%<br />
1<br />
Totals may not equal sum of components due to independent rounding.<br />
Financial Information - Division of Budgets: Steven Keck, Chief (916) 654-4556<br />
Capital Outlay<br />
38.6%<br />
$4.052 Billion<br />
Local Assistance<br />
22%<br />
$2.306 Billion<br />
State Operations<br />
39.4%<br />
$4.130 Billion<br />
State Operations<br />
Local Assistance<br />
Financial Information<br />
Capital Outlay<br />
Financial Data - Division of Budgets: Steven Keck, Chief (916) 654-4556<br />
28 29
Allocations<br />
FY 2014-15<br />
By Element<br />
(in Thousands)<br />
Program<br />
Capital Outlay<br />
Local<br />
Assistance<br />
Mass<br />
Transit<br />
Rail<br />
Total<br />
Allocation<br />
State Transportation Improvement Program (STIP) 1 $308,461 $61,043 $115,971 $12,756 $498,231<br />
State Highway Operation and Protection Program (SHOPP) Augmentation Feb 5 $3,409 $0 $0 $0 $3,409<br />
Proposition 1B 2<br />
Financial Information<br />
Corridor Mobility Improvement Account (CMIA) $0 $0 $0 $0 $0<br />
Route 99 Bond 0 $0 $0 $0 0<br />
State-Local Partnership Program (SLPP) $0 $0 $0 $0 $0<br />
Trade Corridor Improvement Fund (TCIF) 3 $25,500 $1,700 0 $16,600 $43,800<br />
Traffic Light Synchronization Program (TLSP) $0 $13,540 $0 $0 $13,540<br />
Intercity Rail Improvement $0 $0 $0 $108,000 $108,000<br />
Local Bridge Seismic Retrofit Program (LBSRP) $0 $7,020 $0 $0 $7,020<br />
Public Transit Modernization Improvement, and Service Enhancement Account (PTMISEA) 4 $0 $0 $654,285 $0 $654,285<br />
Highway-Railroad Crossing Safety Account (HRCSA) $0 ($3,023) $0 $0 ($3,023)<br />
Financial Information<br />
Proposition 1B Total $25,500 $19,240 $654,285 $124,600 $823,620<br />
1<br />
Includes Proposition 1B STIP Augmentation allocations.<br />
2<br />
Includes de-allocations that were a result of contract award savings.<br />
3<br />
Capital Outlay amount includes SHOPP/TCIF.<br />
4<br />
Source: Division of Rail and Mass Transportation Program Managers<br />
All Proposition 1B data Except PTMISEA - Division of Transportation<br />
Programming: Bruce DeTerra, Chief (916) 654-4013<br />
PTMISEA Data - Division of Rail and Mass Transportation:<br />
Bruce Roberts, Chief (916) 654-7293<br />
30 31
Financial Information<br />
Proposition 1B Program<br />
Transportation Bond Act - As of June 30, 2015 (in Thousands)<br />
Program Available Committed 1 Balance<br />
Caltrans (Dollars in Thousands)<br />
Corridor Mobility Improvement Account (CMIA) $4,500,000 $4,449,618 $382<br />
Route 99 Corridor Account (Rte 99) $1,000,000 $972,967 $27,033<br />
Trade Corridors Improvement Fund (TCIF) $2,000,000 $1,973,238 $26,762<br />
State Transportation Improvement Program (STIP) $2,000,000 $1,935,354 $64,646<br />
State Highway Operation and Protection Program<br />
(SHOPP)<br />
$500,000 $500,000 $0<br />
Traffic Light Synchronization Program (TLSP) $250,000 $250,000 $0<br />
State-Local Partnership<br />
Program (SLPP)<br />
$1,000,000 $1,000,000 $0<br />
Local Bridge Seismic Retrofit Account (LBSRA) $125,000 $125,000 $0<br />
Highway-Railroad Crossing Safety Account<br />
(HRCSA)<br />
$250,000 $248,470 $1,530<br />
Intercity Rail Improvement (IRI) $400,000 $400,000 $0<br />
Public Transportation Modernization,<br />
Improvement, and Service Enhancement Account $3,600,000 $3,444,368 $155,632<br />
(PTMISEA-Local Transit)<br />
Caltrans Total $15,625,000 $15,299,015 $275,985<br />
Non-Caltrans Dollars<br />
Local Street and Road, Congestion Relief, and<br />
Traffic Safety Account<br />
$2,000,000 $2,000,000 $0<br />
Goods Movement Emission<br />
Reduction Program<br />
$1,000,000 $1,000,000 $0<br />
School Bus Retrofit and<br />
Replacement Account<br />
$200,000 $200,000 $0<br />
Port, Harbor, and Ferry Terminal<br />
Security Account<br />
$100,000 $100,000 $0<br />
Transit System Safety, Security<br />
& Disaster Response Account<br />
$1,000,000 $749,260 $250,740<br />
Non-Caltrans Total $4,300,000 $4,049,260 $250,740<br />
Proposition 1B<br />
Transportation Bond Act<br />
As approved by the voters in the November 2006 general elections,<br />
Proposition 1B enacts the Highway Safety, Traffic Reduction, Air Quality,<br />
and Port Security Bond Act of 2006 to authorize $19.925 billion of<br />
state general obligation bonds for specified purposes, including highpriority<br />
transportation corridor improvements, State Route 99 corridor<br />
enhancements, trade infrastructure and port security projects, school<br />
bus retrofit and replacement purposes, state transportation improvement<br />
program augmentation, transit and passenger rail improvements, state-local<br />
partnership transportation projects, transit security projects, local bridge<br />
seismic retrofit projects, highway-railroad grade separation and crossing<br />
improvement projects, state highway safety and rehabilitation projects, and<br />
local street and road improvement, congestion relief, and traffic safety.<br />
$1 Billion<br />
State-Local Partnership<br />
Program Account<br />
$1 Billion<br />
Transit System Safety,<br />
Security, and Disaster<br />
Response Account<br />
$0.75 Billion<br />
State Highway Operation and<br />
Protection Program (SHOPP)<br />
$2 Billion<br />
Local Street and Roads,<br />
Congestion Relief, and Traffic<br />
Safety Account of 2006<br />
$0.575 Billion<br />
Other: School Bus Retrofit for Air Quality:<br />
Local Bridge Seismic Retrofit;<br />
Highway-Railroad Crossing Safety Account<br />
$1 Billion<br />
State Route 99<br />
Corridor<br />
$4.5 Billion<br />
Corridor Mobility<br />
Improvement Account<br />
Financial Information<br />
Proposition 1B Total $19,925,000 $19,348,275 $526,725<br />
1<br />
Total amounts programmed through June 30, 2015, including the two percent reserve for bond<br />
administration costs, except for Local Transit, which is the amount of funding awarded to local<br />
agencies as of that date, plus anticipated administrative costs.<br />
Financial Data - Division of Budgets: Steven Keck, Chief (916) 654-4556<br />
$4 Billion<br />
Public Transportation<br />
Modernization, Improvement,<br />
and Service Enhancement Account<br />
(includes Intercity Rail Improvement [IRI])<br />
$2 Billion<br />
State Transportation<br />
Improvement Program<br />
(STIP) Augmentation<br />
$3.1 Billion<br />
Ports Infrastructure,<br />
Security and Air Quality<br />
Financial Data - Division of Budgets: Steven Keck, Chief (916) 654-4556<br />
32 33
Maintenance, Operations, and Project Delivery<br />
Selected Maintenance Costs<br />
FY 2014-15 Actual Expenditures and Encumbrances (in Millions)<br />
Annual Maintenance and Repair of Bridges $169.9<br />
Non-Landscaped Weed Control $24.6<br />
Maintenance of Landscaped Property<br />
(28,330 irrigated, 3,062 non-irrigated landscape acres)<br />
$62.9<br />
Litter and Debris Removal $72.9<br />
Safety Roadside Maintenance and Cleanup<br />
(87 Roadside Rests Statewide)<br />
$15.6<br />
Highway Lighting 1 (80,122 luminaires) $27.0<br />
Highway Signalized Intersections 1<br />
(4,770 total highway signalized intersections)<br />
$14.5<br />
Lane Striping (81,115 linear miles) $10.4<br />
1<br />
Maintenance and power costs included, cost does not include utility bills paid directly by Locals.<br />
General Maintenance 1<br />
FY 2014-15 Actual Expenditures and Encumbrances (in Millions)<br />
Roadbed (HM 1) $347.4 29%<br />
Roadside (HM 2) $325.4 27%<br />
Bridges/Structures (HM 3) $169.9 14%<br />
Traffic Guidance and Electrical (HM 4) $125.1 11%<br />
Facility and Auxiliary Services (HM 5) $163.2 14%<br />
Snow and Storm Control (HM 6) $36.6 3%<br />
Radio (HM 7) $27.6 2%<br />
Total $1,195.2 100%<br />
1<br />
Includes: Highway Maintenance (HM) contracts, and State forces for Personal Services (PS) and<br />
Operating Expenses (OE).<br />
Maintenance Data - Division of Maintenance: Tony Tavares, Chief (916) 654-5849<br />
Adopt-A-Highway Program<br />
as of July 31, 2015<br />
Volunteer Adoptions 2,200<br />
Sponsored Adoptions 707<br />
Suspended Permits (still active, under construction, etc.) 54<br />
Total Adoptions 2,961<br />
Litter Removal Groups 2,008<br />
Graffiti Removal Groups 30<br />
Wildflower Groups 11<br />
Tree Planting Groups 38<br />
Vegetation Management Groups 113<br />
Estimated Shoulder Miles Adopted for Litter Removal 9,475<br />
Amount of Litter Collected (cubic yards) in FY 2014-15 13,361<br />
Estimated Acreage for:<br />
Wildflower<br />
Vegetation Management<br />
Tree Planting<br />
34 35<br />
33<br />
565<br />
114<br />
Estimated Participants 12,810<br />
Estimated Value of Litter Collection to the State<br />
$19.95 Million<br />
Adopt-A-Highway Data - Division of Maintenance: Tony Tavares, Chief (916) 654-5849<br />
Roadside<br />
Vista Points 1 ............................................................................. 146<br />
Roadside Rest Areas 2 ................................................................. 87<br />
1<br />
Park and Rides and Vista Points are “location types” not adoption types, therefore they are not<br />
tracked separately. For example, a litter removal adoption may be located at a park and ride.<br />
2<br />
Adoptions are not permitted at rest areas.<br />
Roadside Data - Division of Design: Tim Craggs, Chief (916) 654-3858<br />
Maintenance, Operations, and Project Delivery
Maintenance, Operations, and Project Delivery<br />
Seismic Retrofit Program<br />
As of December 31, 2015<br />
Bridge Type Total Number Completed Percent Complete<br />
State Owned 2,194 2,194 100%<br />
Toll 11 1 10 2 99%<br />
Local 1,242 1065 3 86%<br />
1<br />
Coronado and Vincent Thomas Bridges are in the program but are no longer tolled.<br />
2<br />
The East span of the San Francisco-Oakland Bay Bridge is now open to traffic but remains under<br />
construction, including completion of ramps and demolition of the old span.<br />
3<br />
Bay Area Rapid Transit (BART) requested removal of bridges from the Local Bridge Seismic<br />
Retrofit Program to be completed by BART.<br />
State Data - Division of Project Management: James Davis, Chief (916) 654-2494<br />
Local Data - Division of Local Assistance: Rihui (Ray) Zhang, Chief (916) 653-1776<br />
Toll Data - Dan McElhinney, Chief Deputy District Director Caltrans District 4 -<br />
(510) 220-0738 (cell)<br />
Highway Maintenance Pavement Costs<br />
FY 2013-14<br />
SHOPP Pavement................................................. .....$833 Million<br />
Annual Pavement Maintenance Expenditure...........$231 Million<br />
(Support not included.)<br />
Pavement Condition<br />
Percent of Distressed Lane Miles<br />
Year<br />
% of Distressed<br />
2015 16%<br />
2014 Not Available<br />
2013 16%<br />
2012 15%<br />
2011 25%<br />
2008-10 Not Available<br />
2007 26%<br />
2006 27%<br />
2005 28%<br />
Pavement Cost and Condition Data - Division of Maintenance:<br />
Tony Tavares, Chief (916) 654-5849<br />
Equipment<br />
In-service Fleet Count by Category - February 3, 2016<br />
Equipment Category<br />
Number of Units<br />
Passenger Vehicles 1,830<br />
Light Commercial 1,928<br />
Light Duty Utility Vehicles 1,544<br />
Light Duty Trucks 1,704<br />
Medium Duty Trucks 1,287<br />
Heavy Duty Trucks 545<br />
Road Maintenance Equipment 950<br />
Landscape Maintenance Equipment 339<br />
Construction Equipment 609<br />
Snow Equipment 212<br />
Industrial Equipment 263<br />
Trailers 655<br />
Other (Boats, Chain Control Campers, Barrier Machines) 29<br />
Total 11,895<br />
Other Equipment Statistics<br />
Number of Main Shops................................................................... 13<br />
Number of Sub-Shops..................................................................... 13<br />
Number of Home Storage Permits<br />
Allocated to Caltrans............................................................... 421<br />
Equipment Data - Division of Equipment: Larry Orcutt, Chief (916) 227-9600<br />
36 37<br />
Maintenance, Operations, and Project Delivery
Maintenance, Operations, and Project Delivery<br />
Transportation Management Systems (TMS)<br />
as of January 2016 (unless otherwise noted)<br />
Closed Circuit Cameras...............................................2,333<br />
Changeable Message Signs............................................. 834<br />
Extinguishable Message Signs........................................ 563<br />
Highway Advisory Radios.............................................. 182<br />
Roadside Weather Information Stations (RWIS)..... 142<br />
Ramp Meters.................................................................2,802<br />
Traffic Signals (State Owned) ................................... 6,247<br />
Freeway Vehicle Detection Stations.........................16,819<br />
Mainline................................................................8,930<br />
HOV (Carpool).................................................. 2,044<br />
On-Ramps............................................................ 2,950<br />
Off-Ramps............................................................2,174<br />
Fwy to Fwy Connectors.......................................... 506<br />
Collector/Distributor............................................... 58<br />
TMS Uptime (Non-detection) [December 2015].... 88.2%<br />
TMS Detection Health ............................................. 64.9%<br />
Traffic Management Centers............................................ 13<br />
24/7 Operation (with CHP Call Centers)<br />
[Located in Districts 3, 7, 8, 11, and 12]............................5<br />
24/7 Operation (not with CHP Call Centers)<br />
[Located in Districts 4,6,10, and 3 (Kingvale) seasonally].....4<br />
16 hrs Operation (Mon-Fri / on-call weekends)<br />
[Located in Districts 1, 2 , 5, and 9]..................................4<br />
Traveler Services<br />
as of December 2015 (unless otherwise noted)<br />
QuickMap Web Visits................................................. 2,639,816<br />
Freeway Service Patrol - Fiscal Year 2014-15<br />
Disabled Vehicle Assists......................................... 661,785<br />
Centerline Lane Miles Served....................................1,808<br />
Days Safety Campaigns Posted on<br />
Changeable Message Signs ............................................ 130<br />
Managed Facilities<br />
as of July 2015 (unless otherwise noted)<br />
Park and Ride Lots 1 ( January 2016).................................... 322<br />
HOV (Carpool) Lanes [in lane miles]<br />
In Operation................................................................. 1,477<br />
Under Construction........................................................ 112<br />
Proposed........................................................................... 776<br />
HOV (Carpool) Lane Vehicle Access 2 (December 2015)<br />
Registered White Clean Air Vehicle Stickers......... 94,760<br />
Registered Green Clean Air Vehicle Stickers......... 85,000<br />
Express Lanes 3 (in lane miles)<br />
In Operation................................................................. 224<br />
Under Construction.......................................................... 50<br />
Proposed........................................................................1,298<br />
1<br />
Includes State-owned lots, privately owned lots, and lots operating under a cooperative agreement<br />
with other agencies.<br />
2<br />
HOV Lane Vehicle Access Data is obtained from Department of Motor Vehicles (DMV)<br />
3<br />
An Express Lane or High Occupancy Toll (HOT) Lane is a High Occupancy Vehicle (HOV or<br />
carpool) lane in which motorist may drive alone if they pay a toll.<br />
Transportation Management, Traveler Services, and Managed Lanes Data -<br />
Division of Traffic Operations: Thomas Hallenbeck, Chief (916) 654-2352<br />
Maintenance, Operations, and Project Delivery<br />
38 39
Maintenance, Operations, and Project Delivery<br />
Traffic Congestion<br />
as of December 2015<br />
Annual Vehicle Hours of Delay 1 .......................... 123 Million<br />
Traffic Census<br />
as of January 2016<br />
Total Count Sites in Traffic Census Network...................2,953<br />
Continuous Weigh-In-Motion (WIM) Stations 2 ........... 134<br />
Permits<br />
as of December 2015<br />
Encroachment Permits Issued (FY 2014-15).................11,594<br />
Permitted Outdoor Advertising (Displays) 3 .....................8,831<br />
Commercial Vehicle Services<br />
FY 2014-15<br />
Oversize/Overweight Permits Issued 4 ...........................147,588<br />
Commercial Vehicle Enforcement Facilities .......................... 54<br />
1<br />
Congestion is measured on urban freeways when speeds are less than 35 mph.<br />
2<br />
WIM Stations include pre-pass and by-pass.<br />
3<br />
Includes all types of permitted displays.<br />
4<br />
Includes all types of transportation permits.<br />
Traffic Congestion, Traffic Census, Permits, and Commercial Vehicle Services Data -<br />
Division of Traffic Operations: Thomas Hallenbeck, Chief (916) 654-2352<br />
Statewide Collisions in Construction/Repair<br />
Zones on California State Highways1<br />
1<br />
Numbers represent collisions on state highway facilities where the roadway condition identified<br />
by the reporting officer was ‘Construction/Repair Zone’ and not necessarily occurring within the<br />
coned area of a construction/repair zone. The most recent full year of data is 2013.<br />
2<br />
1999 Slow For The Cone Zone Campaign implemented.<br />
40 41<br />
Year<br />
Collisions<br />
Total Fatal Injury<br />
Number of<br />
Fatalities<br />
Number<br />
of Injuries<br />
2013 5,874 47 1,822 51 2,745<br />
2012 4,940 44 1,592 47 2,439<br />
2011 4,005 37 1,313 42 2,079<br />
2010 3,050 30 1,014 40 1,583<br />
2009 3,813 37 1,180 48 1,836<br />
2008 4,374 43 1,364 45 2,062<br />
2007 5,163 42 1,553 47 2,339<br />
2006 5,606 60 1,741 77 2,742<br />
2005 4,586 45 1,462 67 2,322<br />
2004 4,094 29 1,369 35 2,166<br />
2003 4,564 40 1,456 51 2,482<br />
2002 5,110 36 1,518 39 2,500<br />
2001 4,898 40 1,480 48 2,379<br />
2000 5,359 41 1,612 47 2,708<br />
1999 2 6,436 45 1,886 54 3,148<br />
1998 6,901 44 2,140 54 3,537<br />
1997 5,755 39 1,936 51 3,230<br />
1996 6,075 53 1,960 63 3,119<br />
1995 6,384 46 2,034 62 3,338<br />
Collision Data in Construction Zones - Traffic Accident Surveillance and Analysis System<br />
(TASAS) Data - Division of Research, Innovation, and System Information:<br />
Jim Appleton, Chief (916) 654-8877<br />
Maintenance, Operations, and Project Delivery
Maintenance, Operations, and Project Delivery<br />
Year<br />
Collision Data on California<br />
State Highways<br />
Collisions Number of Fatality<br />
Rate (Per<br />
Total Fatal Injury Fatalities Injuries 100 MVM 1 )<br />
2013 150,821 1,105 51,378 1,214 75,070 0.67<br />
2012 146,581 1,083 50,667 1,210 73,745 0.67<br />
2011 142,310 1,060 47,686 1,167 69,834 0.66<br />
2010 145,685 1,009 48,474 1,121 70,701 0.64<br />
2009 142,221 1,159 47,673 1,303 69,964 0.74<br />
2008 149,225 1,288 49,827 1,429 72,770 0.81<br />
2007 169,807 1,497 55,884 1,713 82,614 0.94<br />
2006 177,839 1,628 57,269 1,841 85,972 1.01<br />
2005 182,714 1,694 59,856 2,006 90,963 1.10<br />
2004 182,509 1,609 60,042 1,841 92,330 1.02<br />
2003 179,172 1,616 58,240 1,892 90,801 1.08<br />
2002 176,882 1,592 56,521 1,873 89,348 1.09<br />
2001 174,882 1,544 56,957 1,770 90,374 1.05<br />
1<br />
MVM = Million Vehicle Miles<br />
Source: Collision Data Annual Publication.<br />
Collision Data on State Highways - TASAS Data - Division of Research, Innovation, and<br />
System Information: Jim Appleton, Chief (916) 654-8877<br />
Traffic Safety Projects<br />
& Safety Investigations<br />
FY 2014-15<br />
Number of Safety Projects............................................................. 57<br />
Safety Projects Cost.................................................. $187.7 Million<br />
Safety Investigations....................................... Approximately 2,800<br />
Traffic Safety Project Data - Division of Traffic Operations:<br />
Thomas Hallenbeck, Chief (916) 654-2352<br />
Asset Delivery 1<br />
Fiscal Year 2014-15<br />
Mobility<br />
HOV Lanes (new lane miles) 65.59<br />
Mixed Flow Lanes (new lane miles) 73.55<br />
Operational Lanes (new lane miles) 13.22<br />
New Structures (each) 17<br />
Roadway Rehabilitation (lane miles) 2796.9<br />
Structure Rehabilitation (each) 729<br />
Transportation Management System (TMS) Elements Installed 2 214<br />
Environmental<br />
Landscaping (acres) 325.18<br />
Soundwall (linear miles) 8.29<br />
Asset Definitions<br />
HOV Lanes - Any lane designated for high occupancy vehicles that is added to the<br />
highway system.<br />
Mixed Flow Lanes - Any highway lanes that are not HOV and that are added to the<br />
existing system.<br />
Operational Lanes - Turnouts, passing lanes, truck climbing lanes.<br />
Structure - Underpass, Overhead, Bridge and Overhead, Viaduct, Bridge, Overcrossing,<br />
Undercrossing, Separation.<br />
Roadway Rehabilitation - Restoration and major maintenance of roadway lanes and<br />
other pavement life extension work.<br />
Structure Rehabilitation - Restoration and major maintenance of a structure, and other<br />
structure life extension work.<br />
Landscaping - Planting that provides safety improvements, erosion control/storm water<br />
pollution prevention, highway revegetation, and required mitigation planting<br />
Soundwall - Typically reinforced concrete with a height of 8 to 16 feet depending on<br />
design needs.<br />
TMS Elements Installed - Field elements used in the management and operation of the<br />
transportation system including: closed-circuit televisions, changeable message signs,<br />
extinguishable message signs, highway advisory radios, roadside weather information<br />
stations, ramp meters, vehicle detection, or signals.<br />
1<br />
All data, except the TMS Elements Installed, is based on the estimated Construction Completion<br />
Acceptance date, and is collected as part of the Project Plans, Specifications, and Estimate (PS&E)<br />
submittal process in the Office Engineer, Division of Engineering Services.<br />
2<br />
TMS Elements vary with items installed each year; this category is reported as one.<br />
Asset Delivery and Asset Definitions - Division of Research, Innovation, and System Information:<br />
Jim Appleton, Chief (916) 654-8877<br />
TMS Elements Installed Data and Definition - Division of Traffic Operations:<br />
Thomas Hallenbeck, Chief (916) 654-2352<br />
42 43<br />
Maintenance, Operations, and Project Delivery
Appendix<br />
Caltrans Fact Booklet Frequently Asked Questions<br />
Appendix<br />
Appendix ....................................................................... 48-53<br />
Caltrans Fact Booklet<br />
Frequently Asked Questions ........................... 49<br />
Web Resources .......................................................... 50-51<br />
Caltrans District Offices and District Directors .... 52-53<br />
Is the Caltrans Fact Booklet (CFB) available online?<br />
The CFB is available on our internal website at:<br />
http://onramp.dot.ca.gov/docs/CaltransFactBooklet.pdf<br />
The booklet is available on the internet at:<br />
http://www.dot.ca.gov/hq/tsip/data_library/CFB/2016_CFB.pdf<br />
What years are reported in the CFB?<br />
Each division or program reports the latest data they have available.<br />
Data are reported using California (State) Fiscal Years or calendar<br />
years if years are noted singularly. If Federal Fiscal years are used, this<br />
is noted on the table as FFY.<br />
What is the current production schedule for the CFB?<br />
The CFB is scheduled to be produced approximately the fifth month<br />
of the calendar year.<br />
Who maintains final production approval?<br />
Caltrans Division of Public Affairs<br />
Who is in charge of compilation and production of the CFB?<br />
Division of Research, Innovation, and System Information:<br />
Jim Appleton, Chief (916) 654-8877<br />
Frequently Asked Questions<br />
Contacts:<br />
Paulette Lautaret........................................................(916) 657-4726<br />
paulette.lautaret@dot.ca.gov<br />
Jahangir Kashkooli.....................................................(916) 654-8170<br />
jahangir.kashkooli@dot.ca.gov<br />
44<br />
45
Caltrans Web Resources<br />
Caltrans’ Internet Home: External Caltrans site<br />
www.dot.ca.gov<br />
Caltrans’ Intranet Home: Internal Caltrans site<br />
onramp.dot.ca.gov<br />
Accounting: CT Travel Guide/Vendor Pmts/EFT/<br />
www.dot.ca.gov/hq/asc/index.htm<br />
Active Transportation Program (ATP)<br />
www.dot.ca.gov/hq/LocalPrograms/atp/<br />
Adopt-A-Hwy Program: Organizations help maintain sections<br />
adopt-a-highway.dot.ca.gov<br />
Advertised Projects: Projects for bid<br />
www.dot.ca.gov/hq/esc/oe/weekly_ads/index.php<br />
Alternative Fuels Locator: US Dept of Energy<br />
www.afdc.energy.gov/locator/stations/<br />
Amtrak California: Timetables/Stations/Routes/Deals<br />
www.amtrak.com/home/<br />
Aviation Planning/Engineering/Permits/Grants<br />
www.dot.ca.gov/hq/planning/aeronaut/<br />
CA Transportation Commission: Hwy/Passenger Rail/Transit<br />
Improvements in CA - www.catc.ca.gov<br />
California Road System (CRS) Maps<br />
www.dot.ca.gov/hq/tsip/hseb/crs_maps/<br />
California Transportation Plan (CTP)<br />
www.dot.ca.gov/hq/tpp/californiatransportationplan2040/index.shtml<br />
Caltrans Construction Contract Standards<br />
www.dot.ca.gov/hq/esc/oe/standards.php<br />
Caltrans Earth Web-based Transportation Database<br />
www.dot.ca.gov/hq/tsip/gis/caltrans_earth/overview.php<br />
Caltrans Improvement Project<br />
www.dot.ca.gov/CIP<br />
Caltrans Local District Offices<br />
www.dot.ca.gov/localoffice.htm<br />
Caltrans Performance Measurement System (PeMS)<br />
http://pems.dot.ca.gov/<br />
Web Re sources<br />
Caltrans Projects<br />
www.dot.ca.gov/projects.htm<br />
Caltrans Statewide Press Releases<br />
www.dot.ca.gov/hq/paffairs/news/pressrel/<br />
Contract Awards Services<br />
dot.ca.gov/hq/esc/oe/contract_awards_services.html<br />
Environmental Analysis<br />
www.dot.ca.gov/hq/env/<br />
FAST Act/MAP-21<br />
FAST Act FHWA - www.fhwa.dot.gov/fastact/<br />
Office of the Federal Liaison - www.dot.ca.gov/fedliaison/aboutUs.shtm<br />
Programming - www.dot.ca.gov/hq/transprog/map21/map21.htm<br />
Live Traffic Cameras: State freeway roadside monitoring<br />
video.dot.ca.gov<br />
Local Assistance Program Information<br />
www.dot.ca.gov/hq/LocalPrograms/programInformation.htm<br />
Mile Marker: A Caltrans Performance Report<br />
dot.ca.gov/ctjournal/MileMarker/index.html<br />
National Highway System (NHS)<br />
www.dot.ca.gov/hq/tsip/hseb/nhs.html<br />
Public Mailing Lists - Send messages to members/subscribe<br />
lists.dot.ca.gov/mailman/listinfo<br />
QuickMap - Real-time Traffic Google Map<br />
quickmap.dot.ca.gov<br />
Standard Environmental Reference (SER)<br />
Environmental document Procedures - www.dot.ca.gov/ser/<br />
State Planning (CA Transp Plan, CA Interregional Blueprint)<br />
www.dot.ca.gov/hq/tpp/offices/osp/index.html<br />
Traffic Census-Traffic Volumes-Monthly Vehicle Miles of Travel<br />
traffic-counts.dot.ca.gov<br />
Work Zone Safety: “Slow for the Cone Zone” travel trips<br />
www.dot.ca.gov/hq/maint/workzone/<br />
46 47<br />
Caltrans Web Resources
Caltrans District Offices<br />
District 1<br />
District 2<br />
District 3<br />
District 4<br />
District 5<br />
Caltrans District Offices<br />
1656 Union St. ................................................. Director:<br />
Eureka, CA 95501<br />
Charlie Fielder<br />
(707) 445-6600 - TTY: 707-445-6600<br />
www.dot.ca.gov/dist1/<br />
district1.onramp.dot.ca.gov/- internal<br />
1657 Riverside Dr. ........................................... Director:<br />
Redding, CA 96001<br />
Dave Moore<br />
(530) 225-3426 - TTY: 530-225-2019<br />
www.dot.ca.gov/dist2/<br />
district2.onramp.dot.ca.gov/- internal<br />
703 B St. ............................................................. Director:<br />
Marysville, CA 95901 Amarjeet S. Benipal<br />
(530) 741-4211 - TTY: 530-741-4509<br />
www.dot.ca.gov/dist3/<br />
northregion.dot.ca.gov/ - N Region/Dist 3 internal<br />
111 Grand Ave. ................................................. Director:<br />
Oakland, CA 94612<br />
Bijan Sartipi<br />
(510) 286-4444 - TTY: 510-286-4454<br />
www.dot.ca.gov/dist4/<br />
d4web.dot.ca.gov/ - internal<br />
50 Higuera St. ................................................... Director:<br />
San Luis Obispo, CA 93401 Timothy M. Gubbins<br />
(805) 549-3111 - TTY: 805-549-3259<br />
www.dot.ca.gov/dist05/<br />
wwwd5.dot.ca.gov/ - internal<br />
and District Directors<br />
District 7<br />
District 8<br />
District 9<br />
100 S. Main St., Ste. 100 ................................ Director:<br />
Los Angeles, CA 90012 .........................Carrie Bowen<br />
(213) 897-3656 - TTY: 213-897-9797<br />
www.dot.ca.gov/dist07/<br />
t7www2/cmsms/ - internal<br />
464 W. 4th St., 12th Floor ............................. Director:<br />
San Bernardino, CA 92401 ...................John Bulinski<br />
(909) 383-4561 - TTY: 909-383-6300<br />
www.dot.ca.gov/dist8/<br />
district8.onramp.dot.ca.gov/ - internal<br />
500 South Main St. ......................................... Director:<br />
Bishop, CA 93514 .....................................Brent Green<br />
(760) 872-0601 - TTY: 760-872-9043<br />
www.dot.ca.gov/dist9/<br />
d09web/ - internal<br />
District 10 1976 E. Martin Luther .................................... Director:<br />
King Jr. Blvd. .......................................... Dennis T. Agar<br />
Stockton, CA 95205<br />
(209) 948-7543 - TTY: 800-735-3922<br />
www.dot.ca.gov/dist10/<br />
district10.onramp.dot.ca.gov/ - internal<br />
District 11 4050 Taylor St. .................................................. Director:<br />
San Diego, CA 92110 ..........................Laurie Berman<br />
(619) 688-6699 - TTY: 619-688-6650 (or -8850)<br />
www.dot.ca.gov/dist11/<br />
onramp/dist11/main.php - internal<br />
District 6 1352 W. Olive Ave. .......................................... Director:<br />
Fresno, CA 93728<br />
Sharri Bender Ehlert<br />
District 12 3337 Michelson Dr., Ste. 100 ........................ Director:<br />
(559) 488-2409 - TTY: 559-488-4066<br />
Irvine, CA 92612 ............................Ryan Chamberlain<br />
www.dot.ca.gov/dist6/<br />
(949) 724-2000 - TTY: 949-756-7313<br />
d06web/ - internal<br />
www.dot.ca.gov/dist12/<br />
tcweb.dot.ca.gov/- internal<br />
48 49<br />
Caltrans District Offices
DEL<br />
NORTE<br />
SISKIYOU<br />
MODOC<br />
Caltrans Districts and<br />
CA Counties<br />
1 2<br />
SHASTA<br />
HUMBOLDT<br />
TRINITY REDDING<br />
EUREKA<br />
LASSEN<br />
TEHAMA<br />
MENDOCINO<br />
LAKE<br />
SONOMA<br />
4<br />
MARIN<br />
OAKLAND<br />
SAN FRANCISCO<br />
GLENN<br />
COLUSA<br />
NAPA<br />
SAN<br />
MATEO<br />
SANTA<br />
CRUZ<br />
YOLO<br />
SOLANO<br />
BUTTE<br />
SUTTER<br />
3<br />
PLACER<br />
SAN<br />
JOAQUIN<br />
PLUMAS<br />
NEVADA<br />
SIERRA<br />
CONTRA<br />
TUOLUMNE<br />
COSTA STOCKTON<br />
ALAMEDA<br />
MARIPOSA<br />
SANTA<br />
CLARA<br />
YUBA<br />
MARYSVILLE<br />
SACRA-<br />
MENTO<br />
AMA-<br />
HQ DOR<br />
STANISLAUS<br />
SAN<br />
BENITO<br />
EL DORADO<br />
CALAVERAS<br />
MERCED<br />
10<br />
MADERA<br />
FRESNO<br />
ALPINE<br />
FRESNO<br />
MONO<br />
BISHOP<br />
1<br />
9<br />
INYO<br />
MONTEREY<br />
SAN LUIS<br />
OBISPO<br />
5<br />
SAN LUIS<br />
OBISPO<br />
KINGS<br />
SANTA BARBARA<br />
6<br />
TULARE<br />
VENTURA<br />
KERN<br />
LOS ANGELES<br />
1<br />
The District 9 boundary changed on November 1,<br />
2015 to include a part of Kern County in District 6.<br />
The official order was signed on October 30, 2015,<br />
encompassing all functions, and went into effect on<br />
November 1, 2015.<br />
LOS ANGELES<br />
ORANGE<br />
SAN DIEGO<br />
SAN BERNARDINO<br />
7 8<br />
IRVINE<br />
12<br />
SAN DIEGO<br />
SAN BERNARDINO<br />
RIVERSIDE<br />
11<br />
IMPERIAL<br />
Design and layout by Caltrans HQ Graphic Services