- Page 1 and 2: Eleventh Five Year Plan 2007-12 Vol
- Page 3 and 4: 1 YMCA Library Building, Jai Singh
- Page 5: iv Contents 8.3 IT and IT-Enabled S
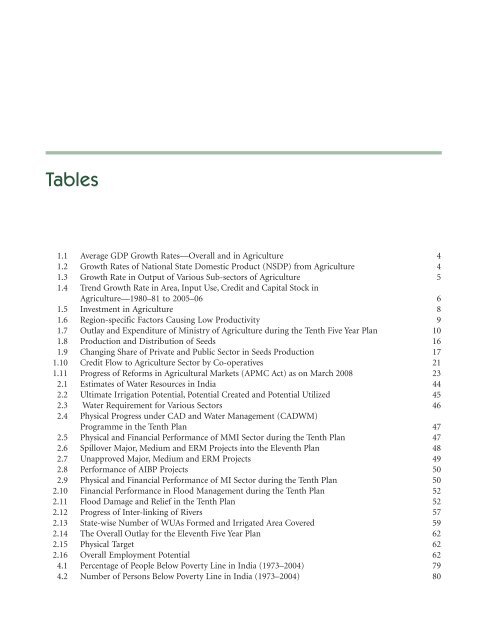
- Page 9 and 10: viii Tables 10.16 Fuel Requirement
- Page 11 and 12: 1 Boxes 1.1 Strengths and Weaknesse
- Page 13 and 14: 1 Annexures 1.1 Plan Outlays for th
- Page 15 and 16: 1 Acronyms 3G Third Generation A&N
- Page 17 and 18: xvi Acronyms CII Confederation of I
- Page 19 and 20: xviii Acronyms GDCF Gross Domestic
- Page 21 and 22: xx Acronyms JSPL Jindal Steel and P
- Page 23 and 24: xxii Acronyms NEC North Eastern Coa
- Page 25 and 26: xxiv Acronyms PSU Public Sector Und
- Page 27 and 28: xxvi Acronyms UNCTAD United Nations
- Page 30 and 31: 1 Agriculture INTRODUCTION 1.1 Alth
- Page 32 and 33: TABLE 1.3 Growth Rate in Output of
- Page 34 and 35: prices with each other and with wor
- Page 36 and 37: is a need to encourage a ‘group a
- Page 38 and 39: AREAS OF CONCERN IN IMPORTANT EXIST
- Page 40 and 41: prophylactics will go a long way in
- Page 42 and 43: esources. Horizontal expansion of p
- Page 44 and 45: Year TABLE 1.9 Changing Share of Pr
- Page 46 and 47: existing nurseries lack modern infr
- Page 48 and 49: and godowns. As alternate formal so
- Page 50 and 51: new markets to be established by pr
- Page 52 and 53: growth in the sector should result
- Page 54 and 55: Strengths Box 1.1 Strengths and Wea
- Page 56 and 57:
MODERNIZATION OF MANAGEMENT OF LAND
- Page 58 and 59:
extending these provisions to the n
- Page 60 and 61:
and also to increase agricultural p
- Page 62 and 63:
One model modernization project sho
- Page 64 and 65:
DIVERSIFICATION 1.138 Available dem
- Page 66 and 67:
to ensure women’s rights to land
- Page 68 and 69:
ANNEXURE 1.1 Plan Outlays for the C
- Page 70 and 71:
2 Water Management and Irrigation I
- Page 72 and 73:
needs to take care of river ecosyst
- Page 74 and 75:
of canals deprives farmers at the t
- Page 76 and 77:
to the end of the annual rolling pl
- Page 78 and 79:
2.34 The rapid development of groun
- Page 80 and 81:
2.43 The Prime Minister has announc
- Page 82 and 83:
additional potential of 1.0 MH by t
- Page 84 and 85:
stress condition threshold value of
- Page 86 and 87:
TABLE 2.13 State-wise Number of WUA
- Page 88 and 89:
For the northern tributaries of the
- Page 90 and 91:
THE WAY FORWARD 2.89 The measures s
- Page 92 and 93:
3 Forest INTRODUCTION 3.1 National
- Page 94 and 95:
to empower all participatory instit
- Page 96 and 97:
(NTFP) resources including medicina
- Page 98 and 99:
patterns of degradation, and state
- Page 100 and 101:
ways. The protected areas and the a
- Page 102 and 103:
PROJECT TIGER 3.51 The Tenth Plan p
- Page 104:
II Rural Development
- Page 107 and 108:
80 Eleventh Five Year Plan lakhs in
- Page 109 and 110:
82 Eleventh Five Year Plan 4.15 Lan
- Page 111 and 112:
84 Eleventh Five Year Plan POVERTY
- Page 113 and 114:
86 Eleventh Five Year Plan reductio
- Page 115 and 116:
88 Eleventh Five Year Plan conserva
- Page 117 and 118:
90 Eleventh Five Year Plan (iii) Ex
- Page 119 and 120:
92 Eleventh Five Year Plan priority
- Page 121 and 122:
94 Eleventh Five Year Plan adhering
- Page 123 and 124:
96 Eleventh Five Year Plan BPL Cens
- Page 125 and 126:
98 Eleventh Five Year Plan 4.97 Und
- Page 127 and 128:
100 Eleventh Five Year Plan ANNEXUR
- Page 129 and 130:
102 Eleventh Five Year Plan ANNEXUR
- Page 131 and 132:
5 Ensuring Rural and Urban Liveliho
- Page 133 and 134:
106 Eleventh Five Year Plan making
- Page 135 and 136:
108 Eleventh Five Year Plan TABLE 5
- Page 137 and 138:
110 Eleventh Five Year Plan BETTER
- Page 139 and 140:
112 Eleventh Five Year Plan Challen
- Page 141 and 142:
114 Eleventh Five Year Plan The Way
- Page 143 and 144:
116 Eleventh Five Year Plan farming
- Page 145 and 146:
118 Eleventh Five Year Plan domesti
- Page 147 and 148:
120 Eleventh Five Year Plan 5.82 Th
- Page 149 and 150:
122 Eleventh Five Year Plan MARKETI
- Page 151 and 152:
124 Eleventh Five Year Plan co-ordi
- Page 153 and 154:
126 Eleventh Five Year Plan 5.111 T
- Page 155 and 156:
128 Eleventh Five Year Plan buildin
- Page 157 and 158:
130 Eleventh Five Year Plan compone
- Page 159 and 160:
132 Eleventh Five Year Plan covered
- Page 161 and 162:
134 Eleventh Five Year Plan accredi
- Page 163 and 164:
136 Eleventh Five Year Plan schools
- Page 166 and 167:
7 Industry 7.1 INDUSTRY INCLUDING S
- Page 168 and 169:
TABLE 7.1.3 Trends in the Performan
- Page 170 and 171:
India against China (34.5%) in year
- Page 172 and 173:
eserved for the public sector and f
- Page 174 and 175:
infrastructure remained many notche
- Page 176 and 177:
food, beverages, and tobacco showed
- Page 178 and 179:
FERTILIZER FEEDSTOCK/NATURAL GAS 7.
- Page 180 and 181:
encourage innovation through fiscal
- Page 182 and 183:
approved revival schemes in respect
- Page 184 and 185:
7.1.87 There are about 24 instituti
- Page 186 and 187:
7.1.94 A new scheme for SEZs has be
- Page 188 and 189:
Meghalaya for about 41%. The experi
- Page 190 and 191:
could not take off during the Tenth
- Page 192 and 193:
7.1.127 The DBT took up a new schem
- Page 194 and 195:
Source: Working Group on Automotive
- Page 196 and 197:
per annum and the capacity utilizat
- Page 198 and 199:
continues to be the main fuel for t
- Page 200 and 201:
Source: Report of the Task Force on
- Page 202 and 203:
ate of 20%-26%. Industry estimates
- Page 204 and 205:
egulatory bodies. To meet the futur
- Page 206 and 207:
STRATEGIES 7.1.220 The most importa
- Page 208 and 209:
The tanneries in the country have l
- Page 210 and 211:
ecome imperative that there is a pa
- Page 212 and 213:
plastic professionals during the El
- Page 214 and 215:
international market. However, a gr
- Page 216 and 217:
7.1.293 The Indian steel industry h
- Page 218 and 219:
BUFFER STOCKS 7.1.305 In order to a
- Page 220 and 221:
2005-06 was 15.96 lakh mt. In contr
- Page 222 and 223:
7.1.331 In order to continue the st
- Page 224 and 225:
increased from about 1 million priv
- Page 226 and 227:
7.1.351 Non-traditional products ac
- Page 228 and 229:
Source: RBI and Ministry of SSI, Go
- Page 230 and 231:
limits of excise exemptions. During
- Page 232 and 233:
processing, and other cultural indu
- Page 234 and 235:
economically important minerals. Ba
- Page 236 and 237:
dependent on the import of copper m
- Page 238 and 239:
(SDF), especially tailored to the c
- Page 240 and 241:
TABLE 7.2.2 Minerals—Unrealized P
- Page 242 and 243:
Act 1986, which lay down the law th
- Page 244 and 245:
ANNEXURE 7.1.1 Industrial Investmen
- Page 246 and 247:
ANNEXURE 7.1.4 Performance of CPSEs
- Page 248 and 249:
Industry 221 ANNEXURE 7.1.6 State-w
- Page 250 and 251:
ANNEXURE 7.1.9 Production of Chemic
- Page 252 and 253:
ANNEXURE 7.1.14 Production, Import
- Page 254 and 255:
ANNEXURE 7.1.19 The Tenth Plan Outl
- Page 256 and 257:
ANNEXURE 7.1.22 Participation of Wo
- Page 258 and 259:
Annexure 7.1.23 (contd.) Scheme/Goa
- Page 260 and 261:
Industry 233 ANNEXURE 7.2.3 Estimat
- Page 262 and 263:
ANNEXURE 7.2.7 Physical Targets Pro
- Page 264:
IV Services
- Page 267 and 268:
240 Eleventh Five Year Plan multipl
- Page 269 and 270:
242 Eleventh Five Year Plan initiat
- Page 271 and 272:
244 Eleventh Five Year Plan and ski
- Page 273 and 274:
246 Eleventh Five Year Plan tourism
- Page 275 and 276:
248 Eleventh Five Year Plan banks a
- Page 277 and 278:
250 Eleventh Five Year Plan facilit
- Page 279 and 280:
252 Eleventh Five Year Plan new geo
- Page 281 and 282:
254 Eleventh Five Year Plan pool of
- Page 283 and 284:
256 Eleventh Five Year Plan industr
- Page 285 and 286:
258 Eleventh Five Year Plan IT in A
- Page 287 and 288:
260 Eleventh Five Year Plan capital
- Page 289 and 290:
262 Eleventh Five Year Plan TABLE 8
- Page 291 and 292:
264 Eleventh Five Year Plan urban a
- Page 293 and 294:
266 Eleventh Five Year Plan service
- Page 295 and 296:
268 Eleventh Five Year Plan and del
- Page 297 and 298:
270 Eleventh Five Year Plan support
- Page 299 and 300:
272 Eleventh Five Year Plan their m
- Page 301 and 302:
(Annexure 8.2.1 contd.) S. Schemes/
- Page 304:
V Physical Infrastructure
- Page 307 and 308:
280 Eleventh Five Year Plan across
- Page 309 and 310:
282 Eleventh Five Year Plan move fr
- Page 311 and 312:
284 Eleventh Five Year Plan institu
- Page 313 and 314:
286 Eleventh Five Year Plan Logisti
- Page 315 and 316:
288 Eleventh Five Year Plan Bridges
- Page 317 and 318:
290 Eleventh Five Year Plan respect
- Page 319 and 320:
292 Eleventh Five Year Plan 9.3.15
- Page 321 and 322:
294 Eleventh Five Year Plan meet th
- Page 323 and 324:
296 Eleventh Five Year Plan speedy
- Page 325 and 326:
298 Eleventh Five Year Plan 9.3.38
- Page 327 and 328:
300 Eleventh Five Year Plan an MCA
- Page 329 and 330:
302 Eleventh Five Year Plan 2007. N
- Page 331 and 332:
304 Eleventh Five Year Plan financi
- Page 333 and 334:
306 Eleventh Five Year Plan Bharat
- Page 335 and 336:
308 Eleventh Five Year Plan The sch
- Page 337 and 338:
310 Eleventh Five Year Plan Maritim
- Page 339 and 340:
312 Eleventh Five Year Plan crore.
- Page 341 and 342:
314 Eleventh Five Year Plan 9.5 POR
- Page 343 and 344:
316 Eleventh Five Year Plan scheme
- Page 345 and 346:
318 Eleventh Five Year Plan of surp
- Page 347 and 348:
320 Eleventh Five Year Plan 9.5.32
- Page 349 and 350:
322 Eleventh Five Year Plan domesti
- Page 351 and 352:
324 Eleventh Five Year Plan - Flyin
- Page 353 and 354:
326 Eleventh Five Year Plan TABLE 9
- Page 355 and 356:
328 Eleventh Five Year Plan Directo
- Page 357 and 358:
330 Eleventh Five Year Plan ANNEXUR
- Page 359 and 360:
ANNEXURE 9.3.2 Central Road Sector
- Page 361 and 362:
334 Eleventh Five Year Plan ANNEXUR
- Page 363 and 364:
336 Eleventh Five Year Plan ANNEXUR
- Page 365 and 366:
338 Eleventh Five Year Plan ANNEXUR
- Page 367 and 368:
ANNEXURE 9.5.3 Tenth Plan—Outlays
- Page 369 and 370:
10 Energy ENERGY SECTOR ISSUES AND
- Page 371 and 372:
344 Eleventh Five Year Plan COAL AN
- Page 373 and 374:
346 Eleventh Five Year Plan their c
- Page 375 and 376:
348 Eleventh Five Year Plan 10.25 M
- Page 377 and 378:
350 Eleventh Five Year Plan regardi
- Page 379 and 380:
352 Eleventh Five Year Plan TABLE 1
- Page 381 and 382:
354 Eleventh Five Year Plan 10.55 T
- Page 383 and 384:
356 Eleventh Five Year Plan Priorit
- Page 385 and 386:
358 Eleventh Five Year Plan Transmi
- Page 387 and 388:
360 Eleventh Five Year Plan 10.82 T
- Page 389 and 390:
362 Eleventh Five Year Plan regulat
- Page 391 and 392:
364 Eleventh Five Year Plan Oil and
- Page 393 and 394:
366 Eleventh Five Year Plan Acquisi
- Page 395 and 396:
368 Eleventh Five Year Plan PHYSICA
- Page 397 and 398:
370 Eleventh Five Year Plan shale o
- Page 399 and 400:
372 Eleventh Five Year Plan Lignite
- Page 401 and 402:
374 Eleventh Five Year Plan Coal Mo
- Page 403 and 404:
376 Eleventh Five Year Plan existin
- Page 405 and 406:
378 Eleventh Five Year Plan schemes
- Page 407 and 408:
380 Eleventh Five Year Plan propose
- Page 409 and 410:
382 Eleventh Five Year Plan deliber
- Page 411 and 412:
384 Eleventh Five Year Plan found t
- Page 413 and 414:
386 Eleventh Five Year Plan TABLE 1
- Page 415 and 416:
388 Eleventh Five Year Plan lakh bi
- Page 417 and 418:
390 Eleventh Five Year Plan initiat
- Page 419 and 420:
ANNEXURE 10.2 Company-wise Coal Pro
- Page 421 and 422:
11 Urban Infrastructure, Housing, B
- Page 423 and 424:
396 Eleventh Five Year Plan THE CON
- Page 425 and 426:
398 Eleventh Five Year Plan banks a
- Page 427 and 428:
400 Eleventh Five Year Plan 11.36 T
- Page 429 and 430:
402 Eleventh Five Year Plan URBAN B
- Page 431 and 432:
404 Eleventh Five Year Plan 11.54 U
- Page 433 and 434:
406 Eleventh Five Year Plan in the
- Page 435 and 436:
408 Eleventh Five Year Plan trainin
- Page 437 and 438:
410 Eleventh Five Year Plan provisi
- Page 439 and 440:
412 Eleventh Five Year Plan 11.91 D
- Page 441 and 442:
414 Eleventh Five Year Plan innovat
- Page 443 and 444:
416 Eleventh Five Year Plan and man
- Page 445 and 446:
418 Eleventh Five Year Plan New Lev
- Page 447 and 448:
420 Eleventh Five Year Plan SPECIFI
- Page 449 and 450:
422 Eleventh Five Year Plan TABLE 1
- Page 451 and 452:
424 Eleventh Five Year Plan 12.1.4
- Page 453 and 454:
426 Eleventh Five Year Plan March 2
- Page 455 and 456:
428 Eleventh Five Year Plan Existin
- Page 457 and 458:
430 Eleventh Five Year Plan particu
- Page 459 and 460:
432 Eleventh Five Year Plan has gro
- Page 461 and 462:
434 Eleventh Five Year Plan all ind
- Page 463 and 464:
436 Eleventh Five Year Plan creatio
- Page 465 and 466:
438 Eleventh Five Year Plan HIGH RA
- Page 467 and 468:
440 Eleventh Five Year Plan 12.3.9
- Page 469 and 470:
442 Eleventh Five Year Plan also ha
- Page 471 and 472:
444 Eleventh Five Year Plan needs t
- Page 473 and 474:
446 Eleventh Five Year Plan media f
- Page 475 and 476:
448 Eleventh Five Year Plan Transfo
- Page 477 and 478:
450 Eleventh Five Year Plan ANNEXUR
- Page 480:
Appendix
- Page 483 and 484:
(Appendix contd.) 1 2 3 4 5 6 10 Sc
- Page 485 and 486:
(Appendix contd.) 1 2 3 4 5 6 7 Dir
- Page 487 and 488:
(Appendix contd.) 1 2 3 4 5 6 2 AMD
- Page 489 and 490:
(Appendix contd.) 1 2 3 4 5 6 6 Dep
- Page 491 and 492:
(Appendix contd.) 1 2 3 4 5 6 9 Min
- Page 493 and 494:
(Appendix contd.) 1 2 3 4 5 6 3 Con
- Page 495 and 496:
(Appendix contd.) 1 2 3 4 5 6 II RI
- Page 497 and 498:
(Appendix contd.) 1 2 3 4 5 6 Secon
- Page 499 and 500:
(Appendix contd.) 1 2 3 4 5 6 20 De
- Page 501 and 502:
(Appendix contd.) 1 2 3 4 5 6 New I
- Page 503 and 504:
(Appendix contd.) 1 2 3 4 5 6 Polic
- Page 505 and 506:
(Appendix contd.) 1 2 3 4 5 6 8 Ind
- Page 507 and 508:
(Appendix contd.) 1 2 3 4 5 6 7 FTI
- Page 509 and 510:
(Appendix contd.) 1 2 3 4 5 6 20 In
- Page 511 and 512:
(Appendix contd.) 1 2 3 4 5 6 33 De
- Page 513 and 514:
(Appendix contd.) 1 2 3 4 5 6 12 Tr
- Page 515 and 516:
(Appendix contd.) 1 2 3 4 5 6 New S
- Page 517 and 518:
(Appendix contd.) 1 2 3 4 5 6 (x) C
- Page 519 and 520:
(Appendix contd.) 1 2 3 4 5 6 46 De
- Page 521 and 522:
(Appendix contd.) 1 2 3 4 5 6 6 Set
- Page 523 and 524:
(Appendix contd.) 1 2 3 4 5 6 5 Red
- Page 525 and 526:
(Appendix contd.) 1 2 3 4 5 6 B Cen
- Page 527 and 528:
(Appendix contd.) 1 2 3 4 5 6 13 Dr
- Page 529 and 530:
(Appendix contd.) 1 2 3 4 5 6 10 In
- Page 531 and 532:
(Appendix contd.) 1 2 3 4 5 6 4 Ove
- Page 533 and 534:
(Appendix contd.) 1 2 3 4 5 6 New S
- Page 535 and 536:
(Appendix contd.) 1 2 3 4 5 6 9 RMK