
You also want an ePaper? Increase the reach of your titles
YUMPU automatically turns print PDFs into web optimized ePapers that Google loves.
FUND FLOW <strong>REPORT</strong><br />
by 24 million barrels to 5.7 billion barrels<br />
in the last quarter of 2016. Positive market<br />
sentiment also helped Brent crude to remain<br />
above the USD55 mark at USD55.52pb.<br />
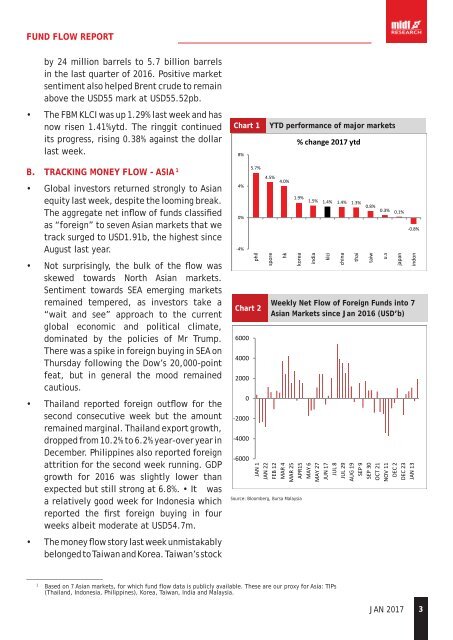
• The FBM KLCI was up 1.29% last week and has<br />
now risen 1.41%ytd. The ringgit continued<br />
its progress, rising 0.38% against the dollar<br />
last week.<br />
Chart 1<br />
8%<br />
YTD performance of major markets<br />
% change 2017 ytd<br />
B. TRACKING MONEY FLOW - ASIA 1<br />
• Global investors returned strongly to Asian<br />
equity last week, despite the looming break.<br />
The aggregate net inflow of funds classified<br />
as “foreign” to seven Asian markets that we<br />
track surged to USD1.91b, the highest since<br />
August last year.<br />
• Not surprisingly, the bulk of the flow was<br />
skewed towards North Asian markets.<br />
Sentiment towards SEA emerging markets<br />
remained tempered, as investors take a<br />
“wait and see” approach to the current<br />
global economic and political climate,<br />
dominated by the policies of Mr Trump.<br />
There was a spike in foreign buying in SEA on<br />
Thursday following the Dow’s 20,000-point<br />
feat, but in general the mood remained<br />
cautious.<br />
• Thailand reported foreign outflow for the<br />
second consecutive week but the amount<br />
remained marginal. Thailand export growth,<br />
dropped from 10.2% to 6.2% year-over year in<br />
December. Philippines also reported foreign<br />
attrition for the second week running. GDP<br />
growth for 2016 was slightly lower than<br />
expected but still strong at 6.8%. • It was<br />
a relatively good week for Indonesia which<br />
reported the first foreign buying in four<br />
weeks albeit moderate at USD54.7m.<br />
• The money flow story last week unmistakably<br />
belonged to Taiwan and Korea. Taiwan’s stock<br />
4%<br />
0%<br />
-4%<br />
Chart 2<br />
6000<br />
4000<br />
2000<br />
0<br />
-2000<br />
-4000<br />
-6000<br />
5.7%<br />
phil<br />
4.5% 4.0%<br />
1.9% 1.5% 1.4% 1.4% 1.3% 0.8%<br />
0.3% 0.1%<br />
-0.8%<br />
spore<br />
hk<br />
korea<br />
Source: Bloomberg, Bursa Malaysia<br />
india<br />
klci<br />
Weekly Net Flow of Foreign Funds into 7<br />
Asian Markets since Jan 2016 (USD’b)<br />
JAN 1<br />
JAN 22<br />
FEB 12<br />
MAR 4<br />
MAR 25<br />
APR15<br />
MAY 6<br />
MAY 27<br />
JUN 17<br />
JUL 8<br />
JUL 29<br />
AUG 19<br />
SEP 9<br />
SEP 30<br />
OCT 21<br />
NOV 11<br />
DEC 2<br />
DEC 23<br />
JAN 13<br />
china<br />
thai<br />
taiw<br />
u.s<br />
japan<br />
indon<br />
________________________<br />
1<br />
Based on 7 Asian markets, for which fund flow data is publicly available. These are our proxy for Asia: TIPs<br />
(Thailand, Indonesia, Philippines), Korea, Taiwan, India and Malaysia.<br />
JAN 2017<br />
3