Download the Annual Report 2009 here (PDF) - Pandora
Download the Annual Report 2009 here (PDF) - Pandora
Download the Annual Report 2009 here (PDF) - Pandora

Create successful ePaper yourself
Turn your PDF publications into a flip-book with our unique Google optimized e-Paper software.
6<br />
PANDORA ANNUAL REPORT <strong>2009</strong> | MANAGEMENT REPORT<br />
FINANCIAL<br />
HIGHLIGHTS *<br />
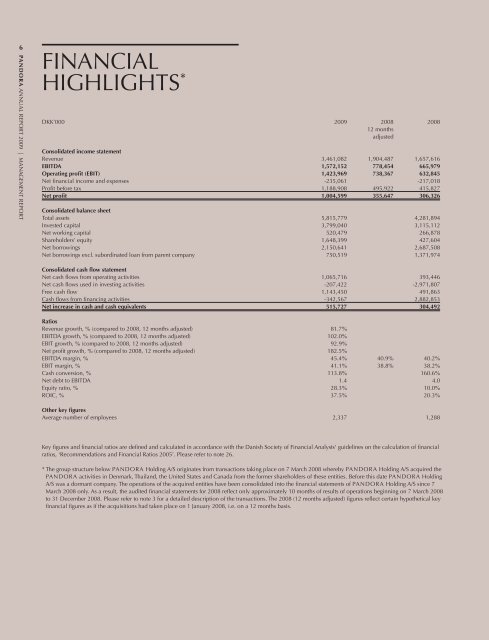
DKK’000 <strong>2009</strong> 2008 2008<br />
12 months<br />
adjusted<br />
Consolidated income statement<br />
Revenue 3,461,082 1,904,487 1,657,616<br />
EBITDA 1,572,152 778,454 665,979<br />
Operating profi t (EBIT) 1,423,969 738,367 632,845<br />
Net fi nancial income and expenses -235,061 -217,018<br />
Profi t before tax 1,188,908 495,922 415,827<br />
Net profi t 1,004,599 355,647 306,326<br />
Consolidated balance sheet<br />
Total assets 5,815,779 4,281,894<br />
Invested capital 3,799,040 3,115,112<br />
Net working capital 520,479 266,878<br />
Shareholders’ equity 1,648,399 427,604<br />
Net borrowings 2,150,641 2,687,508<br />
Net borrowings excl. subordinated loan from parent company 750,519 1,371,974<br />
Consolidated cash fl ow statement<br />
Net cash fl ows from operating activities 1,065,716 393,446<br />
Net cash fl ows used in investing activities -207,422 -2,971,807<br />
Free cash fl ow 1,143,450 491,863<br />
Cash fl ows from fi nancing activities -342,567 2,882,853<br />
Net increase in cash and cash equivalents 515,727 304,492<br />
Ratios<br />
Revenue growth, % (compared to 2008, 12 months adjusted) 81.7%<br />
EBITDA growth, % (compared to 2008, 12 months adjusted) 102.0%<br />
EBIT growth, % (compared to 2008, 12 months adjusted) 92.9%<br />
Net profi t growth, % (compared to 2008, 12 months adjusted) 182.5%<br />
EBITDA margin, % 45.4% 40.9% 40.2%<br />
EBIT margin, % 41.1% 38.8% 38.2%<br />
Cash conversion, % 113.8% 160.6%<br />
Net debt to EBITDA 1.4 4.0<br />
Equity ratio, % 28.3% 10.0%<br />
ROIC, % 37.5% 20.3%<br />
O<strong>the</strong>r key fi gures<br />
Average number of employees 2,337 1,288<br />
Key fi gures and fi nancial ratios are defi ned and calculated in accordance with <strong>the</strong> Danish Society of Financial Analysts’ guidelines on <strong>the</strong> calculation of fi nancial<br />
ratios, ‘Recommendations and Financial Ratios 2005’. Please refer to note 26.<br />
* The group structure below PANDORA Holding A/S originates from transactions taking place on 7 March 2008 w<strong>here</strong>by PANDORA Holding A/S acquired <strong>the</strong><br />
PANDORA activities in Denmark, Thailand, <strong>the</strong> United States and Canada from <strong>the</strong> former shareholders of <strong>the</strong>se entities. Before this date PANDORA Holding<br />
A/S was a dormant company. The operations of <strong>the</strong> acquired entities have been consolidated into <strong>the</strong> fi nancial statements of PANDORA Holding A/S since 7<br />
March 2008 only. As a result, <strong>the</strong> audited fi nancial statements for 2008 refl ect only approximately 10 months of results of operations beginning on 7 March 2008<br />
to 31 December 2008. Please refer to note 3 for a detailed description of <strong>the</strong> transactions. The 2008 (12 months adjusted) fi gures refl ect certain hypo<strong>the</strong>tical key<br />
fi nancial fi gures as if <strong>the</strong> acquisitions had taken place on 1 January 2008, i.e. on a 12 months basis.