Executive Summary
2017_executive_summary
2017_executive_summary

You also want an ePaper? Increase the reach of your titles
YUMPU automatically turns print PDFs into web optimized ePapers that Google loves.
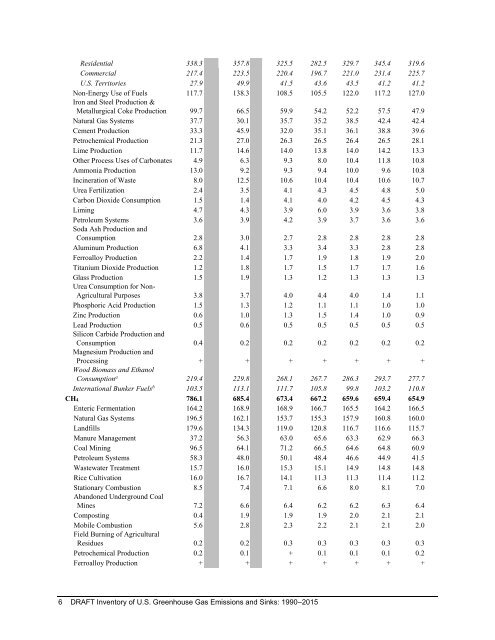
Residential 338.3 357.8 325.5 282.5 329.7 345.4 319.6<br />
Commercial 217.4 223.5 220.4 196.7 221.0 231.4 225.7<br />
U.S. Territories 27.9 49.9 41.5 43.6 43.5 41.2 41.2<br />
Non-Energy Use of Fuels 117.7 138.3 108.5 105.5 122.0 117.2 127.0<br />
Iron and Steel Production &<br />
Metallurgical Coke Production 99.7 66.5 59.9 54.2 52.2 57.5 47.9<br />
Natural Gas Systems 37.7 30.1 35.7 35.2 38.5 42.4 42.4<br />
Cement Production 33.3 45.9 32.0 35.1 36.1 38.8 39.6<br />
Petrochemical Production 21.3 27.0 26.3 26.5 26.4 26.5 28.1<br />
Lime Production 11.7 14.6 14.0 13.8 14.0 14.2 13.3<br />
Other Process Uses of Carbonates 4.9 6.3 9.3 8.0 10.4 11.8 10.8<br />
Ammonia Production 13.0 9.2 9.3 9.4 10.0 9.6 10.8<br />
Incineration of Waste 8.0 12.5 10.6 10.4 10.4 10.6 10.7<br />
Urea Fertilization 2.4 3.5 4.1 4.3 4.5 4.8 5.0<br />
Carbon Dioxide Consumption 1.5 1.4 4.1 4.0 4.2 4.5 4.3<br />
Liming 4.7 4.3 3.9 6.0 3.9 3.6 3.8<br />
Petroleum Systems 3.6 3.9 4.2 3.9 3.7 3.6 3.6<br />
Soda Ash Production and<br />
Consumption 2.8 3.0 2.7 2.8 2.8 2.8 2.8<br />
Aluminum Production 6.8 4.1 3.3 3.4 3.3 2.8 2.8<br />
Ferroalloy Production 2.2 1.4 1.7 1.9 1.8 1.9 2.0<br />
Titanium Dioxide Production 1.2 1.8 1.7 1.5 1.7 1.7 1.6<br />
Glass Production 1.5 1.9 1.3 1.2 1.3 1.3 1.3<br />
Urea Consumption for Non-<br />
Agricultural Purposes 3.8 3.7 4.0 4.4 4.0 1.4 1.1<br />
Phosphoric Acid Production 1.5 1.3 1.2 1.1 1.1 1.0 1.0<br />
Zinc Production 0.6 1.0 1.3 1.5 1.4 1.0 0.9<br />
Lead Production 0.5 0.6 0.5 0.5 0.5 0.5 0.5<br />
Silicon Carbide Production and<br />
Consumption 0.4 0.2 0.2 0.2 0.2 0.2 0.2<br />
Magnesium Production and<br />
Processing + + + + + + +<br />
Wood Biomass and Ethanol<br />
Consumption a 219.4 229.8 268.1 267.7 286.3 293.7 277.7<br />
International Bunker Fuels b 103.5 113.1 111.7 105.8 99.8 103.2 110.8<br />
CH4 786.1 685.4 673.4 667.2 659.6 659.4 654.9<br />
Enteric Fermentation 164.2 168.9 168.9 166.7 165.5 164.2 166.5<br />
Natural Gas Systems 196.5 162.1 153.7 155.3 157.9 160.8 160.0<br />
Landfills 179.6 134.3 119.0 120.8 116.7 116.6 115.7<br />
Manure Management 37.2 56.3 63.0 65.6 63.3 62.9 66.3<br />
Coal Mining 96.5 64.1 71.2 66.5 64.6 64.8 60.9<br />
Petroleum Systems 58.3 48.0 50.1 48.4 46.6 44.9 41.5<br />
Wastewater Treatment 15.7 16.0 15.3 15.1 14.9 14.8 14.8<br />
Rice Cultivation 16.0 16.7 14.1 11.3 11.3 11.4 11.2<br />
Stationary Combustion 8.5 7.4 7.1 6.6 8.0 8.1 7.0<br />
Abandoned Underground Coal<br />
Mines 7.2 6.6 6.4 6.2 6.2 6.3 6.4<br />
Composting 0.4 1.9 1.9 1.9 2.0 2.1 2.1<br />
Mobile Combustion 5.6 2.8 2.3 2.2 2.1 2.1 2.0<br />
Field Burning of Agricultural<br />
Residues 0.2 0.2 0.3 0.3 0.3 0.3 0.3<br />
Petrochemical Production 0.2 0.1 + 0.1 0.1 0.1 0.2<br />
Ferroalloy Production + + + + + + +<br />
6 DRAFT Inventory of U.S. Greenhouse Gas Emissions and Sinks: 1990–2015