Executive Summary
2017_executive_summary
2017_executive_summary

You also want an ePaper? Increase the reach of your titles
YUMPU automatically turns print PDFs into web optimized ePapers that Google loves.
1<br />
2<br />
3<br />
4<br />
5<br />
6<br />
7<br />
8<br />
9<br />
10<br />
11<br />
12<br />
13<br />
14<br />
15<br />
16<br />
17<br />
18<br />
19<br />
20<br />
21<br />
22<br />
23<br />
24<br />
25<br />
26<br />
27<br />
28<br />
29<br />
<strong>Executive</strong> <strong>Summary</strong><br />
An emissions inventory that identifies and quantifies a country's primary anthropogenic 1 sources and sinks of<br />
greenhouse gases is essential for addressing climate change. This inventory adheres to both (1) a comprehensive and<br />
detailed set of methodologies for estimating sources and sinks of anthropogenic greenhouse gases, and (2) a<br />
common and consistent mechanism that enables Parties to the United Nations Framework Convention on Climate<br />
Change (UNFCCC) to compare the relative contribution of different emission sources and greenhouse gases to<br />
climate change.<br />
In 1992, the United States signed and ratified the UNFCCC. As stated in Article 2 of the UNFCCC, “The ultimate<br />
objective of this Convention and any related legal instruments that the Conference of the Parties may adopt is to<br />
achieve, in accordance with the relevant provisions of the Convention, stabilization of greenhouse gas<br />
concentrations in the atmosphere at a level that would prevent dangerous anthropogenic interference with the<br />
climate system. Such a level should be achieved within a time-frame sufficient to allow ecosystems to adapt<br />
naturally to climate change, to ensure that food production is not threatened and to enable economic development to<br />
proceed in a sustainable manner.” 2<br />
Parties to the Convention, by ratifying, “shall develop, periodically update, publish and make available…national<br />
inventories of anthropogenic emissions by sources and removals by sinks of all greenhouse gases not controlled by<br />
the Montreal Protocol, using comparable methodologies…” 3 The United States views this report as an opportunity<br />
to fulfill these commitments.<br />
This chapter summarizes the latest information on U.S. anthropogenic greenhouse gas emission trends from 1990<br />
through 2015. To ensure that the U.S. emissions inventory is comparable to those of other UNFCCC Parties, the<br />
estimates presented here were calculated using methodologies consistent with those recommended in the 2006<br />
Intergovernmental Panel on Climate Change (IPCC) Guidelines for National Greenhouse Gas Inventories (IPCC<br />
2006). The structure of this report is consistent with the UNFCCC guidelines for inventory reporting. 4<br />
Box ES-1: Methodological Approach for Estimating and Reporting U.S. Emissions and Sinks<br />
In following the UNFCCC requirement under Article 4.1 to develop and submit national greenhouse gas emissions<br />
inventories, the gross emissions total presented in this report for the United States excludes emissions and sinks<br />
from LULUCF. The net emissions total presented in this report for the United States includes emissions and sinks<br />
from LULUCF. All emissions and sinks are calculated using internationally-accepted methods provided by the<br />
1 The term “anthropogenic,” in this context, refers to greenhouse gas emissions and removals that are a direct result of human<br />
activities or are the result of natural processes that have been affected by human activities (IPCC 2006).<br />
2 Article 2 of the Framework Convention on Climate Change published by the UNEP/WMO Information Unit on Climate<br />
Change. See .<br />
3 Article 4(1)(a) of the United Nations Framework Convention on Climate Change (also identified in Article 12). Subsequent<br />
decisions by the Conference of the Parties elaborated the role of Annex I Parties in preparing national inventories. See<br />
.<br />
4 See .<br />
<strong>Executive</strong> <strong>Summary</strong><br />
ES-1
1<br />
2<br />
3<br />
4<br />
5<br />
6<br />
7<br />
8<br />
9<br />
10<br />
11<br />
12<br />
13<br />
14<br />
15<br />
16<br />
17<br />
18<br />
19<br />
20<br />
21<br />
22<br />
IPCC. 5 Additionally, the calculated emissions and sinks in a given year for the United States are presented in a<br />
common manner in line with the UNFCCC reporting guidelines for the reporting of inventories under this<br />
international agreement. 6 The use of consistent methods to calculate emissions and sinks by all nations providing<br />
their inventories to the UNFCCC ensures that these reports are comparable. In this regard, U.S. emissions and sinks<br />
reported in this Inventory report are comparable to emissions and sinks reported by other countries. The report itself<br />
follows this standardized format, and provides an explanation of the IPCC methods used to calculate emissions and<br />
sinks, and the manner in which those calculations are conducted.<br />
On October 30, 2009, the U.S. Environmental Protection Agency (EPA) published a rule for the mandatory<br />
reporting of greenhouse gases from large greenhouse gas emissions sources in the United States. Implementation of<br />
40 CFR Part 98 is referred to as the Greenhouse Gas Reporting Program (GHGRP). 40 CFR part 98 applies to direct<br />
greenhouse gas emitters, fossil fuel suppliers, industrial gas suppliers, and facilities that inject carbon dioxide (CO 2)<br />
underground for sequestration or other reasons. 7 Reporting is at the facility level, except for certain suppliers of<br />
fossil fuels and industrial greenhouse gases. The GHGRP dataset and the data presented in this Inventory report are<br />
complementary.<br />
The GHGRP data set continues to be an important resource for the Inventory, providing not only annual emissions<br />
information, but also other annual information, such as activity data and emissions factors that can improve and<br />
refine national emission estimates and trends over time. GHGRP data also allow EPA to disaggregate national<br />
inventory estimates in new ways that can highlight differences across regions and sub-categories of emissions, along<br />
with enhancing application of QA/QC procedures and assessment of uncertainties.<br />
EPA uses annual GHGRP data in a number of category estimates and continues to analyze the data on an annual<br />
basis, as applicable, for further use to improve the national estimates presented in this Inventory consistent with<br />
IPCC guidance. 8<br />
23<br />
24<br />
25<br />
26<br />
27<br />
28<br />
29<br />
30<br />
31<br />
32<br />
33<br />
34<br />
35<br />
36<br />
ES.1 Background Information<br />
Greenhouse gases trap heat and make the planet warmer. The most important greenhouse gases directly emitted by<br />
humans include carbon dioxide (CO 2), methane (CH 4), nitrous oxide (N 2O), and several other fluorine-containing<br />
halogenated substances. Although the direct greenhouse gases CO 2, CH 4, and N 2O occur naturally in the<br />
atmosphere, human activities have changed their atmospheric concentrations. From the pre-industrial era (i.e.,<br />
ending about 1750) to 2015, concentrations of these greenhouse gases have increased globally by 44, 162, and 21<br />
percent, respectively (IPCC 2013 and NOAA/ESRL 2017). This annual report estimates the total national<br />
greenhouse gas emissions and removals associated with human activities across the United States.<br />
Global Warming Potentials<br />
Gases in the atmosphere can contribute to climate change both directly and indirectly. Direct effects occur when the<br />
gas itself absorbs radiation. Indirect radiative forcing occurs when chemical transformations of the substance<br />
produce other greenhouse gases, when a gas influences the atmospheric lifetimes of other gases, and/or when a gas<br />
affects atmospheric processes that alter the radiative balance of the earth (e.g., affect cloud formation or albedo). 9<br />
5 See .<br />
6 See .<br />
7 See and .<br />
8 See <br />
9 Albedo is a measure of the Earth’s reflectivity, and is defined as the fraction of the total solar radiation incident on a body that<br />
is reflected by it.<br />
2 DRAFT Inventory of U.S. Greenhouse Gas Emissions and Sinks: 1990–2015
1<br />
2<br />
3<br />
4<br />
5<br />
6<br />
7<br />
8<br />
9<br />
10<br />
11<br />
12<br />
13<br />
14<br />
15<br />
16<br />
The IPCC developed the Global Warming Potential (GWP) concept to compare the ability of each greenhouse gas to<br />
trap heat in the atmosphere relative to another gas.<br />
The GWP of a greenhouse gas is defined as the ratio of the accumulated radiative forcing within a specific time<br />
horizon caused by emitting 1 kilogram of the gas, relative to that of the reference gas CO 2 (IPCC 2014). Direct<br />
radiative effects occur when the gas itself is a greenhouse gas. The reference gas used is CO 2, and therefore GWPweighted<br />
emissions are measured in million metric tons of CO 2 equivalent (MMT CO 2 Eq.). 10,11 All gases in this<br />
<strong>Executive</strong> <strong>Summary</strong> are presented in units of MMT CO 2 Eq. Emissions by gas in unweighted mass tons are provided<br />
in the Trends chapter of this report.<br />
UNFCCC reporting guidelines for national inventories require the use of GWP values from the IPCC Fourth<br />
Assessment Report (AR4) (IPCC 2007). 12 All estimates are provided throughout the report in both CO 2 equivalents<br />
and unweighted units. A comparison of emission values using the AR4 GWP values versus the SAR (IPCC 1996),<br />
and the IPCC Fifth Assessment Report (AR5) (IPCC 2013) GWP values can be found in Chapter 1 and, in more<br />
detail, in Annex 6.1 of this report. The GWP values used in this report are listed below in Table ES-1.<br />
Table ES-1: Global Warming Potentials (100-Year Time Horizon) Used in this Report<br />
Gas<br />
GWP<br />
CO2 1<br />
CH4 a 25<br />
N2O 298<br />
HFC-23 14,800<br />
HFC-32 675<br />
HFC-125 3,500<br />
HFC-134a 1,430<br />
HFC-143a 4,470<br />
HFC-152a 124<br />
HFC-227ea 3,220<br />
HFC-236fa 9,810<br />
HFC-4310mee 1,640<br />
CF4 7,390<br />
C2F6 12,200<br />
C4F10 8,860<br />
C6F14 9,300<br />
SF6 22,800<br />
NF3 17,200<br />
Source: IPCC (2007)<br />
a<br />
The CH4 GWP includes the direct<br />
effects and those indirect effects due<br />
to the production of tropospheric<br />
ozone and stratospheric water vapor.<br />
The indirect effect due to production<br />
of CO2 is not included.<br />
17<br />
10 Carbon comprises 12/44 of carbon dioxide by weight.<br />
11 One million metric ton is equal to 10 12 grams or one teragram.<br />
12 See .<br />
<strong>Executive</strong> <strong>Summary</strong><br />
ES-3
1<br />
2<br />
3<br />
4<br />
5<br />
6<br />
7<br />
8<br />
9<br />
10<br />
11<br />
12<br />
13<br />
14<br />
15<br />
ES.2 Recent Trends in U.S. Greenhouse Gas<br />
Emissions and Sinks<br />
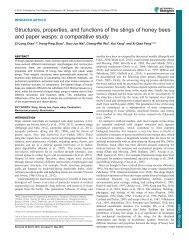
In 2015, total gross U.S. greenhouse gas emissions were 6,586.2 million metric tons (MMT) of CO 2 Eq. Total U.S.<br />
emissions have increased by 3.4 percent from 1990 to 2015, and emissions decreased from 2014 to 2015 by 2.2<br />
percent (150.1 MMT CO 2 Eq.). The decrease in total greenhouse gas emissions between 2014 and 2015 was driven<br />
in large part by a decrease in CO 2 emissions from fossil fuel combustion. The decrease in CO 2 emissions from fossil<br />
fuel combustion was a result of multiple factors, including: (1) substitution from coal to natural gas consumption in<br />
the electric power sector; (2) warmer winter conditions in the first quarter of 2015 resulting in a decreased demand<br />
for heating fuel in the residential and commercial sectors; and (3) a slight decrease in electricity demand. Lastly,<br />
since 1990, U.S. emissions have increased at an average annual rate of 0.2 percent. Figure ES-1 through Figure ES-3<br />
illustrate the overall trends in total U.S. emissions by gas, annual changes, and absolute change since 1990. Overall,<br />
net emissions in 2015 were 11.2 percent below 2005 levels as shown in Table ES-2.<br />
Table ES-2 provides a detailed summary of gross U.S. greenhouse gas emissions and sinks for 1990 through 2015.<br />
Figure ES-1: Gross U.S. Greenhouse Gas Emissions by Gas (MMT CO2 Eq.)<br />
16<br />
17<br />
18<br />
4 DRAFT Inventory of U.S. Greenhouse Gas Emissions and Sinks: 1990–2015
1<br />
2<br />
3<br />
Figure ES-2: Annual Percent Change in Gross U.S. Greenhouse Gas Emissions Relative to the<br />
Previous Year<br />
4<br />
5<br />
6<br />
7<br />
8<br />
Figure ES-3: Cumulative Change in Annual Gross U.S. Greenhouse Gas Emissions Relative to<br />
1990 (1990=0, MMT CO2 Eq.)<br />
9<br />
10<br />
11<br />
12<br />
13<br />
Table ES-2: Recent Trends in U.S. Greenhouse Gas Emissions and Sinks (MMT CO2 Eq.)<br />
Gas/Source 1990 2005 2011 2012 2013 2014 2015<br />
CO₂ 5,121.4 6,129.7 5,567.5 5,359.5 5,512.1 5,561.8 5,410.6<br />
Fossil Fuel Combustion 4,740.7 5,747.1 5,227.7 5,024.7 5,157.6 5,202.1 5,049.2<br />
Electricity Generation 1,820.8 2,400.9 2,157.7 2,022.2 2,038.1 2,038.0 1,900.7<br />
Transportation 1,493.8 1,887.0 1,707.6 1,696.8 1,713.0 1,730.4 1,733.2<br />
Industrial 842.5 828.0 775.0 782.9 812.2 815.8 828.8<br />
<strong>Executive</strong> <strong>Summary</strong><br />
ES-5
Residential 338.3 357.8 325.5 282.5 329.7 345.4 319.6<br />
Commercial 217.4 223.5 220.4 196.7 221.0 231.4 225.7<br />
U.S. Territories 27.9 49.9 41.5 43.6 43.5 41.2 41.2<br />
Non-Energy Use of Fuels 117.7 138.3 108.5 105.5 122.0 117.2 127.0<br />
Iron and Steel Production &<br />
Metallurgical Coke Production 99.7 66.5 59.9 54.2 52.2 57.5 47.9<br />
Natural Gas Systems 37.7 30.1 35.7 35.2 38.5 42.4 42.4<br />
Cement Production 33.3 45.9 32.0 35.1 36.1 38.8 39.6<br />
Petrochemical Production 21.3 27.0 26.3 26.5 26.4 26.5 28.1<br />
Lime Production 11.7 14.6 14.0 13.8 14.0 14.2 13.3<br />
Other Process Uses of Carbonates 4.9 6.3 9.3 8.0 10.4 11.8 10.8<br />
Ammonia Production 13.0 9.2 9.3 9.4 10.0 9.6 10.8<br />
Incineration of Waste 8.0 12.5 10.6 10.4 10.4 10.6 10.7<br />
Urea Fertilization 2.4 3.5 4.1 4.3 4.5 4.8 5.0<br />
Carbon Dioxide Consumption 1.5 1.4 4.1 4.0 4.2 4.5 4.3<br />
Liming 4.7 4.3 3.9 6.0 3.9 3.6 3.8<br />
Petroleum Systems 3.6 3.9 4.2 3.9 3.7 3.6 3.6<br />
Soda Ash Production and<br />
Consumption 2.8 3.0 2.7 2.8 2.8 2.8 2.8<br />
Aluminum Production 6.8 4.1 3.3 3.4 3.3 2.8 2.8<br />
Ferroalloy Production 2.2 1.4 1.7 1.9 1.8 1.9 2.0<br />
Titanium Dioxide Production 1.2 1.8 1.7 1.5 1.7 1.7 1.6<br />
Glass Production 1.5 1.9 1.3 1.2 1.3 1.3 1.3<br />
Urea Consumption for Non-<br />
Agricultural Purposes 3.8 3.7 4.0 4.4 4.0 1.4 1.1<br />
Phosphoric Acid Production 1.5 1.3 1.2 1.1 1.1 1.0 1.0<br />
Zinc Production 0.6 1.0 1.3 1.5 1.4 1.0 0.9<br />
Lead Production 0.5 0.6 0.5 0.5 0.5 0.5 0.5<br />
Silicon Carbide Production and<br />
Consumption 0.4 0.2 0.2 0.2 0.2 0.2 0.2<br />
Magnesium Production and<br />
Processing + + + + + + +<br />
Wood Biomass and Ethanol<br />
Consumption a 219.4 229.8 268.1 267.7 286.3 293.7 277.7<br />
International Bunker Fuels b 103.5 113.1 111.7 105.8 99.8 103.2 110.8<br />
CH4 786.1 685.4 673.4 667.2 659.6 659.4 654.9<br />
Enteric Fermentation 164.2 168.9 168.9 166.7 165.5 164.2 166.5<br />
Natural Gas Systems 196.5 162.1 153.7 155.3 157.9 160.8 160.0<br />
Landfills 179.6 134.3 119.0 120.8 116.7 116.6 115.7<br />
Manure Management 37.2 56.3 63.0 65.6 63.3 62.9 66.3<br />
Coal Mining 96.5 64.1 71.2 66.5 64.6 64.8 60.9<br />
Petroleum Systems 58.3 48.0 50.1 48.4 46.6 44.9 41.5<br />
Wastewater Treatment 15.7 16.0 15.3 15.1 14.9 14.8 14.8<br />
Rice Cultivation 16.0 16.7 14.1 11.3 11.3 11.4 11.2<br />
Stationary Combustion 8.5 7.4 7.1 6.6 8.0 8.1 7.0<br />
Abandoned Underground Coal<br />
Mines 7.2 6.6 6.4 6.2 6.2 6.3 6.4<br />
Composting 0.4 1.9 1.9 1.9 2.0 2.1 2.1<br />
Mobile Combustion 5.6 2.8 2.3 2.2 2.1 2.1 2.0<br />
Field Burning of Agricultural<br />
Residues 0.2 0.2 0.3 0.3 0.3 0.3 0.3<br />
Petrochemical Production 0.2 0.1 + 0.1 0.1 0.1 0.2<br />
Ferroalloy Production + + + + + + +<br />
6 DRAFT Inventory of U.S. Greenhouse Gas Emissions and Sinks: 1990–2015
Silicon Carbide Production and<br />
Consumption + + + + + + +<br />
Iron and Steel Production &<br />
Metallurgical Coke Production + + + + + + +<br />
Incineration of Waste + + + + + + +<br />
International Bunker Fuels b 0.2 0.1 0.1 0.1 0.1 0.1 0.1<br />
N2O 359.6 361.6 364.0 340.7 335.5 335.5 335.1<br />
Agricultural Soil Management 256.6 259.8 270.1 254.1 250.5 250.0 251.3<br />
Stationary Combustion 11.9 20.2 21.3 21.4 22.9 23.4 23.1<br />
Manure Management 14.0 16.5 17.4 17.5 17.5 17.5 17.7<br />
Mobile Combustion 41.2 35.7 22.8 20.4 18.5 16.6 15.4<br />
Nitric Acid Production 12.1 11.3 10.9 10.5 10.7 10.9 11.6<br />
Wastewater Treatment 3.4 4.4 4.8 4.8 4.9 4.9 5.0<br />
Adipic Acid Production 15.2 7.1 10.2 5.5 3.9 5.4 4.3<br />
N₂O from Product Uses 4.2 4.2 4.2 4.2 4.2 4.2 4.2<br />
Composting 0.3 1.7 1.7 1.7 1.8 1.9 1.9<br />
Incineration of Waste 0.5 0.4 0.3 0.3 0.3 0.3 0.3<br />
Semiconductor Manufacture + 0.1 0.2 0.2 0.2 0.2 0.2<br />
Field Burning of Agricultural<br />
Residues 0.1 0.1 0.1 0.1 0.1 0.1 0.1<br />
International Bunker Fuels b 0.9 1.0 1.0 0.9 0.9 0.9 0.9<br />
HFCs 46.6 120.0 154.4 155.9 159.0 166.7 174.1<br />
Substitution of Ozone Depleting<br />
Substances c 0.3 99.8 145.4 150.2 154.7 161.3 168.6<br />
HCFC-22 Production 46.1 20.0 8.8 5.5 4.1 5.0 5.0<br />
Semiconductor Manufacture 0.2 0.2 0.2 0.2 0.2 0.3 0.3<br />
Magnesium Production and<br />
Processing 0.0 0.0 + + 0.1 0.1 0.1<br />
PFCs 24.3 6.7 6.9 6.0 5.7 5.7 5.2<br />
Semiconductor Manufacture 2.8 3.2 3.4 3.0 2.8 3.2 3.2<br />
Aluminum Production 21.5 3.4 3.5 2.9 3.0 2.5 2.0<br />
SF6 28.8 11.7 9.2 6.8 6.4 6.6 5.8<br />
Electrical Transmission and<br />
Distribution 23.1 8.3 6.0 4.8 4.6 4.8 4.2<br />
Magnesium Production and<br />
Processing 5.2 2.7 2.8 1.6 1.5 1.0 0.9<br />
Semiconductor Manufacture 0.5 0.7 0.4 0.4 0.4 0.7 0.7<br />
NF3 + 0.5 0.7 0.6 0.6 0.5 0.6<br />
Semiconductor Manufacture + 0.5 0.7 0.6 0.6 0.5 0.6<br />
Total Emissions 6,366.7 7,315.6 6,776.0 6,536.8 6,678.9 6,736.3 6,586.2<br />
LULUCF Emissions d 11.6 24.0 20.7 26.8 19.9 20.4 20.4<br />
LULUCF C Stock Change e,f (460.7) (339.3) (395.8) (414.5) (390.3) (389.2) (386.8)<br />
LULUCF Sector Net Total g (449.1) (315.3) (375.1) (387.7) (370.4) (368.8) (366.4)<br />
Net Emissions (Sources and Sinks) 5,917.6 7,000.3 6,400.9 6,149.1 6,308.5 6,367.5 6,219.8<br />
Notes: Total emissions presented without LULUCF. Net emissions presented with LULUCF.<br />
+ Does not exceed 0.05 MMT CO2 Eq.<br />
a<br />
Emissions from Wood Biomass and Ethanol Consumption are not included specifically in summing Energy sector totals.<br />
Net carbon fluxes from changes in biogenic carbon reservoirs are accounted for in the estimates for Land Use, Land-Use<br />
Change, and Forestry.<br />
b<br />
Emissions from International Bunker Fuels are not included in totals.<br />
c<br />
Small amounts of PFC emissions also result from this source.<br />
d<br />
LULUCF emissions include the CO2, CH4, and N2O emissions from Peatlands Remaining Peatlands; CH4 and N2O<br />
emissions reported for Non-CO2 Emissions from Forest Fires, Non-CO2 Emissions from Grassland Fires, and Coastal<br />
Wetlands Remaining Coastal Wetlands; CH4 emissions from Land Converted to Coastal Wetlands; and N2O Fluxes from<br />
Forest Soils and Settlement Soils.<br />
<strong>Executive</strong> <strong>Summary</strong><br />
ES-7
e<br />
LULUCF C Stock Change is the net C stock change from the following categories: Forest Land Remaining Forest Land,<br />
Land Converted to Forest Land, Cropland Remaining Cropland, Land Converted to Cropland, Grassland Remaining<br />
Grassland, Land Converted to Grassland, Wetlands Remaining Wetlands, Land Converted to Wetlands, Settlements<br />
Remaining Settlements, and Land Converted to Settlements. Refer to Table ES-5 for a breakout of emissions and<br />
removals for Land Use, Land-Use Change, and Forestry by gas and source category.<br />
f<br />
Quality control uncovered errors in the estimate and uncertainty of soil C stock changes for 2013, 2014, 2015, which will<br />
be updated following public review. Corrected estimates are provided in footnotes of the emission summary tables for<br />
Cropland Remaining Cropland, Land Converted to Cropland, Grassland Remaining Grassland, and Land Converted to<br />
Grassland sections in the LULUCF chapter of this report.<br />
g<br />
The LULUCF Sector Net Total is the net sum of all emissions (i.e., sources) of greenhouse gases to the atmosphere plus<br />
removals of CO2 (i.e., sinks or negative emissions) from the atmosphere.<br />
Notes: Totals may not sum due to independent rounding. Parentheses indicate negative values or sequestration.<br />
1<br />
2<br />
3<br />
4<br />
5<br />
6<br />
7<br />
8<br />
9<br />
10<br />
11<br />
12<br />
13<br />
14<br />
15<br />
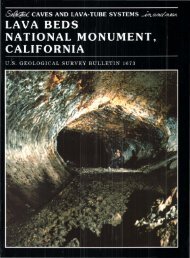
Figure ES-4 illustrates the relative contribution of the direct greenhouse gases to total U.S. emissions in 2015. Note,<br />
unless otherwise stated, all tables and figures provide total emissions without LULUCF. The primary greenhouse<br />
gas emitted by human activities in the United States was CO 2, representing approximately 82.2 percent of total<br />
greenhouse gas emissions. The largest source of CO 2, and of overall greenhouse gas emissions, was fossil fuel<br />
combustion. Methane emissions, which have decreased by 16.7 percent since 1990, resulted primarily from enteric<br />
fermentation associated with domestic livestock, natural gas systems, and decomposition of wastes in landfills.<br />
Agricultural soil management, manure management, mobile source fuel combustion and stationary fuel combustion<br />
were the major sources of N 2O emissions. Ozone depleting substance substitute emissions and emissions of HFC-23<br />
during the production of HCFC-22 were the primary contributors to aggregate hydrofluorocarbon (HFC) emissions.<br />
Perfluorocarbon (PFC) emissions resulted as a byproduct of primary aluminum production and from semiconductor<br />
manufacturing, electrical transmission and distribution systems accounted for most sulfur hexafluoride (SF 6)<br />
emissions, and semiconductor manufacturing is the only source of nitrogen trifluoride (NF 3) emissions.<br />
Figure ES-4: 2015 U.S. Greenhouse Gas Emissions by Gas (Percentages based on MMT CO2<br />
Eq.)<br />
16<br />
17<br />
18<br />
19<br />
20<br />
21<br />
22<br />
23<br />
24<br />
25<br />
26<br />
27<br />
Overall, from 1990 to 2015, total emissions of CO 2 increased by 289.2 MMT CO 2 Eq. (5.6 percent), while total<br />
emissions of CH 4 decreased by 131.2 MMT CO 2 Eq. (16.7 percent), and N 2O emissions decreased by 24.5 MMT<br />
CO 2 Eq. (6.8 percent). During the same period, aggregate weighted emissions of HFCs, PFCs, SF 6 and NF 3 rose by<br />
85.9 MMT CO 2 Eq. (86.2 percent). From 1990 to 2015, HFCs increased by 127.5 MMT CO 2 Eq. (273.8 percent),<br />
PFCs decreased by 19.1 MMT CO 2 Eq. (78.7 percent), SF 6 decreased by 23.0 MMT CO 2 Eq. (79.8 percent), and<br />
NF 3 increased by 0.5 MMT CO 2 Eq. (1,057.0 percent). Despite being emitted in smaller quantities relative to the<br />
other principal greenhouse gases, emissions of HFCs, PFCs, SF 6 and NF 3 are significant because many of these<br />
gases have extremely high global warming potentials and, in the cases of PFCs and SF 6, long atmospheric lifetimes.<br />
Conversely, U.S. greenhouse gas emissions were partly offset by carbon (C) sequestration in forests, trees in urban<br />
areas, agricultural soils, landfilled yard trimmings and food scraps, and coastal wetlands, which, in aggregate, offset<br />
8 DRAFT Inventory of U.S. Greenhouse Gas Emissions and Sinks: 1990–2015
1<br />
2<br />
3<br />
4<br />
5<br />
6<br />
7<br />
8<br />
9<br />
10<br />
11<br />
12<br />
13<br />
14<br />
15<br />
5.9 percent of total emissions in 2015. The following sections describe each gas’s contribution to total U.S.<br />
greenhouse gas emissions in more detail.<br />
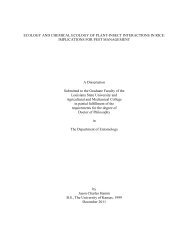
Carbon Dioxide Emissions<br />
The global carbon cycle is made up of large carbon flows and reservoirs. Billions of tons of carbon in the form of<br />
CO 2 are absorbed by oceans and living biomass (i.e., sinks) and are emitted to the atmosphere annually through<br />
natural processes (i.e., sources). When in equilibrium, carbon fluxes among these various reservoirs are roughly<br />
balanced. 13 Since the Industrial Revolution (i.e., about 1750), global atmospheric concentrations of CO 2 have risen<br />
approximately 44 percent (IPCC 2013 and NOAA/ESRL 2017), principally due to the combustion of fossil fuels.<br />
Within the United States, fossil fuel combustion accounted for 93.3 percent of CO 2 emissions in 2015. Globally,<br />
approximately 32,381 MMT of CO 2 were added to the atmosphere through the combustion of fossil fuels in 2014, of<br />
which the United States accounted for approximately 16 percent. 14 Changes in land use and forestry practices can<br />
lead to net CO 2 emissions (e.g., through conversion of forest land to agricultural or urban use) or to a net sink for<br />
CO 2 (e.g., through net additions to forest biomass). Although fossil fuel combustion is the greatest source of CO 2<br />
emissions, there are 24 additional sources included in the Inventory (Figure ES-5).<br />
Figure ES-5: 2015 Sources of CO2 Emissions (MMT CO2 Eq.)<br />
16<br />
17<br />
18<br />
19<br />
20<br />
Note: Fossil Fuel Combustion includes electricity generation, which also includes emissions of less than 0.05 MMT CO2 Eq.<br />
from geothermal-based generation.<br />
As the largest source of U.S. greenhouse gas emissions, CO 2 from fossil fuel combustion has accounted for<br />
approximately 77 percent of GWP-weighted emissions since 1990. The fundamental factors influencing emissions<br />
13 The term “flux” is used to describe the net emissions of greenhouse gases accounting for both the emissions of CO2 to and the<br />
removals of CO2 from the atmosphere. Removal of CO2 from the atmosphere is also referred to as “carbon sequestration.”<br />
14 Global CO2 emissions from fossil fuel combustion were taken from International Energy Agency CO2 Emissions from Fossil<br />
Fuels Combustion – Highlights IEA (2016). See .<br />
<strong>Executive</strong> <strong>Summary</strong><br />
ES-9
1<br />
2<br />
3<br />
4<br />
5<br />
6<br />
7<br />
8<br />
9<br />
10<br />
11<br />
12<br />
13<br />
14<br />
15<br />
levels include (1) changes in demand for energy and (2) a general decline in the carbon intensity of fuels combusted<br />
for energy in recent years by most sectors of the economy. Between 1990 and 2015, CO 2 emissions from fossil fuel<br />
combustion increased from 4,740.7 MMT CO 2 Eq. to 5,049.2 MMT CO 2 Eq., a 6.5 percent total increase over the<br />
twenty-six-year period. In addition, CO 2 emissions from fossil fuel combustion decreased from 2005 levels by 698.0<br />
MMT CO 2 Eq., a decrease of approximately 12.1 percent between 2005 to 2015. From 2014 to 2015, these<br />
emissions decreased by 153.0 MMT CO 2 Eq. (2.9 percent).<br />
Historically, changes in emissions from fossil fuel combustion have been the dominant factor affecting U.S.<br />
emission trends. Changes in CO 2 emissions from fossil fuel combustion are influenced by many long-term and<br />
short-term factors. Long-term factors include population and economic trends, technological changes, shifting<br />
energy fuel choices, and various policies at the national, state, and local level. In the short term, the overall<br />
consumption of fossil fuels in the United States fluctuates primarily in response to changes in general economic<br />
conditions, energy prices, weather, and the availability of non-fossil alternatives.<br />
Figure ES-6: 2015 CO2 Emissions from Fossil Fuel Combustion by Sector and Fuel Type (MMT<br />
CO2 Eq.)<br />
16<br />
17<br />
18<br />
19<br />
Figure ES-7: 2015 End-Use Sector Emissions of CO2 from Fossil Fuel Combustion (MMT CO2<br />
Eq.)<br />
20<br />
21<br />
22<br />
23<br />
The five major fuel consuming economic sectors contributing to CO 2 emissions from fossil fuel combustion are<br />
electricity generation, transportation, industrial, residential, and commercial. Carbon dioxide emissions are produced<br />
by the electricity generation sector as they consume fossil fuel to provide electricity to one of the other four sectors,<br />
10 DRAFT Inventory of U.S. Greenhouse Gas Emissions and Sinks: 1990–2015
1<br />
2<br />
3<br />
4<br />
5<br />
6<br />
7<br />
8<br />
9<br />
or “end-use” sectors. For the discussion below, electricity generation emissions have been distributed to each enduse<br />
sector on the basis of each sector’s share of aggregate electricity consumption. This method of distributing<br />
emissions assumes that each end-use sector consumes electricity that is generated from the national average mix of<br />
fuels according to their carbon intensity. Emissions from electricity generation are also addressed separately after<br />
the end-use sectors have been discussed.<br />
Note that emissions from U.S. Territories are calculated separately due to a lack of specific consumption data for the<br />
individual end-use sectors. Figure ES-6, Figure ES-7, and Table ES-3 summarize CO 2 emissions from fossil fuel<br />
combustion by end-use sector.<br />
Table ES-3: CO2 Emissions from Fossil Fuel Combustion by End-Use Sector (MMT CO2 Eq.)<br />
End-Use Sector 1990 2005 2011 2012 2013 2014 2015<br />
Transportation 1,496.8 1,891.8 1,711.9 1,700.6 1,717.0 1,734.4 1,737.0<br />
Combustion 1,493.8 1,887.0 1,707.6 1,696.8 1,713.0 1,730.4 1,733.2<br />
Electricity 3.0 4.7 4.3 3.9 4.0 4.1 3.7<br />
Industrial 1,529.2 1,564.6 1,399.6 1,375.7 1,407.0 1,409.0 1,378.3<br />
Combustion 842.5 828.0 775.0 782.9 812.2 815.8 828.8<br />
Electricity 686.7 736.6 624.7 592.8 594.7 593.2 549.6<br />
Residential 931.4 1,214.1 1,116.2 1,007.8 1,064.6 1,080.1 1,003.8<br />
Combustion 338.3 357.8 325.5 282.5 329.7 345.4 319.6<br />
Electricity 593.0 856.3 790.7 725.3 734.9 734.7 684.3<br />
Commercial 755.4 1,026.8 958.4 897.0 925.5 937.4 888.8<br />
Combustion 217.4 223.5 220.4 196.7 221.0 231.4 225.7<br />
Electricity 538.0 803.3 738.0 700.3 704.5 706.0 663.1<br />
U.S. Territories a 27.9 49.9 41.5 43.6 43.5 41.2 41.2<br />
Total 4,740.7 5,747.1 5,227.7 5,024.7 5,157.6 5,202.1 5,049.2<br />
Electricity Generation 1,820.8 2,400.9 2,157.7 2,022.2 2,038.1 2,038.0 1,900.7<br />
a<br />
Fuel consumption by U.S. Territories (i.e., American Samoa, Guam, Puerto Rico, U.S. Virgin Islands, Wake<br />
Island, and other U.S. Pacific Islands) is included in this report.<br />
Notes: Combustion-related emissions from electricity generation are allocated based on aggregate national<br />
electricity consumption by each end-use sector. Totals may not sum due to independent rounding.<br />
10<br />
11<br />
12<br />
13<br />
14<br />
15<br />
16<br />
17<br />
18<br />
19<br />
20<br />
21<br />
22<br />
23<br />
24<br />
25<br />
26<br />
27<br />
28<br />
29<br />
Transportation End-Use Sector. When electricity-related emissions are distributed to economic end-use sectors,<br />
transportation activities accounted for 34.4 percent of U.S. CO 2 emissions from fossil fuel combustion in 2015. The<br />
largest sources of transportation CO 2 emissions in 2015 were passenger cars (41.9 percent), medium- and heavyduty<br />
trucks (23.6 percent), light-duty trucks, which include sport utility vehicles, pickup trucks, and minivans (17.5<br />
percent), commercial aircraft (6.9 percent), rail (2.5 percent), other aircraft (2.3 percent), pipelines (2.2 percent), and<br />
ships and boats (1.8 percent). Annex 3.2 presents the total emissions from all transportation and mobile sources,<br />
including CO 2, CH 4, N 2O, and HFCs.<br />
In terms of the overall trend, from 1990 to 2015, total transportation CO 2 emissions rose by 16 percent due, in large<br />
part, to increased demand for travel. The number of VMT by light-duty motor vehicles (i.e., passenger cars and<br />
light-duty trucks) increased 42 percent from 1990 to 2015, as a result of a confluence of factors including population<br />
growth, economic growth, urban sprawl, and low fuel prices during the beginning of this period. Almost all of the<br />
energy consumed for transportation was supplied by petroleum-based products, with more than half being related to<br />
gasoline consumption in automobiles and other highway vehicles. Other fuel uses, especially diesel fuel for freight<br />
trucks and jet fuel for aircraft, accounted for the remainder.<br />
Industrial End-Use Sector. Industrial CO 2 emissions, resulting both directly from the combustion of fossil fuels and<br />
indirectly from the generation of electricity that is consumed by industry, accounted for 27 percent of CO 2 from<br />
fossil fuel combustion in 2015. Approximately 60 percent of these emissions resulted from direct fossil fuel<br />
combustion to produce steam and/or heat for industrial processes. The remaining emissions resulted from consuming<br />
electricity for motors, electric furnaces, ovens, lighting, and other applications. In contrast to the other end-use<br />
sectors, emissions from industry have declined since 1990. This decline is due to structural changes in the U.S.<br />
<strong>Executive</strong> <strong>Summary</strong><br />
ES-11
1<br />
2<br />
3<br />
4<br />
5<br />
6<br />
7<br />
8<br />
9<br />
10<br />
11<br />
12<br />
13<br />
14<br />
15<br />
16<br />
17<br />
18<br />
19<br />
20<br />
21<br />
22<br />
23<br />
24<br />
25<br />
26<br />
27<br />
28<br />
29<br />
30<br />
31<br />
32<br />
33<br />
34<br />
35<br />
36<br />
37<br />
38<br />
39<br />
40<br />
41<br />
42<br />
43<br />
economy (i.e., shifts from a manufacturing-based to a service-based economy), fuel switching, and efficiency<br />
improvements.<br />
Residential and Commercial End-Use Sectors. The residential and commercial end-use sectors accounted for 20 and<br />
18 percent, respectively, of CO 2 emissions from fossil fuel combustion in 2015. Both sectors relied heavily on<br />
electricity for meeting energy demands, with 68 and 75 percent, respectively, of their emissions attributable to<br />
electricity consumption for lighting, heating, cooling, and operating appliances. The remaining emissions were due<br />
to the consumption of natural gas and petroleum for heating and cooking. Emissions from the residential and<br />
commercial end-use sectors have increased by 8 percent and 18 percent since 1990, respectively.<br />
Electricity Generation. The United States relies on electricity to meet a significant portion of its energy demands.<br />
Electricity generators consumed 34 percent of total U.S. energy uses from fossil fuels and emitted 38 percent of the<br />
CO 2 from fossil fuel combustion in 2015. The type of energy source used to generate electricity is the main factor<br />
influencing emissions. For example, some electricity is generated through non-fossil fuel options such as nuclear,<br />
hydroelectric, or geothermal energy. Including all electricity generation modes, electricity generators relied on coal<br />
for approximately 33 percent of their total energy requirements in 2015. 15 In addition, the coal used by electricity<br />
generators accounted for 93 percent of all coal consumed for energy in the United States in 2015. 16 Recently, a<br />
decrease in the carbon intensity of fuels consumed to generate electricity has occurred due to a decrease in coal<br />
consumption, and increased natural gas consumption and other generation sources. Including all electricity<br />
generation modes, electricity generators used natural gas for approximately 33 percent of their total energy<br />
requirements in 2015. 17 Across the time series, changes in electricity demand and the carbon intensity of fuels used<br />
for electricity generation have a significant impact on CO 2 emissions. While emissions from the electric power<br />
sector have increased by approximately 4 percent since 1990, the carbon intensity of the electric power sector, in<br />
terms of CO 2 Eq. per QBtu has significantly decreased by 16 percent during that same timeframe.<br />
Other significant CO 2 trends included the following:<br />
Carbon dioxide emissions from non-energy use of fossil fuels increased by 9.4 MMT CO 2 Eq. (8.0 percent)<br />
from 1990 through 2015. Emissions from non-energy uses of fossil fuels were 127.0 MMT CO 2 Eq. in<br />
2015, which constituted 2.3 percent of total national CO 2 emissions, approximately the same proportion as<br />
in 1990.<br />
Carbon dioxide emissions from iron and steel production and metallurgical coke production have decreased<br />
by 51.8 MMT CO 2 Eq. (51.9 percent) from 1990 through 2015, due to restructuring of the industry,<br />
technological improvements, and increased scrap steel utilization.<br />
Carbon dioxide emissions from ammonia production (10.8 MMT CO 2 Eq. in 2015) decreased by 2.2 MMT<br />
CO 2 Eq. (17.2 percent) since 1990. Ammonia production relies on natural gas as both a feedstock and a<br />
fuel, and as such, market fluctuations and volatility in natural gas prices affect the production of ammonia.<br />
Total C sequestration (i.e., net CO 2 removals) in the LULUCF sector decreased by approximately 16.0<br />
percent between 1990 and 2015. This decrease was primarily due to a decrease in the rate of net C<br />
accumulation in forest C stocks and an increase in emissions from Land Converted to Grassland.<br />
Box ES-2: Use of Ambient Measurements Systems for Validation of Emission Inventories<br />
In following the UNFCCC requirement under Article 4.1 to develop and submit national greenhouse gas emission<br />
inventories, the emissions and sinks presented in this report are organized by source and sink categories and<br />
calculated using internationally-accepted methods provided by the IPCC. 18 Several recent studies have measured<br />
emissions at the national or regional level with results that sometimes differ from EPA’s estimate of emissions. EPA<br />
has engaged with researchers on how remote sensing, ambient measurement, and inverse modeling techniques for<br />
greenhouse gas emissions could assist in improving the understanding of inventory estimates. In working with the<br />
15 See .<br />
16 See Table 6.2 Coal Consumption by Sector of EIA 2016.<br />
17 See .<br />
18 See .<br />
12 DRAFT Inventory of U.S. Greenhouse Gas Emissions and Sinks: 1990–2015
1<br />
2<br />
3<br />
4<br />
5<br />
6<br />
7<br />
8<br />
9<br />
10<br />
11<br />
12<br />
research community on ambient measurement and remote sensing techniques to improve national greenhouse gas<br />
inventories, EPA relies upon guidance from the IPCC on the use of measurements and modeling to validate<br />
emission inventories. 19 An area of particular interest in EPA’s outreach efforts is how ambient measurement data can<br />
be used in a manner consistent with this Inventory report’s transparency on its calculation methodologies, and the<br />
ability of these techniques to attribute emissions and removals from remote sensing to anthropogenic sources, as<br />
defined by the IPCC for this report, versus natural sources and sinks.<br />
In an effort to improve the ability to compare the national-level greenhouse gas inventory with measurement results<br />
that may be at other scales, a team at Harvard University along with EPA and other coauthors developed a gridded<br />
inventory of U.S. anthropogenic methane emissions with 0.1° x 0.1° spatial resolution, monthly temporal resolution,<br />
and detailed scale-dependent error characterization. The Inventory is designed to be consistent with the 1990 to 2014<br />
U.S. EPA Inventory of U.S. Greenhouse Gas Emissions and Sinks estimates for the year 2012, which presents<br />
national totals for different source types. 20<br />
13<br />
14<br />
15<br />
16<br />
17<br />
18<br />
19<br />
20<br />
21<br />
Methane Emissions<br />
Methane (CH 4) is 25 times as effective as CO 2 at trapping heat in the atmosphere (IPCC 2007). Over the last two<br />
hundred and fifty years, the concentration of CH 4 in the atmosphere increased by 162 percent (IPCC 2013 and<br />
CDIAC 2016). Anthropogenic sources of CH 4 include natural gas and petroleum systems, agricultural activities,<br />
landfills, coal mining, wastewater treatment, stationary and mobile combustion, and certain industrial processes (see<br />
Figure ES-8).<br />
Figure ES-8: 2015 Sources of CH4 Emissions (MMT CO2 Eq.)<br />
22<br />
23<br />
24<br />
Some significant trends in U.S. emissions of CH 4 include the following:<br />
19 See .<br />
20 See .<br />
<strong>Executive</strong> <strong>Summary</strong><br />
ES-13
1<br />
2<br />
3<br />
4<br />
5<br />
6<br />
7<br />
8<br />
9<br />
10<br />
11<br />
12<br />
13<br />
14<br />
15<br />
16<br />
17<br />
18<br />
19<br />
20<br />
21<br />
22<br />
23<br />
24<br />
25<br />
26<br />
27<br />
28<br />
29<br />
30<br />
31<br />
32<br />
33<br />
34<br />
35<br />
36<br />
37<br />
38<br />
39<br />
40<br />
41<br />
42<br />
43<br />
44<br />
45<br />
46<br />
Enteric fermentation is the largest anthropogenic source of CH 4 emissions in the United States. In 2015,<br />
enteric fermentation CH 4 emissions were 166.5 MMT CO 2 Eq. (25.4 percent of total CH 4 emissions),<br />
which represents an increase of 2.4 MMT CO 2 Eq. (1.5 percent) since 1990. This increase in emissions<br />
from 1990 to 2015 generally follows the increasing trends in cattle populations. From 1990 to 1995,<br />
emissions increased and then generally decreased from 1996 to 2004, mainly due to fluctuations in beef<br />
cattle populations and increased digestibility of feed for feedlot cattle. Emissions increased from 2005 to<br />
2007, as both dairy and beef populations increased. Research indicates that the feed digestibility of dairy<br />
cow diets decreased during this period. Emissions decreased again from 2008 to 2015 as beef cattle<br />
populations again decreased.<br />
Natural gas systems were the second largest anthropogenic source category of CH 4 emissions in the United<br />
States in 2015 with 160.0 MMT CO 2 Eq. of CH 4 emitted into the atmosphere. Those emissions have<br />
decreased by 36.5 MMT CO 2 Eq. (18.6 percent) since 1990. The decrease in CH 4 emissions is largely due<br />
to the decrease in emissions from transmission, storage, and distribution. The decrease in transmission and<br />
storage emissions is largely due to reduced compressor station emissions (including emissions from<br />
compressors and fugitives). The decrease in distribution emissions is largely attributed to increased use of<br />
plastic piping, which has lower emissions than other pipe materials, and station upgrades at metering and<br />
regulating (M&R) stations.<br />
Landfills are the third largest anthropogenic source of CH 4 emissions in the United States (115.7 MMT<br />
CO 2 Eq.), accounting for 17.7 percent of total CH 4 emissions in 2015. From 1990 to 2015, CH 4 emissions<br />
from landfills decreased by 63.8 MMT CO 2 Eq. (35.6 percent), with small increases occurring in some<br />
interim years. This downward trend in emissions coincided with increased landfill gas collection and<br />
control systems, and a reduction of decomposable materials (i.e., paper and paperboard, food scraps, and<br />
yard trimmings) discarded in MSW landfills over the time series, 21 which has more than offset the<br />
additional CH 4 emissions resulting from an increase in the amount of municipal solid waste landfilled.<br />
Methane emissions from manure management, the fourth largest anthropogenic source of CH 4 emissions in<br />
the United States, increased by 78.3 percent since 1990, from 37.2 MMT CO 2 Eq. in 1990 to 66.3 MMT<br />
CO 2 Eq. in 2015. The majority of this increase was from swine and dairy cow manure, since the general<br />
trend in manure management is one of increasing use of liquid systems, which tends to produce greater<br />
CH 4 emissions. The increase in liquid systems is the combined result of a shift to larger facilities, and to<br />
facilities in the West and Southwest, all of which tend to use liquid systems. Also, new regulations limiting<br />
the application of manure nutrients have shifted manure management practices at smaller dairies from daily<br />
spread to manure managed and stored on site.<br />
Methane emissions from petroleum systems in the United States (41.5 MMT CO 2 Eq.) accounted for 6.3<br />
percent of total CH 4 emissions in 2015. From 1990 to 2015, CH 4 emissions from petroleum systems<br />
decreased by 16.8 MMT CO 2 Eq. (or 28.8 percent). Production segment CH 4 emissions have decreased by<br />
around 8 percent from 2014 levels, primarily due to decreases in emissions from associated gas venting and<br />
flaring.<br />
Nitrous Oxide Emissions<br />
Nitrous oxide (N 2O) is produced by biological processes that occur in soil and water and by a variety of<br />
anthropogenic activities in the agricultural, energy-related, industrial, and waste management fields. While total N 2O<br />
emissions are much lower than CO 2 emissions, N 2O is approximately 300 times more powerful than CO 2 at trapping<br />
heat in the atmosphere (IPCC 2007). Since 1750, the global atmospheric concentration of N 2O has risen by<br />
approximately 21 percent (IPCC 2013 and CDIAC 2016). The main anthropogenic activities producing N 2O in the<br />
United States are agricultural soil management, stationary fuel combustion, fuel combustion in motor vehicles,<br />
manure management, and nitric acid production (see Figure ES-9).<br />
21 Carbon dioxide emissions from landfills are not included specifically in summing waste sector totals. Net carbon fluxes from<br />
changes in biogenic carbon reservoirs and disposed wood products are accounted for in the estimates for LULUCF.<br />
14 DRAFT Inventory of U.S. Greenhouse Gas Emissions and Sinks: 1990–2015
1<br />
Figure ES-9: 2015 Sources of N2O Emissions (MMT CO2 Eq.)<br />
2<br />
3<br />
4<br />
5<br />
6<br />
7<br />
8<br />
9<br />
10<br />
11<br />
12<br />
13<br />
14<br />
15<br />
16<br />
17<br />
18<br />
19<br />
20<br />
21<br />
22<br />
23<br />
24<br />
25<br />
26<br />
27<br />
28<br />
29<br />
30<br />
31<br />
32<br />
Some significant trends in U.S. emissions of N 2O include the following:<br />
<br />
<br />
<br />
<br />
<br />
Agricultural soils accounted for approximately 75.0 percent of N 2O emissions and 3.8 percent of total<br />
emissions in the United States in 2015. Estimated emissions from this source in 2015 were 251.3 MMT<br />
CO 2 Eq. Annual N 2O emissions from agricultural soils fluctuated between 1990 and 2015, although overall<br />
emissions were 2.0 percent lower in 2015 than in 1990. Year-to-year fluctuations are largely a reflection of<br />
annual variation in weather patterns, synthetic fertilizer use, and crop production.<br />
Nitrous oxide emissions from stationary combustion increased 11.2 MMT CO 2 Eq. (94.0 percent) from<br />
1990 through 2015. Nitrous oxide emissions from this source increased primarily as a result of an increase<br />
in the number of coal fluidized bed boilers in the electric power sector.<br />
In 2015, total N 2O emissions from manure management were estimated to be 17.7 MMT CO 2 Eq.;<br />
emissions were 14.0 MMT CO 2 Eq. in 1990. These values include both direct and indirect N 2O emissions<br />
from manure management. Nitrous oxide emissions have remained fairly steady since 1990. Small changes<br />
in N 2O emissions from individual animal groups exhibit the same trends as the animal group populations,<br />
with the overall net effect that N 2O emissions showed a 26.6 percent increase from 1990 to 2015 and a 1.1<br />
percent increase from 2014 through 2015.<br />
Nitrous oxide emissions from mobile combustion decreased by 25.8 MMT CO 2 Eq. (62.7 percent) from<br />
1990 through 2015, primarily as a result of N 2O national emission control standards and emission control<br />
technologies for on-road vehicles.<br />
Nitrous oxide emissions from adipic acid production were 4.3 MMT CO 2 Eq. in 2015, and have decreased<br />
significantly since 1990 due to both the widespread installation of pollution control measures in the late<br />
1990s and plant idling in the late 2000s. Emissions from adipic acid production have decreased by 72.0<br />
percent since 1990 and by 74.8 percent since a peak in 1995.<br />
HFC, PFC, SF 6 , and NF 3 Emissions<br />
Hydrofluorocarbons (HFCs) and perfluorocarbons (PFCs) are families of synthetic chemicals that are used as<br />
alternatives to ozone depleting substances (ODS), which are being phased out under the Montreal Protocol and<br />
Clean Air Act Amendments of 1990. Hydrofluorocarbons and PFCs do not deplete the stratospheric ozone layer,<br />
and are therefore acceptable alternatives under the Montreal Protocol on Substances that Deplete the Ozone Layer.<br />
These compounds, however, along with SF 6 and NF 3, are potent greenhouse gases. In addition to having high global<br />
warming potentials, SF 6 and PFCs have extremely long atmospheric lifetimes, resulting in their essentially<br />
<strong>Executive</strong> <strong>Summary</strong><br />
ES-15
1<br />
2<br />
3<br />
4<br />
5<br />
6<br />
irreversible accumulation in the atmosphere once emitted. Sulfur hexafluoride is the most potent greenhouse gas the<br />
IPCC has evaluated (IPCC 2013).<br />
Other emissive sources of these gases include HCFC-22 production, electrical transmission and distribution systems,<br />
semiconductor manufacturing, aluminum production, and magnesium production and processing (see Figure ES-10).<br />
Figure ES-10: 2015 Sources of HFCs, PFCs, SF6, and NF3 Emissions (MMT CO2 Eq.)<br />
7<br />
8<br />
9<br />
10<br />
11<br />
12<br />
13<br />
14<br />
15<br />
16<br />
17<br />
18<br />
19<br />
20<br />
21<br />
22<br />
23<br />
24<br />
25<br />
26<br />
27<br />
28<br />
29<br />
30<br />
Some significant trends in U.S. HFC, PFC, SF 6, and NF 3 emissions include the following:<br />
Emissions resulting from the substitution of ODS (e.g., chlorofluorocarbons [CFCs]) have been<br />
consistently increasing, from small amounts in 1990 to 168.6 MMT CO 2 Eq. in 2015. This increase was in<br />
large part the result of efforts to phase out CFCs and other ODS in the United States. In the short term, this<br />
trend is expected to continue, and will likely continue over the next decade as hydrochlorofluorocarbons<br />
(HCFCs), which are interim substitutes in many applications, are themselves phased out under the<br />
provisions of the Copenhagen Amendments to the Montreal Protocol.<br />
GWP-weighted PFC, HFC, SF 6, and NF 3 emissions from semiconductor manufacture have increased by<br />
34.3 percent from 1990 to 2015, due to industrial growth and the adoption of emission reduction<br />
technologies. Within that time span, emissions peaked in 1999, the initial year of EPA’s PFC<br />
Reduction/Climate Partnership for the Semiconductor Industry, but have since declined to 4.8 MMT CO 2<br />
Eq. in 2015 (a 47.1 percent decrease relative to 1999).<br />
Sulfur hexafluoride emissions from electric power transmission and distribution systems decreased by 82.0<br />
percent (19.0 MMT CO 2 Eq.) from 1990 to 2015. There are two potential causes for this decrease: (1) a<br />
sharp increase in the price of SF 6 during the 1990s and (2) a growing awareness of the environmental<br />
impact of SF 6 emissions through programs such as EPA’s SF 6 Emission Reduction Partnership for Electric<br />
Power Systems.<br />
Perfluorocarbon emissions from aluminum production decreased by 90.7 percent (19.5 MMT CO 2 Eq.)<br />
from 1990 to 2015. This decline is due both to reductions in domestic aluminum production and to actions<br />
taken by aluminum smelting companies to reduce the frequency and duration of anode effects.<br />
16 DRAFT Inventory of U.S. Greenhouse Gas Emissions and Sinks: 1990–2015
1<br />
2<br />
3<br />
4<br />
5<br />
6<br />
7<br />
8<br />
9<br />
10<br />
11<br />
12<br />
ES.3 Overview of Sector Emissions and Trends<br />
In accordance with the UNFCCC decision to set the 2006 IPCC Guidelines for National Greenhouse Gas<br />
Inventories (IPCC 2006) as the standard for Annex I countries at the Nineteenth Conference of the Parties<br />
(UNFCCC 2014), Figure ES-11 and Table ES-4 aggregate emissions and sinks by the sectors defined by those<br />
guidelines. Over the twenty-six-year period of 1990 to 2015, total emissions in the Energy, Industrial Processes and<br />
Product Use, and Agriculture grew by 215.7 MMT CO 2 Eq. (4.0 percent), 36.7 MMT CO 2 Eq. (10.9 percent), and<br />
27.0 MMT CO 2 Eq. (5.5 percent), respectively. Over the same period, total emissions in the Waste sector decreased<br />
by 59.9 MMT CO 2 Eq. (30.1 percent) and estimates of net C sequestration in the Land Use, Land-Use Change, and<br />
Forestry (LULUCF) sector (magnitude of emissions plus CO 2 removals from all LULUCF source categories)<br />
decreased by 82.7 MMT CO 2 Eq. (18.4 percent).<br />
Figure ES-11: U.S. Greenhouse Gas Emissions and Sinks by Chapter/IPCC Sector (MMT CO2<br />
Eq.)<br />
13<br />
14<br />
15<br />
16<br />
17<br />
Table ES-4: Recent Trends in U.S. Greenhouse Gas Emissions and Sinks by Chapter/IPCC<br />
Sector (MMT CO2 Eq.)<br />
Chapter/IPCC Sector 1990 2005 2011 2012 2013 2014 2015<br />
Energy 5,333.8 6,279.4 5,721.8 5,506.9 5,659.3 5,703.2 5,549.4<br />
Fossil Fuel Combustion 4,740.7 5,747.1 5,227.7 5,024.7 5,157.6 5,202.1 5,049.2<br />
Natural Gas Systems 234.3 192.2 189.3 190.5 196.4 203.2 202.4<br />
Non-Energy Use of Fuels 117.7 138.3 108.5 105.5 122.0 117.2 127.0<br />
Coal Mining 96.5 64.1 71.2 66.5 64.6 64.8 60.9<br />
Petroleum Systems 61.8 52.0 54.3 52.3 50.3 48.5 45.1<br />
Stationary Combustion 20.4 27.6 28.4 28.0 30.9 31.5 30.1<br />
Mobile Combustion 46.9 38.6 25.1 22.6 20.6 18.6 17.4<br />
Incineration of Waste 8.4 12.9 10.9 10.7 10.7 10.9 11.0<br />
Abandoned Underground Coal Mines 7.2 6.6 6.4 6.2 6.2 6.3 6.4<br />
Industrial Processes and Product Use 338.3 351.6 369.7 359.5 362.4 378.1 375.1<br />
<strong>Executive</strong> <strong>Summary</strong><br />
ES-17
Substitution of Ozone Depleting<br />
Substances 0.3 99.8 145.4 150.2 154.7 161.3 168.6<br />
Iron and Steel Production &<br />
Metallurgical Coke Production 99.7 66.6 59.9 54.2 52.2 57.5 47.9<br />
Cement Production 33.3 45.9 32.0 35.1 36.1 38.8 39.6<br />
Petrochemical Production 21.5 27.0 26.4 26.6 26.5 26.6 28.2<br />
Lime Production 11.7 14.6 14.0 13.8 14.0 14.2 13.3<br />
Nitric Acid Production 12.1 11.3 10.9 10.5 10.7 10.9 11.6<br />
Other Process Uses of Carbonates 4.9 6.3 9.3 8.0 10.4 11.8 10.8<br />
Ammonia Production 13.0 9.2 9.3 9.4 10.0 9.6 10.8<br />
HCFC-22 Production 46.1 20.0 8.8 5.5 4.1 5.0 5.0<br />
Semiconductor Manufacture 3.6 4.7 4.9 4.5 4.1 5.0 5.0<br />
Aluminum Production 28.3 7.6 6.8 6.4 6.2 5.4 4.8<br />
Carbon Dioxide Consumption 1.5 1.4 4.1 4.0 4.2 4.5 4.3<br />
Adipic Acid Production 15.2 7.1 10.2 5.5 3.9 5.4 4.3<br />
N₂O from Product Uses 4.2 4.2 4.2 4.2 4.2 4.2 4.2<br />
Electrical Transmission and<br />
Distribution 23.1 8.3 6.0 4.8 4.6 4.8 4.2<br />
Soda Ash Production and<br />
Consumption 2.8 3.0 2.7 2.8 2.8 2.8 2.8<br />
Ferroalloy Production 2.2 1.4 1.7 1.9 1.8 1.9 2.0<br />
Titanium Dioxide Production 1.2 1.8 1.7 1.5 1.7 1.7 1.6<br />
Glass Production 1.5 1.9 1.3 1.2 1.3 1.3 1.3<br />
Urea Consumption for Non-<br />
Agricultural Purposes 3.8 3.7 4.0 4.4 4.0 1.4 1.1<br />
Magnesium Production and<br />
Processing 5.2 2.7 2.8 1.7 1.5 1.1 1.0<br />
Phosphoric Acid Production 1.5 1.3 1.2 1.1 1.1 1.0 1.0<br />
Zinc Production 0.6 1.0 1.3 1.5 1.4 1.0 0.9<br />
Lead Production 0.5 0.6 0.5 0.5 0.5 0.5 0.5<br />
Silicon Carbide Production and<br />
Consumption 0.4 0.2 0.2 0.2 0.2 0.2 0.2<br />
Agriculture 495.3 526.4 541.9 525.9 516.9 514.7 522.3<br />
Agricultural Soil Management 256.6 259.8 270.1 254.1 250.5 250.0 251.3<br />
Enteric Fermentation 164.2 168.9 168.9 166.7 165.5 164.2 166.5<br />
Manure Management 51.1 72.9 80.4 83.2 80.8 80.4 84.0<br />
Rice Cultivation 16.0 16.7 14.1 11.3 11.3 11.4 11.2<br />
Urea Fertilization 2.4 3.5 4.1 4.3 4.5 4.8 5.0<br />
Liming 4.7 4.3 3.9 6.0 3.9 3.6 3.8<br />
Field Burning of Agricultural<br />
Residues 0.3 0.3 0.4 0.4 0.4 0.4 0.4<br />
Waste 199.3 158.2 142.6 144.4 140.4 140.2 139.4<br />
Landfills 179.6 134.3 119.0 120.8 116.7 116.6 115.7<br />
Wastewater Treatment 19.1 20.4 20.1 19.9 19.8 19.7 19.7<br />
Composting 0.7 3.5 3.5 3.7 3.9 4.0 4.0<br />
Total Emissions a 6,366.7 7,315.6 6,776.0 6,536.8 6,678.9 6,736.3 6,586.2<br />
Land Use, Land-Use Change, and<br />
Forestry (449.1) (315.3) (375.1) (387.7) (370.4) (368.8) (366.4)<br />
Forest Land (785.0) (730.7) (734.8) (724.6) (734.5) (732.8) (729.7)<br />
Cropland b 59.8 16.1 16.2 13.9 12.9 13.8 14.5<br />
Grassland b 241.2 329.9 286.0 273.6 302.4 302.9 302.3<br />
Wetlands (4.0) (5.3) (4.1) (4.2) (4.3) (4.2) (4.3)<br />
Settlements 39.0 74.7 61.6 53.7 53.1 51.6 50.7<br />
Net Emissions (Sources and Sinks) c 5,917.6 7,000.3 6,400.9 6,149.1 6,308.5 6,367.5 6,219.8<br />
Notes: Total emissions presented without LULUCF. Net emissions presented with LULUCF.<br />
a<br />
Total emissions without LULUCF.<br />
b<br />
Quality control uncovered errors in the estimate and uncertainty of soil C stock changes for 2013, 2014, 2015, which will be<br />
updated following public review. Corrected estimates are provided in footnotes of the emission summary tables for<br />
18 DRAFT Inventory of U.S. Greenhouse Gas Emissions and Sinks: 1990–2015
Cropland Remaining Cropland, Land Converted to Cropland, Grassland Remaining Grassland, and Land Converted to<br />
Grassland sections in the LULUCF chapter of this report.<br />
c<br />
Total emissions with LULUCF.<br />
Notes: Totals may not sum due to independent rounding. Parentheses indicate negative values or sequestration.<br />
1<br />
2<br />
3<br />
4<br />
5<br />
6<br />
7<br />
8<br />
9<br />
10<br />
11<br />
Energy<br />
The Energy chapter contains emissions of all greenhouse gases resulting from stationary and mobile energy<br />
activities including fuel combustion and fugitive fuel emissions, and the use of fossil fuels for non-energy purposes.<br />
Energy-related activities, primarily fossil fuel combustion, accounted for the vast majority of U.S. CO 2 emissions for<br />
the period of 1990 through 2015. In 2015, approximately 82 percent of the energy consumed in the United States (on<br />
a Btu basis) was produced through the combustion of fossil fuels. The remaining 18 percent came from other energy<br />
sources such as hydropower, biomass, nuclear, wind, and solar energy (see Figure ES-12). Energy-related activities<br />
are also responsible for CH 4 and N 2O emissions (42 percent and 12 percent of total U.S. emissions of each gas,<br />
respectively). Overall, emission sources in the Energy chapter account for a combined 84.3 percent of total U.S.<br />
greenhouse gas emissions in 2015.<br />
Figure ES-12: 2015 U.S. Energy Consumption by Energy Source (Percent)<br />
12<br />
13<br />
14<br />
15<br />
16<br />
17<br />
18<br />
19<br />
20<br />
21<br />
22<br />
23<br />
24<br />
25<br />
26<br />
27<br />
28<br />
29<br />
30<br />
Industrial Processes and Product Use<br />
The Industrial Processes and Product Use (IPPU) chapter includes greenhouse gas emissions occurring from<br />
industrial processes and from the use of greenhouse gases in products.<br />
Greenhouse gas emissions are produced as the by-products of many non-energy-related industrial activities. For<br />
example, industrial processes can chemically transform raw materials, which often release waste gases such as CO 2,<br />
CH 4, and N 2O. These processes include iron and steel production and metallurgical coke production, cement<br />
production, ammonia production, urea consumption, lime production, other process uses of carbonates (e.g., flux<br />
stone, flue gas desulfurization, and glass manufacturing), soda ash production and consumption, titanium dioxide<br />
production, phosphoric acid production, ferroalloy production, CO 2 consumption, silicon carbide production and<br />
consumption, aluminum production, petrochemical production, nitric acid production, adipic acid production, lead<br />
production, zinc production, and N 2O from product uses. Industrial processes also release HFCs, PFCs, SF 6, and NF 3<br />
and other fluorinated compounds. In addition to the use of HFCs and some PFCs as ODS substitutes, HFCs, PFCs,<br />
SF 6, NF 3, and other fluorinated compounds are employed and emitted by a number of other industrial sources in the<br />
United States. These industries include aluminum production, HCFC-22 production, semiconductor manufacture,<br />
electric power transmission and distribution, and magnesium metal production and processing. Overall, emission<br />
sources in the Industrial Process and Product Use chapter account for 5.7 percent of U.S. greenhouse gas emissions<br />
in 2015.<br />
<strong>Executive</strong> <strong>Summary</strong><br />
ES-19
1<br />
2<br />
3<br />
4<br />
5<br />
6<br />
7<br />
8<br />
9<br />
10<br />
11<br />
12<br />
13<br />
14<br />
15<br />
16<br />
17<br />
18<br />
19<br />
20<br />
21<br />
22<br />
23<br />
24<br />
25<br />
26<br />
27<br />
28<br />
29<br />
30<br />
31<br />
32<br />
33<br />
34<br />
35<br />
36<br />
37<br />
38<br />
Agriculture<br />
The Agriculture chapter contains anthropogenic emissions from agricultural activities (except fuel combustion,<br />
which is addressed in the Energy chapter, and agricultural CO 2 fluxes, which are addressed in the Land Use, Land-<br />
Use Change, and Forestry chapter). Agricultural activities contribute directly to emissions of greenhouse gases<br />
through a variety of processes, including the following source categories: enteric fermentation in domestic livestock,<br />
livestock manure management, rice cultivation, agricultural soil management, liming, urea fertilization, and field<br />
burning of agricultural residues. CO 2, CH 4 and N 2O were the primary greenhouse gases emitted by agricultural<br />
activities. CO 2 emissions from the application of crushed limestone and dolomite (i.e., soil liming) and urea<br />
fertilization represented 0.2 percent of total CO 2 emissions from anthropogenic activities. CH 4 emissions from<br />
enteric fermentation and manure management represented 25.4 percent and 10.1 percent of total CH 4 emissions from<br />
anthropogenic activities, respectively, in 2015. Agricultural soil management activities such as fertilizer application<br />
and other cropping practices were the largest source of U.S. N 2O emissions in 2015, accounting for 75.0 percent. In<br />
2015, emission sources accounted for in the Agricultural chapters were responsible for 7.9 percent of total U.S.<br />
greenhouse gas emissions.<br />
Land Use, Land-Use Change, and Forestry<br />
The Land Use, Land-Use Change, and Forestry chapter contains emissions of CH 4 and N 2O, and emissions and<br />
removals of CO 2 from managed lands in the United States. Overall, managed land is a net sink for CO 2 (C<br />
sequestration) in the United States. The drivers of fluxes on managed lands include, for example, forest management<br />
practices, tree planting in urban areas, the management of agricultural soils, the landfilling of yard trimmings and<br />
food scraps, and activities that cause changes in C stocks in coastal wetlands. The main drivers for net forest<br />
sequestration include net forest growth and increasing forest area, as well as a net accumulation of C stocks in<br />
harvested wood pools. The net sequestration in Settlements Remaining Settlements, which occurs predominantly<br />
from urban forests and landfilled yard trimmings and food scraps, is a result of net tree growth and increased urban<br />
forest size, as well as long-term accumulation of yard trimmings and food scraps carbon in landfills.<br />
Forest Land Remaining Forest Land (including vegetation, soils, and harvested wood) represented the largest<br />
carbon sink from LULUCF, accounting for 77 percent of total 2015 negative C fluxes; Settlements Remaining<br />
Settlements (urban trees and landfilled yard trimmings and food scraps) accounted for 12 percent; Land Converted to<br />
Forest Land accounted for 9 percent; and Cropland Remaining Cropland, Wetlands Remaining Wetlands, and Land<br />
Converted to Wetlands accounted for 3 percent of the total negative C fluxes in 2015. Conversely, Land Converted<br />
to Grassland represented the largest carbon source from LULUCF, accounting for 61 percent of total 2015 positive<br />
C fluxes, while Land Converted to Settlements accounted for 31 percent. Land Converted to Cropland accounted for<br />
6 percent. Grassland Remaining Grassland accounted for 2 percent, and settlement soils in Settlements Remaining<br />
Settlements accounted for less than 0.5 percent of the total positive C fluxes in 2015. Overall, positive C fluxes<br />
totaled 481.6 MMT CO 2 Eq. in 2015, while negative C fluxes totaled 868.5 MMT CO 2 Eq. in 2015.<br />
The LULUCF sector in 2015 resulted in a net increase in C stocks (i.e., net CO 2 removals) of 386.8 MMT CO 2 Eq.<br />
(Table ES-5). 22 This represents an offset of 5.9 percent of total (i.e., gross) greenhouse gas emissions in 2015.<br />
Emissions from LULUCF activities in 2015 are 20.4 MMT CO 2 Eq. and represent 0.3 percent of total greenhouse<br />
gas emissions. 23 Between 1990 and 2015, total C sequestration in the LULUCF sector decreased by 16.0 percent,<br />
22 LULUCF C Stock Change is the net C stock change from the following categories: Forest Land Remaining Forest Land, Land<br />
Converted to Forest Land, Cropland Remaining Cropland, Land Converted to Cropland, Grassland Remaining Grassland,<br />
Land Converted to Grassland, Wetlands Remaining Wetlands, Land Converted to Wetlands, Settlements Remaining Settlements,<br />
and Land Converted to Settlements.<br />
23 LULUCF emissions include the CO2, CH4, and N2O emissions from Peatlands Remaining Peatlands; CH4 and N2O emissions<br />
reported for Non-CO2 Emissions from Forest Fires, Non-CO2 Emissions from Grassland Fires, and Coastal Wetlands<br />
Remaining Coastal Wetlands; CH4 emissions from Land Converted to Coastal Wetlands; and N2O Fluxes from Forest Soils and<br />
Settlement Soils.<br />
20 DRAFT Inventory of U.S. Greenhouse Gas Emissions and Sinks: 1990–2015
1<br />
2<br />
3<br />
4<br />
5<br />
6<br />
7<br />
8<br />
9<br />
10<br />
11<br />
12<br />
13<br />
14<br />
15<br />
16<br />
17<br />
18<br />
19<br />
primarily due to a decrease in the rate of net C accumulation in forests and an increase in emissions from Land<br />
Converted to Grassland. 24<br />
Carbon dioxide removals are presented in Table ES-5 along with CO 2, CH 4, and N 2O emissions for LULUCF source<br />
categories. Lands undergoing peat extraction (i.e., Peatlands Remaining Peatlands) resulted in CO 2 emissions of 0.8<br />
MMT CO 2 Eq. (763 kt of CO 2). Forest fires were the largest source of CH 4 emissions from LULUCF in 2015,<br />
totaling 7.3 MMT CO 2 Eq. (292 kt of CH 4). Coastal Wetlands Remaining Coastal Wetlands resulted in CH 4<br />
emissions of 3.5 MMT CO 2 Eq. (141 kt of CH 4). Grassland fires resulted in CH 4 emissions of 0.4 MMT CO 2 Eq. (16<br />
kt of CH 4). Peatlands Remaining Peatlands and Land Converted to Wetlands resulted in CH 4 emissions of less than<br />
0.05 MMT CO 2 Eq.<br />
Forest fires were also the largest source of N 2O emissions from LULUCF in 2015, totaling 4.8 MMT CO 2 Eq. (16 kt<br />
of N 2O). Nitrous oxide emissions from fertilizer application to settlement soils in 2015 totaled to 2.6 MMT CO 2 Eq.<br />
(9 kt of N 2O). This represents an increase of 81.5 percent since 1990. Additionally, the application of synthetic<br />
fertilizers to forest soils in 2015 resulted in N 2O emissions of 0.5 MMT CO 2 Eq. (2 kt of N 2O). Nitrous oxide<br />
emissions from fertilizer application to forest soils have increased by 455 percent since 1990, but still account for a<br />
relatively small portion of overall emissions. Grassland fires resulted in N 2O emissions of 0.4 MMT CO 2 Eq. (1 kt<br />
of N 2O). Coastal Wetlands Remaining Coastal Wetlands resulted in N 2O emissions of 0.1 MMT CO 2 Eq. (0.5 kt of<br />
N 2O), and Peatlands Remaining Peatlands resulted in N 2O emissions of less than 0.05 MMT CO 2 Eq.<br />
Table ES-5: U.S. Greenhouse Gas Emissions and Removals (Net Flux) from Land Use, Land-<br />
Use Change, and Forestry (MMT CO2 Eq.)<br />
Gas/Land-Use Category 1990 2005 2011 2012 2013 2014 2015<br />
Net CO2 Flux a (460.7) (339.3) (395.8) (414.5) (390.3) (389.2) (386.8)<br />
Forest Land Remaining Forest Land b (698.4) (665.3) (670.8) (667.8) (671.7) (670.1) (667.0)<br />
Land Converted to Forest Land (92.0) (81.4) (75.8) (75.2) (75.2) (75.2) (75.2)<br />
Cropland Remaining Cropland c (40.9) (26.5) (19.1) (21.4) (15.6) (14.8) (14.0)<br />
Land Converted to Cropland c 100.7 42.6 35.3 35.3 28.6 28.6 28.6<br />
Grassland Remaining Grassland c (4.2) 5.5 (12.5) (20.8) 7.7 7.8 7.3<br />
Land Converted to Grassland c 245.2 323.8 296.9 293.2 294.2 294.2 294.2<br />
Wetlands Remaining Wetlands (8.6) (10.1) (8.7) (8.7) (8.7) (8.7) (8.7)<br />
Land Converted to Wetlands (+) (+) (+) (+) (+) (+) (+)<br />
Settlements Remaining Settlements (86.2) (91.4) (98.7) (99.2) (99.8) (101.2) (102.1)<br />
Land Converted to Settlements 123.8 163.6 157.6 150.2 150.2 150.2 150.2<br />
CO2 1.1 1.1 0.9 0.8 0.8 0.8 0.8<br />
Wetlands Remaining Wetlands: Peatlands<br />
Remaining Peatlands 1.1 1.1 0.9 0.8 0.8 0.8 0.8<br />
CH4 6.7 13.3 11.2 14.9 11.0 11.2 11.2<br />
Forest Land Remaining Forest Land:<br />
Non-CO2 Emissions from Forest Fires 3.2 9.4 6.8 10.8 7.2 7.3 7.3<br />
Wetlands Remaining Wetlands: Coastal<br />
Wetlands Remaining Coastal Wetlands 3.4 3.5 3.5 3.5 3.5 3.5 3.5<br />
Grassland Remaining Grassland:<br />
Non-CO2 Emissions from Grassland Fires 0.1 0.3 0.8 0.6 0.2 0.4 0.4<br />
Land Converted to Wetlands: Land<br />
Converted to Coastal Wetlands + + + + + + +<br />
Wetlands Remaining Wetlands: Peatlands<br />
Remaining Peatlands + + + + + + +<br />
N2O 3.8 9.6 8.6 11.0 8.1 8.4 8.4<br />
Forest Land Remaining Forest Land:<br />
Non-CO2 Emissions from Forest Fires 2.1 6.2 4.5 7.1 4.7 4.8 4.8<br />
Settlements Remaining Settlements:<br />
N2O Fluxes from Settlement Soils d 1.4 2.5 2.6 2.7 2.6 2.6 2.6<br />
24 Quality control uncovered errors in the estimate and uncertainty of soil C stock changes for 2013, 2014, 2015, which will be<br />
updated following public review. Corrected estimates are provided in footnotes of the emission summary tables for Cropland<br />
Remaining Cropland, Land Converted to Cropland, Grassland Remaining Grassland, and Land Converted to Grassland sections<br />
in the LULUCF chapter of this report.<br />
<strong>Executive</strong> <strong>Summary</strong><br />
ES-21
Forest Land Remaining Forest Land:<br />
N2O Fluxes from Forest Soils e 0.1 0.5 0.5 0.5 0.5 0.5 0.5<br />
Grassland Remaining Grassland:<br />
Non-CO2 Emissions from Grassland Fires 0.1 0.3 0.9 0.6 0.2 0.4 0.4<br />
Wetlands Remaining Wetlands: Coastal<br />
Wetlands Remaining Coastal Wetlands 0.1 0.2 0.1 0.1 0.1 0.1 0.1<br />
Wetlands Remaining Wetlands: Peatlands<br />
Remaining Peatlands + + + + + + +<br />
LULUCF Emissions f 11.6 24.0 20.7 26.8 19.9 20.4 20.4<br />
LULUCF C Stock Change a (460.7) (339.3) (395.8) (414.5) (390.3) (389.2) (386.8)<br />
LULUCF Sector Net Total g (449.1) (315.3) (375.1) (387.7) (370.4) (368.8) (366.4)<br />
+ Absolute value does not exceed 0.05 MMT CO2 Eq.<br />
a<br />
LULUCF C Stock Change is the net C stock change from the following categories: Forest Land Remaining Forest Land,<br />
Land Converted to Forest Land, Cropland Remaining Cropland, Land Converted to Cropland, Grassland Remaining<br />
Grassland, Land Converted to Grassland, Wetlands Remaining Wetlands, Land Converted to Wetlands, Settlements<br />
Remaining Settlements, and Land Converted to Settlements.<br />
b<br />
Includes the effects of net additions to stocks of carbon stored in forest ecosystem pools and harvested wood products.<br />
c<br />
Quality control uncovered errors in the estimate and uncertainty of soil C stock changes for 2013, 2014, 2015, which will be<br />
updated following public review. Corrected estimates are provided in footnotes of the emission summary tables for Cropland<br />
Remaining Cropland, Land Converted to Cropland, Grassland Remaining Grassland, and Land Converted to Grassland<br />
sections in the LULUCF chapter of this report.<br />
d<br />
Estimates include emissions from N fertilizer additions on both Settlements Remaining Settlements and Land Converted to<br />
Settlements.<br />
e<br />
Estimates include emissions from N fertilizer additions on both Forest Land Remaining Forest Land and Land Converted to<br />
Forest Land.<br />
f<br />
LULUCF emissions include the CO2, CH4, and N2O emissions from Peatlands Remaining Peatlands; CH4 and N2O emissions<br />
reported for Non-CO2 Emissions from Forest Fires, Non-CO2 Emissions from Grassland Fires, and Coastal Wetlands<br />
Remaining Coastal Wetlands; CH4 emissions from Land Converted to Coastal Wetlands; and N2O Fluxes from Forest Soils<br />
and Settlement Soils.<br />
g<br />
The LULUCF Sector Net Total is the net sum of all emissions (i.e., sources) of greenhouse gases to the atmosphere plus<br />
removals of CO2 (i.e., sinks or negative emissions) from the atmosphere.<br />
Notes: Totals may not sum due to independent rounding. Parentheses indicate net sequestration.<br />
1<br />
2<br />
3<br />
4<br />
5<br />
6<br />
7<br />
8<br />
9<br />
10<br />
11<br />
12<br />
13<br />
14<br />
Waste<br />
The Waste chapter contains emissions from waste management activities (except incineration of waste, which is<br />
addressed in the Energy chapter). Landfills were the largest source of anthropogenic greenhouse gas emissions in the<br />
Waste chapter, accounting for 83.0 percent of this chapter’s emissions, and 17.7 percent of total U.S. CH 4<br />
emissions. 25 Additionally, wastewater treatment accounts for 14.2 percent of Waste emissions, 2.3 percent of U.S.<br />
CH 4 emissions, and 1.5 percent of U.S. N 2O emissions. Emissions of CH 4 and N 2O from composting are also<br />
accounted for in this chapter, generating emissions of 2.1 MMT CO 2 Eq. and 1.9 MMT CO 2 Eq., respectively.<br />
Overall, emission sources accounted for in the Waste chapter generated 2.1 percent of total U.S. greenhouse gas<br />
emissions in 2015.<br />
ES.4 Other Information<br />
Emissions by Economic Sector<br />
Throughout the Inventory of U.S. Greenhouse Gas Emissions and Sinks report, emission estimates are grouped into<br />
five sectors (i.e., chapters) defined by the IPCC: Energy; Industrial Processes and Product Use; Agriculture;<br />
LULUCF; and Waste. While it is important to use this characterization for consistency with UNFCCC reporting<br />
25 Landfills also store carbon, due to incomplete degradation of organic materials such as harvest wood products, yard<br />
trimmings, and food scraps, as described in the Land-Use, Land-Use Change, and Forestry chapter of the Inventory report.<br />
22 DRAFT Inventory of U.S. Greenhouse Gas Emissions and Sinks: 1990–2015
1<br />
2<br />
3<br />
4<br />
5<br />
guidelines, it is also useful to characterize emissions according to commonly used economic sector categories:<br />
residential, commercial, industry, transportation, electricity generation, agriculture, and U.S. Territories.<br />
Table ES-6 summarizes emissions from each of these economic sectors, and Figure ES-13 shows the trend in<br />
emissions by sector from 1990 to 2015.<br />
Figure ES-13: U.S. Greenhouse Gas Emissions Allocated to Economic Sectors (MMT CO2 Eq.)<br />
6<br />
7<br />
8<br />
Table ES-6: U.S. Greenhouse Gas Emissions Allocated to Economic Sectors (MMT CO2 Eq.)<br />
Economic Sectors 1990 2005 2011 2012 2013 2014 2015<br />
Electric 1,864.8 Power Industry 1,862.5 2,441.6 2,197.3 2,059.9 2,078.2 2,079.7 1,941.2<br />
Transportation 1,551.3 2,001.0 1,800.0 1,780.7 1,790.2 1,803.4 1,803.7<br />
1,551.3<br />
Industry 1,629.5 1,469.3 1,378.5 1,365.2 1,412.8 1,426.0 1,436.7<br />
Agriculture 1,620.9<br />
526.7 574.3 592.0 577.6 567.5 566.1 570.3<br />
Commercial 563.4<br />
418.1 400.7 406.5 387.3 410.1 422.2 416.7<br />
Residential 418.1<br />
344.9 370.4 356.3 318.4 372.6 394.0 372.7<br />
U.S. Territories 33.7 58.2 45.4 47.6 47.5 44.9 44.9<br />
344.9<br />
Total Emissions 6,366.7 7,315.6 6,776.0 6,536.8 6,678.9 6,736.3 6,586.2<br />
33.7<br />
LULUCF Sector Net Total a,b (449.1) (315.3) (375.1) (387.7) (370.4) (368.8) (366.4)<br />
Net Emissions (Sources and Sinks) 5,917.6 7,000.3 6,400.9 6,149.1 6,308.5 6,367.5 6,219.8<br />
Note: Total emissions presented without LULUCF. Total net emissions presented with LULUCF.<br />
a<br />
The LULUCF Sector Net Total is the net sum of all emissions (i.e., sources) of greenhouse gases to the atmosphere plus<br />
removals of CO2 (i.e., sinks or negative emissions) from the atmosphere.<br />
b<br />
Quality control uncovered errors in the estimate and uncertainty of soil C stock changes for 2013, 2014, 2015, which will<br />
be updated following public review. Corrected estimates are provided in footnotes of the emission summary tables for<br />
Cropland Remaining Cropland, Land Converted to Cropland, Grassland Remaining Grassland, and Land Converted to<br />
Grassland sections in the LULUCF chapter of this report.<br />
Notes: Totals may not sum due to independent rounding. Parentheses indicate negative values or sequestration.<br />
9<br />
10<br />
11<br />
12<br />
13<br />
14<br />
Using this categorization, emissions from electricity generation accounted for the largest portion (29 percent) of<br />
total U.S. greenhouse gas emissions in 2015. Transportation activities, in aggregate, accounted for the second largest<br />
portion (27 percent), while emissions from industry accounted for the third largest portion (22 percent) of total U.S.<br />
greenhouse gas emissions in 2015. Emissions from industry have in general declined over the past decade, due to a<br />
number of factors, including structural changes in the U.S. economy (i.e., shifts from a manufacturing-based to a<br />
service-based economy), fuel switching, and energy efficiency improvements. The remaining 21 percent of U.S.<br />
<strong>Executive</strong> <strong>Summary</strong><br />
ES-23
1<br />
2<br />
3<br />
4<br />
5<br />
6<br />
7<br />
8<br />
9<br />
10<br />
11<br />
12<br />
13<br />
14<br />
15<br />
16<br />
17<br />
18<br />
19<br />
20<br />
21<br />
22<br />
23<br />
24<br />
25<br />
26<br />
greenhouse gas emissions were contributed by, in order of magnitude, the agriculture, commercial, and residential<br />
sectors, plus emissions from U.S. Territories. Activities related to agriculture accounted for 9 percent of U.S.<br />
emissions; unlike other economic sectors, agricultural sector emissions were dominated by N 2O emissions from<br />
agricultural soil management and CH 4 emissions from enteric fermentation. The commercial and residential sectors<br />
accounted for 6 percent and 6 percent of emissions, respectively, and U.S. Territories accounted for 1 percent of<br />
emissions; emissions from these sectors primarily consisted of CO 2 emissions from fossil fuel combustion. CO 2 was<br />
also emitted and sequestered by a variety of activities related to forest management practices, tree planting in urban<br />
areas, the management of agricultural soils, landfilling of yard trimmings, and changes in C stocks in coastal<br />
wetlands.<br />
Electricity is ultimately consumed in the economic sectors described above. Table ES-7 presents greenhouse gas<br />
emissions from economic sectors with emissions related to electricity generation distributed into end-use categories<br />
(i.e., emissions from electricity generation are allocated to the economic sectors in which the electricity is<br />
consumed). To distribute electricity emissions among end-use sectors, emissions from the source categories assigned<br />
to electricity generation were allocated to the residential, commercial, industry, transportation, and agriculture<br />
economic sectors according to retail sales of electricity. 26 These source categories include CO 2 from fossil fuel<br />
combustion and the use of limestone and dolomite for flue gas desulfurization, CO 2 and N 2O from incineration of<br />
waste, CH 4 and N 2O from stationary sources, and SF 6 from electrical transmission and distribution systems.<br />
When emissions from electricity are distributed among these sectors, industrial activities and transportation account<br />
for the largest shares of U.S. greenhouse gas emissions (30 percent and 27 percent, respectively) in 2015. The<br />
residential and commercial sectors contributed the next largest shares of total U.S. greenhouse gas emissions in<br />
2015. Emissions from these sectors increase substantially when emissions from electricity are included, due to their<br />
relatively large share of electricity consumption (e.g., lighting, appliances). In all sectors except agriculture, CO 2<br />
accounts for more than 80 percent of greenhouse gas emissions, primarily from the combustion of fossil fuels.<br />
Figure ES-14 shows the trend in these emissions by sector from 1990 to 2015.<br />
Table ES-7: U.S. Greenhouse Gas Emissions by Economic Sector with Electricity-Related<br />
Emissions Distributed (MMT CO2 Eq.)<br />
Implied Sectors 1990 2005 2011 2012 2013 2014 2015<br />
Industry 2,297.1 2,180.3 1,973.5 1,926.0 1,976.9 1,986.7 1,956.2<br />
Transportation 1,554.4 2,005.9 1,804.3 1,784.7 1,794.3 1,807.5 1,807.5<br />
Commercial 968.4 1,217.6 1,158.1 1,100.6 1,128.5 1,142.7 1,094.0<br />
Residential 951.5 1,241.3 1,161.5 1,057.2 1,122.0 1,143.7 1,071.5<br />
Agriculture 561.5 612.4 633.1 620.6 609.9 610.8 612.0<br />
U.S. Territories 33.7 58.2 45.4 47.6 47.5 44.9 44.9<br />
Total Emissions 6,366.7 7,315.6 6,776.0 6,536.8 6,678.9 6,736.3 6,586.2<br />
LULUCF Sector Net Total a,b (449.1) (315.3) (375.1) (387.7) (370.4) (368.8) (366.4)<br />
Net Emissions (Sources and Sinks) 5,917.6 7,000.3 6,400.9 6,149.1 6,308.5 6,367.5 6,219.8<br />
a<br />
The LULUCF Sector Total is the net sum of all emissions (i.e., sources) of greenhouse gases to the atmosphere plus removals of<br />
CO2 (i.e., sinks or negative emissions) from the atmosphere.<br />
b<br />
Quality control uncovered errors in the estimate and uncertainty of soil C stock changes for 2013, 2014, 2015, which will be<br />
updated following public review. Corrected estimates are provided in footnotes of the emission summary tables for Cropland<br />
Remaining Cropland, Land Converted to Cropland, Grassland Remaining Grassland, and Land Converted to Grassland sections<br />
in the LULUCF chapter of this report.<br />
Notes: Emissions from electricity generation are allocated based on aggregate electricity consumption in each end-use sector.<br />
Totals may not sum due to independent rounding. Parentheses indicate negative values or sequestration.<br />
27<br />
26 Emissions were not distributed to U.S. Territories, since the electricity generation sector only includes emissions related to the<br />
generation of electricity in the 50 states and the District of Columbia.<br />
24 DRAFT Inventory of U.S. Greenhouse Gas Emissions and Sinks: 1990–2015
1<br />
2<br />
Figure ES-14: U.S. Greenhouse Gas Emissions with Electricity-Related Emissions Distributed<br />
to Economic Sectors (MMT CO2 Eq.)<br />
3<br />
4<br />
5<br />
6<br />
7<br />
8<br />
9<br />
10<br />
11<br />
12<br />
13<br />
14<br />
15<br />
16<br />
17<br />
18<br />
Box ES-3: Recent Trends in Various U.S. Greenhouse Gas Emissions-Related Data<br />
Total emissions can be compared to other economic and social indices to highlight changes over time. These<br />
comparisons include: (1) emissions per unit of aggregate energy consumption, because energy-related activities are<br />
the largest sources of emissions; (2) emissions per unit of fossil fuel consumption, because almost all energy-related<br />
emissions involve the combustion of fossil fuels; (3) emissions per unit of electricity consumption, because the<br />
electric power industry—utilities and non-utilities combined—was the largest source of U.S. greenhouse gas<br />
emissions in 2014; (4) emissions per unit of total gross domestic product as a measure of national economic activity;<br />
and (5) emissions per capita.<br />
Table ES-8 provides data on various statistics related to U.S. greenhouse gas emissions normalized to 1990 as a<br />
baseline year. Greenhouse gas emissions in the United States have grown at an average annual rate of 0.2 percent<br />
since 1990. Since 1990, this rate is slightly slower than that for total energy and for fossil fuel consumption, and<br />
much slower than that for electricity consumption, overall gross domestic product and national population (see<br />
Figure ES-15).<br />
Table ES-8: Recent Trends in Various U.S. Data (Index 1990 = 100)<br />
Variable 1990 2005 2011 2012 2013 2014 2015<br />
Avg. Annual<br />
Growth Rate<br />
Greenhouse Gas Emissions a 100 115 106 103 105 106 103 0.2%<br />
Energy Consumption b 100 118 115 112 115 117 115 0.6%<br />
Fossil Fuel Consumption b 100 119 110 107 110 111 110 0.4%<br />
Electricity Consumption b 100 134 137 135 136 138 137 1.3%<br />
GDP c 100 159 168 171 174 178 183 2.5%<br />
Population d 100 118 125 126 126 127 128 1.0%<br />
a<br />
GWP-weighted values<br />
b<br />
Energy content-weighted values (EIA 2016)<br />
c<br />
Gross Domestic Product in chained 2009 dollars (BEA 2016)<br />
d<br />
U.S. Census Bureau (2016)<br />
<strong>Executive</strong> <strong>Summary</strong><br />
ES-25
1<br />
2<br />
3<br />
Figure ES-15: U.S. Greenhouse Gas Emissions Per Capita and Per Dollar of Gross Domestic<br />
Product (GDP)<br />
4<br />
5<br />
6<br />
Source: BEA (2016), U.S. Census Bureau (2016), and emission estimates in this report.<br />
7<br />
8<br />
9<br />
10<br />
11<br />
12<br />
13<br />
14<br />
15<br />
16<br />
17<br />
18<br />
19<br />
20<br />
21<br />
Key Categories<br />
The 2006 IPCC Guidelines (IPCC 2006) defines a key category as a “[category] that is prioritized within the<br />
national inventory system because its estimate has a significant influence on a country’s total inventory of<br />
greenhouse gases in terms of the absolute level, the trend, or the uncertainty in emissions and removals.” 27 By<br />
definition, key categories are sources or sinks that have the greatest contribution to the absolute overall level of<br />
national emissions in any of the years covered by the time series. In addition, when an entire time series of emission<br />
estimates is prepared, a thorough investigation of key categories must also account for the influence of trends of<br />
individual source and sink categories. Finally, a qualitative evaluation of key categories should be performed, in<br />
order to capture any key categories that were not identified in either of the quantitative analyses.<br />
Figure ES-16 presents 2015 emission estimates for the key categories as defined by a level analysis (i.e., the<br />
contribution of each source or sink category to the total inventory level). The UNFCCC reporting guidelines request<br />
that key category analyses be reported at an appropriate level of disaggregation, which may lead to source and sink<br />
category names which differ from those used elsewhere in the Inventory report. For more information regarding key<br />
categories, see Section 1.5 – Key Categories and Annex 1.<br />
27 See Chapter 4 “Methodological Choice and Identification of Key Categories” in IPCC (2006). See <br />
26 DRAFT Inventory of U.S. Greenhouse Gas Emissions and Sinks: 1990–2015
1<br />
Figure ES-16: 2015 Key Categories (MMT CO2 Eq.)<br />
2<br />
3<br />
4<br />
5<br />
6<br />
7<br />
8<br />
9<br />
10<br />
11<br />
12<br />
13<br />
14<br />
15<br />
16<br />
17<br />
18<br />
19<br />
20<br />
21<br />
Note: For a complete discussion of the key category analysis, see Annex 1. Blue bars indicate either an Approach 1, or Approach<br />
1 and Approach 2 level assessment key category. Gray bars indicate solely an Approach 2 level assessment key category.<br />
Quality Assurance and Quality Control (QA/QC)<br />
The United States seeks to continually improve the quality, transparency, and credibility of the Inventory of U.S.<br />
Greenhouse Gas Emissions and Sinks. To assist in these efforts, the United States implemented a systematic<br />
approach to QA/QC. The procedures followed for the Inventory have been formalized in accordance with the<br />
Quality Assurance/Quality Control and Uncertainty Management Plan (QA/QC Management Plan) for the<br />
Inventory and the UNFCCC reporting guidelines.<br />
Uncertainty Analysis of Emission Estimates<br />
Uncertainty estimates are an essential element of a complete inventory of greenhouse gas emissions and removals,<br />
because they help to prioritize future work and improve overall quality. Some of the current estimates, such as those<br />
for CO 2 emissions from energy-related activities, are considered to have low uncertainties because the amount of<br />
CO 2 emitted is directly related to the amount of fuel consumed, the fraction of the fuel that is oxidized, and the<br />
carbon content of the fuel. For some other categories of emissions, however, a lack of or missing data,<br />
representativeness of data to real world conditions associated with the emissions/removal activities in United States,<br />
sampling errors, and measurement errors are example factors that contribute to the uncertainty associated with the<br />
estimates presented. Recognizing the benefit of conducting an uncertainty analysis, the UNFCCC reporting<br />
guidelines follow the recommendations of the 2006 IPCC Guidelines (IPCC 2006), Volume 1, Chapter 3 and require<br />
that countries provide single estimates of uncertainty for source and sink categories.<br />
<strong>Executive</strong> <strong>Summary</strong><br />
ES-27
1<br />
2<br />
3<br />
4<br />
5<br />
6<br />
7<br />
8<br />
9<br />
10<br />
11<br />
12<br />
13<br />
14<br />
15<br />
16<br />
17<br />
18<br />
19<br />
20<br />
21<br />
22<br />
In addition to quantitative uncertainty assessments provided in accordance with UNFCCC reporting guidelines, a<br />
qualitative discussion of uncertainty is presented for all source and sink categories. Within the discussion of each<br />
emission source, specific factors affecting the uncertainty surrounding the estimates are discussed.<br />
Box ES-4: Recalculations of Inventory Estimates<br />
Each year, emission and sink estimates are recalculated and revised for all years in the Inventory of U.S. Greenhouse<br />
Gas Emissions and Sinks, as attempts are made to improve both the analyses themselves, through the use of better<br />
methods or data, and the overall usefulness of the report. In this effort, the United States follows the 2006 IPCC<br />
Guidelines (IPCC 2006), which states, “Both methodological changes and refinements over time are an essential<br />
part of improving inventory quality. It is good practice to change or refine methods when: available data have<br />
changed; the previously used method is not consistent with the IPCC guidelines for that category; a category has<br />
become key; the previously used method is insufficient to reflect mitigation activities in a transparent manner; the<br />
capacity for inventory preparation has increased; new inventory methods become available; and for correction of<br />
errors.” In general, recalculations are made to the U.S. greenhouse gas emission estimates either to incorporate new<br />
methodologies or, most commonly, to update recent historical data.<br />
In each Inventory report, the results of all methodology changes and historical data updates are presented in the<br />
Recalculations and Improvements chapter; detailed descriptions of each recalculation are contained within each<br />
source's description contained in the report, if applicable. In general, when methodological changes have been<br />
implemented, the entire time series (in the case of the most recent Inventory report, 1990 through 2014) has been<br />
recalculated to reflect the change, per the 2006 IPCC Guidelines (IPCC 2006). Changes in historical data are<br />
generally the result of changes in statistical data supplied by other agencies. References for the data are provided for<br />
additional information.<br />
23<br />
24<br />
28 DRAFT Inventory of U.S. Greenhouse Gas Emissions and Sinks: 1990–2015