The 2016/2017 Stuttgart office market report
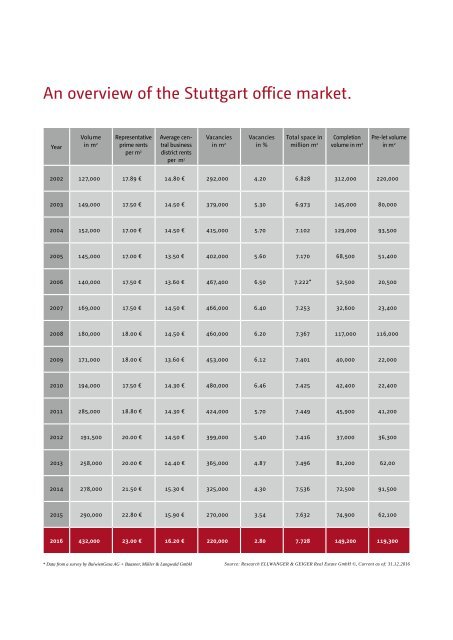
Again in 2016 the Stuttgart office market reached new record levels. The turnover of floor space came to 432,000 square metres for the year, a growth of almost 50 percent. At the same time rents rose slightly, and the vacancy ratio fell by 2.8 percent. As in past years, the main growth driver was industry, but the IT and telecommunication sectors have also been responsible for increasing demand.
Again in 2016 the Stuttgart office market reached new record levels. The turnover of floor space came to 432,000 square metres for the year, a growth of almost 50 percent. At the same time rents rose slightly, and the vacancy ratio fell by 2.8 percent. As in past years, the main growth driver was industry, but the IT and telecommunication sectors have also been responsible for increasing demand.

You also want an ePaper? Increase the reach of your titles
YUMPU automatically turns print PDFs into web optimized ePapers that Google loves.
An overview of the <strong>Stuttgart</strong> <strong>office</strong> <strong>market</strong>.<br />
Year<br />
Volume<br />
in m 2<br />
Representative<br />
prime rents<br />
per m 2<br />
Average central<br />
business<br />
district rents<br />
per m 2<br />
Vacancies<br />
in m 2<br />
Vacancies<br />
in %<br />
Total space in<br />
million m 2<br />
Completion<br />
volume in m 2<br />
Pre-let volume<br />
in m 2<br />
2002 127,000 17.89 € 14.80 € 292,000 4.20 6.828 312,000 220,000<br />
2003 149,000 17.50 € 14.50 € 379,000 5.30 6.973 145,000 80,000<br />
2004 152,000 17.00 € 14.50 € 415,000 5.70 7.102 129,000 93,500<br />
2005 145,000 17.00 € 13.50 € 402,000 5.60 7.170 68,500 51,400<br />
2006 140,000 17.50 € 13.60 € 467,400 6.50 7.222* 52,500 20,500<br />
2007 169,000 17.50 € 14.50 € 466,000 6.40 7.253 32,600 23,400<br />
2008 180,000 18.00 € 14.50 € 460,000 6.20 7.367 117,000 116,000<br />
2009 171,000 18.00 € 13.60 € 453,000 6.12 7.401 40,000 22,000<br />
2010 194,000 17.50 € 14.30 € 480,000 6.46 7.425 42,400 22,400<br />
2011 285,000 18.80 € 14.30 € 424,000 5.70 7.449 45,900 41,200<br />
2012 191,500 20.00 € 14.50 € 399,000 5.40 7.416 37,000 36,300<br />
2013 258,000 20.00 € 14.40 € 365,000 4.87 7.496 81,200 62,00<br />
2014 278,000 21.50 € 15.30 € 325,000 4.30 7.536 72,500 91,500<br />
2015 290,000 22.80 € 15.90 € 270,000 3.54 7.632 74,900 62,100<br />
<strong>2016</strong> 432,000 23.00 € 16.20 € 220,000 2.80 7.728 149,200 119,300<br />
* Data from a survey by BulwienGesa AG + Baasner, Möller & Langwald GmbH<br />
Source: Research ELLWANGER & GEIGER Real Estate GmbH ©, Current as of: 31.12.<strong>2016</strong>