land cover and change - GOFC-GOLD LC-IT Office - Wageningen UR
land cover and change - GOFC-GOLD LC-IT Office - Wageningen UR
land cover and change - GOFC-GOLD LC-IT Office - Wageningen UR

Create successful ePaper yourself
Turn your PDF publications into a flip-book with our unique Google optimized e-Paper software.
5<br />
makers involved in the on-going international<br />
climate negotiations, as<br />
well as country-level plans <strong>and</strong> interventions.<br />
The viability of REDD+ depends<br />
on altering business-as-usual<br />
activity in sectors currently driving<br />
greenhouse gas emissions from forests,<br />
it is concluded. The report distinguishes<br />
between direct drivers,<br />
that directly cause deforestation <strong>and</strong><br />
forest degradation, <strong>and</strong> indirect drivers,<br />
forces at the background such as<br />
changing market prices, population<br />
growth or policies <strong>and</strong> governance.<br />
Agriculture is estimated to be the direct<br />
driver for around 80% of deforestation<br />
worldwide. In Latin America,<br />
commercial agriculture is the main<br />
direct driver, responsible for 2/3 of all<br />
cut forests, while in Africa <strong>and</strong> tropical<br />
Asia commercial agriculture <strong>and</strong><br />
subsistence agriculture both account<br />
for one third of deforestation. Mining,<br />
infrastructure <strong>and</strong> urban expansion<br />
are important but less prominent<br />
drivers worldwide. It is concluded<br />
that economic growth based on the<br />
export of primary commodities <strong>and</strong><br />
an increasing dem<strong>and</strong> for timber <strong>and</strong><br />
agricultural products in a globalizing<br />
economy are critical indirect drivers.<br />
Degradation of forest means a decrease<br />
in quality of forest, <strong>and</strong> is in<br />
over 70% of cases caused by (commercial)<br />
timber extraction <strong>and</strong> logging<br />
activities in Latin America <strong>and</strong><br />
Newsletter N˚ 21 | 2012<br />
Fig. 5: Area per deforestation drivers<br />
(sub)tropical Asia. In Africa, fuel<br />
wood collection, charcoal production,<br />
<strong>and</strong>, to a lesser extent, livestock<br />
grazing in forests are the most<br />
important drivers of degradation.<br />
The report concludes it is important<br />
for forested tropical countries to regularly<br />
assess <strong>and</strong> monitor drivers of<br />
deforestation <strong>and</strong> forest degradation,<br />
in order to be able to design effective<br />
REDD+ policies. The types of drivers<br />
have great influence on the forest car-<br />
bon impacts <strong>and</strong> the choice of data<br />
sources <strong>and</strong> methods used to measure<br />
them. Also, underst<strong>and</strong>ing forest<br />
<strong>change</strong> patterns <strong>and</strong> underlying causes<br />
are important for developing forest<br />
reference (emission) levels, necessary<br />
for REDD+ implementation.<br />
This publication is produced with<br />
the financial assistance of the International<br />
Development (DFID) <strong>and</strong><br />
The Government of Norway’s International<br />
Climate <strong>and</strong> Forest Initiative.<br />
The report is now available :<br />
www.regjeringen.no/climate-<strong>and</strong>forest-initiative<br />
* Kissinger, G., M. Herold, V. De<br />
Sy. Drivers of Deforestation <strong>and</strong><br />
Forest Degradation: A Synthesis<br />
Report for REDD+ Policymakers.<br />
Lexeme Consulting, Vancouver<br />
Canada, August 2012.<br />
Status <strong>and</strong> development of national monitoring capacities<br />
in tropical non-Annex I countries<br />
Erika Romijn et al. from <strong>Wageningen</strong><br />
University <strong>and</strong> CIFOR recently<br />
published a study* on the status <strong>and</strong><br />
development of national monitoring<br />
capacities between2005 <strong>and</strong> 2010 in<br />
tropical regions. The study <strong>cover</strong>ed<br />
ninety-nine non-Annex I countries.<br />
A series of indicators was developed<br />
for four assessment categories:<br />
national engagement in the<br />
REDD+ process, existing monitoring<br />
capacities,challenges with<br />
respect to REDD+ monitoring<br />
under particular national circumstances,<br />
<strong>and</strong> technical challenges<br />
for the use of remote sensing.<br />
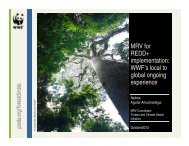
Fig.7: Deforestation in Amazonia (CIFOR)<br />
Map in Fig. 8 summarizes the level of<br />
technical challenges found in the countries<br />
based on 5 indicators: average<br />
cloud <strong>cover</strong> probability, seasonality (average<br />
dynamic of cloud <strong>cover</strong>), topog-<br />
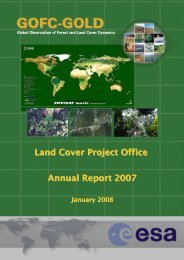
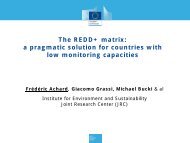
Fig. 6: Cover page of the report<br />
raphy, data access, <strong>and</strong> data availability.<br />
The study shows a majority of the countries<br />
have limitations in meeting the<br />
requirements (completeness <strong>and</strong> accuracy)<br />
in estimating forest loss <strong>and</strong><br />
Green House Gas emissions. Fortynine<br />
countries have a very large capacity<br />
gap while four counties have a<br />
very small capacity gap to monitor their<br />
forest according to the REDD+ implementation<br />
Phase III. Capacity gaps<br />
vary from one country to another but<br />
concern generally carbon stock measurement<br />
than forest <strong>change</strong> measurement.<br />
However signs of improvement<br />
for forest carbon monitoring have been