

Annual Report 2015-16
CIC%20Annual%20Report%20English-2015-16
CIC%20Annual%20Report%20English-2015-16

You also want an ePaper? Increase the reach of your titles
YUMPU automatically turns print PDFs into web optimized ePapers that Google loves.
Chapter 2<br />
Analysis of RTI Regime: Implementation of RTI Act by Public<br />
Authorities in <strong>2015</strong>-<strong>16</strong><br />
2.1 Institutional Arrangements<br />
2. 1.1 To fulfill its mandate of preparing and submitting the <strong>Annual</strong> <strong>Report</strong>, the Commission<br />
invites online returns in a prescribed pro-forma from the Public Authorities in accordance<br />
with Section 25(3) of the RTI Act. All Public Authorities as defined under Section 2(h)<br />
of the RTI Act are required to be registered.<br />
2.1.2 Registration of Public Authorities<br />
It is expected that all entities qualifying as Public Authorities are registered by the<br />
Ministries/Departments. It is, however, possible some entities may not have been<br />
registered as Public Authorities. Whenever any complaint of this nature is received,<br />
the Commission can, after its deliberation, give directions to register an entity as a<br />
Public Authority. The Commission has also taken a pro-active role and directed that a<br />
uniform pattern be followed while registering Public Authorities by merging of similar<br />
type of Public Authorities. However, the right for inclusion and deletion of the Public<br />
Authorities vests with the controlling Ministries/ Departments.<br />
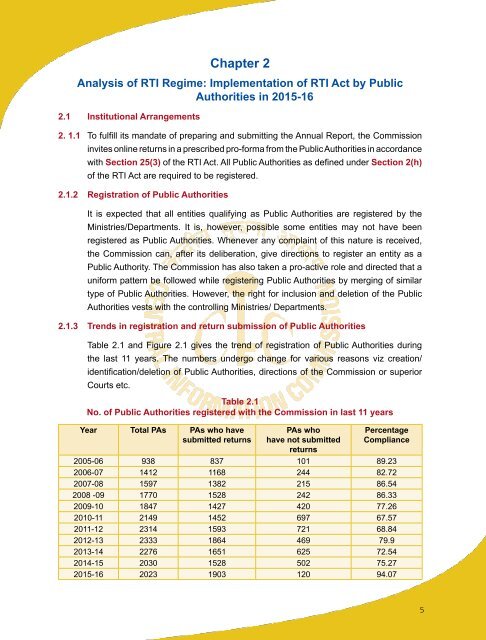
2.1.3 Trends in registration and return submission of Public Authorities<br />
Table 2.1 and Figure 2.1 gives the trend of registration of Public Authorities during<br />
the last 11 years. The numbers undergo change for various reasons viz creation/<br />
identification/deletion of Public Authorities, directions of the Commission or superior<br />
Courts etc.<br />
Table 2.1<br />
No. of Public Authorities registered with the Commission in last 11 years<br />
Year Total PAs PAs who have<br />
submitted returns<br />
PAs who<br />
have not submitted<br />
returns<br />
Percentage<br />
Compliance<br />
2005-06 938 837 101 89.23<br />
2006-07 1412 1<strong>16</strong>8 244 82.72<br />
2007-08 1597 1382 215 86.54<br />
2008 -09 1770 1528 242 86.33<br />
2009-10 1847 1427 420 77.26<br />
2010-11 2149 1452 697 67.57<br />
2011-12 2314 1593 721 68.84<br />
2012-13 2333 1864 469 79.9<br />
2013-14 2276 <strong>16</strong>51 625 72.54<br />
2014-15 2030 1528 502 75.27<br />
<strong>2015</strong>-<strong>16</strong> 2023 1903 120 94.07<br />
5