- Page 2: Annual Report 2015-16 Central Infor
- Page 5 and 6: Sl. No. Table of Contents Page No.
- Page 7 and 8: exempt from disclosure which affect
- Page 9 and 10: (c) (d) (e) (f) (g) the number of a
- Page 11 and 12: 94.07% of Public Authorities submit
- Page 13 and 14: S. No Ministry/Independent Departme
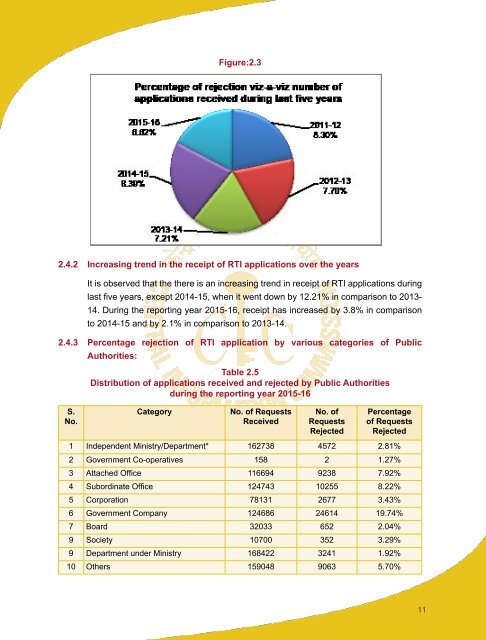
- Page 15: Figure 2.2 and Figure 2.3 describes
- Page 19 and 20: S. No. Ministry/Independent Departm
- Page 21 and 22: 2.8 Summary of Annual Returns 2015-
- Page 23 and 24: Registration/Disposal 3.2.2 The dat
- Page 25 and 26: 3.5.2 DIGITIZATION OF OLD RECORDS T
- Page 27 and 28: Annual Convention - 2015 Annual Con
- Page 29 and 30: List of Abbreviations Acronym AA Ap
- Page 32 and 33: Annexure-1 Ministry wise and Public
- Page 34 and 35: General Services Organisation, Kalp
- Page 36 and 37: Central Institute of Agricultural E
- Page 38 and 39: Indian Agricultural Statistics Rese
- Page 40 and 41: Project Directorate on Cattle (ICAR
- Page 42 and 43: AQCS,Chennai AQCS,Kolkatta AQCS,Mum
- Page 44 and 45: Brahmaputra Cracker and Polymer Lim
- Page 46 and 47: Bharat Coking Coal Limited. Central
- Page 48 and 49: Central Manufacturing Technology In
- Page 50 and 51: National Consumer Disputes Redressa
- Page 52 and 53: Official Liquidator, West Bengal Re
- Page 54 and 55: National Museum Institute of Histor
- Page 56 and 57: Department of Defence Production Se
- Page 58 and 59: Ministry of Environment & Forests N
- Page 60 and 61: AAIFR Agriculture Insurance Company
- Page 62 and 63: Insurance Regulatory and Developmen
- Page 64 and 65: Chief Commissioner of Customs, Ahme
- Page 66 and 67:
Director Genral of Income Tax (Inv.
- Page 68 and 69:
AIRPORT BORDER QUARANTINE, AMRITSAR
- Page 70 and 71:
GOVERNMENT MEDICAL STORE DEPOT,NEW
- Page 72 and 73:
SEROLOGIST AND CHEMICAL EXAMINER, I
- Page 74 and 75:
Department of Official Language Dir
- Page 76 and 77:
Central University of Orissa Centra
- Page 78 and 79:
JAMIA MILLIA ISLAMIA Jawaharlal Neh
- Page 80 and 81:
North Eastern Regional Institute of
- Page 82 and 83:
NFDC P A O IRLA Photo Division Pr A
- Page 84 and 85:
Ministry of Law & Justice Office of
- Page 86 and 87:
MEME DI Gangtok Ministry of Micro,
- Page 88 and 89:
Ministry of Minority Affairs Nation
- Page 90 and 91:
Oil Industry Development Board (OID
- Page 92 and 93:
Bharat Immunolgicals & Biologicals
- Page 94 and 95:
CBRI, Roorkee CCMB, Hyderabad CDRI,
- Page 96 and 97:
Kandla Port Trust Kolkata Port Trus
- Page 98 and 99:
Total 46 46.1 46.2 Ministry of Stee
- Page 100 and 101:
India Tourism Development Corporati
- Page 102 and 103:
Central Adoption Resource Agency Ce
- Page 104 and 105:
Govt. Insitute for Mentally Retarde
- Page 106 and 107:
Centralised Accident and Trauma Ser
- Page 108 and 109:
Department of Social Welfare GNCT o
- Page 110 and 111:
Irrigation and Flood Control Depart
- Page 112 and 113:
Registrar Chit Fund Revenue Departm
- Page 114 and 115:
Vice-President Labour Department La
- Page 116 and 117:
S. No Ministry/Independent Departme
- Page 118 and 119:
S.No. Ministry/Department PAs who h
- Page 120 and 121:
S.No. Ministry/Department PAs who h
- Page 122 and 123:
Annexure-4 Ministry-wise List of Pu
- Page 124 and 125:
S.No. Ministry/Department PAs who h
- Page 126 and 127:
S.No. Ministry/Department PAs who h
- Page 128 and 129:
S.No. Ministry/Department PAs who h
- Page 130 and 131:
S.No. Ministry/Department PAs who h
- Page 132 and 133:
S.No. Ministry/Department PAs who h
- Page 134 and 135:
S.No. Ministry/Department PAs who h
- Page 136 and 137:
S.No. Ministry/Department PAs who h
- Page 138 and 139:
S.No. Ministry/Department PAs who h
- Page 140 and 141:
S.No. Ministry/Department PAs who h
- Page 142 and 143:
S.No. Ministry/Department PAs who h
- Page 144 and 145:
S.No. Ministry/Department PAs who h
- Page 146 and 147:
S.No. Ministry/Department PAs who h
- Page 148 and 149:
S.No. Ministry/Department PAs who h
- Page 150 and 151:
S.No. Ministry/Department PAs who h
- Page 152 and 153:
S.No. Ministry/Department PAs who h
- Page 154 and 155:
S.No. Ministry/Department PAs who h
- Page 156 and 157:
S.No. Ministry/Department PAs who h
- Page 158 and 159:
S.No. Ministry/Department PAs who h
- Page 160 and 161:
S.No. Ministry/Department PAs who h
- Page 162 and 163:
S.No. Ministry/Department PAs who h
- Page 164 and 165:
S.No. Ministry/Department PAs who h
- Page 166 and 167:
S.No. Ministry/Department PAs who h
- Page 168 and 169:
S.No. Ministry/Department PAs who h
- Page 170 and 171:
S.No. Ministry/Department PAs who h
- Page 172:
S.No. Ministry/Department PAs who h