DAILY MORNING NOTE
fundamental
fundamental

You also want an ePaper? Increase the reach of your titles
YUMPU automatically turns print PDFs into web optimized ePapers that Google loves.
<strong>DAILY</strong> <strong>MORNING</strong> <strong>NOTE</strong><br />
24 March 2017<br />
Indices<br />
Current<br />
Value<br />
%<br />
1 D<br />
%<br />
YTD<br />
Sensex 29332 0.56 10.16<br />
Nifty 9086 0.62 11.00<br />
BSE – Mid Cap 13853 0.96 15.14<br />
BSE – Sml Cap 14028 0.91 16.45<br />
SGX Nifty Fut 9119 0.18 11.41<br />
Sectors –Performance (BSE)<br />
Oil & Gas 13434 1.21 10.55<br />
Power 2233 1.20 12.36<br />
Metal 11831 1.08 17.03<br />
FMCG 9169 (0.10) 12.77<br />
Consumer Dur 14411 0.12 28.25<br />
Realty 1583 0.31 25.23<br />
Index FY16E FY17E FY18E<br />
SensexEPS 1399 1452 1799<br />
P/E 20.97 20.20 16.30<br />
NiftyEPS 403 440 549<br />
P/E 22.55 20.65 16.55<br />
FII Trading activities in Cash<br />
Date Net MTD CYTD<br />
FII 23/03 1094 21260 31576<br />
DII 23/03 (591) (8758) (3074)<br />
Figs. in Rs Cr., Source: Bloomberg.<br />
Global Indices<br />
Current<br />
Value<br />
%<br />
1 D<br />
%<br />
YTD<br />
Dow Jones 20657 (0.02) 4.52<br />
Dow Futures 20658 0.34 5.08<br />
Nasdaq 5818 (0.07) 8.07<br />
DAX 12040 1.14 4.87<br />
Nikkei 225 19275 0.99 0.84<br />
FTSE 100 7341 0.22 2.77<br />
Hang Seng 24313 (0.06) 10.51<br />
Shanghai A Sha 3253 0.12 4.80<br />
Bovespa 63531 0.01 5.49<br />
Strait Times 3132 0.16 8.72<br />
Source: Bloomberg; As on 8.30 am IST<br />
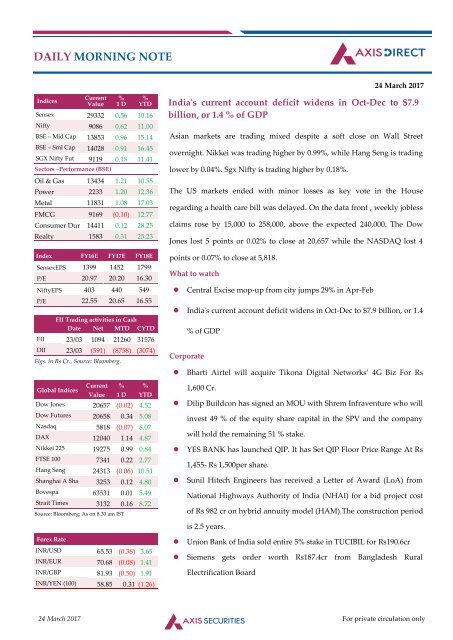
India's current account deficit widens in Oct-Dec to $7.9<br />
billion, or 1.4 % of GDP<br />
Asian markets are trading mixed despite a soft close on Wall Street<br />
overnight. Nikkei was trading higher by 0.99%, while Hang Seng is trading<br />
lower by 0.04%. Sgx Nifty is trading higher by 0.18%.<br />
The US markets ended with minor losses as key vote in the House<br />
regarding a health care bill was delayed. On the data front , weekly jobless<br />
claims rose by 15,000 to 258,000, above the expected 240,000. The Dow<br />
Jones lost 5 points or 0.02% to close at 20,657 while the NASDAQ lost 4<br />
points or 0.07% to close at 5,818.<br />
What to watch<br />
• Central Excise mop-up from city jumps 29% in Apr-Feb<br />
• India's current account deficit widens in Oct-Dec to $7.9 billion, or 1.4<br />
% of GDP<br />
Corporate<br />
• Bharti Airtel will acquire Tikona Digital Networks’ 4G Biz For Rs<br />
1,600 Cr.<br />
• Dilip Buildcon has signed an MOU with Shrem Infraventure who will<br />
invest 49 % of the equity share capital in the SPV and the company<br />
will hold the remaining 51 % stake.<br />
• YES BANK has launched QIP. It has Set QIP Floor Price Range At Rs<br />
1,455- Rs 1,500per share.<br />
• Sunil Hitech Engineers has received a Letter of Award (LoA) from<br />
National Highways Authority of India (NHAI) for a bid project cost<br />
of Rs 982 cr on hybrid annuity model (HAM).The construction period<br />
is 2.5 years.<br />
Forex Rate<br />
INR/USD 65.53 (0.38) 3.65<br />
INR/EUR 70.68 (0.08) 1.41<br />
INR/GBP 81.93 (0.50) 1.91<br />
INR/YEN (100) 58.85 0.31 (1.26)<br />
• Union Bank of India sold entire 5% stake in TUCIBIL for Rs190.6cr<br />
• Siemens gets order worth Rs187.4cr from Bangladesh Rural<br />
Electrification Board<br />
24 March 2017 For private circulation only
Trading Insights<br />
Insight from trading volumes<br />
Scrip<br />
% Chg in Qty Traded<br />
(OverAvg 30 days)<br />
Qty Traded<br />
(‘000s)<br />
Delivery %<br />
CMP*<br />
Va Tech Wabag 28 303 41 623<br />
Marico Ltd 59 2081 27 292<br />
Jet Airways Ind 35 5044 13 481<br />
Rupa& Co 436 2391 73 312<br />
Ge T&D India 25 122 56 318<br />
Repco Home Finan 57 286 76 681<br />
Snowman Logistic -10 960 38 65<br />
Insight from delivery<br />
Scrip Delivery % Total Volume (‘000s) 30 days avg Delivery % CMP*<br />
Bata India 50 480 39 544<br />
Cadila Healthcare 52 587 38 448<br />
Kaveri Seed 30 957 28 550<br />
Balmer Lawrie 6 2521 52 238<br />
LIC Housing Fin 48 1880 52 599<br />
Alembic Pharma 91 1161 55 600<br />
Indian Hotels Co 42 1030 71 124<br />
*CMP-Closing Market Price<br />
24 March 2017 2
Investment Picks<br />
Company<br />
Target<br />
Price<br />
CMP<br />
Target<br />
Price/<br />
CMP (%)<br />
ABB 1390 1193 17%<br />
Arvind 426 389 10%<br />
Ashok Leyland 116 87 33%<br />
Aurobindo Pharma 800 687 17%<br />
Bata India 580 544 7%<br />
BHEL 210 168 25%<br />
BPCL 795 654 22%<br />
CARE 1558 1474 6%<br />
CholamandalamInvst 1075 997 8%<br />
City Union Bank 166 142 17%<br />
DhanukaAgritech 860 801 7%<br />
EID Parry 390 281 39%<br />
Equitas hold 215 159 35%<br />
EsselPropack 275 239 15%<br />
Federal Bank 96 88 9%<br />
Firstsource Sol 55 42 31%<br />
Glenmark Pharma 1100 893 23%<br />
Godrej Inds 517 492 5%<br />
GSPL 175 160 10%<br />
Gulf Oil Lubricants 830 686 21%<br />
Company<br />
Target<br />
Price<br />
CMP<br />
Target<br />
Price/<br />
CMP (%)<br />
HDFC 1540 1456 6%<br />
Hero Motocorp 3655 3367 9%<br />
HPCL 655 522 26%<br />
Indraprastha Gas 1150 1001 15%<br />
J Kumar Infra 300 270 11%<br />
Manappuram Fin 114 94 22%<br />
Maruti Suzuki 6735 6013 12%<br />
MCX Ltd 1500 1218 23%<br />
Mirza Int'l 96 86 11%<br />
Mold-Tek Pack 250 227 10%<br />
Petronet LNG 455 394 16%<br />
PTC India Fin 49 39 26%<br />
Repco Home Fin 750 679 10%<br />
South Indian Bank 24 20 19%<br />
Strides Arcolab 1340 1148 17%<br />
SuprajitEngg 238 225 6%<br />
TechnocraftInds 466 411 13%<br />
Thermax 1010 911 11%<br />
Tube Invst 736 610 21%<br />
Zee Learn 72 49 46%<br />
Note : Selection criteria based on Potential upside ranging from 5 to 50%. Source: Axis Direct.<br />
24 March 2017 3
Technical View (Equity)<br />
Daily call<br />
Index CMP % up/dn S2 S1 P R1 R2<br />
Nifty 9,086.30 0.62% 9030 9055 9080 9105 9130<br />
Sensex 29332.16 0.56% 29125 29230 29300 29405 29475<br />
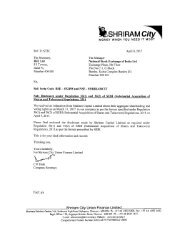
Nifty Daily chart<br />
Comments:<br />
Nifty opened with an upward gap and remained in positive terrain throughout the day. Nifty closed at<br />
9086 with a gain of 56 points.<br />
On the daily chart the index has formed a small Bullish candle with shadows on either side indicating<br />
indecisiveness amongst participants regarding the direction. The index is moving in a Higher Top and<br />
Higher Bottom formation on the daily chart indicating sustained up trend. The chart pattern suggests<br />
that if Nifty breaks and sustains below 9060 level it would witness selling which would lead the index<br />
towards 9030-9000 levels. However if index crosses above 9090 level it would witness buying which<br />
would take the index towards 9120-9150. Nifty is sustaining above its 20 , 50 and 100 day SMA which<br />
signals bullish sentiments in near term. Nifty continues to remain in an uptrend in the short and<br />
medium term, so buying on dips continues to be our preferred strategy.<br />
The daily strength indicator RSI and momentum oscillator Stochastic have both turned negative and<br />
are below their respective reference lines indicating negative bias<br />
The trend deciding level for the day is 9080. If NIFTY trades above this level then we may witness a<br />
further rally up to 9105-9130-9160 levels. However, if NIFTY trades below 9080 levels then we may see<br />
some profit booking initiating in the market, which may correct up to 9055-9030-9005 levels<br />
Stocks to focus for intraday Long<br />
Relcap, Adanient, Bergerpaint, Bata Ind, Upl<br />
Stocks to focus for intraday Short<br />
Tcs<br />
24 March 2017 4
Technical View (Currency)<br />
Technical View (Currency)<br />
Daily call<br />
Index CMP % up/dn S2 S1 P R1 R2<br />
USD/INR<br />
(Future)<br />
65.56 +0.07% 65.34 65.45 65.54 65.62 65.73<br />
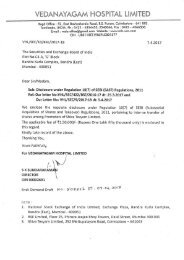
USDINR (Mar. Future) Daily chart<br />
Comments:<br />
USDINR (Mar. Future) CMP: 65.56<br />
In previous session USDINR has opened with a downward gap and buying momentum for most part of the session<br />
led it to close in positive territory. On the daily chart USDINR has formed a small bullish candle carrying either side<br />
shadows indicating absence of strength. Since past six consecutive sessions USDINR consolidating within 65.70-<br />
65.30 levels indicating short term sideways trend. Currently USDINR is sustaining below its 20 and 50 day SMA<br />
which supports bearish sentiments ahead<br />
For the day if USDINR trade and sustains above 65.60 levels then it may witness some pullback rally towards 65.80-<br />
65.90 levels. On the downside an immediate intraday support is around 65.45 levels however any violation of this<br />
support zone will cause further selling pressure towards 65.30-65.20 levels.<br />
The daily strength indicator RSI as well as the momentum indicator Stochastic both have witnessed positive<br />
crossover from oversold zone which signals possible pullback rally from lower levels.<br />
24 March 2017 5
Daily Support/ Resistance of Nifty Companies<br />
Company Pivot Point R1 R2 S1 S2 RSI-9D<br />
ACC 1395 1410 1420 1386 1371 44<br />
AMBUJACEM 233 235 237 231 229 51<br />
ADANIPORTS 325 328 330 323 320 70<br />
ASIANPAINT 1062 1070 1078 1054 1046 58<br />
AUROPHARMA 687 692 697 681 676 55<br />
AXISBANK 488 493 497 484 479 35<br />
BHARTIARTL 339 342 345 335 332 29<br />
BHEL 167 170 171 166 163 64<br />
INFRATEL 314 316 319 312 310 60<br />
BAJAJ-AUTO 2863 2878 2890 2851 2836 50<br />
BANKBARODA 162 164 165 161 159 45<br />
BOSCHLTD 22936 23123 23264 22796 22609 67<br />
BPCL 654 661 666 649 642 54<br />
CIPLA 592 602 608 586 576 56<br />
COALINDIA 295 298 300 293 290 34<br />
DRREDDY 2633 2646 2661 2618 2605 21<br />
EICHERMOT 24362 24653 24933 24082 23791 53<br />
GAIL 375 380 383 372 366 50<br />
GRASIM 1089 1099 1106 1081 1071 70<br />
HCLTECH 875 881 886 870 864 68<br />
HDFC 1452 1465 1474 1444 1431 70<br />
HDFCBANK 1430 1436 1442 1424 1418 73<br />
HEROMOTOCO 3355 3391 3414 3332 3297 64<br />
HINDALCO 194 195 196 193 191 53<br />
HINDUNILVR 903 908 914 897 892 63<br />
ICICIBANK 267 269 270 265 263 35<br />
IDEA 92 92 93 91 90 28<br />
INDUSINDBK 1382 1392 1400 1374 1364 67<br />
INFY 1037 1047 1053 1030 1020 60<br />
ITC 278 282 286 274 271 58<br />
KOTAKBANK 868 874 879 862 856 84<br />
LUPIN 1484 1502 1513 1473 1455 68<br />
LT 1540 1562 1580 1523 1501 60<br />
M&M 1274 1281 1288 1268 1261 34<br />
MARUTI 6040 6064 6093 6011 5987 49<br />
NTPC 163 166 167 162 160 60<br />
ONGC 194 194 195 193 192 53<br />
POWERGRID 193 194 195 192 191 44<br />
RELIANCE 1270 1281 1289 1262 1250 59<br />
SBIN 268 270 271 267 266 42<br />
SUNPHARMA 702 706 708 700 697 61<br />
TATASTEEL 493 499 502 490 484 58<br />
TCS 2464 2481 2502 2443 2426 43<br />
TECHM 480 485 488 477 473 45<br />
TATAPOWER 87 88 88 87 86 71<br />
TATAMOTORS 470 480 486 464 455 52<br />
TATAMTRDVR 281 285 288 278 275 45<br />
ULTRACEMCO 3978 3997 4020 3956 3937 62<br />
WIPRO 508 514 519 503 497 69<br />
YESBANK 1501 1539 1560 1480 1441 61<br />
ZEEL 522 526 529 520 516 59<br />
Source: Axis Direct.<br />
24 March 2017 6
<strong>DAILY</strong> DERIVATIVES 24 March 2017<br />
Nifty Futures View<br />
Nifty Active Futures 9107.65<br />
Nifty Active Futures OI 33962625<br />
Change in OI 363300<br />
Premium / Discount 21.35<br />
Inference<br />
Long Build Up<br />
Volatility<br />
India VIX Index 11.83<br />
Nifty ATM Call IV 10.26<br />
Nifty ATM Put IV 10.22<br />
PCR Index Options 0.79<br />
PCR F&O Total 0.77<br />
FII Activity<br />
INDEX FUTURES 101<br />
INDEX OPTIONS 707<br />
STOCK FUTURES -232<br />
STOCK OPTIONS 9<br />
FII Net Activity 585<br />
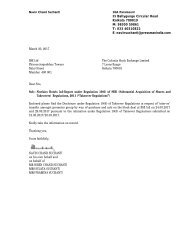
Nifty Options OI Distribution<br />
Nifty Futures closed at 9107.65<br />
increased by 0.63% with 1.07%<br />
increased in open interest<br />
indicates long buildup. Nifty<br />
futures closed with 21 points<br />
premium compared to previous<br />
day premium of 19 point.<br />
Nifty Options -Change in OI<br />
FII's were buyers in Index Futures<br />
to the tune of 101 crores and<br />
were buyers in Index Options to<br />
the tune of 707 crores, Stock<br />
Futures were sold to the tune of<br />
232 crores. FII's were net buyers<br />
in derivative segment to the tune<br />
of 585 crores.<br />
HIGHLIGHTS:<br />
Nifty Futures closed at 9107.65 increased by 0.63% with 1.07%<br />
increased in open interest indicates long buildup. Nifty futures closed<br />
with 21 points premium compared to previous day premium of 19<br />
point.<br />
FII's were buyers in Index Futures to the tune of 101 crores and were<br />
buyers in Index Options to the tune of 707 crores, Stock Futures were<br />
sold to the tune of 232 crores. FII's were net buyers in derivative<br />
segment to the tune of 585 crores.<br />
India VIX index is at 11.83. Nifty ATM call option IV is currently at 10.26<br />
whereas Nifty ATM put option IV is quoting at 10.22.<br />
Index options PCR is at 0.79 and F&O Total PCR is at 0.77.<br />
Among stock futures CEATLTD, ADANIPORTS, BAJAJ-AUTO and<br />
ABIRLANUVO have witnessed long build up and may show strength in<br />
coming session.<br />
Stocks which witnessed short build up are PCJEWELLER, TVSMOTORS,<br />
IGL and DABUR may remain weak in coming session.<br />
Nifty options OI distribution shows that 9000 has highest OI<br />
concentration followed by 8900 and may act as good support for<br />
current expiry.<br />
Nifty call strike 9200 witnessed significant OI concentration and may<br />
act as resistance for current expiry.<br />
SECURITIES IN BAN PERIOD<br />
Market Indsite:<br />
BHARATFIN, JETAIRWAYS , JPASSOCIAT, CENTURYTEX, RELCAPITAL, SINTEX, WOCKPHARMA,JSWENERGY, ORIENTBANK,HDIL,<br />
India VIX index is at 11.83. Nifty<br />
ATM call option IV is currently at<br />
10.26 whereas Nifty ATM put<br />
option IV is quoting at 10.22.<br />
Stock Futures - Long Build Up<br />
Symbol Fut Price % Chg Open Interest % Chg<br />
CEATLTD 1324.6 2.88 2100000 6.72<br />
ADANIPORTS 326.55 0.77 10315000 4.24<br />
Stock Futures - Short Build Up<br />
Market Indsite:<br />
Symbol Fut Price % Chg Open Interest % Chg<br />
PCJEWELLER 406.45 -2.81 1090500 11.16<br />
TVSMOTORS 429.35 -0.89 5402000 4.21<br />
BAJAJ-AUTO 2876.9 0.43 1408000 4.22<br />
Index options PCR is at 0.79 and<br />
F&O Total PCR is at 0.77.<br />
ABIRLANUVO 1579.2 1.22 3358000 3.57<br />
Source: NSE,SeeDiff,AXISDIRECT Research<br />
Among stock futures<br />
IGL 1004 -0.22 2325000 3.58<br />
DABUR 282.4 -0.67 12405000 3.50
<strong>DAILY</strong> DERIVATIVES<br />
Stock OI Data<br />
S ec to r Sc ri p sp o t p ri c e % c hg F u tu re s OI (in 0 00 's) % c hg<br />
T ext ile ABI RL AN UV O 1 ,57 3.8 5 1 .22 3 ,4 28 4.4 7<br />
Ot hers AD AN IEN T 10 4.5 5 2 .75 21 ,4 80 2.3 6<br />
Ot hers AD AN IPO RT S 32 5.6 0 0 .60 11 ,4 45 4.6 9<br />
A uto mo bile APOL LOT Y RE 20 6.5 0 0 .90 17 ,3 04 3.3 7<br />
T ext ile AR VIN D 38 9.5 5 0 .72 8 ,1 62 7.0 0<br />
Nifty Options OI Distribution<br />
Market Indsite:<br />
A uto mo bile ASH OK LEY 8 7.0 5 -0 .11 78 ,3 65 3.9 4<br />
A uto mo bile BAJA J-A UT O 2 ,86 5.9 5 0 .43 1 ,4 54 4.7 4<br />
B ankin g BAN KB AR OD A 16 2.2 0 0 .37 60 ,2 42 2.0 3<br />
B ankin g BAN KI ND IA 12 6.5 0 0 .56 29 ,4 12 1.2 8<br />
F M CG BAT A IN DIA 54 3.9 5 1 .67 3 ,8 95 4.1 8<br />
Ot hers BEL 15 7.2 0 2 .21 29 ,3 72 1.9 5<br />
Ot hers BEM L 1 ,31 7.3 0 1 .63 2 ,3 60 3.3 1<br />
F ina nce BH AR AT F IN 84 1.6 5 4 .44 20 ,0 65 2 8.4 4<br />
A uto mo bile BH AR AT F OR G 1 ,00 8.3 5 -0 .61 4 ,4 46 5.4 7<br />
B ankin g CA NB K 28 3.0 5 0 .28 19 ,1 45 1.2 6<br />
A uto mo bile CE AT LT D 1 ,32 2.1 0 2 .31 2 ,3 42 1 3.0 0<br />
P ow er CE SC 83 3.4 5 0 .22 4 ,2 19 1.1 3<br />
Ot hers COA LIN D IA 29 5.9 0 1 .28 22 ,8 19 5.1 9<br />
F ina nce DH F L 35 8.7 5 0 .93 19 ,7 67 3.0 0<br />
C em en t GRA SIM 1 ,09 1.9 0 1 .09 7 ,3 49 1.4 0<br />
M eta ls HI ND AL CO 19 3.7 0 0 .16 45 ,2 62 3.1 8<br />
B ankin g IC IC IBA NK 26 6.9 5 0 .74 80 ,1 63 2.7 8<br />
T ext ile IC IL 19 6.4 0 0 .49 8 ,7 19 1 5.5 4<br />
B ankin g ID BI 7 5.2 0 -0 .53 38 ,6 40 4.8 9<br />
B ankin g ID FC BA N K 6 0.5 0 0 .33 67 ,4 56 1.6 9<br />
F ina nce IF CI 3 0.2 5 2 .20 82 ,3 68 7.9 3<br />
B ankin g IN DU SI ND BK 1 ,38 3.9 0 0 .53 6 ,9 05 3.5 8<br />
Oil_G as IOC 37 6.8 0 1 .09 20 ,6 28 5.0 3<br />
In frastruc ture IR B 23 4.4 5 1 .60 15 ,8 50 3.1 1<br />
M eta ls JIN DA LST E L 12 5.5 0 0 .60 39 ,7 62 1.3 5<br />
B ankin g KOT AK BAN K 86 8.1 5 0 .69 10 ,2 32 1.8 1<br />
B ankin g KT KB AN K 13 8.0 0 0 .88 33 ,5 34 1.7 2<br />
F ina nce L&T F H 12 1.5 5 -0 .29 21 ,0 33 4.5 6<br />
A uto mo bile M&M 1 ,27 4.5 5 0 .29 4 ,9 63 3.1 1<br />
A uto mo bile MAR U T I 6 ,03 4.8 0 0 .48 2 ,5 34 2.6 0<br />
A uto mo bile MR F 59 ,50 7.1 0 2 .87 62 1.4 2<br />
M eta ls NM D C 13 5.5 0 1 .38 26 ,0 40 1.2 1<br />
Market Indsite:<br />
T ext ile PAGE IN D 14 ,78 1.3 0 1 .63 33 2.5 1<br />
B ankin g PN B 13 5.8 5 -0 .40 60 ,0 18 2.9 4<br />
P ow er POW ER GR ID 19 3.0 5 0 .49 30 ,2 32 1.3 8<br />
T ele com RC OM 3 7.8 5 1 .07 1 ,14 ,6 36 3.4 1<br />
F ina nce RE LC API T AL 61 2.1 0 3 .92 11 ,8 82 1 5.0 3<br />
M eta ls SAI L 6 1.9 0 0 .57 53 ,9 40 4.9 3<br />
B ankin g SBI N 26 8.5 0 0 .37 90 ,9 87 2.5 1<br />
F ina nce SR T RA NS F IN 1 ,03 2.9 0 -0 .14 2 ,7 85 3.5 5<br />
P harm a ST AR 1 ,14 9.2 5 -0 .03 2 ,0 42 2.2 0<br />
T ele com TA T AC OM M 73 3.5 5 0 .76 6 ,5 65 3.3 5<br />
F M CG TA T AGL OBA L 15 1.6 0 5 .94 35 ,4 96 2.1 4<br />
P ow er TA T APO WE R 8 7.1 0 0 .17 30 ,8 52 3.4 7<br />
T ech no logy TC S 2 ,46 0.3 5 -0 .75 6 ,5 82 2.8 4<br />
Source: NSE,SeeDiff,AXISDIRECT Research
Disclosures<br />
Disclosures:<br />
The following Disclosures are being made in compliance with the SEBI Research Analyst Regulations 2014 (herein after referred to as the<br />
Regulations).<br />
1. Axis Securities Ltd. (ASL) is a SEBI Registered Research Analyst having registration no. INH000000297. ASL, the Research Entity (RE)<br />
as defined in the Regulations, is engaged in the business of providing Stock broking services, Depository participant services &<br />
distribution of various financial products. ASL is a subsidiary company of Axis Bank Ltd. Axis Bank Ltd. is a listed public company<br />
and one of India’s largest private sector bank and has its various subsidiaries engaged in businesses of Asset management, NBFC,<br />
Merchant Banking, Trusteeship, Venture Capital, Stock Broking, the details in respect of which are available on www.axisbank.com.<br />
2. ASL is registered with the Securities & Exchange Board of India (SEBI) for its stock broking & Depository participant business activities<br />
and with the Association of Mutual Funds of India (AMFI) for distribution of financial products and also registered with IRDA as a<br />
corporate agent for insurance business activity.<br />
3. ASL has no material adverse disciplinary history as on the date of publication of this report.<br />
4. I/We, authors (Research team) and the name/s subscribed to this report, hereby certify that all of the views expressed in this research<br />
report accurately reflect my/our views about the subject issuer(s) or securities. I/We also certify that no part of my/our compensation<br />
was, is, or will be directly or indirectly related to the specific recommendation(s) or view(s) in this report. I/we or my/our relative or<br />
ASL does not have any financial interest in the subject company. Also I/we or my/our relative or ASL or its Associates may have<br />
beneficial ownership of 1% or more in the subject company at the end of the month immediately preceding the date of publication of<br />
the Research Report. Since associates of ASL are engaged in various financial service businesses, they might have financial interests or<br />
beneficial ownership in various companies including the subject company/companies mentioned in this report. I/we or my/our relative<br />
or ASL or its associate does not have any material conflict of interest. I/we have not served as director / officer, etc. in the subject<br />
company in the last 12-month period.<br />
Research Team<br />
Sr. No Name Designation E-mail<br />
1 RajeshPalviya Technical & DerivativeAnalyst - (Head) rajesh.palviya@axissecurities.in<br />
2 VaishnaviJagtap Technical Analyst vaishnavi.jagtap@axissecurities.in<br />
3 Kruti Shah Derivative Analyst kruti.shah@axissecurities.in<br />
4 Soni Patnaik Derivative Analyst soni.patnaik@axissecurities.in<br />
5 Hiren Trivedi Research Associate hiren.trivedi@axissecurities.in<br />
6 Sankar Narayanan Database Manager sankar.narayanan@axissecurities.in<br />
7 Kiran Gawle Associate kiran.gawle@axissecurities.in<br />
5. ASL has not received any compensation from the subject company in the past twelve months. ASL has not been engaged in market<br />
making activity for the subject company.<br />
6. In the last 12-month period ending on the last day of the month immediately preceding the date of publication of this research report,<br />
ASL or any of its associates may have:<br />
i. Received compensation for investment banking, merchant banking or stock broking services or for any other services from the<br />
ii.<br />
iii.<br />
subject company of this research report and / or;<br />
Managed or co-managed public offering of the securities from the subject company of this research report and / or;<br />
Received compensation for products or services other than investment banking, merchant banking or stock broking services<br />
from the subject company of this research report;<br />
ASL or any of its associates have not received compensation or other benefits from the subject company of this research report or any<br />
other third-party in connection with this report<br />
Term& Conditions:<br />
This report has been prepared by ASL and is meant for sole use by the recipient and not for circulation. The report and information<br />
contained herein is strictly confidential and may not be altered in any way, transmitted to, copied or distributed, in part or in whole, to<br />
any other person or to the media or reproduced in any form, without prior written consent of ASL. The report is based on the facts,<br />
figures and information that are considered true, correct, reliable and accurate. The intent of this report is not recommendatory in nature.<br />
The information is obtained from publicly available media or other sources believed to be reliable. Such information has not been<br />
independently verified and no guaranty, representation of warranty, express or implied, is made as to its accuracy, completeness or<br />
correctness. All such information and opinions are subject to change without notice. The report is prepared solely for informational<br />
purpose and does not constitute an offer document or solicitation of offer to buy or sell or subscribe for securities or other financial<br />
instruments for the clients. Though disseminated to all the customers simultaneously, not all customers may receive this report at the<br />
same time. ASL will not treat recipients as customers by virtue of their receiving this report.<br />
24 March 2017 For private circulation only
Disclosures<br />
Disclaimer:<br />
Nothing in this report constitutes investment, legal, accounting and tax advice or a representation that any investment or strategy is suitable<br />
or appropriate to the recipient’s specific circumstances. The securities and strategies discussed and opinions expressed, if any, in this report<br />
may not be suitable for all investors, who must make their own investment decisions, based on their own investment objectives, financial<br />
positions and needs of specific recipient.<br />
This report may not be taken in substitution for the exercise of independent judgment by any recipient. Each recipient of this report should<br />
make such investigations as it deems necessary to arrive at an independent evaluation of an investment in the securities of companies<br />
referred to in this report (including the merits and risks involved), and should consult its own advisors to determine the merits and risks of<br />
such an investment. Certain transactions, including those involving futures, options and other derivatives as well as non-investment grade<br />
securities involve substantial risk and are not suitable for all investors. ASL, its directors, analysts or employees do not take any<br />
responsibility, financial or otherwise, of the losses or the damages sustained due to the investments made or any action taken on basis of<br />
this report, including but not restricted to, fluctuation in the prices of shares and bonds, changes in the currency rates, diminution in the<br />
NAVs, reduction in the dividend or income, etc. Past performance is not necessarily a guide to future performance. Investors are advise<br />
necessarily a guide to future performance. Investors are advised to see Risk Disclosure Document to understand the risks associated before<br />
investing in the securities markets. Actual results may differ materially from those set forth in projections. Forward-looking statements are<br />
not predictions and may be subject to change without notice.<br />
ASL and its affiliated companies, their directors and employees may; (a) from time to time, have long or short position(s) in, and buy or sell<br />
the securities of the company(ies) mentioned herein or (b) be engaged in any other transaction involving such securities or earn brokerage<br />
or other compensation or act as a market maker in the financial instruments of the company(ies) discussed herein or act as an advisor or<br />
investment banker, lender/borrower to such company(ies) or may have any other potential conflict of interests with respect to any<br />
recommendation and other related information and opinions. Each of these entities functions as a separate, distinct and independent of<br />
each other. The recipient should take this into account before interpreting this document.<br />
ASL and / or its affiliates do and seek to do business including investment banking with companies covered in its research reports. As a<br />
result, the recipients of this report should be aware that ASL may have a potential conflict of interest that may affect the objectivity of this<br />
report. Compensation of Research Analysts is not based on any specific merchant banking, investment banking or brokerage service<br />
transactions. ASL may have issued other reports that are inconsistent with and reach different conclusion from the information presented in<br />
this report.<br />
Neither this report nor any copy of it may be taken or transmitted into the United State (to U.S. Persons), Canada, or Japan or distributed,<br />
directly or indirectly, in the United States or Canada or distributed or redistributed in Japan or to any resident thereof. If this report is<br />
inadvertently sent or has reached any individual in such country, especially, USA, the same may be ignored and brought to the attention of<br />
the sender. This report is not directed or intended for distribution to, or use by, any person or entity who is a citizen or resident of or<br />
located in any locality, state, country or other jurisdiction, where such distribution, publication, availability or use would be contrary to<br />
law, regulation or which would subject ASL to any registration or licensing requirement within such jurisdiction. The securities described<br />
herein may or may not be eligible for sale in all jurisdictions or to certain category of investors.<br />
The Disclosures of Interest Statement incorporated in this document is provided solely to enhance the transparency and should not be<br />
treated as endorsement of the views expressed in the report. The Company reserves the right to make modifications and alternations to this<br />
document as may be required from time to time without any prior notice. The views expressed are those of the analyst(s) and the Company<br />
may or may not subscribe to all the views expressed therein.<br />
Copyright in this document vests with Axis Securities Limited.<br />
Axis Securities Limited, Corporate office: Unit No. 2, Phoenix Market City, 15, LBS Road, Near Kamani Junction, Kurla (west), Mumbai-<br />
400070, Tel No. – 18002100808/022-61480808, Regd. off.- Axis House, 8th Floor, Wadia International Centre, PandurangBudhkar Marg,<br />
Worli, Mumbai – 400 025. Compliance Officer: AnandShaha, Email: compliance.officer@axisdirect.in, Tel No: 022-42671582.<br />
24 March 2017 8
Disclaimer : The views expressed / recommendations made in this report are based on Technical Analysis techniques and could be at<br />
variance with the company's / group's views based on fundamental research. The report and information contained herein is strictly<br />
confidential and meant solely for the selected recipient and may not be altered in any way, transmitted to, copied or distributed, in part<br />
or in whole, to any other person or to the media or reproduced in any form, without prior written consent. This report and information<br />
herein is solely for informational purpose and may not be used or considered as an offer document or solicitation of offer to buy or sell<br />
or subscribe for securities or other financial instruments. Nothing in this report constitutes investment, legal, accounting and tax advice<br />
or a representation that any investment or strategy is suitable or appropriate to your specific circumstances. The securities discussed and<br />
opinions expressed in this report may not be suitable for all investors, who must make their own investment decisions, based on their<br />
own investment objectives, financial positions and needs of specific recipient. This may not be taken in substitution for the exercise of<br />
independent judgment by any recipient. Each recipient of this document should make such investigations as it deems necessary to<br />
arrive at an independent evaluation of an investment in the securities of companies referred to in this document (including the merits<br />
and risks involved), and should consult its own advisors to determine the merits and risks of such an investment. The investment<br />
discussed or views expressed may not be suitable for all investors. Certain transactions -including those involving futures, options<br />
another derivatives as well as non-investment grade securities - involve substantial risk and are not suitable for all investors. No<br />
representation or warranty, express or implied, is made as to the accuracy, completeness or fairness of the information and opinions<br />
contained in this document. The Disclosures of Interest Statement incorporated in this document is provided solely to enhance the<br />
transparency and should not be treated as endorsement of the views expressed in the report. This information is subject to change<br />
without any prior notice. The Company reserves the right to make modifications and alternations to this statement as may be required<br />
from time to time without any prior approval. Axis Securities Ltd. (ASL), its affiliates, their directors and the employees may from time to<br />
time, effect or have effected an own account transaction in, or deal as principal or agent in or for the securities mentioned in this<br />
document. They may perform or seek to perform investment banking or other services for, or solicit investment banking or other<br />
business from, any company referred to in this report. Each of these entities functions as a separate, distinct and independent of each<br />
other. The recipient should take this into account before interpreting the document. This report has been prepared on the basis of<br />
information that is already available in publicly accessible media or developed through analysis of ASL. The views expressed are those of<br />
the analyst and the Company may or may not subscribe to all the views expressed therein. This document is being supplied to you solely<br />
for your information and may not be reproduced, redistributed or passed on, directly or indirectly, to any other person or published,<br />
copied, in whole or in part, for any purpose. Neither this document nor any copy of it may be taken or transmitted into the United State<br />
(to U.S. Persons), Canada, or Japan or distributed, directly or indirectly, in the United States or Canada or distributed or redistributed in<br />
Japan or to any resident thereof. This report is not directed or intended for distribution to, or use by, any person or entity who is a citizen<br />
or resident of or located in any locality, state, country or other jurisdiction, where such distribution, publication, availability or use would<br />
be contrary to law, regulation or which would subject ASL to any registration or licensing requirement within such jurisdiction. The<br />
securities described herein may or may not be eligible for sale in all jurisdictions or to certain category of investors. Persons in whose<br />
possession this document may come are required to inform themselves of and to observe such restriction. Neither the Firm, not its<br />
directors, employees, agents or representatives shall be liable for any damages whether direct or indirect, incidental, special or<br />
consequential including lost revenue or lost profits that may arise from or in connection with the use of the information.<br />
Axis Securities Limited, SEBI Reg. No.- NSE-INB/INF/INE 231481632, BSE- INB/INF 011481638,MSEI-INB/INF/INE 261481635, ARN No.<br />
64610, CDSL-IN-DP-CDSL-693-2013, SEBI-Research Analyst Reg. No. INH 000000297, Main/Dealing off.- Unit No. 2, Phoenix Market<br />
City, 15, LBS Road, Near Kamani Junction, Kurla (west), Mumbai-400070, Tel No. – 18002100808, Reg. off.- Axis House, 8th Floor,<br />
Wadia International Centre, Pandurang Budhkar Marg, Worli, Mumbai – 400 025.Compliance Officer: Anand Shaha, E-Mail ID:<br />
compliance.officer@axisdirect.in,Tel No: 022-42671582.<br />
Mutual Funds Investments are subject to market risk. Please read the offer and scheme related documents carefully before investing.<br />
5