Geoinformation for Disaster and Risk Management - ISPRS
Geoinformation for Disaster and Risk Management - ISPRS
Geoinformation for Disaster and Risk Management - ISPRS

You also want an ePaper? Increase the reach of your titles
YUMPU automatically turns print PDFs into web optimized ePapers that Google loves.
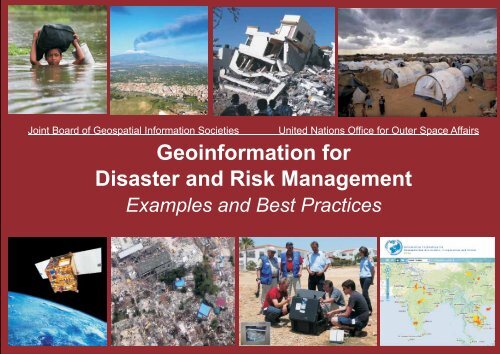
Joint Board of Geospatial In<strong>for</strong>mation Societies United Nations Office <strong>for</strong> Outer Space Affairs<br />
<strong>Geoin<strong>for</strong>mation</strong> <strong>for</strong><br />
<strong>Disaster</strong> <strong>and</strong> <strong>Risk</strong> <strong>Management</strong><br />
Examples <strong>and</strong> Best Practices
Joint Board of Geospatial In<strong>for</strong>mation Societies United Nations Office <strong>for</strong> Outer Space Affairs<br />
Book design: Gerhard Kemper<br />
<strong>Geoin<strong>for</strong>mation</strong> <strong>for</strong><br />
<strong>Disaster</strong> <strong>and</strong> <strong>Risk</strong> <strong>Management</strong><br />
Examples <strong>and</strong> Best Practices<br />
Editors: Orhan ALTAN, Robert BACKHAUS, Piero BOCCARDO, Sisi ZLATANOVA<br />
Published by: Joint Board of Geospatial In<strong>for</strong>mation Societies (JB GIS).<br />
Copyright © Joint Board of Geospatial In<strong>for</strong>mation Societies (JB GIS) 2010<br />
United Nations Office <strong>for</strong> Outer Space Affairs (UNOOSA) 2010<br />
All rights reserved by: Joint Board of Geospatial In<strong>for</strong>mation Societies<br />
c/o International Federation of Surveyors (FIG)<br />
Kalvebod Brygge 31–33, DK-1780 Copenhagen /<br />
DENMARK<br />
Tel. +45 38 86 10 81 /Fax +45 38 86 02 52<br />
E-mail: FIG@FIG.net<br />
www.fig.net/jbgis<br />
Published in English<br />
Copenhagen, Denmark<br />
ISBN 978-87-90907-88-4<br />
Credits to title photos: DLR (Germany)<br />
With a preface by Margareta Wahlström<br />
Special Representative of the Secretary-General<br />
<strong>for</strong> <strong>Disaster</strong> <strong>Risk</strong> Reduction<br />
Launched at the United Nations Office <strong>for</strong> Outer Space Affairs (UNOOSA),<br />
Vienna, Austria on 2 July 2010.<br />
This publication is the result of the collaboration of many scientists who are<br />
dedicated to the implementation of geospatial in<strong>for</strong>mation <strong>for</strong> risk <strong>and</strong> disaster<br />
management.<br />
DISCLAIMER<br />
The designations employed <strong>and</strong> the presentation of material in this publication do<br />
not imply the expression of any opinion whatsoever on the part of the secretariat of<br />
the United Nations concerning the legal status of any country, territory, city or area<br />
or its authorities, or concerning the delimitation of its frontiers or boundaries<br />
regarding its economic system or degree of development. Excerpts may be<br />
reproduced without authorization, on condition that the source is indicated. Views<br />
expressed in this publication do not necessarily reflect those of the United Nations<br />
Office <strong>for</strong> Outer Space Affairs, the United Nations <strong>and</strong> its Member States. i
Preface<br />
Each year, disasters arising from storms, floods, volcanoes <strong>and</strong><br />
earthquakes cause thous<strong>and</strong>s of deaths <strong>and</strong> tremendous damage to<br />
property around the world, displacing tens of thous<strong>and</strong>s of people from<br />
their homes <strong>and</strong> destroying their livelihoods. Developing countries <strong>and</strong><br />
poor communities are especially vulnerable. Many of the deaths <strong>and</strong><br />
property losses could be prevented if better in<strong>for</strong>mation were available<br />
on the exposed populations <strong>and</strong> assets, the environmental factors in<br />
disaster risk, <strong>and</strong> the patterns <strong>and</strong> behaviour of particular hazards.<br />
Increasingly, this in<strong>for</strong>mation is becoming available with the help of<br />
technologies such as meteorological <strong>and</strong> earth observation satellites,<br />
communication satellites <strong>and</strong> satellite-based positioning technologies,<br />
coupled with hazard modelling <strong>and</strong> analysis, <strong>and</strong> geographical<br />
in<strong>for</strong>mation systems (GIS). When integrated into a disaster risk reduction<br />
approach, <strong>and</strong> connected to national <strong>and</strong> community risk management<br />
systems, these technologies offer considerable potential to reduce losses<br />
to life <strong>and</strong> property. To do his requires a solid base of political support,<br />
laws <strong>and</strong> regulations, institutional responsibility, <strong>and</strong> trained people.<br />
Early warning systems should be established <strong>and</strong> supported as a matter<br />
of policy. Preparedness to respond should be engrained in society.<br />
The primary aim of this booklet is to explain to governments, decision<br />
makers <strong>and</strong> disaster professionals the potential uses of geoin<strong>for</strong>mation<br />
technologies <strong>for</strong> reducing disaster risks <strong>and</strong> losses, based on the<br />
knowledge <strong>and</strong> experience of experts in these fields. In July 2009, the<br />
Joint Board of Geospatial In<strong>for</strong>mation Societies <strong>and</strong> UN-SPIDER* jointly<br />
invited individuals <strong>and</strong> groups to contribute articles <strong>for</strong> the preparation<br />
of the booklet, describing their research work <strong>and</strong> experiences on the<br />
application of geospatial technologies as a contribution to a decision<br />
support <strong>for</strong>um. The Booklet covers all regions of the world <strong>and</strong> all<br />
aspects of disaster risk <strong>and</strong> its management. We commend this booklet to<br />
you in the hope that improved application of geospatial in<strong>for</strong>mation will<br />
support better underst<strong>and</strong>ing <strong>and</strong> action to reduce the number <strong>and</strong><br />
impact of disasters in future.<br />
Margareta Wahlström<br />
Special Representative of the Secretary-General<br />
<strong>for</strong> <strong>Disaster</strong> <strong>Risk</strong> Reduction<br />
* About UN-SPIDER: In its resolution 61/110 of 14 December 2006 the United Nations General<br />
Assembly agreed to establish the United Nations Plat<strong>for</strong>m <strong>for</strong> Space-based In<strong>for</strong>mation <strong>for</strong> <strong>Disaster</strong><br />
<strong>Management</strong> <strong>and</strong> Emergency Response (UN-SPIDER), which has as its mission statement: "Ensure that<br />
all countries <strong>and</strong> international <strong>and</strong> regional organizations have access to <strong>and</strong> develop the capacity to<br />
use all types of space-based in<strong>for</strong>mation to support the full disaster management cycle". The UN-<br />
SPIDER program is achieving its aims by being a gateway to space in<strong>for</strong>mation <strong>for</strong> disaster<br />
management support, by serving as a bridge to connect the disaster management <strong>and</strong> space<br />
communities <strong>and</strong> by being a facilitator of capacity-building <strong>and</strong> institutional strengthening, in<br />
particular <strong>for</strong> developing countries.<br />
UN-SPIDER is being implemented as an open network of providers of space-based solutions to support<br />
disaster management activities. Besides Vienna (where UN-OOSA is located), the program also has an<br />
office in Bonn, Germany <strong>and</strong> will have an office in Beijing, China. Additionally, a network of Regional<br />
Support Offices multiplies the work of UN-SPIDER in the respective regions.<br />
iii
Preface by JBGIS<br />
The Joint Board of Geospatial In<strong>for</strong>mation Societies (JB GIS) is a coalition of<br />
leading international geospatial societies which has as its primary goal to speak<br />
on behalf of the geospatial disciplines at an international level, especially to the<br />
United Nations <strong>and</strong> other global stakeholders. Its second goal is to coordinate<br />
activities between the geospatial professional societies <strong>and</strong> scientific<br />
organisations. The JB GIS is a co-operative network which exists through the<br />
support of its member organisations. For more in<strong>for</strong>mation please refer to the<br />
(http://www.fig.net/jbgis/).<br />
The current members of the JB GIS are the:<br />
�Global Spatial Data Infrastructure (GSDI) Association<br />
�IEEE Geoscience <strong>and</strong> Remote Sensing Society (IEEE-GRSS)<br />
�International Association of Geodesy (IAG)<br />
�International Cartographic Association (ICA)<br />
�International Federation of Surveyors (FIG)<br />
�International Geographic Union (IGU)<br />
�International Hydrographic Organization (IHO)<br />
�International Map Trade Association (IMTA)<br />
�International Society of Photogrammetry <strong>and</strong> Remote Sensing (<strong>ISPRS</strong>).<br />
�International Steering Committee <strong>for</strong> Global Mapping (ISCGM)<br />
The JBGIS <strong>and</strong> its members take great pride in their contributions of geospatial<br />
in<strong>for</strong>mation <strong>and</strong> technologies <strong>for</strong> disaster management <strong>and</strong> emergency<br />
response. There is a broad range of examples of applications of geospatial data<br />
<strong>for</strong> this purpose described in this booklet including: the application of high<br />
resolution satellite data <strong>for</strong> monitoring of the size <strong>and</strong> growth of the refugee<br />
camps; the use of Geographic In<strong>for</strong>mation Systems (GIS) <strong>for</strong> a global disaster<br />
alert <strong>and</strong> coordination system, to audit recovery after the Indian Ocean Tsunami,<br />
<strong>and</strong> mapping volcanic eruptions; the use of satellite images <strong>for</strong> <strong>for</strong>ecasting<br />
potential health effects caused by dust storms, rapid mapping of flooding in<br />
flood prone areas, fire detection, earthquake damage assessment, topographic<br />
mapping <strong>and</strong> disaster recovery; the application of global navigation satellite<br />
systems (GNSS) such as GPS <strong>for</strong> detecting structural de<strong>for</strong>mation during<br />
construction, <strong>and</strong> <strong>for</strong> a low cost l<strong>and</strong>slide monitoring system; using satellite<br />
radar data <strong>for</strong> monitoring changes in the ground surface structure of the<br />
volcano; <strong>and</strong> using a communication chain <strong>for</strong> transmitting rainfall <strong>and</strong> river<br />
level data <strong>for</strong> warning of the danger of flooding. These examples demonstrate<br />
the breadth of current applications of geospatial in<strong>for</strong>mation <strong>and</strong> provide<br />
directions on future applications of geospatial technologies <strong>for</strong> disaster<br />
management <strong>and</strong> emergency response.<br />
We trust that this booklet will provide impetus <strong>for</strong> emergency relief teams, local<br />
administrators <strong>and</strong> international coordinating response teams to further<br />
develop applications of geospatial in<strong>for</strong>mation <strong>and</strong> technologies <strong>for</strong> disaster<br />
management <strong>and</strong> emergency response.<br />
Mark Cygan Michael G. Sideris William Cartwright Stig Enemark Keith Ferries Orhan Altan Abbas Rajabifard<br />
Chair, JBGIS Pr. of IAG Pr. of ICA Pr. of FIG Pr. of IMTA Pr. of <strong>ISPRS</strong> Pr. of GSDI<br />
v
Introduction<br />
National governments, international organizations <strong>and</strong> research institutions<br />
worldwide have set to work to improve disaster management in all its phases:<br />
mitigation, preparedness, relief <strong>and</strong> response, <strong>and</strong> recovery <strong>and</strong> reconstruction.<br />
Many governments have put the <strong>for</strong>mation of a hazard-resistant <strong>and</strong> disastercoping<br />
society on their political agenda as an important factor of sustainable<br />
economic development <strong>and</strong> better quality of civil life. In this respect, the<br />
awareness of new geospatial technologies <strong>and</strong> their successful utilization in<br />
disaster management is becoming crucial.<br />
These technologies are emerging very fast. Meteorological <strong>and</strong> earth observation<br />
satellites, communication satellites <strong>and</strong> satellite-based navigation <strong>and</strong><br />
positioning systems may help to improve prediction <strong>and</strong> monitoring of potential<br />
hazards, risk mitigation <strong>and</strong> disaster management, contributing in turn to reduce<br />
losses of life <strong>and</strong> property. Global navigation satellites <strong>and</strong> earth observation<br />
satellites have already demonstrated their flexibility in providing data <strong>for</strong> a<br />
broad range of applications: weather <strong>for</strong>ecasting, vehicle tracking, disaster<br />
alerting, <strong>for</strong>est fire <strong>and</strong> flood monitoring, oil spill detection, desertification<br />
monitoring, <strong>and</strong> crop <strong>and</strong> <strong>for</strong>estry damage assessment. Monitoring <strong>and</strong><br />
management of recent natural disasters have greatly benefited from satellite<br />
imagery, such as the Indian Ocean tsunami in 2004, floods (Austria, Romania,<br />
Switzerl<strong>and</strong>, <strong>and</strong> Germany in 2005), hurricanes (USA in 2005), <strong>for</strong>est fires<br />
(Portugal, France, Greece, Australia in 2005, 2008), earthquakes (Pakistan in<br />
2005, Indonesia in 2006, Haiti 2010), etc.<br />
The use <strong>and</strong> exchange of geospatial in<strong>for</strong>mation in disaster situations is<br />
facilitated, on national <strong>and</strong> international levels, by initiatives <strong>and</strong> programmes<br />
on harmonisation of geospatial data <strong>and</strong> building of spatial data infrastructures,<br />
such as GMES <strong>and</strong> INSPIRE in Europe, the United Nations Geographic<br />
In<strong>for</strong>mation Working Group (UNGIWG), Homel<strong>and</strong> Security <strong>and</strong> Digital Earth.<br />
Sensors <strong>and</strong> in situ data have been increasingly integrated <strong>for</strong> early warning <strong>and</strong><br />
hazard monitoring. Systems maintaining geospatial in<strong>for</strong>mation are becoming<br />
more elaborate <strong>and</strong> multi- functional than ever be<strong>for</strong>e. Many of these systems<br />
can meet requirements <strong>for</strong> early warning <strong>and</strong> real-time response, <strong>and</strong> provide<br />
suitable models <strong>for</strong> elaborated predictions, simulations <strong>and</strong> visualizations.<br />
However, the knowledge about the full range of the application potential of<br />
geospatial technologies is the domain of specialists in the geosciences.<br />
There<strong>for</strong>e, the Ad-Hoc Group on <strong>Risk</strong> <strong>and</strong> <strong>Disaster</strong> <strong>Management</strong> was <strong>for</strong>med in<br />
2008, with Orhan Altan as chairman, within the Joint Board of Geospatial<br />
In<strong>for</strong>mation Societies. It is the goal of the Ad-Hoc Group to create <strong>and</strong> foster<br />
knowledge transfer between international geo-science bodies working on<br />
disaster <strong>and</strong> risk management with different technological backgrounds, <strong>and</strong> to<br />
ensure political support <strong>for</strong> the utilization <strong>and</strong> development of geo-technologies<br />
in this field.<br />
In fulfilment of its mission the Ad-Hoc Group initiated this publication in order<br />
to highlight geospatial technology which has been successfully used in recent<br />
disasters. It is a major goal of the book to make disaster managers <strong>and</strong> political<br />
decision-makers aware of the potential <strong>and</strong> benefits of using geospatial<br />
in<strong>for</strong>mation in every phase of disaster <strong>and</strong> risk management.<br />
The project started in January 2009 with an open call <strong>for</strong> contributions<br />
describing best practices <strong>and</strong> experiences. To coordinate the preparation of the<br />
booklet the Ad-Hoc Group appointed a working committee as follows: Orhan<br />
Altan, Piero Boccardo, Sisi Zlatanova (all <strong>ISPRS</strong>) <strong>and</strong> Robert Backhaus<br />
(UNOOSA/UN-SPIDER) Committee meetings were held in Prague, Zurich, Milan,<br />
Istanbul, Delft, Turin <strong>and</strong> Haifa to discuss the submitted abstracts <strong>and</strong> papers<br />
<strong>and</strong> to give guidance to the contributors. Only technology in action was<br />
considered. The papers had to be written <strong>for</strong> a wide-spread audience, with a<br />
minimum of technical detail. The booklet should demonstrate that geoin<strong>for</strong>mation<br />
<strong>and</strong> satellite technology is used to manage disasters in all parts of<br />
the world <strong>and</strong> helped in various responce <strong>and</strong> recovery operations.<br />
With regard to these goals 16 contributions were selected. The geographical<br />
distribution is shown in the figure below. <strong>Disaster</strong>s in China, Germany, Greece,<br />
Haiti, Hungary, India, Indonesia, Italy, the Philippines, Sudan, <strong>and</strong> the USA are<br />
analyzed in detail. Some of the most devastating natural disasters such as the<br />
South Asia tsunami <strong>and</strong> the Haiti Earthquake, as well as humanitarian crisis<br />
situations such as the Sudan refugee camps reveal the international ef<strong>for</strong>ts in<br />
providing maps <strong>and</strong> satellite imagery.<br />
vii
Meeting of the Committee in Istanbul (2.10.2009)<br />
The papers can be subdivided into four thematic groups. The first group<br />
presents technologies, systems, <strong>and</strong> approaches that are intended <strong>for</strong> global<br />
early warning, monitoring <strong>and</strong> support. A second group of papers addresses the<br />
integration of satellite <strong>and</strong> airborne products <strong>for</strong> immediate response <strong>and</strong><br />
damage detection in large impact disasters in Haiti, Mexico <strong>and</strong> Sudan. The third<br />
group demonstrates fusion of sensors networks measurements, imagery <strong>and</strong> GIS<br />
data <strong>for</strong> monitoring <strong>and</strong> simulation of floods, l<strong>and</strong>slides, tunnels <strong>and</strong><br />
earthquakes. The last group illustrates the benefit of integration of imagery <strong>and</strong><br />
GIS data in post-disaster situations <strong>and</strong> <strong>for</strong> risk management.<br />
The booklet starts with a chapter presenting the Global <strong>Disaster</strong> Alert <strong>and</strong><br />
Coordination System (GDACS). It is one of the first <strong>and</strong> most used portals which<br />
provide alerts <strong>and</strong> impact estimations after major natural <strong>and</strong> environmental<br />
disasters. The partnership with scientific <strong>and</strong> hazard-monitoring institutions<br />
allows collection <strong>and</strong> communication of near real-time hazard in<strong>for</strong>mation,<br />
which can be further combined in a GIS with demographic <strong>and</strong> socio-economic<br />
in<strong>for</strong>mation.<br />
viii<br />
The importance of GDACS is growing, <strong>and</strong> the number of its users increasing.<br />
The second chapter is dedicated to the global monitoring <strong>and</strong> alert service on<br />
floods provided by the non-profit association ITHACA (In<strong>for</strong>mation Technology,<br />
Humanitarian Assistance, Cooperation <strong>and</strong> Action). After a short introduction<br />
outlining the major phases of disaster management, the authors discuss the data<br />
needs <strong>for</strong> the identification of water bodies <strong>and</strong> floods. Several approaches based<br />
on medium <strong>and</strong> low resolution satellite imagery <strong>and</strong> radar data are briefly<br />
explained <strong>and</strong> illustrated <strong>for</strong> several use cases in Bangladesh. The approaches<br />
aim at providing rapid mapping in the first hours of a flood. The system<br />
developed within ITHACA is operational worldwide. In chapter 3, Oertel et al.<br />
focus on wildfire monitoring by infrared sensors on a satellite constellation. The<br />
authors discuss <strong>and</strong> evaluate currently available sensors <strong>and</strong> data products,<br />
highlighting the characteristics of a relatively new (launched in 2001) satellite<br />
equipped with Infra red sensors <strong>for</strong> quantitative analysis of high-temperature<br />
events such as wildfires <strong>and</strong> volcanoes. They advocate further development of<br />
this system towards a dedicated Fire Monitoring Constellation, which would<br />
ensure a daily observing cycle with a spatial resolution of 250m.<br />
Chapter 4 enlarges the thematic scope through the question on what additional<br />
in<strong>for</strong>mation (spatial <strong>and</strong> non-spatial) is needed <strong>for</strong> successful crisis response in<br />
general, besides disaster-specific data. The author, Shirish Ravan, groups the<br />
additional in<strong>for</strong>mation into the categories baseline data, utility <strong>and</strong><br />
infrastructure data, <strong>and</strong> thematic data on terrain <strong>and</strong> natural resources. The<br />
in<strong>for</strong>mational value of these data is briefly outlined. Since these data sets are<br />
maintained by different institutions, the author emphasizes the development of<br />
Spatial Data Infrastructures <strong>and</strong> Web-based mapping services <strong>for</strong> local<br />
governments as key elements <strong>for</strong> successful management of crisis situations.<br />
Chapter 5 provides an extended study on the use of a specific type of airborne<br />
products (orthophotos) in the post-Tsunami reconstruction phase in Aceh,<br />
Indonesia. In contrast to the other chapters this one investigates the dem<strong>and</strong> <strong>for</strong><br />
such data by different organisations. Well-illustrated with several diagrams, the<br />
study clearly reveals that the use of spatial data was critical to the successful<br />
completion of the aftermath phase.<br />
However many problems related to timely delivery of data, availability of data<br />
<strong>and</strong> costs have been reported. The study confirms the importance of Spatial Data<br />
Infrastructure, as discussed in Chapter 4.
Chapter 6, 7, 8 <strong>and</strong> 9 demonstrate satellite-based technologies applied in cases of<br />
large impact disasters such as earthquake (Haiti, China) <strong>and</strong> dust storms (New<br />
Mexico), <strong>and</strong> <strong>for</strong> monitoring of refugee camps (Sudan). In the case of Haiti,<br />
appropriate maps showing most affected areas <strong>and</strong> road accessibility were<br />
provided in the first few days after the earthquake, in support of the provision of<br />
humanitarian help by the World Food Program. Although optical imagery was<br />
widely used, it was not sufficient <strong>for</strong> obtaining a complete picture of the<br />
devastation. Web-based systems were set up on the spot using open source tools.<br />
Mobile systems equipped with webcams <strong>and</strong> GPS also appeared to be very<br />
successful.<br />
The authors, Ajmar et al., argue that many developing countries need access to<br />
participatory (community) maps such as Open Street Maps or Google Map<br />
Maker, to enable citizens <strong>and</strong> experts to quickly exchange in<strong>for</strong>mation.<br />
In chapter 7, Suju Li et al. present an extensive overview on the large number of<br />
satellite images (n=1257) provided in support of the earthquake response <strong>and</strong><br />
relief activities in China in 2008. The authors note, however, that requests <strong>for</strong><br />
earth observation data should be carefully planned to ensure complete coverage<br />
of the affected areas at different time periods. In chapter 8, Morain <strong>and</strong> Budge<br />
discuss a satellite-based system <strong>for</strong> dust monitoring, concluding that such<br />
systems might be of great importance <strong>for</strong> the mitigation of health risks. A very<br />
interesting application of satellite products in humanitarian actions is presented<br />
by Kranz et al. in chapter 9. The authors present an approach <strong>for</strong> monitoring the<br />
extent <strong>and</strong> growth of displaced persons camps using very high resolution<br />
satellite images (1m). The mapping products were delivered two days after<br />
receiving the satellite data. The feedback from the user organizations was very<br />
positive.<br />
Geographical distribution of cases<br />
ix
Chapters 10, 11, 12 <strong>and</strong> 13 present examples of technologies fusion (ground<br />
sensors, satellite products <strong>and</strong> GIS) <strong>for</strong> several medium scale disasters. Kerle <strong>and</strong><br />
Neussner present a local flood early warning system, which consists of rain <strong>and</strong><br />
river level gauges <strong>and</strong> a comm<strong>and</strong> <strong>and</strong> control system <strong>for</strong> processing the data.<br />
The system can alert citizens at every administrative level <strong>and</strong> did not miss a<br />
single flooding event, being activated 13 times since 2007. Glabsch et al. report<br />
on tests of a low-cost l<strong>and</strong> slide monitoring system based on a network of point<br />
stations with permanent position control. The system is completely modular <strong>and</strong><br />
allows long-term monitoring as it is powered by solar energy. Data h<strong>and</strong>ling <strong>and</strong><br />
processing is managed by different software packages <strong>and</strong> all the measurements<br />
are archived in a database management system. Klaus Chmelina presents the<br />
Kronos system, which is dedicated to tunnel structure monitoring. The Kronos<br />
software is being successfully applied <strong>for</strong> the metro in Budapest <strong>and</strong><br />
Thessaloniki. Spinetti et al. present their system <strong>for</strong> monitoring Mount Etna,<br />
Italy. The system monitors surface de<strong>for</strong>mation, surface temperature <strong>and</strong> gas <strong>and</strong><br />
particles emissions into the atmosphere. These parameters (obtained from<br />
satellite imagery <strong>and</strong> radar) are used by decision-makers <strong>for</strong> better<br />
underst<strong>and</strong>ing the situation after an eruption.<br />
Chapters 14, 15 <strong>and</strong> 16 demonstrate the use of geo-in<strong>for</strong>mation in a more<br />
societal context, addressing auditing disaster-related aid, <strong>and</strong> estimation of<br />
population growth in megacities. Bijker et al. (chapter 14) describe their<br />
approach based on l<strong>and</strong> cover change detection between the start <strong>and</strong> at the end<br />
of the audit period. The maps were derived from satellite images. The study<br />
clearly shows that the method is cost-effective <strong>and</strong> also served to demonstrate to<br />
the local authorities the importance of geography in policy implementation <strong>for</strong><br />
disaster areas. Similar conclusions are also drawn in the last chapter by Nolte et<br />
al., related to the role of remote sensing <strong>and</strong> GIS <strong>for</strong> the sustainable development<br />
of megacities. The authors argue that in<strong>for</strong>mation on population density <strong>and</strong> its<br />
spatial distribution is one of the most crucial requirements <strong>for</strong> resilient disaster<br />
management. These parameters can successfully be monitored with remote<br />
sensing technology <strong>and</strong> processed with GIS packages. The last chapter 16<br />
presents a number of emergency situations, in which GIS was successfully<br />
applied <strong>for</strong> response or recovery. The authors Cygan et al convincingly illustrate<br />
that GIS aids in establishing complete situational awareness by linking people,<br />
processes <strong>and</strong> in<strong>for</strong>mation.<br />
x<br />
The editors believe that this booklet is a helpful demonstration of how geoin<strong>for</strong>mation<br />
technology can be efficiently integrated into disaster management,<br />
encompassing data collection (remote sensing, sensor networks, mobile<br />
systems), data processing, <strong>and</strong> production of maps, which are further integrated,<br />
analyzed <strong>and</strong> visualized in GIS/Web-GIS. Many more advanced exciting<br />
technologies (3D visualization <strong>and</strong> simulation) are in the process of<br />
development, prototyping <strong>and</strong> testing <strong>and</strong> will be available in the coming years.<br />
The authors believe that this book will contribute to a better underst<strong>and</strong>ing <strong>and</strong><br />
acceptance of these technologies. The book is complemented by the mission<br />
profiles of the United Nations Plat<strong>for</strong>m <strong>for</strong> Space-based In<strong>for</strong>mation <strong>for</strong> <strong>Disaster</strong><br />
<strong>Management</strong> <strong>and</strong> Emergency Response (UN-SPIDER) <strong>and</strong> the JBGIS member<br />
societies<br />
The book is intended to target political <strong>and</strong> administrative decision-makers as<br />
well as administrative emergency practitioners, but also technical experts from<br />
different disciplines including computer science, in<strong>for</strong>mation technology,<br />
engineering, <strong>and</strong> disaster management.<br />
The editors would like to thank the members of the Joint Board of Geospatial<br />
In<strong>for</strong>mation Societies <strong>for</strong> approving the project, <strong>and</strong> the United Nations Office <strong>for</strong><br />
Outer Space Affairs, the United Nations World Food Programme, the foundation<br />
Compagnia di San Paolo <strong>and</strong> ITHACA <strong>for</strong> all the valuable support given to the<br />
realization of this book. Furthermore the editors want to express their sincere<br />
thanks to two persons, namely Prof. John Trinder <strong>and</strong> Dr. Gerhard Kemper. Prof.<br />
Trinder took care of the proofreading with unprecedented capacity. Dr. Kemper<br />
designed the layout of the booklet with his well-proven competence. Without<br />
their help this publication would not have been realized.<br />
We wish to thank the <strong>ISPRS</strong> Council <strong>for</strong> their encouragement <strong>and</strong> support <strong>for</strong> all<br />
stages of the preparation of the booklet to its completion.<br />
Orhan ALTAN Robert BACKHAUS Piero BOCCARDO Sisi ZLATANOVA
Table of Contents<br />
Preface by UN Office <strong>for</strong> Outer Space Affairs (UNOOSA) Page iii - iii<br />
Preface by Joint Board of Geospatial In<strong>for</strong>mation Societies (JB GIS) Page v - v<br />
C<br />
Introduction: Orhan Altan, Robert Backhaus, Piero Boccardo, Sisi Zlatanova Page vii - x<br />
Chapter 1:<br />
Chapter 2:<br />
Chapter 3:<br />
Chapter 4:<br />
Chapter 5:<br />
Chapter 6:<br />
Chapter 7:<br />
Chapter 8:<br />
Chapter 9:<br />
Chapter 10:<br />
Chapter 11:<br />
Tom De Groeve, Thomas Peter, Aless<strong>and</strong>ro Annunziato, Luca Vernaccini.<br />
Global <strong>Disaster</strong> Alert <strong>and</strong> Coordination System Page 1 - 6<br />
Andrea Ajmar, Fabio Giulio Tonolo, Francesca Perez.<br />
Flood Mapping in Support of Humanitarian Organizations Page 7 - 12<br />
Dieter Oertel, Eckehard Lorenz, Winfried Halle<br />
Detection <strong>and</strong> Monitoring of Wildfires by a Constellation of Small Satellites with<br />
Infrared Sensor Systems Page 13 - 17<br />
Shirish Ravan.<br />
Spatial Data to Complement the Use of Space-based In<strong>for</strong>mation <strong>for</strong> <strong>Disaster</strong> <strong>Management</strong> Page 19 - 23<br />
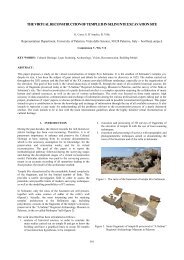
Richard A Kidd, Ian McCallum, M. Yakob Ishadamy.<br />
The Benefit of High Resolution Aerial Imagery <strong>for</strong> Topographic Mapping <strong>and</strong> <strong>Disaster</strong> Recovery:<br />
Lessons Learnt from the 2004 Indonesian Tsunami Page 25 - 30<br />
Andrea Ajmar, Piero Boccardo, Fabio Giulio Tonolo, Carlos Veloso.<br />
Earthquake Damage Assessment Using Remote Sensing Imagery. The Haiti Case Study. Page 31 - 37<br />
Suju Li, Yida Fan, Siquan Yang, Lei Wang.<br />
Space Technology Application <strong>for</strong> Wenchuan Earthquake Relief Page 39 - 44<br />
Stanley A. Morain, Amelia M. Budge.<br />
Suggested Practices <strong>for</strong> Forecasting Dust Storms <strong>and</strong> Intervening Their Health Effects Page 45 - 50<br />
Olaf Kranz, Gunter Zeug, Dirk Tiede, Stephen Cl<strong>and</strong>illon, Denis Bruckert, Thomas Kemper,<br />
Stefan Lang, Mathilde Caspard.<br />
Monitoring Refugee/IDP Camps to Support International Relief Action Page 51 - 56<br />
Norman Kerle, Olaf Neussner.<br />
Local Flood Early Warning Based on Low-Tech Geoin<strong>for</strong>matics Approaches <strong>and</strong><br />
Community Involvement. A Solution For Rural Areas in The Philippines Page 57 - 62<br />
Jessica Glabsch, Otto Heunecke, Stefan Schuhbäck.<br />
Development <strong>and</strong> Testing of a Low Cost Sensor PDGNSS L<strong>and</strong>slide Monitoring System<br />
using the Example of the Aggenalm L<strong>and</strong>slide in the Bavarian Alps Page 63 - 70<br />
xi
Chapter 12:<br />
Chapter 13:<br />
Chapter 14:<br />
Chapter 15:<br />
Chapter 16<br />
Klaus Chmelina.<br />
Tunnel Monitoring <strong>and</strong> Alarming Controlled by a Project In<strong>for</strong>mation System Page 71 - 75<br />
Claudia Spinetti, Laura Colini, Maria Buongiorno, Chiara Cardaci, Grazia Ciminelli,<br />
Stefano Corradini, Francesco Guglielmino, Massimo Musacchio, Gaetano Pace,<br />
Daniele Pellegrino, Sergio Perelli, Luca Pietranera, Giuseppe Puglisi, Pierluigi Soddu.<br />
Volcanic <strong>Risk</strong> <strong>Management</strong>: the Case of Mt. Etna 2006 Eruption Page 77 - 81<br />
Wietske Bijker, Egbert Jongsma, Richard A. Kidd.<br />
Audit of Indian Ocean Tsunami Aid in Aceh with Geo-in<strong>for</strong>mation Page 83 - 87<br />
Eike Marie Nolte, Beverley J. Adams, Friedemann Wenzel.<br />
Population Estimation <strong>for</strong> Megacities: Solving <strong>Disaster</strong> <strong>Management</strong> Challenges<br />
Using Remote Sensing, Web-GIS <strong>and</strong> Advanced Technologies Page 89 - 94<br />
Mark Cygan, Tom Patterson.<br />
GIS <strong>for</strong> Emergency <strong>Management</strong> Page 95 - 98<br />
References to all chapters Page 99 - 102<br />
UN-SPIDER<br />
Robert Backhaus, Lorant Czaran, Natalie Epler, Michael Leitgab, Young Suc Lyu,<br />
Shirish Ravan, David Stevens, Peter Stumpf, Joerg Szarzynski, Juan-Carlos Villagran de Leon.<br />
Support from Space: The United Nations Plat<strong>for</strong>m <strong>for</strong> Space-based In<strong>for</strong>mation <strong>for</strong><br />
<strong>Disaster</strong> <strong>Management</strong> <strong>and</strong> Emergency Response (UN-SPIDER) Page 103 - 113<br />
Joint Board of Geospatial In<strong>for</strong>mation Societies (JB GIS)<br />
Sponsors<br />
xii<br />
Global Spatial Data Infrastructure Association (GSDI) Page 115 - 118<br />
International Association of Geodesy (IAG) Page 119 - 122<br />
International Cartographic Association (ICA) Page 123 - 126<br />
International Federation of Surveyors (FIG) Page 127 - 130<br />
International Map Trade Association (IMTA) Page 131 - 134<br />
International Society <strong>for</strong> Photogrammetry (<strong>ISPRS</strong>) Page 135 - 138<br />
WFP's Emergency Preparedness <strong>and</strong> Response Branch Page 140 - 141<br />
The Compagnia di San Paolo Page 142 - 142
TIntroduction<br />
Global <strong>Disaster</strong> Alert <strong>and</strong><br />
Coordination System<br />
Tom De Groeve*, Thomas Peter ** , Aless<strong>and</strong>ro<br />
Annunziato*, Luca Vernaccini*<br />
* Joint Research Centre of the European Commission<br />
** United Nations Office <strong>for</strong> Coordination of<br />
Humanitarian Affairs<br />
The Global <strong>Disaster</strong> Alert <strong>and</strong> Coordination System<br />
(GDACS), established in 2004, is a cooperation<br />
framework under the United Nations umbrella with<br />
the aim to consolidate <strong>and</strong> strengthen the network of<br />
providers <strong>and</strong> users of disaster in<strong>for</strong>mation<br />
worldwide, in order to provide reliable <strong>and</strong> accurate<br />
alerts <strong>and</strong> impact estimations after sudden-onset<br />
disasters <strong>and</strong> to improve the cooperation of<br />
international responders in the immediate aftermath<br />
of major natural, technological <strong>and</strong> environmental<br />
disasters.<br />
Figure 1: Estimation of Tsunami Impact <strong>for</strong> Chile earthquake M8.8<br />
27/02/2010 06:34 AM UTC (GDACS Situation Report + JRC) 1
For the first five years (2004-2009), GDACS was<br />
funded by the European Commission. This resulted<br />
in the development of an integrated web-based<br />
service that combines critical disaster in<strong>for</strong>mation<br />
systems under one umbrella. During this period,<br />
GDACS introduced its services to international<br />
disaster responders in meetings, workshops,<br />
seminars <strong>and</strong> disaster response exercises. The main<br />
in<strong>for</strong>mation service providers in GDACS are<br />
�the European Commission Joint Research<br />
Centre (JRC) in Ispra, Italy,<br />
�the United Nations Office <strong>for</strong> Coordination of<br />
Humanitarian Affairs (OCHA), with the<br />
Virtual OSOCC or Virtual On Site Operations<br />
Coordination Center <strong>and</strong> ReliefWeb <strong>and</strong><br />
�the United Nations Operational Satellite<br />
Applications Programme (UNOSAT).<br />
GDACS comprises three elements:<br />
1. Web-based automatic alert notifications <strong>and</strong><br />
impact estimations (JRC) <strong>for</strong> earthquakes,<br />
tropical cyclones, floods <strong>and</strong> volcanoes.<br />
2. A community of emergency managers <strong>and</strong><br />
emergency operation centres in responding<br />
<strong>and</strong> disaster-prone countries <strong>and</strong> disaster<br />
response organisations worldwide.<br />
3. Automatic in<strong>for</strong>mation exchange between<br />
web-based disaster in<strong>for</strong>mation systems<br />
(presently: JRC, Virtual OSOCC, ReliefWeb<br />
<strong>and</strong> UNOSAT).<br />
2<br />
Today, many governments <strong>and</strong> disaster response<br />
organisations rely on GDACS alerts <strong>and</strong> impact<br />
estimations, <strong>and</strong> utilise the Virtual OSOCC <strong>for</strong><br />
in<strong>for</strong>mation exchange <strong>and</strong> cooperation with other<br />
actors in the first phase of major disasters.<br />
GDACS has around 10000 subscribers, most of whom<br />
represent governmental or non-governmental<br />
disaster response organisations. Several countries<br />
have included the use of GDACS services, in<br />
particular JRC's automatic alert <strong>and</strong> impact<br />
estimations <strong>and</strong> the Virtual OSOCC, in their national<br />
disaster response plans.<br />
An on-line survey that was carried out in 2008<br />
among GDACS users showed that most organisations<br />
rely heavily on its services both with regard to<br />
automatic alerts <strong>and</strong> impact estimations, as well as<br />
its network of disaster managers <strong>and</strong> coordination<br />
plat<strong>for</strong>m.<br />
Figure 2: The GDACS website (http://www.gdacs.org) shows near real-time in<strong>for</strong>mation <strong>for</strong><br />
earthquake, cyclone, flood <strong>and</strong> volcano disasters.
Three ingredients <strong>for</strong> success<br />
Multi-hazard approach<br />
GDACS was born out of a need to reduce the need to<br />
monitor several web sites <strong>for</strong> several disaster types.<br />
The European Commission Office <strong>for</strong> Humanitarian<br />
Aid (ECHO), one of the largest donors of<br />
humanitarian aid, expressed the wish <strong>for</strong> a single<br />
portal to access in<strong>for</strong>mation on any natural disaster.<br />
This has driven the early development of GDACS, or<br />
global disaster alert system. Only later was the<br />
system integrated with an in<strong>for</strong>mation system <strong>for</strong><br />
“coordination” response, which proved successful<br />
<strong>and</strong> will be described later.<br />
GDACS provides global multi-hazard disaster<br />
monitoring <strong>and</strong> alerting <strong>for</strong> earthquakes, tsunamis,<br />
floods, volcanoes <strong>and</strong> tropical cyclones. These<br />
hazards have very different physics <strong>and</strong> are studied<br />
in disconnected scientific communities. Through<br />
partnerships with scientific organisations <strong>and</strong> other<br />
hazard monitoring institutions, GDACS collects near<br />
real-time hazard in<strong>for</strong>mation, which is combined in<br />
GIS models with demographic <strong>and</strong> socio-economic<br />
data. GDACS per<strong>for</strong>ms a consequence analysis with a<br />
risk <strong>for</strong>mula combining the magnitude of a hazard<br />
with an element at risk (such as the amount of<br />
people in the affected area) <strong>and</strong> a vulnerability factor<br />
accounting <strong>for</strong> physical <strong>and</strong> socio-economic<br />
resilience of the affected area. For tsunamis, GDACS<br />
uses a novel tsunami system developed at the Joint<br />
Research Centre, which through 135000 precalculated<br />
scenarios, can provide an immediate<br />
assessment of tsunami risk .<br />
A system of systems based on open st<strong>and</strong>ards<br />
As research in early warning <strong>and</strong> alert systems is<br />
developing rapidly, existing data <strong>and</strong> models will<br />
soon be outdated. In order to provide a robust<br />
framework <strong>for</strong> cooperation, GDACS was designed<br />
from the beginning as a system of systems.<br />
Individual components can be exchanged with<br />
newer, better components that provide more added<br />
value <strong>for</strong> emergency responders.<br />
As a means to achieve interoperability of models <strong>and</strong><br />
systems, GDACS has promoted the use of st<strong>and</strong>ards<br />
<strong>for</strong> in<strong>for</strong>mation <strong>and</strong> communication. The two most<br />
important st<strong>and</strong>ards in the GDACS framework are<br />
RSS (a communication st<strong>and</strong>ard) <strong>and</strong> the GLIDE<br />
number (a content st<strong>and</strong>ard).<br />
The first, Really Simple Syndication or RSS, is a wellestablished<br />
XML <strong>for</strong>mat <strong>for</strong> exchange of messages.<br />
Because it is so simple <strong>and</strong> widely used, almost any<br />
organisation has the ability to produce RSS feeds,<br />
making it a very useful st<strong>and</strong>ard. Over the past few<br />
years, JRC has assisted several organisations to start<br />
producing RSS feeds, making their in<strong>for</strong>mation<br />
interoperable with GDACS.<br />
The second st<strong>and</strong>ard, the GLobal IDEntifier <strong>for</strong><br />
1<br />
disasters or GLIDE , is a unique identifier <strong>for</strong> a<br />
disaster, pioneered by the Asian <strong>Disaster</strong> Reduction<br />
Center. Its purpose is to allow many organisations to<br />
link their databases on disasters. This is not a trivial<br />
problem, because a disaster is a loosely defined<br />
concept used in different ways in different research<br />
<strong>and</strong> practitioner communities. The components of a<br />
GLIDE number consist of two letters to identify the<br />
disaster type (e.g. EQ - earthquake); the year of the<br />
disaster; a six-digit, sequential disaster number; <strong>and</strong><br />
the three-letter ISO code <strong>for</strong> country of occurrence.<br />
1 : http://www.glidenumber.net/<br />
Current scientific partners:<br />
�Earthquakes: US, Italian, European,<br />
German, Chinese <strong>and</strong> Russian<br />
seismological institutes<br />
�Tropical cyclones: Pacific <strong>Disaster</strong><br />
Centre<br />
�Floods: Dartmouth Flood Observatory,<br />
NASA, Ithaca<br />
�Volcanic eruptions: Smithsonian Global<br />
Volcanism Program<br />
�Tsunamis: NOAA, UNESCO<br />
Physical observations<br />
GDACS collects<br />
in<strong>for</strong>mation from existing<br />
observation <strong>and</strong> early<br />
warning systems such<br />
as tsunami detection<br />
systems<br />
Global <strong>Disaster</strong> Alert<br />
<strong>and</strong> Coordination<br />
System (GDACS)<br />
GDACS adds value by<br />
assessing affected<br />
population density <strong>and</strong><br />
vulnerability. If the<br />
situation is severe,<br />
alerts are sent by SMS,<br />
fax <strong>and</strong> email.<br />
Discussion<br />
tools<br />
<strong>Disaster</strong> management<br />
community<br />
GDACS offers tools <strong>for</strong><br />
donors, search <strong>and</strong><br />
rescue <strong>and</strong> relief NGOs<br />
to coordinate response<br />
better<br />
News services<br />
Map services<br />
Web scraping<br />
GIS analysis<br />
Severity<br />
determination<br />
Figure 3. Principle of GDACS system<br />
Population density<br />
Vulnerability<br />
Critical<br />
infrastructure<br />
Alert<br />
(SMS, fax, email)<br />
3
GDACS also supports more complex st<strong>and</strong>ards (such<br />
as Open Geospatial Consortium st<strong>and</strong>ards) or<br />
emerging st<strong>and</strong>ards (KML was adopted soon after it<br />
emerged). Supporting (<strong>and</strong> syndicating) different<br />
st<strong>and</strong>ards is an essential characteristic <strong>for</strong> a system<br />
of systems.<br />
A community built on trust<br />
During major disasters, in<strong>for</strong>mation exchange<br />
between international responders <strong>and</strong> the affected<br />
country is critical. In the immediate aftermath of a<br />
disaster, international responders seek to have an<br />
overview of the situation in order to provide a quick<br />
but measured response. The affected country, on the<br />
other h<strong>and</strong>, is burdened by managing the disaster<br />
internally <strong>and</strong> h<strong>and</strong>ling the international responders.<br />
The challenge in this environment is to make sure<br />
in<strong>for</strong>mation is not misused. Quick release of<br />
uncertain in<strong>for</strong>mation can result in adverse effects.<br />
For instance, inaccurate in<strong>for</strong>mation picked up by<br />
media <strong>and</strong> distributed can cause panic in the affected<br />
population.<br />
The main purpose of the GDACS Virtual OSOCC is to<br />
facilitate decision-making <strong>for</strong> international response<br />
to major disasters though real-time in<strong>for</strong>mation<br />
exchange by all actors of the international disaster<br />
response community. The GDACS Virtual OSOCC is a<br />
plat<strong>for</strong>m <strong>for</strong> in<strong>for</strong>mal in<strong>for</strong>mation exchange <strong>for</strong> a<br />
well-defined, private, professional community of<br />
disaster managers. Virtual OSOCC members include:<br />
�Emergency management authorities of<br />
affected countries;<br />
�International responders (including search<br />
<strong>and</strong> rescue teams, relief teams, governmental<br />
<strong>and</strong> non-governmental actors);<br />
�OCHA response communities, including<br />
the United Nations <strong>Disaster</strong> Assessment<br />
<strong>and</strong> Coordination (UNDAC): a st<strong>and</strong>-by<br />
team of disaster management<br />
professionals.<br />
4<br />
The community excludes press, media <strong>and</strong> nonprofessionals.<br />
This, <strong>and</strong> the fact that community<br />
members meet occasionally at OCHA training<br />
courses, makes <strong>for</strong> a level of trust among members<br />
which is essential to the free sharing of in<strong>for</strong>mal<br />
in<strong>for</strong>mation during major disasters. In<strong>for</strong>mal<br />
in<strong>for</strong>mation, as opposed to official in<strong>for</strong>mation, is not<br />
necessarily accurate, complete, <strong>and</strong> can be partially<br />
true or of a restricted nature; but is very valuable to<br />
professionals who underst<strong>and</strong> its value <strong>and</strong> its risks.<br />
A major benefit of in<strong>for</strong>mal in<strong>for</strong>mation is that it is<br />
more timely than official in<strong>for</strong>mation. For instance,<br />
the community exchanges in<strong>for</strong>mation on the<br />
humanitarian assistance they are planning to<br />
provide, be<strong>for</strong>e it is officially approved by their<br />
governments. This can avoid duplication <strong>and</strong> overlap<br />
in response without the risk of being negatively<br />
perceived when initial offers of assistance are<br />
withdrawn.<br />
In addition, through the Virtual OSOCC the United<br />
Nations Assessment <strong>and</strong> Coordination Team<br />
(UNDAC) can be effectively mobilised through online<br />
workflow procedures including SMS <strong>and</strong> e-mail.<br />
During crises, all Virtual OSOCC users have the<br />
opportunity to create e-mail <strong>and</strong> SMS messages that<br />
are sent automatically to subscribers to in<strong>for</strong>m about<br />
critical situation updates during disaster response<br />
operations. In between crises, the Virtual OSOCC<br />
facilitates management of UNDAC, INSARAG <strong>and</strong> UN-<br />
CMCoord training, meetings <strong>and</strong> workshops through<br />
e-mail notification, on-line participant registration<br />
<strong>and</strong> discussion of background material. It also<br />
provides its users with a discussion <strong>for</strong>um <strong>for</strong> any<br />
area of interest, including in<strong>for</strong>mation exchange on<br />
best practice <strong>and</strong> lessons learned after disaster<br />
response operations.<br />
Figure 4:.<br />
Example - 2009<br />
Typhoons in Pacific,<br />
affected areas<br />
calculated in real-time<br />
by Joint Research<br />
Centre <strong>for</strong> GDACS.
Example 2009 Typhoons in South-East Asia<br />
In 2009, 4 typhoons hit the Philippines over a short<br />
period, continuing towards Vietnam <strong>and</strong> China. First<br />
Ketsana (PAGASA name Ondoy), a category II<br />
cyclone, past by the Philippines with low intensity<br />
winds but heavy rain, <strong>and</strong> subsequently hit Vietnam.<br />
This was followed a few days later by the Category IV<br />
Typhoon Parma (Pepeng), hitting the Philippines<br />
with winds strengths over 240 km/h. Less than three<br />
weeks later, Category I Typhoon Lupit (Ramil) <strong>and</strong><br />
Category II Typhoon Mirinae (Santi) hit the<br />
Philippines.<br />
The GDACS alert system used predicted tracks<br />
downloaded from the Pacific <strong>Disaster</strong> Center, to<br />
estimate population at risk. Detailed warnings were<br />
sent up to 54h in advance of l<strong>and</strong>fall, indicating<br />
affected cities, airports <strong>and</strong> ports. GDACS<br />
automatically sent out email, SMS, fax <strong>and</strong> voice alert<br />
messages to registered users. However, warnings<br />
were not sent to the Philippines <strong>for</strong> the Ketsana<br />
Typhoon, since the winds were low intensity <strong>and</strong><br />
most damage was caused by associated floods, which<br />
currently cannot be modelled. This is an area where<br />
the GDACS alert system will be improved.<br />
G D AC S<br />
alerts<br />
K etsana<br />
(O ndoy)<br />
Parm a<br />
(Pepeng)<br />
Lupit<br />
(R am il)<br />
M irinae<br />
(Santi)<br />
C ountry Alert<br />
level<br />
Issued<br />
U T C<br />
(lead<br />
tim e)<br />
Vietnam O range 27/09<br />
18h<br />
(24h)<br />
Philippines R ed 01/10 6h<br />
(24h)<br />
Philippines G reen 19/10 0h<br />
(54h)<br />
Philippines O range 27/10<br />
18h<br />
(54h)<br />
<strong>Disaster</strong> managers activated the GDACS Virtual<br />
OSOCC on 27 September immediately after l<strong>and</strong>fall<br />
of typhoon Ketsana in the Philippines, <strong>and</strong> a second<br />
time, more than 24h be<strong>for</strong>e the typhoon's l<strong>and</strong>fall in<br />
Vietnam. Through the GDACS Virtual OSOCC, OCHA<br />
alerted the United Nations Assessment <strong>and</strong><br />
Coordination (UNDAC) team <strong>for</strong> all four typhoons,<br />
which resulted in rapid deployments of UNDAC<br />
teams on 29 September (Ketsana), <strong>and</strong> on 19<br />
October (Lupit). To facilitate international<br />
coordination, all four storms were managed in the<br />
same discussion thread, where in<strong>for</strong>mation from 23<br />
governments <strong>and</strong> disaster response organisations<br />
was exchanged in real-time from 27 September to 3<br />
November. This included situation updates from the<br />
Philippines Emergency Coordination Centre several<br />
times per day, as well as details about capacity <strong>and</strong><br />
deployment status of 17 international relief teams.<br />
Furthermore, 12 governments reported their<br />
planned in-kind or cash contributions. Nine satellitebased<br />
maps were published on the GDACS Virtual<br />
OSOCC within two days after the l<strong>and</strong>fall of the<br />
storms, most of which were linked automatically to<br />
the discussions through the GLIDE number. GLIDE<br />
was also used to integrate related media updates <strong>and</strong><br />
reports from ReliefWeb.<br />
L<strong>and</strong>fall<br />
U T C<br />
(duration)<br />
28/09 18h<br />
(24h)<br />
02/10 6h<br />
(36h)<br />
21/10 6h<br />
(54h)<br />
30/10 0h<br />
(12h)<br />
W ind speed<br />
at l<strong>and</strong>fall<br />
(category)<br />
Affected<br />
(w ind ><br />
120 km /h)<br />
R eported<br />
im pact<br />
165 km /h (II) 2.2 m illion 687 killed<br />
$1 billion<br />
219 km /h<br />
(IV)<br />
1.6 m illion 465 killed<br />
$0.5<br />
billion<br />
147 km /h (I) 0 M inim al<br />
165 km /h (II) 640,000 106 killed<br />
Way <strong>for</strong>ward<br />
Global monitoring, satellite data <strong>and</strong> crowd-sourcing<br />
Analysts in emergency situation rooms have the<br />
difficult task of making sense of a very dynamic<br />
stream of in<strong>for</strong>mation from multiple sources with<br />
various degrees of reliability, such as early warning<br />
systems, media reports, crowd sourced data, social<br />
networking, email, expert reports, sensor data <strong>and</strong><br />
satellite imagery. Since not all in<strong>for</strong>mation is of<br />
equal value, the challenge <strong>for</strong> global multi-hazard<br />
disaster alert systems is to establish st<strong>and</strong>ards <strong>for</strong><br />
quality of in<strong>for</strong>mation governing the inclusion of<br />
certain in<strong>for</strong>mation sources in a system of systems.<br />
GDACS is the principle cooperation plat<strong>for</strong>m <strong>for</strong><br />
in<strong>for</strong>mation providers where such st<strong>and</strong>ards are<br />
continuously being evaluated <strong>and</strong> revised.<br />
Scientific <strong>and</strong> operational in<strong>for</strong>mation providers in<br />
regional networks, member countries <strong>and</strong> response<br />
organisations are encouraged to participate in<br />
GDACS meetings, workshops <strong>and</strong> simulations to<br />
explore possibilities <strong>for</strong> integration of new<br />
monitoring systems in the GDACS system of systems.<br />
The JRC <strong>and</strong> UNOSAT are facilitating this process <strong>for</strong><br />
disaster alert/impact systems <strong>and</strong> satellite based<br />
maps.<br />
5
Towards a global network of emergency<br />
management entities<br />
The GDACS community is growing rapidly, which<br />
brings its own challenges. With many new members<br />
entering the community, in<strong>for</strong>mation exchange still<br />
lacks predictability, quality <strong>and</strong> st<strong>and</strong>ardised<br />
<strong>for</strong>mats. In addition, many organisations make<br />
in<strong>for</strong>mation available only after the internal analysis<br />
<strong>and</strong> decision making process has been completed,<br />
often by disseminating situation reports or through<br />
entries on the Virtual OSOCC.<br />
GDACS is working towards building a global network<br />
of emergency management entities or disaster<br />
operation centres, cooperating using st<strong>and</strong>ards <strong>for</strong><br />
the exchange of operational in<strong>for</strong>mation. Emergency<br />
management <strong>and</strong> disaster operation centres in<br />
regional networks, member countries <strong>and</strong> response<br />
organisations should participate in GDACS meetings,<br />
workshops <strong>and</strong> simulations to explore possibilities<br />
<strong>for</strong> better cooperation <strong>and</strong> to agree on procedures<br />
<strong>for</strong> in<strong>for</strong>mation exchange <strong>and</strong> coordination in major<br />
disasters.<br />
The GDACS Secretariat in the ERCC, OCHA-Geneva is<br />
facilitating this process.<br />
6
NIntroduction<br />
Flood Mapping in Support of<br />
Humanitarian Organizations<br />
Andrea Ajmar * , Fabio Giulio Tonolo * ,<br />
Francesca Perez**<br />
*ITHACA, Via P.C. Boggio, 61 10138 Torino - Italy<br />
**Politecnico di Torino DITAG, C.so Duca degli Abruzzi,<br />
24 10129 Torino Italy<br />
Nowadays, the world is facing disasters on an<br />
unprecedented scale: millions of people are affected<br />
by natural disasters globally each year <strong>and</strong> in the last<br />
decade, more than 80% of all disaster-related deaths<br />
were caused by natural hazards. When an event hits<br />
regions of the world where local authorities are not<br />
structured to deal with their complex effects, the<br />
authorities normally ask <strong>for</strong> the intervention of<br />
international organizations, such as UN agencies.<br />
Those organizations are charged with the activation<br />
of emergency procedures in order to satisfy the<br />
immediate needs of the affected population, <strong>and</strong> in<br />
the long-term prepare protracted relief <strong>and</strong> recovery<br />
operations.<br />
The different events that may generate the need <strong>for</strong><br />
humanitarian intervention may be in three groups:<br />
�sudden disasters which affect food access<br />
<strong>and</strong>/or cause population displacements;<br />
�slow-onset disasters, such as droughts <strong>and</strong><br />
crop failures;<br />
�complex emergencies that may involve<br />
conflicts, widespread social <strong>and</strong> economic<br />
disruption <strong>and</strong> large population<br />
displacements.<br />
photo by "WFP/G M Akash/Bangladesh"<br />
7
<strong>Risk</strong> management may be undertaken in three<br />
different phases: pre-disaster, response; <strong>and</strong> postdisaster.<br />
They must be managed through different<br />
activities <strong>and</strong> actions as shown graphically in Figure<br />
1. Pre-disaster activities are required to develop <strong>and</strong><br />
deliver risk assessment, establish preventative<br />
actions <strong>and</strong> prepare the operative structures <strong>for</strong><br />
managing an eventual emergency event or disaster.<br />
In the response <strong>and</strong> post-disaster phases, actions<br />
planned in the pre-disaster phase are executed,<br />
focusing firstly on saving lives <strong>and</strong>, secondly on<br />
social <strong>and</strong> economical recovery.<br />
Short-term emergency response capacities, longterm<br />
risk reduction, development <strong>and</strong> environmental<br />
protection activities are sectors in which a Spatial<br />
Data Infrastructure (SDI) may significantly improve<br />
efficiency, allowing <strong>for</strong> easy access to geospatial<br />
reference data. Data classification, data discovery<br />
<strong>and</strong> data sharing are crucial <strong>for</strong> ensuring that all<br />
activities of the risk cycle are executed efficiently <strong>and</strong><br />
effectively<br />
Methods<br />
In this chapter, the different <strong>and</strong> sequential phases of<br />
early impact activation of emergency response, from<br />
the alert to the release <strong>and</strong> distribution of value<br />
added in<strong>for</strong>mation, will be described with the help of<br />
a few examples.<br />
Alert<br />
The alert is the event that triggers early-impact<br />
activation. Early-warning systems are of particular<br />
importance, as they must combine characteristics of<br />
reliability <strong>and</strong> timeliness. Alert systems based on<br />
humanitarian news networks, such as Reuters<br />
AlertNet, are often reliable <strong>and</strong> precise, but have no<br />
predictive capabilities. Mathematical data models,<br />
combining basic input data in order to derive the<br />
evolution of physical phenomena can help in<br />
predicting an event but may not be sufficiently<br />
precise, especially <strong>for</strong> complex phenomena.<br />
Prevision of the <strong>for</strong>mation of a cyclone <strong>and</strong> its path<br />
8<br />
benefits from the consolidated knowledge of the<br />
parameters controlling atmospheric circulation <strong>and</strong><br />
diffuse sensors used <strong>for</strong> the data acquisition (Figure<br />
2). Modelling of a flood event implies a combination<br />
of atmospheric conditions with l<strong>and</strong> surface factors,<br />
both natural (morphology, soil types <strong>and</strong> saturation<br />
level, vegetation status, etc.) <strong>and</strong> anthropic (l<strong>and</strong> use,<br />
canals, dams, etc.), having high spatial <strong>and</strong> temporal<br />
variability (Figure 3). In an attempt to gain the most<br />
in<strong>for</strong>mation from both systems, content integrator<br />
services has been developed; GDACS is a web-based<br />
plat<strong>for</strong>m that combines existing web-based disaster<br />
in<strong>for</strong>mation management systems with the aim to<br />
alert the international community of major suddenonset<br />
disasters <strong>and</strong> to facilitate the coordination of<br />
international response during the relief phase of the<br />
disaster. Once a specific event is identified <strong>and</strong> is<br />
expected to have a considerable impact on<br />
population <strong>and</strong> infrastructures, an alert is issued <strong>and</strong><br />
the response phase of emergency management<br />
starts.<br />
Data sources<br />
The rapid mapping activities aimed at supporting the<br />
first stage of disaster management are generally<br />
based on satellite remote sensing data. Different<br />
Figure-1: <strong>Risk</strong> Cycle Diagram (source: GMES)<br />
types of satellite data can<br />
be used, mainly according<br />
to the type of disaster <strong>and</strong><br />
the approximate extent of<br />
the affected areas:<br />
�Low/medium resolution<br />
multispectral optical<br />
imagery (i.e.: MODIS,<br />
ALOS AVNIR, DMC,<br />
L<strong>and</strong>sat),<br />
�High resolution optical<br />
data (i.e.: Spot,<br />
Formosat, Ikonos,<br />
WorldView-1;<br />
Quickbird),<br />
�Medium resolution<br />
radar data (i.e.: Envisat,<br />
Radarsat, ALOS Palsar),<br />
�High resolution radar<br />
data (i.e.: Cosmo-<br />
SkyMed, TerraSAR-X).<br />
Figure 2: Severe storm alert, based<br />
on meteorological analysis<br />
Figure 3: Flood early-warning system
The a<strong>for</strong>ementioned data belongs to two main<br />
families: public-domain data (generally accessible<br />
through the web (i.e.: MODIS, L<strong>and</strong>sat); or<br />
commercial imagery that should be purchased<br />
through reseller companies (i.e.: Eurimage,<br />
Spotimage, DigitalGlobe). Sometimes it is possible to<br />
freely access satellite data on the basis of scientific<br />
agreements between Space Agencies <strong>and</strong> Principal<br />
Investigators in charge of a specific research (i.e.:<br />
ESA Category-1 users).<br />
Rapid mapping activities can benefit from the<br />
possible activation of the “International Charter <strong>for</strong><br />
Space <strong>and</strong> Major <strong>Disaster</strong>” that, since November<br />
2000, aims at providing a unified system of space<br />
data acquisition <strong>and</strong> delivery to those affected by<br />
natural or man-made disasters through Authorized<br />
Users.<br />
Extraction of water bodies<br />
As widely reported, radar images enable the easy<br />
identification of water bodies; there<strong>for</strong>e they are the<br />
main input data <strong>for</strong> flood analyses (Aduah et al.<br />
2007, Henry et al. 2003, Schumann et al. 2007). The<br />
all-weather capability of the radar technology <strong>and</strong><br />
the possibility to acquire data also during night time,<br />
are crucial advantages of a radar based approach. On<br />
the other h<strong>and</strong>, they are affected by geometric distortions<br />
(layover, <strong>for</strong>eshortening <strong>and</strong> radar<br />
shadows), which are hard to model, especially in<br />
mountain regions. Radar images acquired by satellite<br />
plat<strong>for</strong>ms be<strong>for</strong>e <strong>and</strong> after the event are commonly<br />
used <strong>for</strong> the definition of flooded areas. The collection<br />
of an archive radar image <strong>for</strong> identification of<br />
the water levels be<strong>for</strong>e the event can be skipped if<br />
reliable <strong>and</strong> updated water bodies data are available<br />
as defined in the so-called NWED (Normal Water<br />
Extent Database) (Wang et al. 2002). Water areas can<br />
be identified on both be<strong>for</strong>e <strong>and</strong> after images<br />
because of the near specular reflection of electromagnetic<br />
radiation emitted by the radar sensors, by<br />
water bodies which are nearly smooth surfaces when<br />
compared with the wavelength of the radar emission<br />
(similar to mirror reflection). Hence water can be<br />
easily identified by its low radiometric values or<br />
dark appearance on radar images. By using change<br />
detection techniques, it is possible to isolate the<br />
flooded areas, by distinguishing them from the<br />
normal areas covered by the water bodies. Figure 4<br />
shows a detail of the first images acquired by the<br />
Italian Radar Satellite Constellation Cosmo-Sky-MED,<br />
to support the AILA cyclone emergency which<br />
occurred in May 2009 (the cooperation of the Italian<br />
Space Agency <strong>and</strong> the e-GEOS company is acknowledged).<br />
Figure 5 displays the extracted water<br />
bodies, classified as “Reference Water” <strong>and</strong> “Flooded<br />
Areas” based on data available be<strong>for</strong>e the event.<br />
A different approach is used to define flooded areas<br />
based on multispectral optical data processing. For<br />
several reasons, the MODIS sensor is generally used<br />
<strong>for</strong> large-scale flood monitoring (Brakenridge et al.<br />
2003, Voigt et al. 2007, Aduah 2007). The MODIS<br />
mission provides daily worldwide coverage; images<br />
<strong>and</strong> derived products are in the public domain.<br />
Furthermore, low geometric resolution (250-500-<br />
1000 m) MODIS data allow a regional view of the<br />
observed phenomena. There<strong>for</strong>e, the use of MODIS<br />
data permits a multi-temporal small scale analysis of<br />
the evolution of the flood event in the areas of<br />
interest. The water bodies <strong>and</strong> flooded areas are<br />
detected by a classification procedure of MODIS<br />
primary reflectance data (Figure 6), available in near<br />
real-time through the NASA/GSFC MODIS Rapid<br />
Response System. For classification purposes specific<br />
radiometric indexes are defined, such as the NDWI<br />
(Normalised Differential Water Index), which is<br />
useful <strong>for</strong> detection of water bodies <strong>and</strong> flooded area<br />
F i g u r e 4 : C o s m o - S k y M E D i m a g e - © A S I 2009 (30<br />
th<br />
m, May, 30 2009) covering coastal areas of<br />
Bangladesh<br />
REFERENCE WATER<br />
FLOODED AREAS<br />
Figure 5: Reference water (blue) <strong>and</strong> flooded areas<br />
(red) identified trough radar imagery<br />
9
<strong>and</strong> <strong>for</strong> reduction of cloud effects. It is possible to<br />
isolate the flooded areas using reliable water body<br />
data or images acquired be<strong>for</strong>e the event (Figure 7).<br />
The main disadvantage of an approach based on<br />
optical imagery is that cloud coverage that can<br />
drastically reduce the areas that can be analysed <strong>and</strong><br />
cloud shadows may lead to classification errors.<br />
Affected population estimates<br />
The number <strong>and</strong> distribution of potentially affected<br />
populations is another type of important in<strong>for</strong>mation<br />
requested by managers responsible <strong>for</strong> the<br />
distribution of humanitarian help. A rapid estimate<br />
of this in<strong>for</strong>mation can be obtained by overlaying<br />
potentially flooded <strong>and</strong> effectively flood affected<br />
areas with population distribution data; one globally<br />
consistent source of this kind of data is the L<strong>and</strong>Scan<br />
Global Population dataset (Dobson et al. 2000).<br />
Use of the GIS Zonal Statistics function enables<br />
calculation of statistics of raster values (L<strong>and</strong>Scan<br />
Global Population data is raster based) within zones<br />
defined in another dataset, which in this case are the<br />
affected areas. This procedure allows estimation of<br />
people living in potentially or currently flooded<br />
areas, or in areas isolated by floods. On-field assessment,<br />
even based on statistical samples, should<br />
permit correction of estimates. In the case of the<br />
AILA cyclone, using updated local census datasets,<br />
the estimate of the affected population (3,436,000)<br />
per<strong>for</strong>med on the basis of satellite derived in<strong>for</strong>mation<br />
was as accurate as the figures (3,469,264)<br />
derived by field assessment.<br />
10<br />
Output<br />
Outputs of an early-impact analysis are normally in<br />
the <strong>for</strong>m of cartographic products. As <strong>for</strong> the extraction<br />
of value added in<strong>for</strong>mation, the availability of<br />
precise <strong>and</strong> accurate reference geographic datasets<br />
is essential <strong>for</strong> precisely communicating the results<br />
of the analysis. Data should be represented following<br />
cartographic rules, both in relation to output map<br />
scale <strong>and</strong> according to representation rules. According<br />
to United States Geological Survey (USGS)<br />
mapping st<strong>and</strong>ards, <strong>for</strong> example, a map representing<br />
outputs derived from the analysis of MODIS images<br />
with a ground resolution of 250m should be represented<br />
with a map scale of 1:500,000.<br />
The implementation of a Spatial Data Infrastructure<br />
(SDI) has the objective to provide to the user, tools <strong>for</strong><br />
spatial data discovery, evaluation, downloading <strong>and</strong><br />
application, together with pre-defined representation<br />
rules established <strong>and</strong> shared at international level.<br />
Other map elements, such as title, legend, scale <strong>and</strong><br />
north bar, graticules, overviews, disclaimers etc., can<br />
be automatically adapted <strong>and</strong> updated as a function of<br />
map scale, content <strong>and</strong> represented area. The result of<br />
the automation process is the preparation of a<br />
maptemplate, ready to incorporate the output of the<br />
analysis process <strong>and</strong> minimizing the ef<strong>for</strong>t <strong>for</strong><br />
managing all ancillary but essential components of the<br />
cartographic output (Figure 8).<br />
Figure 6: MODIS Aqua false colour image - NASA GSFC, MODIS<br />
th<br />
Rapid Response (250 m, May, 26 2009). Detail covering the<br />
coastal areas of Bangladesh<br />
Figure 7: Reference water (blue) <strong>and</strong> flooded areas (red)<br />
identified through optical imagery
Dissemination<br />
Dissemination process has the same importance as<br />
the analysis <strong>and</strong> map production phases. Final<br />
products should reach decision makers at the right<br />
time <strong>and</strong> in the right place.<br />
The decision on how to transfer the<br />
in<strong>for</strong>mation must take into<br />
consideration environmental factors <strong>and</strong><br />
network connectivity, with the<br />
knowledge that these infrastructures<br />
may have also been seriously affected as<br />
a consequence of the event.<br />
Integration of map products with<br />
adequate metadata in a st<strong>and</strong>ard<br />
<strong>for</strong>mat is of great help during<br />
discovery <strong>and</strong> exploitation phases.<br />
Normal methods of dissemination of<br />
data include:<br />
� Delivery as an attachment to<br />
e-mails to a pre-defined<br />
mailing list;<br />
� Inclusion into web pages,<br />
where a search engine would<br />
help in identifying the<br />
searched product;<br />
� The delivery to specific<br />
portals, focused on<br />
emergency management <strong>and</strong><br />
with a large circulation<br />
(Figure 9).<br />
RSS <strong>and</strong> GeoRSS feed technology are<br />
a useful means <strong>for</strong> advising potential<br />
users of the availability of new <strong>and</strong><br />
updated content.<br />
Figure 8: Cartographic representation of flood affected areas on the basis of a map template<br />
11
12<br />
Figure 9: Map included into the AlertNet web portal<br />
Discussion <strong>and</strong> conclusions<br />
The paper mainly focuses on the use of medium/low<br />
resolution satellite data (both optical <strong>and</strong> radar) to<br />
identify flooded areas required <strong>for</strong> rapid mapping. As<br />
clearly highlighted this kind of data allows the<br />
per<strong>for</strong>mance of a first assessment of the affected<br />
areas <strong>and</strong> affected population. Radar images have<br />
the main advantage that they are not affected by<br />
cloud coverage, but the acquisition has to be<br />
triggered <strong>and</strong> it can take several days be<strong>for</strong>e the data<br />
is available. Optical data such as MODIS are acquired<br />
on a daily basis <strong>and</strong> are in the public domain, but<br />
un<strong>for</strong>tunately they suffer from the probable<br />
presence of clouds during floods/cyclones events.<br />
In case the main aim is to support the logistic<br />
operations in the context of emergency response,<br />
in<strong>for</strong>mation on accessibility of the road network are<br />
the main concern. Very high resolution satellite data<br />
(geometric resolution varying from 0.6 m to 2.5 m)<br />
permits the creation of specific products showing the<br />
flood impact on the infrastructure, with particular<br />
emphasis on the road network.<br />
According to the authors' experience in the field of<br />
rapid mapping, cooperation with humanitarian <strong>and</strong><br />
governmental entities working in the impacted<br />
country is the best way to achieve continuous<br />
feedback from the field, thus allowing the generation<br />
of value-added products which comply strictly with<br />
the requirements of the users in the field.<br />
Acknowledgements<br />
ASI Cosmo-SkyMED images have been provided by<br />
the e-GEOS company
Detection <strong>and</strong> Monitoring of<br />
Wildfires by a Constellation of<br />
Small Satellites with Infrared<br />
Sensor Systems<br />
1 2 2<br />
Dieter Oertel , Eckehard Lorenz , Winfried Halle<br />
1:Astro- und Feinwerktechnik Adlershof GmbH, Albert-Einstein-<br />
Str. 12, D-12489 Berlin, Germany, Tel.: +49 172 9450074, Fax:<br />
+49 35477 51778, e-mail: kdoertel@t-online.de<br />
2: Deutsches Zentrum für Luft- und Raumfahrt, Ruther<strong>for</strong>dstr. 2,<br />
D-12489 Berlin, Germany<br />
FIntroduction<br />
Fire activity is a global phenomenon characterized<br />
by strong spatial <strong>and</strong> temporal variability. Wildfire<br />
is an important ecosystem disturbance with varying<br />
return frequencies, resulting in l<strong>and</strong> cover alteration<br />
<strong>and</strong> change, <strong>and</strong> atmospheric emissions on multiple<br />
time scales. Catastrophic wildfires in the last few<br />
years have again stressed that sound fire<br />
management decisions (including justification of a<br />
possible severity ranking) on the deployment of fire<br />
fighters <strong>and</strong> of limited technical equipment on the<br />
ground, rely very much on timely <strong>and</strong> detailed<br />
in<strong>for</strong>mation on location, intensity, direction <strong>and</strong> rateof-spread<br />
of the fire fronts.<br />
Figure 1: Micro-satellite <strong>for</strong> Bi-spectral InfraRed<br />
Detection (BIRD) on Low Earth Orbit (LEO)<br />
1<br />
13
In general, in<strong>for</strong>mation on wildfire activity is used<br />
<strong>for</strong> (Csiszar 2008):<br />
�global change research, estimating<br />
atmospheric emissions <strong>and</strong> developing<br />
periodic global <strong>and</strong> regional assessments,<br />
(i.e. quantification of the fire impact on<br />
climate),<br />
�fire management <strong>and</strong> ecosystem<br />
management planning,<br />
�operational purposes (preparedness <strong>and</strong><br />
wildfire suppression),<br />
�development of in<strong>for</strong>med policies.<br />
Satellite earth observation is appropriate to provide<br />
repetitive data at spatial <strong>and</strong> temporal scales<br />
necessary <strong>for</strong> detection <strong>and</strong> monitoring of wildfires.<br />
Existing <strong>and</strong> currently planned meteorological <strong>and</strong><br />
environmental satellite sensor systems are able to<br />
provide useful coarse scale data sets <strong>for</strong>: (a) fire<br />
danger assessment, (b) fire occurrence detection,<br />
<strong>and</strong> (c) post-fire assessment. Un<strong>for</strong>tunately, the<br />
relative coarse spatial resolution of these data sets<br />
with a pixel size larger than 1km <strong>for</strong> detecting<br />
electromagnetic radiation in the mid <strong>and</strong> thermal<br />
infrared wavelength b<strong>and</strong>s - is insufficient to<br />
accurately locate individual fire fronts <strong>and</strong> to assess<br />
their strength. However, it is these attributes that<br />
are very important <strong>for</strong> fire management decisions.<br />
14<br />
Some Relevant Definitions<br />
An international expert team in (Csiszar 2008)<br />
defined the “Fire Disturbance Essential Climate<br />
Variable” which includes Burned Area as the primary<br />
variable <strong>and</strong> two supplementary variables. The “Fire<br />
Disturbance Essential Climate Variable” is one of the<br />
Essential Climate Variables (ECV`s) defined by the<br />
Global Terrestrial Observing System (GTOS).<br />
Burned Area is defined as the area affected by<br />
human-made or natural fire <strong>and</strong> is expressed in units<br />
of area such as hectare (ha) or square kilometre<br />
(km2). In<strong>for</strong>mation on Burned Area, combined with<br />
other in<strong>for</strong>mation (combustion efficiency <strong>and</strong><br />
available fuel load) provides estimates of emissions<br />
of trace gases <strong>and</strong> aerosols. Measurements of Burnt<br />
Area can be used as a direct input (driver) to climate<br />
<strong>and</strong> carbon-cycle models.<br />
Active Fire is the location of burning at the time of<br />
the observation <strong>and</strong> is expressed in spatial<br />
coordinates (or by an indicator of presence or<br />
absence of fire in a spatially explicit digital raster<br />
map, such as a satellite image). Detection of active<br />
fires provides an indication of regional, seasonal <strong>and</strong><br />
inter-annual variability of fire frequency or shifts in<br />
geographical location <strong>and</strong> timing of fire events.<br />
Active fire in<strong>for</strong>mation is also required by some<br />
algorithms used to generate burned area products.<br />
Detection of active fires can also serve as part of the<br />
validation process <strong>for</strong> burned area products.<br />
Fire Radiative Power (FRP) is the rate of emitted<br />
radiative energy by the fire at the time of the<br />
observation <strong>and</strong> is expressed in units of power, such<br />
as Watts (W). The methodologies to derive FRP use<br />
physical-empirical approaches to derive rates of total<br />
emitted radiative energy from narrow-b<strong>and</strong>,<br />
unsaturated radiance measurements.<br />
There is a strong empirical relation between FRP <strong>and</strong><br />
rate of combustion, allowing CO2 emission rates<br />
from a fire to be estimated from FRP observations.<br />
Multiple FRP observations can in principle provide<br />
estimation of the total CO2 emitted during the fire<br />
through estimating time-integrated Fire Radiated<br />
Energy.<br />
The ratio the FRP (W) of a single fire front line to its<br />
length (m) is called Fire Line Strength (W/m). The<br />
fire line strength is a measure of the burning<br />
severity, which is directly related to the fire impact<br />
on the ecosystem. Estimates of the fire line strength<br />
derived from data obtained by a satellite or an<br />
aircraft sensor enable the distinction, <strong>for</strong> instance,<br />
between cleaning fires <strong>and</strong> devastating fires.<br />
Active Fire Satellite In<strong>for</strong>mation - Currently<br />
Available Products <strong>and</strong> Gaps<br />
Table 1 shows currently available major satellite<br />
derived Active Fire Products with Fire Radiative<br />
Power (FRP) in<strong>for</strong>mation (Csiszar 2008). This is a<br />
service provided by currently available sensor<br />
systems, such as, the MODerate resolution Imaging<br />
Spectro-radiometer (MODIS) on the polar orbiting<br />
satellites “Terra” <strong>and</strong> “Aqua” or the Spinning<br />
Enhanced Visible <strong>and</strong> InfraRed Imager (SEVIRI) on<br />
the geostationary satellite Meteosat-8.
Active Fire Products with Fire Radiative Power In<strong>for</strong>mation<br />
Name Sensor(s)<br />
Coverage Resolution<br />
Spatial Temporal Spatial Temporal<br />
GFED MODIS Global 1997-2004 1° x 1° 1 month<br />
ATSR<br />
(finished) latitude/<br />
VIRS<br />
longitude<br />
WF_ABBA GOES-E/W N/S America 1995-present 4 km 30 min<br />
MODIS FRP MODIS Global 2001-present 1 km 1 day<br />
SEVIRI FRP Meteosat-8<br />
SEVIRI<br />
Africa, Europe ~2006-present 3 km 15 min<br />
Table 1: Currently available major satellite derived Active Fire Products with Fire<br />
Radiative Power (FRP) in<strong>for</strong>mation (Csiszar 2008).<br />
Un<strong>for</strong>tunately, these products only marginally meet<br />
the requirements defined by the Global Climate<br />
Observation System (GCOS) Implementation Plan.<br />
Considering this situation, the Committee on Earth<br />
Observation Satellites (CEOS) identified the<br />
following in<strong>for</strong>mation deficiencies (Csiszar 2008):<br />
�no global products at the specified 250m<br />
spatial resolution <strong>and</strong> daily observing cycle<br />
exist,<br />
�product continuity <strong>and</strong> consistency between<br />
products derived from the various sensors<br />
remains unresolved.<br />
Germany's Bi-spectral Infrared Detection<br />
(BIRD) Mission<br />
The primary mission objective of the Bi-spectral<br />
InfraRed Detection (BIRD) satellite, which was<br />
piggyback launched in a 570 km circular sunsynchronous<br />
orbit on 22 October 2001, was<br />
detection <strong>and</strong> quantitative analysis of hightemperature<br />
events (HTE) such as wildfires <strong>and</strong><br />
volcanoes (Briess et al 2003). In 2002 - 2004 BIRD<br />
very convincingly demonstrated the potential of<br />
unsaturated fire data obtained with an earth<br />
observation system with a spatial resolution of 200 -<br />
250m <strong>for</strong>:<br />
�the derivation of Active Fire Products with<br />
Fire Radiative Power (FRP) in<strong>for</strong>mation <strong>and</strong><br />
the estimation of the Fire Line Strength of<br />
individual fire fronts,<br />
�the comparison of Active Fire Products, such<br />
as FRP, derived from different satellite<br />
sensors using data nearly obtained<br />
simultaneously.<br />
The principal BIRD imaging payload includes the Bispectral<br />
Infrared Camera with channels in the Mid-<br />
Infrared <strong>and</strong> Thermal Infrared spectral ranges, <strong>and</strong><br />
the Wide-Angle Optoelectronic Stereo Scanner<br />
WAOSS-B with a nadir channel in Near-Infrared<br />
spectral range. The ground resolution of the BIRD<br />
nadir channels is 185m in the NIR <strong>and</strong> 370m in the<br />
MIR <strong>and</strong> TIR. The NIR, MIR <strong>and</strong> TIR channels have<br />
the same sampling step of 185m due to an oversampling<br />
by a factor of 2 of the MIR <strong>and</strong> TIR data.<br />
A unique feature of the BIRD push-broom type MIR<br />
<strong>and</strong> TIR sensor channels is the real-time adjustment<br />
of their integration time (Skrbek <strong>and</strong> Lorenz 1998).<br />
If the real-time sensor on-board processing indicates<br />
that some detector elements are saturated (or close<br />
to saturation) during the regular exposure, a second<br />
exposure is per<strong>for</strong>med within the same sampling<br />
interval with a reduced integration time. The data of<br />
both exposures are merged during the on-ground<br />
processing. This “intelligent” procedure preserves a<br />
0.2°K radiometric resolution <strong>for</strong> pixels at normal<br />
temperatures <strong>and</strong> eliminates detector saturation<br />
over high temperature targets (Skrbek <strong>and</strong> Lorenz<br />
1998).<br />
Example of MODIS-BIRD Data Comparison<br />
Comparing near-simultaneously collected data from<br />
BIRD <strong>and</strong> lower spatial resolution sensors such as<br />
MODerate Imaging Spectro-radiometer (MODIS) on<br />
the US environmental satellite “Terra” provides a<br />
useful metric by which the enhanced per<strong>for</strong>mance of<br />
BIRD in terms of fire detection <strong>and</strong> characterization<br />
can be judged (Wooster et al 2003).<br />
15
16<br />
Figure 2 shows an area west of Lake Baikal, Russia,<br />
observed nearly simultaneously, i.e. within a 30minute<br />
interval, by MODIS/“Terra” <strong>and</strong> BIRD on 16<br />
July 2003. The comparison clearly shows that only<br />
the BIRD data allow an estimation of fire front<br />
attributes relevant <strong>for</strong> fire managers.<br />
Table 2 shows fire attributes of the numbered <strong>for</strong>est<br />
fire fronts, which were extracted from the BIRD<br />
image in Fig. 2 (right image) using dedicated<br />
algorithms.<br />
Fire cluster<br />
(number in<br />
Fig.1,BIRD)<br />
Fire Radiative<br />
Power (FRP)<br />
(MW)<br />
Fire front<br />
length<br />
Figure 2: Fragments of <strong>for</strong>est fire images at Baikal, obtained by MODIS <strong>and</strong> BIRD on 16 July 2003. Images show the<br />
MIR image from each sensor, <strong>and</strong> detected hot clusters are colour coded according to their Fire Radiative Power<br />
(FRP) in Mega Watts (MW). The arrows in the MODIS image fragment show false alarms<br />
(km)<br />
I<br />
Fire front strength<br />
(kW/m)<br />
Fire front effective<br />
depth<br />
(m)<br />
1 1829 8.2 223 7.7<br />
2 150 5.8 26 1.9<br />
3 409 6.5 63 3,2<br />
4 111 4.8 23 1.1<br />
5 126 3.4 37 1.3<br />
6 568 5.0 114 3,8<br />
7 136 6.3 22 1,2<br />
Table 2: Attributes of numbered <strong>for</strong>est fire fronts in<br />
the BIRD image fragment in Fig. 1 (right) of the<br />
Lake Baikal area in Siberia, Russia obtained on 16<br />
July 2003.<br />
Required Classes of Satellite Instruments to<br />
Provide Active Fire Datasets<br />
The provision of Active Fire in<strong>for</strong>mation products<br />
requires data records of appropriate multi-spectral<br />
imagery, <strong>for</strong> example, through the following classes<br />
of instruments <strong>and</strong> satellites (Csiszar 2008):<br />
�SEVIRI-class instruments, extended to a full<br />
set of geostationary meteorological<br />
satellites, providing frequent but lower<br />
spatial resolution observations,<br />
�MODIS-class observations which should be<br />
extended by future “Aqua” <strong>and</strong> “Terra” type<br />
developments through the Visible Infrared<br />
Imaging Radiometer Suite(VIIRS) as<br />
<strong>for</strong>eseen in the future US National Polarorbiting<br />
Operational Satellite System<br />
(NPOESS) program,<br />
�Future BIRD-type instruments, required <strong>for</strong><br />
higher spatial resolution data acquisition<br />
with reduced spatial coverage, to augment<br />
the more frequent but lower spatial<br />
resolution datasets described above <strong>for</strong><br />
detecting missing smaller <strong>and</strong> weaker fires.
In-Orbit Verification of On-board Fire Detection<br />
<strong>and</strong> Analysis<br />
Timely provision of in<strong>for</strong>mation is essential to<br />
support decision-making of fire managers in fire<br />
suppression planning, crew mobilization <strong>and</strong><br />
movement. There<strong>for</strong>e, on-board processing of fire<br />
front attributes, including geo-referencing <strong>and</strong> their<br />
direct transmission to the user on the ground is a<br />
challenging task <strong>for</strong> small satellites, but it should be<br />
technically feasible.<br />
Key procedures <strong>for</strong> on-board fire detection <strong>and</strong><br />
analysis are pre-processing <strong>and</strong> extraction of fire<br />
attributes.<br />
In-orbit verification of on-board fire detection <strong>and</strong><br />
analysis will be conducted on Germany's first<br />
Technologie Erprobungs Traeger (TET-1). TET-1 is a<br />
space-borne verification tool <strong>for</strong> new small satellite<br />
technologies, which is to be per<strong>for</strong>med in the<br />
framework of the On-Orbit Verification (OOV)<br />
program of the German Space Agency. The<br />
successful BIRD mission <strong>and</strong> the planned on-board<br />
extraction of fire front attributes on TET-1 are two<br />
important milestones on the way to the creation of a<br />
prospective Fire Monitoring Constellation.<br />
Need of a Fire Monitoring Constellation Based<br />
on Small Satellites<br />
The dem<strong>and</strong> by fire mangers <strong>for</strong> repeated, fast, <strong>and</strong><br />
detailed in<strong>for</strong>mation <strong>for</strong> all fire fronts in the areas of<br />
surveillance is highly justified. Wildfire activity is at<br />
maximum in the afternoon <strong>and</strong> optimum wildfire<br />
observation requires two consecutive data takes at<br />
13 -15 <strong>and</strong> 16 - 18 clock local time. These local<br />
observation times are not convenient to the majority<br />
of earth observation missions.<br />
The essential fire attribute in<strong>for</strong>mation, obtained<br />
twice during the peak period of wildfire burning will<br />
not be delivered by existing or planned satellite<br />
sensors, because their spatial resolution is too<br />
coarse <strong>and</strong> most of these systems have local<br />
observation times be<strong>for</strong>e noon. There<strong>for</strong>e, a<br />
dedicated Fire Monitoring Constellation (FMC) must<br />
be implemented to secure (i) a spatial resolution of<br />
200-300m <strong>and</strong> (ii) optimum observation times <strong>for</strong><br />
fire detection <strong>and</strong> monitoring in the afternoon.<br />
The FMC must resolve the deficiencies identified by<br />
CEOS (Csiszar 2008, chapter 3) by provision of:<br />
�Active Fire Products at the specified 250m<br />
spatial resolution within a daily observing<br />
cycle,<br />
�Continuity <strong>and</strong> consistency between Active<br />
Fire Products derived from the FMC <strong>and</strong><br />
existing (see Table 1) <strong>and</strong> planned<br />
meteorological or environmental satellite<br />
sensors with fire-adapted IR b<strong>and</strong>s, such as,<br />
the Sea L<strong>and</strong> Surface Temperature<br />
Radiometer (SLSTR) on Sentinel-3 <strong>and</strong> the<br />
IR sensor of Meteosat Third Generation<br />
(MTG) - with coarser spatial resolution<br />
(greater than 1km).<br />
The FMC should consist of four small satellites of the<br />
BIRD/TET class in low earth orbit <strong>and</strong> be equipped<br />
with compact <strong>and</strong> intelligent IR sensors <strong>and</strong> onboard<br />
data processing. Active Fire Products from a<br />
FMC will be of great value also <strong>for</strong> fire ecologists,<br />
health organizations <strong>and</strong> national administrations<br />
worldwide (Oertel 2005).<br />
17
Spatial data to complement the use<br />
of space-based in<strong>for</strong>mation <strong>for</strong><br />
disaster management<br />
Shirish Ravan<br />
UN-SPIDER Programme Officer, UN Office of Outer<br />
Space Affairs, Vienna Email: shirish.ravan@unoosa.org<br />
OSpatial data the missing link <strong>for</strong> effective use<br />
of space-based in<strong>for</strong>mation<br />
One of the m<strong>and</strong>ates of the UN plat<strong>for</strong>m <strong>for</strong> Spacebased<br />
In<strong>for</strong>mation <strong>for</strong> <strong>Disaster</strong> <strong>Management</strong> <strong>and</strong><br />
Emergency Response (UN-SPIDER) is to offer<br />
technical advisory support to the Member States<br />
with the aim to enable them to use space-based<br />
in<strong>for</strong>mation <strong>for</strong> disaster management <strong>and</strong> to<br />
improve their access to this type of in<strong>for</strong>mation. It is<br />
observed that the space-based in<strong>for</strong>mation can be<br />
used effectively only when the spatial data on other<br />
aspects (<strong>for</strong> example administrative boundaries,<br />
infrastructure details, settlements etc.) are<br />
integrated with the space-based in<strong>for</strong>mation. Spatial<br />
data layers come from various sources such as field<br />
surveys, topographic maps, <strong>and</strong> thematic maps<br />
derived from interpretation of satellite images etc.<br />
These spatial data layers can be used <strong>for</strong> analysis <strong>and</strong><br />
modelling along with scientific in<strong>for</strong>mation to<br />
prepare risk maps related to various hazards.<br />
Depending on its organizational structure <strong>and</strong><br />
technical capabilities, each country represents a<br />
unique situation with regard to its readiness to use<br />
the space-based in<strong>for</strong>mation <strong>for</strong> disaster<br />
management.<br />
Baseline data<br />
Utility <strong>and</strong><br />
infrastructure<br />
data<br />
<strong>Disaster</strong><br />
specific data<br />
Thematic data on<br />
terrain <strong>and</strong><br />
natural resources<br />
Near-real time<br />
satellite data <strong>and</strong><br />
thematic maps<br />
Geographic<br />
In<strong>for</strong>mation<br />
System<br />
<strong>for</strong><br />
<strong>Disaster</strong><br />
<strong>Management</strong><br />
NSDI<br />
Data<br />
Analysis <strong>and</strong><br />
Modelling<br />
Enterprise<br />
GIS<br />
Figure 1: Conceptual framework - The Spatial In<strong>for</strong>mation <strong>for</strong> <strong>Disaster</strong> <strong>Management</strong><br />
Web Map<br />
Services<br />
End Users<br />
(<strong>Disaster</strong><br />
Managers)<br />
19
Up-to-date thematic <strong>and</strong> baseline spatial data are a<br />
basic requirement <strong>for</strong> an effective use of space-based<br />
in<strong>for</strong>mation <strong>for</strong> risk mapping <strong>and</strong> disaster<br />
management. Below are some typical challenges<br />
experienced during an evaluation of the use of spacebased<br />
in<strong>for</strong>mation <strong>for</strong> disaster management in<br />
several countries:<br />
�Non-availability of baseline <strong>and</strong> thematic<br />
spatial data in the framework of GIS<br />
�Baseline <strong>and</strong> thematic spatial data may be<br />
available, but scattered at different locations<br />
with non-uni<strong>for</strong>m data st<strong>and</strong>ards that limit<br />
data integration<br />
�Baseline <strong>and</strong> thematic spatial data may be<br />
well organized centrally but not integrated<br />
with risk related data<br />
Nature of spatial data required <strong>for</strong> disaster<br />
management<br />
The spatial data should be linked to non-spatial data<br />
(attributes) <strong>and</strong> field based data so that they can be<br />
visualized in the <strong>for</strong>m of maps, which can further be<br />
used in map based modelling to provide inputs <strong>for</strong><br />
risk mapping. Spatial data should serve the needs of<br />
pre-disaster <strong>and</strong> post-disaster activities. The data<br />
listed below can either be static or dynamic in<br />
nature. Most of the elements of baseline data are<br />
static, as this data remains valid <strong>for</strong> a long time. Near<br />
real-time data, such as satellite images <strong>and</strong> thematic<br />
maps interpreted from satellite data, are considered<br />
as dynamic data as they provide in<strong>for</strong>mation on<br />
recent happenings.<br />
20<br />
Spatial data requirements differ depending on the<br />
need to address disasters in rural areas or in towns<br />
or cities. This document mainly focuses on spatial<br />
data requirements to target the needs of disaster<br />
risk mapping in rural areas, where the focus is on<br />
large scale areas rather than the more confined<br />
urban areas. Spatial data requirements <strong>for</strong> urban<br />
systems are not covered in this document.<br />
Spatial data requirements <strong>for</strong> risk mapping <strong>and</strong><br />
disaster management are described according to the<br />
following broad categories:<br />
�Baseline data layers<br />
�Utility <strong>and</strong> Infrastructure data layers<br />
�<strong>Disaster</strong> specific data layers<br />
�Thematic data on terrain <strong>and</strong> natural<br />
resources<br />
�Near-real time satellite data <strong>and</strong> thematic<br />
maps<br />
The discussion below provides a generic description<br />
of data layers under each category. The goal is not to<br />
provide an exhaustive listing of spatial data<br />
requirements, but to provide a listing of data layers<br />
needed to address the basic requirements <strong>for</strong><br />
disaster related risk mapping, together with the data<br />
that need to be used in conjunction with the spacebased<br />
in<strong>for</strong>mation.<br />
Data Description Relevance to disaster management<br />
Administrative units National, provincial/state, district<br />
boundaries, locations of towns<br />
<strong>and</strong> villages<br />
Demographic <strong>and</strong><br />
socio-economic data<br />
Includes the characteristics of<br />
human population <strong>and</strong> its<br />
distribution based on age, sex,<br />
ethnic groups, income, education<br />
etc.<br />
Amenities Rescue services including army,<br />
fire, police, medical services,<br />
evacuation locations such as<br />
schools/shelters, communication,<br />
gas stations etc.<br />
Table 1:<br />
Baseline spatial data <strong>for</strong> disaster management<br />
Data on administrative units <strong>and</strong> human<br />
settlement locations are a basic<br />
requirement. They are the base layer to<br />
which attribute data such as demography,<br />
socio-economic data <strong>and</strong><br />
amenities/services etc. are linked<br />
Demographic data provide detailed<br />
attributes (social <strong>and</strong> economic) of<br />
population at risk. The source of this<br />
in<strong>for</strong>mation is often provided by the<br />
statistical service of the country.<br />
In<strong>for</strong>mation on amenities helps to<br />
underst<strong>and</strong> available rescue services in<br />
the area at risk or affected areas which<br />
can be mobilized during a disaster.
Baseline data layers<br />
Baseline data serve as the reference data related to<br />
the permanent features of the l<strong>and</strong>scape such as<br />
administrative boundaries, human settlements,<br />
rivers, drainage, roads <strong>and</strong> basic infrastructure etc.<br />
Theme specific data layers are normally referenced<br />
to the baseline data layers. In the pre-disaster stage,<br />
baseline data should provide inputs to assess risks,<br />
including the identification of hazard prone areas/<br />
locations <strong>and</strong> vulnerabilities, <strong>and</strong> the preparation of<br />
plans <strong>for</strong> risk management, early warning, <strong>and</strong><br />
preparedness. During the response phase, baseline<br />
data should help to locate the areas affected by the<br />
hazard. Once such an area or location is known,<br />
baseline data, as shown in Table 1, should provide:<br />
an inventory of affected population; demography of<br />
affected population; socio-economic parameters;<br />
rescue services; <strong>and</strong> amenities available in <strong>and</strong><br />
around the location that can be mobilized during an<br />
emergency situation. (Table 1)<br />
Utility <strong>and</strong> Infrastructure data<br />
Utility <strong>and</strong> infrastructure data provide inputs to<br />
better underst<strong>and</strong> specific risks <strong>and</strong> also to prepare<br />
specific disaster management plans. Most of the<br />
infrastructure data is in network <strong>for</strong>m. Having<br />
infrastructure network data in GIS <strong>for</strong>mat allows<br />
network specific modelling such as optimal routing,<br />
allocation, flow models etc. (Table 2)<br />
Data Details Relevance to disaster management<br />
Transport network Entire transport network<br />
including roads <strong>and</strong> other modes<br />
of transportation<br />
Dams <strong>and</strong> canal<br />
network<br />
Locations of dams <strong>and</strong> canal<br />
networks with attributes on<br />
related risks<br />
Electricity network Transmission <strong>and</strong> distribution<br />
network<br />
Cadastral details Maps at cadastral level showing<br />
links with l<strong>and</strong> records<br />
Region specific<br />
utility network<br />
Gas pipelines, oil pipelines, canal<br />
network, bridges etc.<br />
Table 2: Utility <strong>and</strong> infrastructure data <strong>for</strong> risk mapping<br />
Data related to disaster risk reduction<br />
Often risk is expressed in the <strong>for</strong>m of hazard maps.<br />
Their preparation calls <strong>for</strong> the collection of risk<br />
related data, including data on major accident<br />
hazards, such as chemical, biological, <strong>and</strong> nuclear<br />
hazards, as well as transport accidents, climaterelated<br />
hazards. Normally such data needs to be<br />
collected by the local government. It is also<br />
important to have data on 'actors', or whoever<br />
supports particular activities.<br />
Updated transportation network provides analysis<br />
such as access to disaster affected area, evacuation<br />
routes etc.<br />
In<strong>for</strong>mation can be analyzed to underst<strong>and</strong> the<br />
population, natural resources <strong>and</strong> infrastructure risk<br />
due to potential dam overflows<br />
Electricity is one of the essential utilities <strong>for</strong> the<br />
continuation of the rescue ef<strong>for</strong>ts. Data on electricity<br />
networks is important input in disaster management<br />
plans at a local level.<br />
Cadastral mapping using high-resolution satellite data<br />
is common practice. Such data provides critical input<br />
to the humanitarian agencies <strong>and</strong> the Government <strong>for</strong><br />
determining loss of productive l<strong>and</strong> or l<strong>and</strong> owned by<br />
displaced families <strong>and</strong> <strong>for</strong> determining compensation<br />
<strong>for</strong> losses<br />
Data on utility <strong>and</strong> infrastructure helps to identify<br />
vulnerability associated with these critical facilities<br />
<strong>and</strong> services; <strong>and</strong> in planning the responses during a<br />
disaster.<br />
This data can be collected by the local administrators<br />
with the involvement of communities. It can include<br />
a list of NGOs, social groups, community groups <strong>and</strong><br />
others who are prepared to be active in a disaster<br />
situation. It can also include in<strong>for</strong>mation on the<br />
important services that can be mobilized in case a<br />
disaster strikes. This data needs to be location<br />
specific in order to be integrated with other spatial<br />
data.<br />
21
22<br />
Data Details Relevance to disaster management<br />
Elevation <strong>and</strong><br />
slope<br />
SRTM global elevation data at 90m<br />
resolution are available <strong>and</strong> generally<br />
useful <strong>for</strong> risk mapping. Medium<br />
resolution DEM at 30m resolution are<br />
available from ASTER. Highresolution<br />
DEMs can be obtained<br />
from high-resolution satellite <strong>and</strong><br />
aerial data or simply derived from<br />
contour maps. Slopes can be derived<br />
using elevation data.<br />
L<strong>and</strong> use Various levels of l<strong>and</strong> use maps are<br />
available based on the resolution of<br />
remote sensing images used <strong>for</strong> l<strong>and</strong><br />
use mapping. L<strong>and</strong> use depicts<br />
details about agriculture, <strong>for</strong>ests,<br />
wastel<strong>and</strong>s, barren l<strong>and</strong>s,<br />
settlements, water bodies etc.<br />
Forestry Forest types <strong>and</strong> additional attributes<br />
such as data on composition of<br />
<strong>for</strong>ests, biodiversity, biomass etc.<br />
Geology Rocks, minerals <strong>and</strong> geological<br />
features, faults, lineaments etc.<br />
Elevation is the most essential in<strong>for</strong>mation <strong>for</strong><br />
defining hazard zones <strong>and</strong> the utility of elevation data<br />
depends on its resolution or scale at which it is<br />
derived. For mitigation purposes, high resolution<br />
DEM can be obtained from other sources.<br />
A l<strong>and</strong> use map is a valuable input in assessing<br />
agricultural <strong>and</strong> other natural resources at stake in<br />
case of a disaster. It also provides inputs <strong>for</strong> scientific<br />
modelling <strong>for</strong> risk assessment <strong>and</strong> to identify riskmanagement<br />
measures.<br />
Forests are one of the important environmental<br />
parameters, especially in controlling flood, coastal<br />
process etc. Detailed <strong>for</strong>est maps can provide<br />
valuable inputs in risk assessment.<br />
These maps provide inputs <strong>for</strong> the assessment of a<br />
variety of hazards such as l<strong>and</strong>slides, earthquakes,<br />
<strong>and</strong> to some extent floods. Such maps are used <strong>for</strong><br />
preparedness planning. They also provide input <strong>for</strong><br />
mitigation <strong>for</strong> critical facilities.<br />
Soil Soil type, texture, depth etc. Soil maps can provide important input <strong>for</strong> deriving<br />
potential l<strong>and</strong>slides zones <strong>and</strong> other types of mass<br />
movements.<br />
River <strong>and</strong><br />
drainage<br />
network<br />
Water bodies, rivers, drainage<br />
network<br />
These maps are used to elaborate hazard maps<br />
related to floods, as well as during response <strong>and</strong> post<br />
disaster stages.<br />
Geomorphology L<strong>and</strong><strong>for</strong>ms In<strong>for</strong>mation on l<strong>and</strong><strong>for</strong>ms is useful in l<strong>and</strong>-use<br />
planning, soil conservation, design of dams, canals<br />
<strong>and</strong> other structures. It is also used to elaborate<br />
hazard maps related to l<strong>and</strong>slides <strong>and</strong> other types of<br />
mass movements.<br />
Watersheds Watersheds are derivatives of<br />
drainage <strong>and</strong> slope in<strong>for</strong>mation.<br />
Table 3: Thematic data on terrain <strong>and</strong> natural resources <strong>for</strong> risk mapping<br />
Watersheds are basic development unit in most<br />
countries. Sustainable development based on the<br />
concepts of watershed development contributes to<br />
disaster risk reduction.<br />
Thematic data on natural resources <strong>and</strong> terrain<br />
Satellite data, combined with topographical maps,<br />
provide an excellent source <strong>for</strong> preparing thematic<br />
maps related to terrain parameters <strong>and</strong> natural<br />
resources. Some data layers, such as l<strong>and</strong> use <strong>and</strong><br />
<strong>for</strong>ests, are dynamic in nature <strong>and</strong> need to be<br />
updated frequently, depending on the pace of<br />
development in the area. Data layers such as soils,<br />
geology, <strong>and</strong> hydro-geomorphology are static in<br />
nature <strong>and</strong> there<strong>for</strong>e remain valid <strong>for</strong> long periods of<br />
time. Thematic maps derived from satellite images<br />
are important scientific inputs <strong>for</strong> mapping a range<br />
of hazards including flood, erosion, l<strong>and</strong>slide, fire,<br />
storm, cyclones, drought. These data layers can be<br />
integrated with baseline data <strong>for</strong> predicting risks<br />
related to the natural <strong>and</strong> manmade disasters. (Table<br />
3)<br />
Near real-time satellite data <strong>for</strong> disaster<br />
management<br />
Near real-time coverage from satellite images helps<br />
to provide in<strong>for</strong>mation on the area impacted by the<br />
disaster. These maps should be able to be integrated<br />
with the spatial data layers described above. The use<br />
of the maps derived from satellite images is well<br />
demonstrated in mapping the impact of floods,<br />
earthquakes, l<strong>and</strong>slides, mudslides, cyclones <strong>and</strong><br />
droughts. Usefulness of in<strong>for</strong>mation depends upon<br />
the type of the disaster <strong>and</strong> the resolution of satellite<br />
data. Table 4 provides specific examples where near<br />
real-time satellite data can be used <strong>for</strong> early warning<br />
<strong>and</strong> risk management.
Tools, technologies <strong>and</strong> methods to improve<br />
the use of spatial data<br />
Spatial data, including space-based in<strong>for</strong>mation can<br />
be used <strong>for</strong> disaster management by adopting<br />
specific methods, tools <strong>and</strong> technologies. It is<br />
important <strong>for</strong> national governments to adopt spatial<br />
data infrastructure st<strong>and</strong>ards to improve data<br />
integration <strong>and</strong> data sharing. Tools such as web map<br />
servers can be used to deliver data to the end users.<br />
Spatial data infrastructure (SDI): Spatial data<br />
generation initiatives in a country should be based<br />
on an SDI framework to ensure that data generated<br />
by different agencies, programmes, <strong>and</strong>/or projects<br />
follows specific st<strong>and</strong>ards, to ensure easy data access<br />
<strong>and</strong> sharing.<br />
Enterprise GIS <strong>for</strong> local Governments: The<br />
enterprise GIS approach is capable of supporting all<br />
potential users from organizations within a country<br />
in a cohesive manner. The countries which already<br />
have good GIS infrastructure, NSDI, spatial databases<br />
<strong>and</strong> archives of images, should be encouraged to<br />
implement enterprise GIS <strong>and</strong> extend its node to<br />
their disaster management offices.<br />
Web mapping services: With better availability of<br />
internet speed, web map servers are considered as<br />
the most convenient tool <strong>for</strong> sharing maps <strong>and</strong><br />
space-based in<strong>for</strong>mation with users from different<br />
locations. Web Map Service Interface St<strong>and</strong>ard<br />
(WMS) provides a simple HTTP interface <strong>for</strong><br />
requesting geo-registered map images from one or<br />
more distributed geospatial databases.<br />
Purpose Details Relevance to <strong>Disaster</strong> management<br />
Mapping impact<br />
of disasters<br />
Vegetation<br />
monitoring<br />
Snow cap<br />
monitoring<br />
Space-based in<strong>for</strong>mation available with<br />
varying resolutions are sources <strong>for</strong> mapping<br />
the impact of disasters.<br />
MODIS, SPOT (Vegetation 2 sensor), IRS-<br />
WIFS provide dynamic in<strong>for</strong>mation on NDVI<br />
which is helpful to assess crop extent <strong>and</strong><br />
condition.<br />
In<strong>for</strong>mation can be derived on crop types<br />
(cereals, orchards, cash crops etc.), type of<br />
agriculture (irrigated, rain fed etc.), cropping<br />
intensity, crop vigour <strong>and</strong> health.<br />
Number of satellites (eg MODIS) have high<br />
revisit frequency <strong>and</strong> provide extensive<br />
coverage to monitor snow cover.<br />
Table 4: Utility of near real time satellite data <strong>for</strong> disaster management<br />
Satellite images can potentially provide the<br />
earliest in<strong>for</strong>mation about the impact of<br />
disasters <strong>and</strong> provide required inputs to<br />
planning responses.<br />
Agricultural maps provide many parameters<br />
that can be used to underst<strong>and</strong> the impact of<br />
disasters such as droughts <strong>and</strong> floods. They<br />
provide data <strong>for</strong> a precise assessment of<br />
damage to crops <strong>and</strong> related financial loss in<br />
areas impacted by the disaster.<br />
NDVI in<strong>for</strong>mation provides inputs <strong>for</strong><br />
preparedness planning at a national scale.<br />
In mountainous countries, the amount of<br />
snowfall determines whether the country could<br />
be facing drought or floods.<br />
23
The Benefit of High Resolution<br />
Aerial Imagery <strong>for</strong> Topographic<br />
Mapping <strong>and</strong> <strong>Disaster</strong> Recovery:<br />
Lessons Learnt from the 2004<br />
Indonesian Tsunami<br />
TIntroduction<br />
Richard A Kidd*, Ian McCallum**, M. Yakob<br />
Ishadamy***<br />
* Geospatial Consultant, Cairo, Egypt,<br />
richard.a.kidd@gmail.com<br />
**International Institute <strong>for</strong> Applied Systems Analysis (IIASA),<br />
Laxenburg, Austria, +43 2236 807-328, mccallum@iiasa.ac.at<br />
***Governor Advisor of <strong>Management</strong> In<strong>for</strong>mation Systems<br />
(MIS), Office of the Governor of Aceh, B<strong>and</strong>a Aceh, Indonesia,<br />
yakob@indo.net.idg<br />
This research outlines a case study in Aceh,<br />
Indonesia, in the aftermath of the December 2004<br />
Indian Ocean Tsunami. The main aim of the study<br />
was to identify methods to determine <strong>and</strong><br />
quantifiably assess the benefit of the use of a specific<br />
spatial data set in disaster recovery, <strong>and</strong> it follows on<br />
from an earlier study implemented in 2007.<br />
The earthquake <strong>and</strong> subsequent Tsunami devastated<br />
wide areas <strong>and</strong> hundreds of communities across<br />
Aceh. The available topographic data (i.e. relief <strong>and</strong><br />
the spatial location of man-made <strong>and</strong> natural<br />
features) was approximately 30 years old <strong>and</strong><br />
contained significant errors. Immediately after the<br />
Tsunami there was a large dem<strong>and</strong> <strong>for</strong> new<br />
topographic <strong>and</strong> spatial data to support the<br />
rehabilitation <strong>and</strong> reconstruction activities,<br />
including; the needs of the national Government<br />
Figure 1: One use of the high resolution aerial imagery was to correctly reference spatial<br />
plans <strong>for</strong> the reconstruction of villages devastated by the Tsunami. Plans <strong>for</strong> the<br />
reconstruction of the village of Cot Paya are shown.<br />
25
master plan <strong>for</strong> reconstruction, the Spatial planning The results of a detailed data user survey implemen-<br />
needs of local Government, town <strong>and</strong> village action ted two years after the Tsunami are also presented.<br />
plans, community based mapping, village develop- They clearly demonstrate the need <strong>and</strong> the benefit of<br />
ment mapping, infrastructure services, <strong>and</strong> disaster, the use of this data <strong>for</strong> disaster recovery, showing<br />
hazard <strong>and</strong> risk mapping.<br />
that this data set critically supported projects worth<br />
28 million Euro <strong>and</strong> provided further support to<br />
During 2005, the Government of Indonesia (GoI), in projects worth over 880 million Euro. A simple<br />
conjunction with a number of Official Development robust methodology quantifying the benefit of the<br />
Agencies (ODA's), initiated at least 10 projects <strong>for</strong> the use of spatial data in disaster recovery is also pre-<br />
capture of spatial data <strong>and</strong> the provision of updated sented. The methodology provides a monitoring<br />
topographic data <strong>and</strong> products to the rehabilitation mechanism by which the benefit of using the spatial<br />
<strong>and</strong> reconstruction community. This case study data can be quantified, verified <strong>and</strong> accounted to<br />
focuses on the benefit derived from a dataset of high either donor or user communities.<br />
resolution (25 cm) digital aerial imagery (orthophotos)<br />
acquired across the Tsunami affected areas<br />
in Aceh.<br />
Finally, to ensure that any spatial data acquisition<br />
campaign undertaken with humanitarian funding is<br />
used to its greatest benefit, a number of recommendations<br />
detailing mechanisms that must be in place<br />
prior to initiation of the campaign are presented.<br />
26<br />
Figure 2: (a) Location <strong>and</strong> extent of orthophotos <strong>and</strong> digital terrain model, <strong>and</strong><br />
(b) example of orthophoto <strong>and</strong> contour lines, extracted from DTM, showing temporary shelters in Calang (East Coast Aceh)<br />
Overview of NORAD Campaign <strong>and</strong> data set<br />
The Norwegian Agency <strong>for</strong> International<br />
Development (NORAD) funded the orthophoto<br />
project, at a cost of 1.43 M Euro, in March 2005. The<br />
Indonesian National Coordinating Agency <strong>for</strong><br />
Surveys <strong>and</strong> Mapping (Bakosurtanal) managed the<br />
project <strong>and</strong> made all products available to the<br />
recovery community. The products included a digital<br />
terrain model (DTM), <strong>and</strong> digital orthophotos<br />
merged into a digital base map with line mapping at<br />
1:10,000 <strong>and</strong> 1:5,000 map scales. The extent of the<br />
data set, totalling 6,249 km2 across the Tsunami<br />
affected coastal areas, is shown in Figure 2.
Delays, due to security clearance <strong>and</strong> permission to<br />
fly, meant the flight campaign was only completed in<br />
July 2005. All final products were completed <strong>and</strong><br />
delivered to Bakosurtanal in April 2006. With the<br />
exception of the DTM, Bakosurtanal provided all<br />
products in August 2006 to the Spatial In<strong>for</strong>mation &<br />
Mapping Centre, (SIM-Centre) of the GoI Agency <strong>for</strong><br />
Rehabilitation <strong>and</strong> Reconstruction of NAD <strong>and</strong> NIAS<br />
(BRR), <strong>for</strong> distribution to the aid <strong>and</strong> recovery<br />
community (users).<br />
The data set was distributed in three ways, either;<br />
(case 1) directly as an electronic data set to users;<br />
(case 2) provided as a customised product; or (case<br />
3) enabled <strong>for</strong> users electronically via web<br />
applications. Primary data users (case 1) were given<br />
digital (soft) copies of the data set <strong>and</strong> were bound<br />
by a signed data user agreement. During the period<br />
August 2006 to July 2008 there was a total of 99<br />
recorded primary data users <strong>and</strong> over 635<br />
secondary data users (cases 2 <strong>and</strong> 3). The data set<br />
was also used as a core data in Geographic<br />
In<strong>for</strong>mation System (GIS) training provided to at<br />
least 500 local government officials.<br />
Example case studies on data use<br />
To justify their requirement <strong>for</strong> the use of the data<br />
set, all primary data users were obliged to provide<br />
project details, which were confirmed with an<br />
independent project registration maintained within<br />
the Recovery Aceh Nias Database (RAND) of the BRR.<br />
The requests <strong>for</strong> the data set, as is shown in Figure<br />
2a, covered the spectrum of all agencies within the<br />
recovery <strong>and</strong> rehabilitation community. Examples of<br />
data usage are presented in the following section.<br />
Asian Development Bank (ADB)<br />
The Earthquake <strong>and</strong> Tsunami Emergency Support<br />
Project (ETESP) of the ADB used the data set in four<br />
of their projects. The data was used to support their<br />
Spatial Planning <strong>and</strong> Environmental <strong>Management</strong><br />
project, Agriculture Sector, Fisheries Sector <strong>and</strong> Road<br />
<strong>and</strong> Bridges project. Specifically the projects<br />
oversaw the preparation of sub-district level Action<br />
Plans; the rehabilitation <strong>and</strong> reconstruction of<br />
livelihoods assets post Tsunami in both agriculture<br />
<strong>and</strong> fisheries sectors; support to fisheries<br />
rehabilitation in Aceh <strong>and</strong> Nias <strong>and</strong> the creation of<br />
the design <strong>and</strong> project preparation documents <strong>for</strong><br />
road segments within B<strong>and</strong>a Aceh <strong>and</strong> on the East<br />
coast. The four projects had over 125,000 direct<br />
beneficiaries <strong>and</strong> cost a total of over 79 Million Euro.<br />
The data set was used to some extent, in all five<br />
phases of each project's lifecycle (i.e. project<br />
initiation, planning, operation, monitoring <strong>and</strong><br />
evaluation <strong>and</strong> project closure), but was most<br />
significantly used in the operational phase of the<br />
projects. Over 85 maps were created within the<br />
projects from the case study data set <strong>and</strong> GIS data<br />
sets provided.<br />
United Nations Development Programme<br />
(UNDP)<br />
The UNDP through its Tsunami Recovery Waste<br />
<strong>Management</strong> Programme (TRWMP) began the<br />
program <strong>for</strong> Agriculture l<strong>and</strong> clearances in January<br />
2006.It removed the heavy deposits of s<strong>and</strong>, silt <strong>and</strong><br />
debris blanketing the l<strong>and</strong>, <strong>and</strong> blocking the<br />
irrigation channels <strong>and</strong> drains. The program cost<br />
over 1.5 million Euro <strong>and</strong> supported 2600 families as<br />
direct beneficiaries. The TRWMP used numerous<br />
spatial data sets, including the orthophoto data set,<br />
to locate areas in greatest need of l<strong>and</strong> clearance,<br />
<strong>and</strong> to work with farmers <strong>and</strong> community leaders to<br />
demark field boundaries, canals <strong>and</strong> drains.<br />
The orthophoto data set was used as a primary<br />
mapping tool to determine areas <strong>and</strong> potential<br />
volumes of waste that required removal <strong>and</strong> to<br />
prepare clearance plans. This in<strong>for</strong>mation was<br />
critical <strong>for</strong> preparation of heavy equipment contracts<br />
required <strong>for</strong> l<strong>and</strong> clearance. The data set was<br />
critically used <strong>for</strong> project planning, operation <strong>and</strong><br />
monitoring <strong>and</strong> evaluation <strong>and</strong> is estimated that it<br />
would cost approximately 200,000 Euro to obtain<br />
the same in<strong>for</strong>mation from different sources.<br />
Data user survey<br />
To asses the benefit of the orthophoto data, a data<br />
user survey was undertaken in Aceh, during 2008.<br />
The survey, delivered as a questionnaire, was<br />
distributed to all primary data users. To encourage a<br />
high response rate, the survey was intentionally<br />
simple <strong>and</strong> brief. It was designed to retrieve<br />
in<strong>for</strong>mation to determine answers to the following<br />
study questions:<br />
�Which category of organisation were the<br />
main users of the data set?<br />
�What type of project required the data set<br />
<strong>and</strong> how was it used?<br />
�At which phase of the project life cycle was<br />
the data set most significant?<br />
�What was the benefit of using the data set?<br />
�What were the problems with the data set?<br />
27
One of four outcomes were expected from each<br />
questionnaire; 1) no response; 2) data set was<br />
acquired by user but not used in project; 3) data set<br />
was acquired <strong>and</strong> used but its use was not critical to<br />
the successful completion or operation of the project<br />
(supported the project); 4) data set was acquired<br />
<strong>and</strong> used <strong>and</strong> its use was critical to the successful<br />
completion or operation of the project. Follow up<br />
with all primary data users ensured a relatively high<br />
questionnaire response rate (48%).<br />
Two methods were identified to provide a simple<br />
means of quantifying the benefit of the use of the<br />
data set. The first method uses a project attribute as<br />
an indicator of the measure of the overall benefit of<br />
the project <strong>and</strong> also determines if the use of the case<br />
study data was critical to the successful completion<br />
of the project. The second method considers what<br />
in<strong>for</strong>mation was obtained by using the data set <strong>and</strong><br />
determines the real cost to acquiring that<br />
in<strong>for</strong>mation from another source. This real cost was<br />
only calculated where the use of the data set was<br />
deemed to be critical to the successful completion or<br />
operation of the project.<br />
28<br />
Figure 3: (left) Orthophoto data requests <strong>and</strong> (right)<br />
data users by Agency Type including; Government<br />
of Indonesia (GOI); Non Governmental<br />
Organisations (NGO); United Nations (UN); <strong>and</strong><br />
International Organisations (IO)<br />
Percent Usage<br />
(%)<br />
Relative<br />
Importance<br />
(1-high to 5-low)<br />
Results of data user survey<br />
As shown in Figure 3 (right), NGO's were the most<br />
significant data users. Using the st<strong>and</strong>ardised DAC5<br />
coding (Development Assistance Committee Coding<br />
Scheme 5) to categorise project type, the data, as<br />
shown in Figure 4a, was mainly used <strong>for</strong> Urban <strong>and</strong><br />
Rural planning purposes (52%).<br />
In all projects the data was used largely <strong>for</strong> mapping,<br />
surveying or identification of features relevant to<br />
each of the projects; 95% of the respondents claimed<br />
to use the case study data over 300 times to produce<br />
maps, <strong>and</strong> a further 65% claimed to integrate the<br />
case study data within a GIS.<br />
The majority of projects used the data in the<br />
planning <strong>and</strong> operational phases of the project,<br />
noting that the data was considered to be of most<br />
importance during these project phases (see Table 1)<br />
The main concern highlighted by the primary users<br />
was that the data was not available <strong>for</strong> the project<br />
planning phase of projects starting be<strong>for</strong>e August<br />
2006. Considering the rapid developments in<br />
rehabilitation <strong>and</strong> reconstruction in the Tsunami<br />
affected areas, the data, acquired in June 2005, was<br />
largely outdated by the time it was delivered to the<br />
rehabilitation <strong>and</strong> reconstruction community.<br />
Project Phase<br />
Initiation Planning Operation Monitoring &<br />
Evaluation<br />
Closure<br />
74 92 87 70 78<br />
3.1 1.6 1.3 2.5 3.1<br />
Table 1: Use <strong>and</strong> importance of data in project phases (1 important, 5 not important)
Determination of the benefit of use of<br />
orthophoto data<br />
Calculated by project attribute<br />
Four project attributes were identified as potential<br />
indicators of project benefit; 1) number of direct<br />
project beneficiaries (i.e. number of families, or<br />
number of persons, that would receive a direct<br />
improvement in their current situation as a result of<br />
the completion of the project); 2) physical extent <strong>and</strong><br />
coverage of the project area; 3) in<strong>for</strong>mation on the<br />
total cost of the project, <strong>and</strong>; 4) in<strong>for</strong>mation on the<br />
duration of the project.<br />
The most incomplete <strong>and</strong> overestimated attribute<br />
was project beneficiary, with only 39% of primary<br />
users being able to provide a figure; several wildly<br />
1<br />
claiming their project benefited all the 4,031,589<br />
residents in the province of Aceh, or all of the<br />
estimated 203,998 people who were directly affected<br />
by the Tsunami. A similar response was found <strong>for</strong> the<br />
attribute concerning the physical extent of the<br />
project. The attribute <strong>for</strong> duration of project was the<br />
most comprehensibly reported upon by 91% of<br />
respondents. This attribute was initially included to<br />
ascertain if longer running projects had a greater<br />
benefit, or if there was a direct link between project<br />
duration <strong>and</strong> project cost.<br />
Finally, the attribute of project cost was selected to<br />
measure the benefit of the use of the data set as this<br />
attribute was widely reported by the respondents<br />
(87%), <strong>and</strong> could be independently confirmed by<br />
cross checking with the RAND of the BRR. When the<br />
use of the data set was deemed critical to the<br />
completion or operation of the project, then the<br />
benefit of the use of the data set was measured as<br />
the total cost of the project, Figure 4b.<br />
1: Badan Pusat Statistik (Statistics Indonesia) BPS, Sensus Penduduk<br />
Aceh Nias (Census of Residents of Aceh <strong>and</strong> Nias) SPAN 2005<br />
Figure 4: (a) Data Usage <strong>and</strong> (b) Benefit of Data Set compared to Data Set Costs<br />
Calculated by cost of equivalent in<strong>for</strong>mation from a<br />
different source<br />
If the data set was seen to be critical to the<br />
completion or operation of the project, the primary<br />
users were also asked to provide an estimated cost of<br />
retrieving the same in<strong>for</strong>mation from another<br />
source. All cost estimations were independently<br />
verified, considering local conditions, cost <strong>and</strong><br />
availability of other sources of in<strong>for</strong>mation. The total<br />
cost to provide the same in<strong>for</strong>mation as obtained<br />
from the data set was estimated to be 3.46 Million<br />
Euro. Since primary users failed to accurately report<br />
their project extent, it is not possible to make a<br />
direct area based comparison of obtaining the<br />
equivalent in<strong>for</strong>mation, <strong>and</strong> there<strong>for</strong>e cannot be<br />
compared directly to the 1.43 Million Euro cost of<br />
the orthophoto project.<br />
Conclusions<br />
This study quantified the benefit of using the case<br />
study data set by determining if the use of the data<br />
set was critical to the successful completion of a<br />
project, <strong>and</strong> then using the attribute of project cost<br />
as a measure of its benefit. The data set critically<br />
supported projects worth over 16 times its actual<br />
cost <strong>and</strong> supported projects worth over 600 times its<br />
actual cost. Over 635 further secondary users of the<br />
data set were also clearly identified. The delayed<br />
delivery of the case study data set to the recovery<br />
community meant that the data could not be used <strong>for</strong><br />
sectors of reconstruction projects that had an urgent<br />
<strong>and</strong> timely need <strong>for</strong> completion.<br />
29
In order to determine <strong>and</strong> report upon the benefit of<br />
the use of spatial data in disaster recovery, the<br />
following recommendations are offered:<br />
�A robust, straight<strong>for</strong>ward procedure must<br />
be in place with the data distributor that<br />
records simple criteria <strong>for</strong> each of the data<br />
users <strong>and</strong> related projects;<br />
�Updating of project in<strong>for</strong>mation on a regular<br />
but limited basis must be en<strong>for</strong>ced, <strong>and</strong><br />
easily verifiable;<br />
�Wherever possible, international st<strong>and</strong>ards<br />
such as the use of DAC5 code <strong>for</strong> project<br />
categorisation, should be included in the<br />
methodology<br />
Whilst this report clearly shows that there is a need<br />
<strong>for</strong> the acquisition of EO data <strong>and</strong> the creation of<br />
spatial data in response to a disaster, a number of<br />
lessons have been learnt from the spatial data<br />
initiatives between ODA's <strong>and</strong> the GoI in response to<br />
the Tsunami in Aceh.<br />
To ensure that the spatial data is used to its greatest<br />
benefit, it is specifically recommended that any<br />
spatial data campaign undertaken with<br />
humanitarian funding, must also ensure the<br />
following:<br />
�A mechanism must be in place to ensure<br />
data is efficiently <strong>and</strong> effectively delivered to the<br />
humanitarian aid community in a timely manner;<br />
�The mechanism must be open <strong>and</strong><br />
accountable to data providers, donors <strong>and</strong> the<br />
recovery community;<br />
�The humanitarian aid <strong>and</strong> recovery<br />
community must have knowledge about the<br />
availability of the data;<br />
30<br />
�To avoid duplication of costs, the spatial<br />
data must be freely accessible, (i.e. no cost,<br />
or data reproduction costs only), <strong>and</strong> with<br />
an unrestrictive license<br />
Acknowledgements<br />
The authors appreciate the assistance of the SIM-<br />
Centre, BRR, in compiling the data <strong>for</strong> this report,<br />
along with participants of the data user survey, <strong>and</strong><br />
specifically ADB-ETESP, GTZ, BGR ManGEONAD, <strong>and</strong><br />
UNDP- TRWMP. The FP6 Project Geobene (www.geobene.eu<br />
No. 037063) <strong>and</strong> the FP7 Project EuroGEOSS<br />
(www.eurogeoss.eu No. 226487) provided support.
Earthquake damage assessment<br />
using remote sensing imagery.<br />
The Haiti case study.<br />
AIntroduction<br />
1 2<br />
Andrea Ajmar , Piero Boccardo ,<br />
1 3<br />
Fabio Giulio Tonolo <strong>and</strong> Carlos Veloso<br />
1:ITHACA, Via P.C. Boggio, 61 10138 Torino - Italy<br />
2: Politecnico di Torino DITAG, C.so Duca degli Abruzzi, 24<br />
10129 Torino Italy<br />
3: UN WFP, Via C.G.Viola 68 - Parco dei Medici - 00148 -<br />
Rome - Italy<br />
At 16:53 local time (21:53 UTC) on Tuesday, 12<br />
January 2010 a devastating magnitude 7.0Mw<br />
earthquake occurred in Haiti. The epicentre was<br />
approximately 25 km (16 miles) west of Port-au-<br />
Prince, Haiti's capital, near Léogâne. The Haitian<br />
Government reports that between 217,000 <strong>and</strong><br />
230,000 people have died, an estimated 300,000<br />
were injured, <strong>and</strong> an estimated 1,000,000 made<br />
homeless. Post <strong>Disaster</strong> Needs Assessment (PDNA)<br />
findings reveal that the total value of damage <strong>and</strong><br />
losses is estimated at US$7.8 billion: US$4.3 billion<br />
represents physical damage <strong>and</strong> US$3.5 billion are<br />
economic losses (OCHA SitRep No.31).<br />
Damage to infrastructure in the 2010 Haiti<br />
earthquake was extensive: the main affected areas<br />
(Figure 1) included Port-au-Prince, Petit-Goâve,<br />
Léogâne, Jacmel <strong>and</strong> other settlements in southwest<br />
part of Haiti.<br />
As of February, an estimated 250,000 residences <strong>and</strong><br />
30,000 commercial buildings had collapsed or were<br />
severely damaged.<br />
Photo by “WFP/Marcus Prior/Haiti”<br />
1<br />
31
32<br />
This paper is mainly focused on the damage<br />
assessment activities per<strong>for</strong>med during the first days<br />
after the event <strong>and</strong> based on satellite <strong>and</strong> high<br />
resolution aerial imagery. The aim is to show best<br />
practice of operational tools <strong>and</strong> geomatics<br />
techniques that can be used to provide effective<br />
in<strong>for</strong>mation to the humanitarian organization in the<br />
field.<br />
Post earthquake damage assessment<br />
As clearly highlighted in the <strong>Disaster</strong> <strong>Risk</strong><br />
<strong>Management</strong> Cycle the Emergency Response stage is<br />
generally composed of different initiatives, such as<br />
the Search <strong>and</strong> Rescue (SAR) operations, the reestablishment<br />
of the main logistic routes, the<br />
management, coordination <strong>and</strong> sharing of<br />
in<strong>for</strong>mation, the provision of humanitarian<br />
assistance <strong>and</strong> the initial damage <strong>and</strong> need<br />
assessment. The focus of the activities described<br />
Figure 1: Map showing the potentially affected areas by the Haiti earthquake (Source: WFP, 15.01.2001)<br />
in this paper is to provide an initial damage<br />
assessment to support the provision of humanitarian<br />
assistance, <strong>and</strong> hence they are not aimed at helping<br />
the SAR team. Furthermore, the typical time<br />
constrains of this stage do not allow to produce a<br />
Detailed Damage Assessment, which is generally<br />
per<strong>for</strong>med in the Recovery stage in the framework of<br />
the PDNA related tasks.<br />
UN WFP needs<br />
It is crucial to thoroughly underst<strong>and</strong> the needs of<br />
the end users of outputs being derived from the<br />
Initial Damage Assessment, both to provide products<br />
<strong>and</strong> services as effectively as possible, <strong>and</strong> to<br />
optimize the allocation of resources according to the<br />
time constraints. The main end user of the produced<br />
georeferenced data that will be described in the<br />
following paragraph is the United Nations World<br />
Food Programme (UN WFP), the largest UN agency<br />
in charge of assisting affected areas, vulnerable<br />
populations with a variety of feeding programmes, as<br />
well as food-<strong>for</strong>-work programmes. WFP <strong>and</strong><br />
partners have delivered food to over 1.2 million<br />
people (over 200,000 families) in the greater Portau-Prince<br />
area as part of a targeted food distribution<br />
which reached 3 million people in February (OCHA<br />
SitRep No.30). There<strong>for</strong>e WFP was most interested<br />
in having in<strong>for</strong>mation on:<br />
�the location of the most affected areas (by<br />
means of analyzing the pattern of collapsed<br />
buildings) <strong>and</strong> specifically the areas with<br />
spontaneously gathering camps;<br />
�road accessibility, highlighting the presence<br />
of impassable <strong>and</strong> restricted roads, which<br />
are crucial <strong>for</strong> correctly plan the logistic of<br />
the food distribution plans.
Available remotely sensed data<br />
Timely triggering <strong>and</strong> absence of cloud cover<br />
allowed GeoEye-1 satellite to collect colour, highresolution<br />
imagery (resampled to 50cm <strong>for</strong><br />
commercial users) over Port-au-Prince within a few<br />
hours (Figure 2). Specifically on January 13,<br />
beginning at 10:27 a.m. EST, from 423 miles in space,<br />
GeoEye-1 collected almost 3,000 square kilometres<br />
of imagery. On January 16, GeoEye-1 was again in an<br />
orbit over Haiti, <strong>and</strong> collected stereo imagery over<br />
Port-au-Prince. Google made the imagery<br />
immediately accessible to everyone, overcoming<br />
licensing issues that may interfere with the needs of<br />
rapid disaster response. A few days later (17 January<br />
2010) Google arranged <strong>for</strong> a collection of imagery<br />
over the Port-au-Prince area at approximately 15cm<br />
resolution to complement the existing imagery,<br />
making it again available <strong>for</strong> download by everyone.<br />
The immediate dissemination of the data through<br />
Google, by means of direct download or by making<br />
them available as base layers in Google Earth/Map,<br />
was indeed a crucial turning point. Several OGC<br />
compliant Web Services were later arranged to allow<br />
GIS specialists to work in their preferred GIS<br />
environment, avoiding time consuming download<br />
procedures.<br />
The eager ef<strong>for</strong>ts of the satellite/aerial data<br />
providers, space agencies <strong>and</strong> funding agencies<br />
enabled rapid coverage of the whole country with<br />
optical <strong>and</strong> radar data: among others, the main data<br />
acquisition initiatives were per<strong>for</strong>med by<br />
DigitalGlobe (optical satellite data, Figure 3) <strong>and</strong><br />
World Bank-ImageCat-RIT (aerial imagery, including<br />
thermal <strong>and</strong> lidar acquisitions).<br />
Figure 2: Detail of first post-earthquake GeoEye<br />
satellite acquisition (50 cm) over Port-au-Prince.<br />
Jan, 13th 2010 (Courtesy of GeoEye)<br />
Extraction of features of interest<br />
Remote sensing technology is increasingly<br />
recognized as a valuable post-earthquake damage<br />
assessment tool. As highlighted in the previous<br />
paragraphs, it is necessary to have a clear<br />
underst<strong>and</strong>ing of the end user needs in order to<br />
identify which in<strong>for</strong>mation has to be extracted. For<br />
the Haiti response WFP asked as a priority to<br />
identify:<br />
�not accessible or restricted roads, allowing<br />
to evaluate the road network accessibility;<br />
�spontaneous gathering camps;<br />
�collapsed <strong>and</strong> damaged buildings;<br />
�l<strong>and</strong>slides triggered by the earthquake,<br />
possibly affecting the logistic network.<br />
Figure 3: Coverage of the DigitalGlobe constellation as of Jan,<br />
18th 2010 (Source: DigitalGlobe)<br />
Taking into account that the huge amount of high<br />
resolution data (covering an extensive area) had to<br />
be interpreted under harsh time constraints <strong>and</strong> that<br />
procedures to fully <strong>and</strong> rapidly automatically<br />
interpret images do not yet exist (from a postearthquake<br />
damage assessment point of view), the<br />
mapping of the features of interest required manual<br />
interpretation involving a large crew of volunteers.<br />
The analysis was mainly based on a multi-temporal<br />
comparison (with respect to pre-event imagery) of<br />
the available satellite data (50 cm) <strong>and</strong> later updated<br />
by means of photo-interpretation of Google high<br />
resolution aerial imagery (15 cm). Figure 4 shows<br />
examples <strong>for</strong> each feature of interest<br />
33
Good management <strong>and</strong> effective coordination of<br />
large crews comprising individuals from a variety of<br />
knowledge backgrounds was a hard task, with the<br />
main aim to avoid an intolerable waste of time if the<br />
interpretation of the same area were done twice. The<br />
adopted approach was to grid the area covered by<br />
the satellite imagery <strong>and</strong> to assign each grid cell to<br />
single volunteers (figure 5). This simple but effective<br />
procedure requires a big ef<strong>for</strong>t in the last stage of the<br />
workflow involving integration of all the analysis<br />
outputs <strong>and</strong> to create a homogeneous <strong>and</strong><br />
harmonized database (figure 6). There<strong>for</strong>e simple<br />
<strong>and</strong> st<strong>and</strong>ard rules <strong>for</strong> the image interpretation were<br />
provided, to minimize inconsistencies in extracting<br />
in<strong>for</strong>mation from all different operators.<br />
Outputs <strong>and</strong> dissemination<br />
Typical outputs are in <strong>for</strong>m of cartographic products<br />
based on the availability of a Spatial Data<br />
Infrastructure (SDI) such as the WFP-SDI. Since one<br />
of the requirements of the WFP-SDI is to provide a<br />
worldwide coverage, the reference layers are<br />
typically medium/low map scale datasets, which<br />
usually fit the needs of disasters such as floods or<br />
cyclones. Earthquake damage assessment obviously<br />
needs large or very large maps scale datasets<br />
(especially when displaying buildings <strong>and</strong> road<br />
networks) to act as a backdrop to the damage<br />
assessment maps. The availability of this kind of<br />
reference dataset is generally critical in developing<br />
countries such as Haiti. This demonstrates the<br />
importance of participatory mapping through media<br />
such as OpenStreetMap or Google Map Maker. The<br />
participatory approach allowed mapping large parts<br />
of Haiti within a few days (Figure 7), albeit on the<br />
basis of 'any in<strong>for</strong>mation is better than no<br />
in<strong>for</strong>mation', since accuracy was not the highest<br />
34<br />
Figure 4: Example (Source: Google 2010) of photo-interpretation of the features of interest:<br />
a) not accessible road b) spontaneous camp c) collapsed buildings d) l<strong>and</strong>slide
priority. The updated large scale reference layers<br />
were uploaded into the SDI reference datasets,<br />
allowing the creation of raster maps based on<br />
customized templates (figure 8).<br />
The dissemination process was based on typical<br />
Figure 5: Coordination Grid (red lines) over the area of<br />
interest (green polygon show analyzed cells)<br />
Figure 6: Example of damage assessment in the central<br />
area of Port-au-Prince<br />
methods of data dissemination, including: delivery<br />
as an attachment to e-mails to a pre-defined mailing<br />
list; inclusion into web pages, where a search engine<br />
would help in identifying the searched product; <strong>and</strong><br />
delivery to specific GeoRSS portals. The focus was on<br />
emergency management <strong>and</strong> a large circulation.<br />
Because of the impact of the Haiti earthquake <strong>and</strong><br />
the number of GIS specialist asking <strong>for</strong> raw data, an<br />
ad-hoc web application was specifically designed<br />
<strong>and</strong> implemented, allowing to display <strong>and</strong> query the<br />
available datasets <strong>and</strong> also to edit specific features of<br />
interest (Figure 9).<br />
User feedback<br />
In an emergency, WFP needs in<strong>for</strong>mation more than<br />
almost anything else, to be able to respond quickly<br />
<strong>and</strong> effectively <strong>and</strong> to plan the next phase of its<br />
operation. The mapping products provided by<br />
ITHACA in the emergency response phase were very<br />
visual <strong>and</strong> easy <strong>for</strong> staff without a GIS background to<br />
use. They gave a very clear picture to both field staff<br />
<strong>and</strong> decision makers at WFP headquarters. WFP's<br />
logistics teams used the maps to know where they<br />
could open access routes, where warehouses could<br />
be erected, where hospitals were located so that <strong>for</strong><br />
example, injured people <strong>and</strong> their families could be<br />
helped. The maps told WFP staff where spontaneous<br />
camps <strong>for</strong> displaced people were springing up <strong>and</strong><br />
where roads were passable to reach them.<br />
Distribution sites could then be set up as closely as<br />
possible so that as many vulnerable people as<br />
possible could be reached. When security during<br />
food distributions became a concern, WFP staff could<br />
find alternative routes by inspecting the maps, thus<br />
allowing them to get their job done as safely as<br />
possible in a very complex <strong>and</strong> challenging<br />
environment.<br />
Figure 7: OpenStreetMap coverage over Port-au-<br />
Prince be<strong>for</strong>e the earthquake (top), as of February<br />
15th (centre) <strong>and</strong> February, 26th (bottom)<br />
35
After quickly producing Rapid Impact Analysis maps<br />
<strong>for</strong> the capital, Port-au-Prince, the focus turned to<br />
badly damaged outlying towns such as Jacmel <strong>and</strong><br />
Leogane the epicentre where 90% of buildings were<br />
destroyed. This helped target where help was<br />
especially needed. Then a picture was created of the<br />
entire country so that access to rural areas could be<br />
assessed. Damaged <strong>and</strong> destroyed bridges were<br />
identified alongside areas where there had been<br />
l<strong>and</strong>slides, so that aid could be moved into the<br />
countryside. This was especially important as people<br />
heeded the Haitian government's request to leave<br />
the capital if they had somewhere else to go. It is<br />
very valuable <strong>for</strong> WFP to have this broader picture<br />
when it needs to think ahead <strong>and</strong> plan not only how<br />
to help people directly hit by the earthquake, but<br />
also to help communities which could otherwise<br />
become overwhelmed. WFP's specialist programme<br />
officers can decide which is the best intervention<br />
strategy food <strong>for</strong> work or assets, cash vouchers <strong>for</strong><br />
food, school meals, or a general food distribution.<br />
In Haiti operational mapping developed with a level<br />
of detail not seen be<strong>for</strong>e within WFP <strong>and</strong> other<br />
humanitarian agencies. WFP has become known <strong>for</strong><br />
the work it is doing in this field with the help of<br />
specialist partners such as ITHACA. Its maps<br />
regularly become the operational st<strong>and</strong>ard in<br />
emergencies <strong>and</strong> WFP makes sure to disseminate<br />
them as widely as possible to a fast-growing<br />
audience.<br />
36<br />
Figure 8:<br />
Example of<br />
cartographic<br />
product showing<br />
the output of the<br />
damage<br />
assessment<br />
analysis<br />
Figure 9: Web<br />
application<br />
devoted to data<br />
querying,<br />
displaying <strong>and</strong><br />
editing
Discussion <strong>and</strong> conclusions<br />
The Haiti earthquake clearly demonstrated that<br />
optical remote sensing is a valuable post-earthquake<br />
damage assessment tool <strong>and</strong> that satellite/aerial<br />
data providers have the capabilities to timely trigger<br />
image acquisition <strong>and</strong> to make available the data to<br />
the humanitarian community. But it also<br />
demonstrated that above all the establishment of<br />
good coordination bodies equipped with proper<br />
supporting tools is crucial.<br />
But if unhappily, persistent clouds had covered the<br />
affected areas on the days after the event, all the<br />
optical data would have been useless. The role of<br />
radar remote sensing (not only aimed at identifying<br />
the main faults by measuring ground displacements)<br />
in the post-earthquake damage assessment should<br />
certainly be a research priority in the radar<br />
community. As an operational alternative, the<br />
capabilities of new low cost devices aimed at<br />
per<strong>for</strong>ming ground surveys should be further<br />
exploited. Figure 11 shows the user interface <strong>and</strong><br />
some sample pictures of a LCMMS (Low Cost Mobile<br />
Mapping System) equipped with 4 webcams <strong>and</strong> a<br />
GPS (Figure 10) aimed at acquiring georeferenced<br />
frames. The system, developed by ITHACA <strong>and</strong><br />
Politecnico di Torino, allows acquisition of about half<br />
million frames <strong>and</strong> 60 thous<strong>and</strong> GPS points during a<br />
5 days ground survey in Port-au-Prince.<br />
Figure 10: LCMMS device installed on<br />
top of a car during a ground survey in<br />
Port-au-Prince<br />
Figure 11: GIS customized software <strong>for</strong> LCMMS data<br />
visualization <strong>and</strong> processing<br />
37
Space Technology Application <strong>for</strong><br />
Wenchuan Earthquake Relief<br />
AIntroduction<br />
Suju Li, Yida Fan, Siquan Yang, Lei Wang<br />
National <strong>Disaster</strong> Reduction Center of China (NDRCC);<br />
lisuju@ndrcc.gov.cn<br />
An earthquake with a magnitude of 8.0 on the<br />
Richter scale struck Wenchuan County, Sichuan<br />
Province, China at 14:28 CST (06:28 UTC), on May<br />
12, 2008, <strong>and</strong> known as the Wenchuan Earthquake.<br />
The location of the epicentre (31.021N, 103.367E)<br />
was at Yingxiu (Fig1), a small town in Wenchuan<br />
County, which is located in the earthquake zone in<br />
China. The most affected areas were distributed<br />
along the southwest to northeast directions from the<br />
epicentre.<br />
The earthquake was the most destructive<br />
experienced since the People's Republic of China was<br />
founded in 1949.<br />
Figure 1: Unmanned airplane image of the<br />
Yingxiu town in the Wenchuan County , Sichuan<br />
Province taken on May 14th,2008 by NDRCC<br />
39
The characteristics of the earthquake were as<br />
follows:<br />
(1)High intensity: the maximum intensity was XI<br />
degree on the China Seismic Intensity Scale<br />
(2) Large area coverage: 500,000km2 over more<br />
than 10 provinces, autonomous regions <strong>and</strong><br />
municipalities, including Gansu, Shannxi <strong>and</strong><br />
Chongqing were affected<br />
40<br />
Figure 2: Epicenter distribution of Wenchuan Earthquake <strong>and</strong><br />
its major aftershocks (Ming Zou, 2009)<br />
(3) Numerous aftershocks <strong>and</strong> frequent secondary<br />
disasters: there were more than 30,000 aftershocks;<br />
the secondary disasters such as l<strong>and</strong> collapses,<br />
l<strong>and</strong>slides, debris flows <strong>and</strong> quake lakes occurred<br />
frequently, which caused even more extensive<br />
damage.<br />
(4) Difficulties <strong>for</strong> disaster relief: the earthquake<br />
affected areas were mostly mountainous, where<br />
many of the lifelines were destroyed by l<strong>and</strong>slides<br />
<strong>and</strong> debris flows making access difficult <strong>for</strong> disaster<br />
rescue teams, <strong>and</strong> <strong>for</strong> goods or facilities to be<br />
supplied to the severely affected earthquake areas.<br />
(5)Massive losses: the earthquake left 69,227 people<br />
dead <strong>and</strong> 17,923 missing. 15.1 million people were<br />
evacuated <strong>and</strong> resettled, the direct economic losses<br />
exceeded 845.1 billion Yuan RMB( 124 billion US<br />
Dollars) (Speech of Chinese President Hu Jingtao,<br />
2008)<br />
Figure 3: Space technology support work flow
Following the Wenchuan Earthquake, the Chinese<br />
government organized the fastest quake relief ef<strong>for</strong>t<br />
<strong>and</strong> mobilized the largest number of people ever in<br />
China's history, to save as many lives as possible <strong>and</strong><br />
to minimize the losses from the disaster, The first<br />
level emergency response was activated according to<br />
the national disaster relief contingency plan (Speech<br />
of Chinese President Hu Jingtao, 2008). As the<br />
decision making support agency <strong>for</strong> national disaster<br />
management, NDRCC immediately triggered the<br />
emergency space technology support operations<br />
(Fig.3), providing effective in<strong>for</strong>mation <strong>and</strong> technical<br />
support <strong>for</strong> national disaster relief. Each process of<br />
the operations is described in this article. The<br />
experiences <strong>and</strong> lessons learned have also been<br />
summarized <strong>and</strong> shared.<br />
Satellite Nation/Region Pre-event images Post-event images Total images<br />
RS-1 CHINA 9 246 255<br />
FORMOSAT-2 CHINA(TAIWAN) 3 146 149<br />
CBERS-02B CHINA 400 25 425<br />
ZY-2 CHINA 7 16 23<br />
BJ-1 CHINA 2 14 16<br />
COSMO-SkyMed ITALY 0 10 10<br />
QuickBird USA. 9 28 37<br />
TERRA ASTER USA. 0 14 14<br />
L<strong>and</strong>sat-7 USA. 10 4 14<br />
WorldView USA. 12 0 12<br />
IKONOS USA. 3 0 3<br />
ALOS JAPAN 19 21 40<br />
IRS-P5 INDIA 6 27 33<br />
IRS-P6 INDIA 18 0 18<br />
ENVISAT ASAR ESA 0 16 16<br />
SPOT 5 4 2 FRANCE 122 23 145<br />
TerraX-SAR GERMANY 0 11 11<br />
EROS-B ISRAEL 0 10 10<br />
RadarSat-1 CANADA 2 11 13<br />
TOPSAT UK 0 2 2<br />
UK-DMC UK 0 4 4<br />
DMG Nigeriasat-1 NIGERIA 0 7 7<br />
Total 622 635 1257<br />
Table 1: The acquired EO images <strong>for</strong> Wenchuan Earthquake emergency relief<br />
41
Image acquisition<br />
Within two hours of the earthquake, NDRCC sent<br />
requests <strong>for</strong> EO images of the earthquake affected<br />
area to international <strong>and</strong> domestic data providers.<br />
The requests <strong>for</strong> international data acquisition were<br />
sent to the International Charter “Space <strong>and</strong> Major<br />
<strong>Disaster</strong>s”. The domestic acquisition requests were<br />
sent to the satellite image owner institutions <strong>and</strong><br />
agents by fax <strong>and</strong> phone. The first two images were<br />
acquired within 24 hours of the requests. A total of<br />
1257 images from 24 satellites <strong>and</strong> 12 countries<br />
were acquired, which included 622 images of archive<br />
image <strong>and</strong> 635 images of newly acquired images;<br />
138 images were kindly provided by International<br />
Charter “Space <strong>and</strong> Major <strong>Disaster</strong>s”, <strong>and</strong> the others<br />
were supplied free-of-charge by more than ten<br />
domestic agencies, as listed in table 1(Yida<br />
Fan,2008).<br />
42<br />
Figure 4: Index map of all the<br />
acquired images (Suju Li, 2009).<br />
Figure 5: L<strong>and</strong>slides, destroyed road <strong>and</strong> quake lake monitoring<br />
map in Pingtong town, Pingwu county, Sichuan province<br />
Figure 6: Location map of people evacuated in Mianzhu City,<br />
Sichuan province<br />
Airborne remote sensing images of the<br />
earthquake affected areas acquired by<br />
the State Bureau of Surveying <strong>and</strong><br />
Mapping of China (SBSM) <strong>and</strong> Chinese<br />
Academy of Sciences, unmanned<br />
airborne remote sensing images<br />
obtained by NDRCC, field investigation<br />
in<strong>for</strong>mation obtained from field teams,<br />
<strong>and</strong> daily statistic disaster in<strong>for</strong>mation<br />
data acquired at county level from local<br />
governments, were also gathered <strong>and</strong><br />
integrated.<br />
Data processing <strong>and</strong> map making<br />
Data preparation<br />
Background data preparation<br />
According to the disaster assessment<br />
requirements, the background data such<br />
as geographic data, spatially relating<br />
social statistical data <strong>and</strong> images of the<br />
earthquake affected area, were<br />
<strong>for</strong>matting-processed <strong>and</strong> uploaded into<br />
the comprehensive spatial database in<br />
NDRCC, <strong>for</strong> subsequent in<strong>for</strong>mation<br />
extraction <strong>and</strong> applications. Be<strong>for</strong>e<br />
observing the acquired images, preassessment<br />
maps were produced based<br />
on the background data which gave the<br />
decision makers the preliminary details<br />
about the people <strong>and</strong> economic loss<br />
assessment.
Image indexing<br />
Everyday there were tens or even a hundred images<br />
gathered by NDRCC. To quickly search the necessary<br />
image, an index map of incoming images was firstly<br />
created with indexing parameters registered <strong>and</strong><br />
linked, such as the satellite name, sensor name,<br />
spatial resolution, observing time.<br />
Data pre-processing<br />
The in<strong>for</strong>mation extraction processing was based on<br />
the second level image product. The optical images<br />
were processed <strong>for</strong> geometric precision correction<br />
<strong>and</strong> ortho-rectification into second level. Similarly,<br />
radar images were filtering, registered <strong>and</strong><br />
enhancement to produce second level images. The<br />
st<strong>and</strong>ard pre-processing stage guaranteed the<br />
consistency of the images.<br />
Figure 7: Integrated disaster loss<br />
assessment map <strong>for</strong> Wenchuan<br />
Earthquake<br />
In<strong>for</strong>mation extraction<br />
Based on the above prepared data, in<strong>for</strong>mation of<br />
collapsed houses, l<strong>and</strong>slides, destroyed roads, quake<br />
lakes <strong>and</strong> other changes to features, the distribution<br />
of evacuation routes <strong>and</strong> other related disaster<br />
in<strong>for</strong>mation were extracted (Fig.5, Fig.6), using the<br />
methods of in<strong>for</strong>mation enhancement <strong>and</strong> changing<br />
detection. Since the goal was mostly to extract<br />
objects at the scale of metres, the in<strong>for</strong>mation<br />
extraction was mainly based on high spatial<br />
resolution images with resolutions less than 5m. To<br />
provide effective <strong>and</strong> timely support in<strong>for</strong>mation <strong>for</strong><br />
disaster emergency rescue <strong>and</strong> relief, the<br />
in<strong>for</strong>mation extraction should be completed within<br />
hours after the image were acquired.<br />
Integrated assessment<br />
To give a general loss assessment of the Wenchuan<br />
earthquake, the integrated emergency assessment<br />
map (Fig.7) at county level was produced based on<br />
interpretation of the remote sensing images,<br />
background data <strong>and</strong> disaster in<strong>for</strong>mation data. The<br />
assessment of affected people <strong>and</strong> damaged houses<br />
at different levels were displayed on the disaster<br />
map <strong>and</strong> used by state councils <strong>for</strong> reconstruction<br />
<strong>and</strong> recovery planning.<br />
43
Map making<br />
All the map products were st<strong>and</strong>ardized mapping<br />
based on a template. Once the in<strong>for</strong>mation was<br />
extracted or assessment results determined, the map<br />
could be produced rapidly by loading the<br />
in<strong>for</strong>mation into the template according to specific<br />
st<strong>and</strong>ards.<br />
Product dissemination <strong>and</strong> service<br />
There were a total of more than a hundred map<br />
products produced during the earthquake<br />
emergency relief stage. They were distributed to four<br />
different types of agencies in different <strong>for</strong>ms, by fax,<br />
email, hardcopy, website or news conference. The<br />
first <strong>and</strong> primary agencies were the central<br />
government emergency management agencies to<br />
support the emergency rescue, relief, recovery <strong>and</strong><br />
reconstruction decision making. The second<br />
agencies were local government <strong>and</strong> field teams to<br />
support their field deployment. The third agencies<br />
were the public <strong>and</strong> international societies, to<br />
support their awareness raising <strong>and</strong> assistance. The<br />
fourth agencies were the professional institutions in<br />
support of their scientific research.<br />
Experiences <strong>and</strong> lessons learned.<br />
Space technology provided effective <strong>and</strong> timely<br />
in<strong>for</strong>mation <strong>for</strong> Wenchuan Earthquake emergency<br />
response management support. At the same time,<br />
some lessons were also learned <strong>and</strong> should be<br />
carefully considered <strong>for</strong> future events.<br />
44<br />
Experiences<br />
(1) An inventory of the space resources should be<br />
compiled <strong>and</strong> made a component of the national<br />
emergency response working procedures. Full<br />
advantage should be taken of international <strong>and</strong><br />
domestic space data acquisition scheduling to ensure<br />
timely acquisitions. Large quantities <strong>and</strong> multiple<br />
types of space borne EO images should be acquired.<br />
(2) Scientifically based effective emergency<br />
operational procedures should be developed<br />
according to the disaster response requirements <strong>and</strong><br />
space resources. Forming different working teams<br />
which were assigned distinct responsibilities<br />
according to the working procedures proved<br />
effective.<br />
(3) Social resources must be mobilizing <strong>and</strong> made<br />
best use of. For major disasters, a single agency<br />
cannot cope with all the problems. More than 40<br />
professional volunteers from research institutes <strong>and</strong><br />
universities were mobilization to participate in<br />
processing the data <strong>and</strong> mapping.<br />
(4) Remote sensing cannot provide all the<br />
in<strong>for</strong>mation <strong>for</strong> disaster management support.<br />
Integration of images with social in<strong>for</strong>mation,<br />
statistical disaster in<strong>for</strong>mation <strong>and</strong> field<br />
investigation were essential.<br />
lessons learned<br />
(1) The observing time <strong>and</strong> location of the requested<br />
EO data should be dynamically planned to ensure<br />
they cover all disaster affected area <strong>and</strong> at different<br />
stages. Because of the lack of an observation plan,<br />
many acquired images were redundant around the<br />
area of the epicentre but there was a shortage of<br />
images on the edges of the affected area.<br />
(2) Capabilities to process the massive amount of EO<br />
data <strong>and</strong> extract useful in<strong>for</strong>mation <strong>for</strong> emergency<br />
response should be improved. It is important to<br />
develop automatic or semi-automatic methods <strong>for</strong><br />
data processing in real-time or near real-time, <strong>for</strong><br />
example, within 1-2 hours after acquisition (Deren<br />
Li, 2009).
Suggested Practices <strong>for</strong> Forecasting<br />
Dust Storms <strong>and</strong><br />
Intervening Their Health Effects<br />
Stanley A. Morain <strong>and</strong> Amelia M. Budge<br />
Earth Data Analysis Center, University of New Mexico, New<br />
Mexico, USA<br />
Importance of atmospheric contaminants in<br />
Rhealth<br />
Respiratory health is exacerbated by exposures to<br />
microscopic particles <strong>and</strong> by microorganisms bound<br />
to them. Repeated exposures lead to chronic<br />
conditions such as asthma, while chance exposures<br />
to particles carrying viruses <strong>and</strong> bacteria lead to<br />
infectious <strong>and</strong> contagious diseases (Figure 1). Since<br />
the 1970s, health concerns shifted from coarse<br />
particles (10µm micrometers) to fine particles<br />
(2.5µm), <strong>and</strong> in the past few years have shifted<br />
toward particles in the 0.1µm range. There is ample<br />
evidence in developed economies that inhalable<br />
particulates result in costly health effects <strong>for</strong> families<br />
<strong>and</strong> societies; stress healthcare infrastructures; <strong>and</strong>,<br />
adversely affect local <strong>and</strong> national productivity.<br />
These trends are a compelling argument <strong>for</strong> having<br />
reliable <strong>for</strong>ecast systems <strong>for</strong> dust <strong>and</strong> its movement<br />
through the environment.<br />
45
Dust, smoke, <strong>and</strong> human health<br />
There is ample literature linking airborne<br />
contaminants to health outcomes. Individual health<br />
is influenced by interactions among genetic <strong>and</strong><br />
environmental factors. Many of the latter represent<br />
pathways <strong>for</strong> transmitting airborne infectious or<br />
contagious diseases across a population. Prolonged<br />
exposures to dust <strong>and</strong> smoke exacerbate chronic<br />
obstructive pulmonary diseases, allergic reactions,<br />
<strong>and</strong> a host of respiratory conditions affecting specific<br />
age groups. Moreover, there is evidence that the toll<br />
is rising because of climate variability, l<strong>and</strong>-use<br />
conversions, <strong>and</strong> global urbanization.<br />
Much of the world experiences weather-induced<br />
dust storms. These are visible from space, but<br />
operational weather <strong>for</strong>ecasts do not predict dust<br />
events or concentrations. To acquire this<br />
in<strong>for</strong>mation, a dust entrainment model must be<br />
embedded into a weather <strong>for</strong>ecast model to simulate<br />
dust dynamics at the breathing level. For health<br />
applications, the question is whether outputs can be<br />
delivered in a timely manner to issue alerts <strong>and</strong><br />
implement interventions? If so, can these <strong>for</strong>ecasts<br />
be linked to health tracking systems? To answer<br />
these questions, <strong>for</strong>ecasts must be available daily.<br />
They should also integrate satellite observations<br />
with geographic <strong>and</strong> demographic data into systems<br />
that can track immediate <strong>and</strong> long-term exposures.<br />
Only in this way will such <strong>for</strong>ecasts provide relevant<br />
in<strong>for</strong>mation <strong>for</strong> both patient-specific diagnoses <strong>and</strong><br />
group epidemiology.<br />
46<br />
Role <strong>for</strong> satellite observations of dust<br />
Satellite sensors measure global atmospheric data to<br />
<strong>for</strong>ecast broad area disasters such as hurricanes <strong>and</strong><br />
tsunamis. Public health infrastructures that link dayto-day<br />
environmental conditions to public health<br />
outcomes are just beginning to emerge. There is a<br />
growing need to collect, archive, <strong>and</strong> integrate<br />
environmental monitoring data with health services,<br />
<strong>and</strong> an equal need to verify <strong>and</strong> validate the medical<br />
value of these data in decision support tools that<br />
streamline disease surveillance. This paper suggests<br />
practices <strong>for</strong> linking ground <strong>and</strong> space-based air<br />
quality observations to respiratory health; provides<br />
examples of how satellite data can be used to<br />
improve health services; <strong>and</strong>, suggests ways <strong>for</strong> how<br />
these services can assist health care providers <strong>and</strong><br />
policy makers to develop better prevention <strong>and</strong><br />
mitigation measures.<br />
Figure 1: Particle sizes <strong>and</strong> their associated<br />
biophysical impacts (Kaiser, 2005).<br />
Satellite sensors provide routine, synoptic<br />
environmental data; but, their utility is enhanced<br />
when used in concert with health records <strong>and</strong><br />
socioeconomic data in an in<strong>for</strong>mation systems<br />
environment. Epidemiologists are interested in<br />
contextual relationships between dust events <strong>and</strong><br />
associated risk factors such as demographics, life<br />
style, access to health care, exposure rates, <strong>and</strong><br />
genetic heritage. Archived data about these<br />
attributes enable disease surveillance to be<br />
conducted via a <strong>for</strong>ecast, <strong>and</strong> via projections over<br />
longer periods to assess the causes <strong>and</strong> effects of<br />
dust on health. However, until satellite sensors began<br />
collecting synoptic environmental data, there were<br />
no long-term archives around which to design<br />
epidemiological studies. Health authorities have<br />
always been aware of environmental factors, but<br />
in<strong>for</strong>mation gathering <strong>for</strong> hospital admissions <strong>and</strong><br />
emergency room visits leave little time to address<br />
factors that trigger respiratory <strong>and</strong> cardiovascular<br />
reactions, let alone address possible airborne<br />
diseases leading to epidemics.
Approach to Dust Forecasting<br />
Sample satellite-based dust <strong>for</strong>ecast system<br />
Three steps are needed to produce reliable dust<br />
<strong>for</strong>ecasts (Figure 2). Step 1 is to assimilate satellite<br />
measurements over l<strong>and</strong> into a dust simulator<br />
(Nickovic et al., 2001); Step 2 optimizes model<br />
outputs to determine model per<strong>for</strong>mance; <strong>and</strong> Step 3<br />
requires public health authorities <strong>and</strong> health care<br />
providers to assess the versatility of dust<br />
in<strong>for</strong>mation <strong>for</strong> health. The combined system adds a<br />
dust <strong>for</strong>ecast to the daily regional weather <strong>for</strong>ecast.<br />
Weather parameters include near surface properties,<br />
while dust parameters are drawn from Earth<br />
observing sensors. The system's per<strong>for</strong>mance has<br />
been verified <strong>and</strong> validated by comparing data<br />
obtained from ground monitors with modeled dust<br />
events between 2003 <strong>and</strong> 2008 (Morain <strong>and</strong> Sprigg<br />
2005; Morain <strong>and</strong> Sprigg 2007; Morain <strong>and</strong> Budge<br />
2008). These dust <strong>for</strong>ecasts are beginning to be used<br />
by health care professionals in the region.<br />
Figure 2: Step-wise procedure <strong>for</strong> <strong>for</strong>ecasting dust episodes <strong>for</strong> health surveillance.<br />
Metrics Wind Speed (m/s) Wind Direction (°) Temp (K) Definition<br />
Agreement<br />
Index<br />
0.74<br />
0.75<br />
0.74<br />
0.76<br />
0.71<br />
0.95<br />
1 �N N<br />
2 �M �O<br />
�<br />
�i<br />
i<br />
�M i �O<br />
�O<br />
i �O<br />
�<br />
�<br />
i�1<br />
i�1<br />
Table 1: Model per<strong>for</strong>mance metrics be<strong>for</strong>e <strong>and</strong> after data assimilation. Bold values are after data<br />
assimilation. For the equation M = modeled; O = observed<br />
Figure 3: The triptych shows three generations of model improvements <strong>for</strong> a dust storm across New Mexico <strong>and</strong> Texas on<br />
15-16 December, 2003. (left) the baseline model per<strong>for</strong>mance be<strong>for</strong>e satellite data were included; (middle) after satellite<br />
data replaced baseline parameters; (right) the same storm modeled by a higher resolution, weather <strong>for</strong>ecasting model.<br />
47
Improvements in model per<strong>for</strong>mance were obtained<br />
by replacing surface parameters in the baseline dust<br />
model. A series of model runs was executed using<br />
combinations of satellite surface measurements.<br />
Three parameters in particular, dust sources, digital<br />
elevation, <strong>and</strong> surface roughness, led to substantial<br />
improvements. These three parameters, along with<br />
surface air temperature, wind speed, <strong>and</strong> wind<br />
direction seem best <strong>for</strong> modeling dust entrainment.<br />
For the PM10 fraction, all runs showed improvement<br />
over the baseline run. For the PM2.5 fraction, results<br />
were mixed, but were better than the baseline.<br />
Per<strong>for</strong>mance statistics were defined <strong>for</strong> modeled <strong>and</strong><br />
observed atmospheric parameters (Yin et al., 2005),<br />
<strong>and</strong> an “agreement index” was defined to assess<br />
model per<strong>for</strong>mance (Table 1). Modeled results<br />
agreed closely with observed measures <strong>for</strong> wind<br />
speed <strong>and</strong> wind direction, but were statistically<br />
different <strong>for</strong> surface air temperature. Results show<br />
that the model system can simulate wind speed <strong>and</strong><br />
direction accurately; <strong>and</strong>, that surface air<br />
temperature largely determines dust entrainment<br />
potential. Figure 3 shows three evolutionary stages<br />
in modeled dust patterns <strong>for</strong> the same storm.<br />
Verification <strong>and</strong> validation<br />
Verification <strong>and</strong> validation of modeled dust patterns<br />
<strong>and</strong> movements were produced <strong>for</strong> hour of peak dust<br />
concentration <strong>and</strong> dust episode duration using timestamped<br />
ground observations against satellite<br />
measurements. The correlation between modeled<br />
<strong>and</strong> observed dust concentrations shows a tendency<br />
to over-predict the severity of events, primarily<br />
because satellite observations of the lower<br />
atmosphere measure a greater thickness of dust than<br />
is recorded by ground monitors. In all cases the<br />
timing <strong>and</strong> duration of dust events was <strong>for</strong>ecasted<br />
accurately.<br />
48<br />
A weather <strong>for</strong>ecaster's approach also was used to<br />
assess per<strong>for</strong>mance. Statistics <strong>for</strong> 346 observations<br />
were calculated. Only ten air quality exceedances<br />
occurred over the entire model domain during these<br />
events, suggesting that there were few false alarms.<br />
When this method was applied to the Phoenix<br />
metropolitan area, the model <strong>for</strong>ecasted 71% of the<br />
hourly averages, 29% of the hours exceeding air<br />
quality st<strong>and</strong>ards <strong>for</strong> dust, <strong>and</strong> correctly <strong>for</strong>ecasted<br />
66% of the dust events.<br />
Health tracking <strong>and</strong> surveillance<br />
There are two basic approaches <strong>for</strong> health<br />
in<strong>for</strong>mation systems. One is based on medical<br />
reporting by primary care givers; the other is based<br />
on electronic in<strong>for</strong>mation gathering through data of<br />
historical reports <strong>and</strong> medical records. Both rely on<br />
syndromes that detect outbreaks of illnesses or<br />
potential epidemics that might otherwise be missed.<br />
The approach in this report adopted an Internetbased<br />
syndrome reporting system that facilitates<br />
rapid communication between public health officials<br />
in local jurisdictions <strong>and</strong> health care providers<br />
(Budge et al., 2006). It is also a reporting <strong>and</strong><br />
discovery system <strong>for</strong> primary care physicians <strong>and</strong><br />
clinicians who want to determine if their patient's<br />
syndrome has been reported by others in their<br />
jurisdiction. It provides medical <strong>and</strong> environmental<br />
in<strong>for</strong>mation in three modules: (a) a syndrome<br />
in<strong>for</strong>mation collection module to which doctors<br />
submit an inquiry; (b) a communication module<br />
whereby public health officials respond to an<br />
inquiry; <strong>and</strong> (c), a data visualization module that<br />
permits both parties to review inputs in the medical<br />
<strong>and</strong> geographical domains.<br />
Experience with clinician-driven surveillance<br />
systems demonstrates that health professionals will<br />
report cases of suspected infectious disease, if the<br />
system is fast (less than 15 30 seconds), provides<br />
immediate feedback to clinicians on local infectious<br />
disease outbreaks, permits selective interaction<br />
between public health officials <strong>and</strong> clinicians on a<br />
real-time basis, <strong>and</strong> is inexpensive. When clinicians<br />
see a seriously ill patient with presumed infectious<br />
disease, it should take only a few seconds to report<br />
that case. Studies suggest that this is less than 0.1<br />
percent of all clinical encounters in human medicine,<br />
but these are the cases that need to be identified in<br />
near real-time to avoid possible epidemics.<br />
Products that fit user needs<br />
Two types of health needs are met by tracking dust<br />
events: those related to interventions that reduce<br />
adverse respiratory effects in individuals; <strong>and</strong>, those<br />
involving statistical relations between<br />
environmental causes <strong>and</strong> public health effects. The<br />
first use is <strong>for</strong> alerts issued by school nurses, print<br />
<strong>and</strong> broadcast media, hospitals, doctors, <strong>and</strong><br />
clinicians who in<strong>for</strong>m the public; the second is <strong>for</strong><br />
epidemiologists.
Health alerts<br />
As an example of health interventions, the<br />
Albuquerque Public Schools (APS) in New Mexico,<br />
USA has developed an asthma action plan <strong>and</strong><br />
st<strong>and</strong>ing orders <strong>for</strong> intervening, mitigating, <strong>and</strong><br />
treating registered asthmatic students. The action<br />
plan has three well defined categories of symptoms.<br />
Mild symptoms are addressed by the classroom<br />
teacher; moderate symptoms are addressed by a<br />
school nurse or other medical provider; <strong>and</strong> severe<br />
symptoms are addressed by emergency response<br />
personnel. These categories provide a health basis<br />
<strong>for</strong> dust <strong>for</strong>ecasts that can be e-mailed, faxed, text<br />
messaged, or twittered to the APS Nursing Service,<br />
<strong>and</strong> sent to print <strong>and</strong> broadcast media.<br />
Forty-eight-hour <strong>for</strong>ecasts of atmospheric dust are<br />
produced daily <strong>and</strong> made available at<br />
http://phairs.unm.edu, <strong>and</strong><br />
http://nmtracking.unm.edu. Figure 4 captures a<br />
storm crossing southeast Arizona <strong>and</strong> southwest<br />
New Mexico on Jan 6-8, 2008. Individuals at Wilcox<br />
<strong>and</strong> Silver City could view an animation of the dust<br />
<strong>for</strong>ecast that ran from 5:00pm (local time) on Jan 6th<br />
through midnight on Jan 8th. At left is a clip from the<br />
animation centered on the hour of peak dust<br />
concentration. The graphs at right show the peak<br />
hour <strong>and</strong> magnitudes <strong>for</strong> Wilcox Playa (blue curve)<br />
<strong>and</strong> Silver City (red curve). There is a precursor,<br />
lower concentration episode at both locations, but<br />
Wilcox was eventually hit with three high<br />
concentration episodes over the <strong>for</strong>ecast period.<br />
School nurses in the Albuquerque Public Schools<br />
prefer a dust alert system that obviates referring to<br />
websites or interpreting graphs. They favor a daily<br />
written synopsis of dust <strong>and</strong> air quality conditions<br />
across the school District.<br />
Figure 4: (left), Dust patterns at 1pm on Jan 7th. High concentrations are red <strong>and</strong> orange colors; low concentrations are<br />
green <strong>and</strong> yellow colors. (right), Timing of peak dust concentrations. The pattern at left is <strong>for</strong> the hour shown on the<br />
vertical bar at right.<br />
Using Figure 4(right) as an example, a synopsis of<br />
dust <strong>for</strong>ecasts might read as follows:<br />
�Wilcox <strong>and</strong> vicinity: For January 6-8, expect<br />
moderate windblown dust late in the evening on<br />
the 6th, dissipating gradually throughout the<br />
evening <strong>and</strong> early morning hours but increasing<br />
<strong>and</strong> peaking in concentration to unhealthy levels<br />
between noon <strong>and</strong> 3pm on the 7th. There is a<br />
chance <strong>for</strong> moderate dust between 6 <strong>and</strong> 8am on<br />
the 8th.<br />
�Silver City <strong>and</strong> vicinity: For January 6-8,<br />
expect conditions as in Wilcox on the 6th. For the<br />
7th, expect a sharp rise in dust concentration to<br />
unhealthy levels between noon <strong>and</strong> 7pm, <strong>and</strong><br />
remaining high until after midnight. Expect<br />
diminishing dust on the 8th.<br />
Epidemiology<br />
Epidemiologists can gain access to archives of dust<br />
simulations in the southwestern USA at<br />
http://nmtracking.unm.edu. Products are integrated<br />
into client interfaces to visualize raster images<br />
derived from the modeling system <strong>and</strong> to combine<br />
them with routine GIS operations. These data<br />
represent a step toward examining geographically<br />
explicit dust patterns <strong>for</strong> analyses of hospital<br />
admissions, or doctor visits that might have resulted<br />
from chronic, high level dust exposures.<br />
49
Daily PM2.5 concentrations from April 2006 were<br />
used to identify areas in New Mexico that had high<br />
potential <strong>for</strong> dust-related health issues (Figure 5). At<br />
left in the figure, the measure is the proportion of<br />
days that 24-hour average DUST2.5 was greater than<br />
15ug/m3. This concentration was used because it is<br />
the Federal USA guideline. At right the measure is<br />
the proportion of days that exceeded a 24-hour<br />
maximum of 35ug/m³. Up to one-third of the days<br />
were <strong>for</strong>ecasted to exceed a level considered to be<br />
“unhealthy.”<br />
Outlook<br />
Satellite sensing in dry environments is critical <strong>for</strong><br />
early warning of imminent dust storms to reduce<br />
risk of exposure to individuals <strong>and</strong> populations.<br />
Satellite data sets assimilated into models improve<br />
identification of active dust sources, <strong>and</strong> thus,<br />
enhance <strong>for</strong>ecasts of dust generation, entrainment,<br />
<strong>and</strong> downwind dispersal <strong>and</strong> deposition. Products<br />
designed specifically with end users in mind are<br />
being evaluated by health authorities having<br />
operational health <strong>and</strong> air quality responsibilities.<br />
These products are being modified through<br />
continuing research, <strong>and</strong> in time will foster adoption<br />
by public health services.<br />
Technologies <strong>for</strong> making air quality measurements<br />
continue to improve, but the data <strong>and</strong> observations<br />
themselves are not systematically stored <strong>for</strong> retrieval<br />
<strong>and</strong> medical research. Science, technology, <strong>and</strong> policy<br />
communities face huge challenges in: gathering,<br />
storing, modeling, interpreting, <strong>and</strong> disseminating<br />
air quality data <strong>for</strong> tracking health outcomes in<br />
populations. Biogeochemical <strong>and</strong> dynamical<br />
processes of airborne pathogens <strong>and</strong> pollutants must<br />
be researched further so that epidemiologists can<br />
underst<strong>and</strong> the medical consequences of air masses<br />
traversing their regions.<br />
50<br />
Figure 5: (left), All but the lightest color exceeded the st<strong>and</strong>ard daily average concentration of 15<br />
µg/m³ <strong>for</strong> PM2.5 dust in the USA; (right), the darkest three colors exceeded the 24-hr daily maximum<br />
concentration of 35 µg/m³ (from Myers, personal communication).<br />
Long-term archives of global air quality data <strong>and</strong><br />
in<strong>for</strong>mation are needed <strong>for</strong> longitudinal studies<br />
based on sentinel or cohort populations. The gr<strong>and</strong><br />
challenge is to add health professionals into ef<strong>for</strong>ts<br />
that merge environmental surveillance with human<br />
health syndromes.<br />
Acknowledgements<br />
The system described here was funded by NASA<br />
under agreement NNS04AA19A titled Public Health<br />
Applications in Remote Sensing (PHAiRS). Thanks<br />
are due to all team members who participated in this<br />
five year ef<strong>for</strong>t. Special thanks are extended to<br />
William Sprigg, Dazhong Yin, Brian Barbaris, Patrick<br />
Shaw, <strong>and</strong> Slobodan Nickovic (all from the University<br />
of Arizona, Department of Atmospheric Sciences; to<br />
Karl Benedict, Thomas Budge, William Hudspeth<br />
Alan Zelicoff <strong>and</strong> Orrin Myers (all at the University of<br />
New Mexico, Earth Data Analysis Center <strong>and</strong> UNM<br />
Health Sciences Center).
Monitoring Refugee/IDP Camps to<br />
Support International Relief Action<br />
1 2 3<br />
Olaf Kranz , Gunter Zeug , Dirk Tiede , Stephen<br />
4 5 2<br />
Cl<strong>and</strong>illon , Denis Bruckert , Thomas Kemper ,<br />
3 4<br />
Stefan Lang , Mathilde Caspard<br />
1 German Aerospace Center (DLR), German Remote Sensing<br />
Data Center (DFD), Civil Crisis In<strong>for</strong>mation & Geo<strong>Risk</strong>s,<br />
Oberpfaffenhofen, Germany<br />
2 European Commission Joint Research Centre, Global<br />
Security <strong>and</strong> Crisis <strong>Management</strong> Unit, Geospatial In<strong>for</strong>mation<br />
Analysis <strong>for</strong> Global Security <strong>and</strong> Stability, Ispra (VA), Italy<br />
3 University of Salzburg, Centre <strong>for</strong> Geoin<strong>for</strong>matics, Salzburg,<br />
Austria<br />
4 Sertit, Illkirch, France<br />
5 European Union Satellite Centre, Torrejon de Ardoz Madrid,<br />
Spain<br />
AIntroduction<br />
According to the United Nations High Commissioner<br />
of Refugees (UNHCR), approximately 42 million<br />
people were <strong>for</strong>cibly displaced worldwide at the end<br />
of 2008. This includes 15.2 million refugees, 827,000<br />
asylum-seekers <strong>and</strong> 26 million internally displaced<br />
persons (IDP) (UNHCR, 2009c). IDPs are people who<br />
had to flee or to leave their homes but stayed within<br />
their country of origin without crossing any<br />
international state border (IDMC, 2009).<br />
Darfur is only one of many conflict areas in Sudan,<br />
the country with the single largest internally<br />
displaced population in the world (IDMC, 2009). The<br />
conflict in Darfur is caused among other factors by<br />
fights <strong>for</strong> diminished drought affected resources <strong>and</strong><br />
dem<strong>and</strong>s <strong>for</strong> greater political autonomy; almost 50%<br />
of Darfur's total population of about 6 million<br />
people, were internally displaced by January 2009.<br />
An additional 250,000 people are living in refugee<br />
camps across the border in Chad (IDMC, 2009).<br />
Figure 1: Makeshift shelters <strong>and</strong> new tents in a section <strong>for</strong> new<br />
arrivals at Ifo, one of the three refugee camps at Dadaab in<br />
north-east Kenya (UNHCR/E. Hockstein 2009).<br />
51
Refugees <strong>and</strong> IDPs live in widely varying conditions,<br />
from well-established camps to provisional shelters<br />
or at worst in the open. Besides the UNHCR many<br />
other mainly non-profit organizations address the<br />
problems of refugees <strong>and</strong> IDPs. The management of<br />
refugee camps is of particular concern. Uncontrolled<br />
growth <strong>and</strong> arrival of new migrants, environmental<br />
pollution <strong>and</strong> degradation, water supply <strong>and</strong><br />
sanitation, health <strong>and</strong> hygiene, plus security are only<br />
a few of the challenges facing the humanitarian<br />
community (fig. 1 <strong>and</strong> fig. 2).<br />
This underlines that the establishment <strong>and</strong><br />
management of refugee/IDP camps require joint<br />
ef<strong>for</strong>ts by the aid agencies involved <strong>and</strong> if possible<br />
local authorities. The supportive role of<br />
geoin<strong>for</strong>mation <strong>and</strong> mapping tools within this<br />
context has been demonstrated in various situations<br />
that will be outlined in more detail in the following.<br />
A refugee/ IDP camp monitoring service<br />
Within the recent European Commission funded<br />
GMES- project LIMES a working group was<br />
established addressing especially humanitarian<br />
issues. Among others a specific service supporting<br />
refugee/IDP camp management with geoin<strong>for</strong>mation<br />
products was successfully set up. Partners brought<br />
together their expertise in humanitarian relief, earth<br />
observation, geodata processing <strong>and</strong> analysis,<br />
statistics <strong>and</strong> modelling, to monitor the status of the<br />
camps, their growth over time <strong>and</strong> the<br />
environmental situation in the vicinity of the camps.<br />
Estimation of population figures from satellite data<br />
was another objective of the service providers.<br />
Population numbers are crucial in<strong>for</strong>mation to<br />
enhance the logistical support of relief organisations<br />
to provide water, shelter <strong>and</strong> security.<br />
52<br />
In the present stage of the project (2006 2009) the<br />
LIMES refugee/IDP camp monitoring service was<br />
requested three times to monitor a total of eight<br />
refugee/IPD camps throughout Darfur <strong>and</strong> Eastern<br />
Chad. The work was requested by the Directorate-<br />
General <strong>for</strong> External Relations of the European<br />
Commission (DG RELEX), the European Forces<br />
(EUFOR) Chad/RCA <strong>and</strong> the World Food Programme<br />
(WFP).<br />
Figure 2: Thous<strong>and</strong>s of people flee the IDP site at Kibati,<br />
in Democratic Republic of the Congo's North Kivu<br />
province, after hearing gunfire (UNHCR/P. Taggart 2009).<br />
DG RELEX asked <strong>for</strong> support to monitor the camps of<br />
Zam Zam, located 10 km southwest of El Fasher, the<br />
capital of North Darfur, <strong>and</strong> Zalingei a city in West<br />
Darfur home to the two large IDP camps at Hassa<br />
Hissa <strong>and</strong> Hemidya. The camps of Ker? <strong>and</strong> Abdi are<br />
located in eastern Chad <strong>and</strong> were requested to be<br />
mapped by EUFOR. The WFP also intended to launch<br />
a pilot-project <strong>for</strong> camp population estimates. The<br />
camps selected <strong>for</strong> an initial investigation were Dorti<br />
<strong>and</strong> Ardamata in West Darfur close to the city of El<br />
Geneina as well as Um Dukhum about 250 km<br />
further south close to the Chadian border (fig. 3).
Figure 3: Overview of<br />
the analysed camps.<br />
The requirements<br />
The general requirements expressed by the<br />
requesting organisations were to gather in<strong>for</strong>mation<br />
facilitating a better view of the situation in <strong>and</strong><br />
around the camps. DG RELEX <strong>and</strong> EUFOR were<br />
interested in assessing the current size of the camps<br />
by means of their geographical extents, recent<br />
developments, as well as an estimation of the<br />
population currently living in the camps.<br />
Furthermore, the growth of the camps over time was<br />
analyzed to obtain a better underst<strong>and</strong>ing of the<br />
situation <strong>and</strong> to draw conclusions <strong>for</strong> potential<br />
further developments.<br />
Another topic of great interest was the impact of the<br />
camp development on the surrounding environment.<br />
In combination with population figures this might<br />
indicate a potential source of future conflict about<br />
natural resources, thus mitigating conflicts between<br />
refugees/IDP's <strong>and</strong> host communities.<br />
Besides the above-mentioned two organizations,<br />
WFP requested an evaluation of the use of satellite<br />
imagery <strong>for</strong> deriving reliable population estimates of<br />
refugee camps <strong>for</strong> the entire Darfur. The case study<br />
aimed to assess the ability of very high resolution<br />
(VHR) satellite data together with limited field<br />
surveys, to estimate the overall camp population.<br />
Furthermore, the scalability of the earth observation<br />
methodology should be tested to cover all IDP camps<br />
in the three Darfur regions in a future study <strong>and</strong> <strong>for</strong><br />
periodic updates.<br />
The Solutions<br />
The monitoring of the size <strong>and</strong> growth of the camps<br />
made it necessary to acquire very high resolution<br />
(VHR) satellite imagery. State-of-the-art very high<br />
resolution optical satellite sensor technology can<br />
provide imagery with a spatial resolution between<br />
0.5 <strong>and</strong> 1 metre. These resolutions allow a detailed<br />
view of the situation on the ground. Buildings, tents,<br />
walls <strong>and</strong> streets as well as vegetation can be<br />
visually clearly distinguished. As most camps have<br />
existed since the beginning of the conflict in 2003,<br />
the monitoring of the camp growth started with<br />
satellite imagery from around that year, depending<br />
on the availability of data.<br />
Additional geoin<strong>for</strong>mation such as camp boundaries<br />
were provided by the customers, as well as digitised<br />
by the team. Further in<strong>for</strong>mation was obtained from<br />
published literature, the internet <strong>and</strong> oral<br />
communications with members from relief<br />
organisations such as Médecins Sans Frontières<br />
(MSF), UNHCR <strong>and</strong> Intersos. WFP provided GPS<br />
ground control points as well as photographs from<br />
the respective camps.<br />
Together with a visual interpretation, the analyses<br />
utilised semi-automated in<strong>for</strong>mation extraction<br />
methods. Two different object-based image analysis<br />
methods (OBIA) combined segmentation, class<br />
modelling <strong>and</strong> knowledge representation<br />
techniques. A third approach was based on the<br />
analysis of shape <strong>and</strong> <strong>for</strong>m of the dwellings using<br />
mathematical morphology (Kemper et al., 2010). For<br />
the camp structure <strong>and</strong> dwelling density mapping<br />
two aspects of the evolution of the camps were<br />
analysed (Kranz et al. 2009a): firstly, the growth of<br />
the camps from 2002 (Zam Zam), 2004 (Zalingei),<br />
<strong>and</strong> 2006 (Kerfi & Abdi) until 2008, including the<br />
structure of the entire populated area in terms of<br />
camp area, traditional settlements <strong>and</strong> dwelling<br />
densities; secondly, the number of dwellings in the<br />
camps in order to derive an estimate of the number<br />
of people present.<br />
Initially an OBIA rule set was developed <strong>for</strong> the 2004<br />
Zam Zam imagery. Afterwards it was modified <strong>and</strong><br />
optimized to be transferable to the other<br />
regions/camps <strong>and</strong> different satellite images. In<br />
addition, another OBIA rule set was developed <strong>for</strong><br />
the camps in Chad (Kerfi & Abdi) to cope with the<br />
different structure of the camps <strong>and</strong> <strong>for</strong> combining<br />
the expertise within the group of researchers in the<br />
most effective way (Kranz et al., 2009b). This<br />
approach of joining the expertise of different<br />
research groups was continued <strong>and</strong> extended to a<br />
comparison of different methodologies at the<br />
request of WFP. The overall aim was besides<br />
generating relevant in<strong>for</strong>mation <strong>for</strong> the costumer to<br />
further optimize the developed methods <strong>and</strong><br />
53
processing chains to finally derive a more robust<br />
OBIA rule set, leading to more reliable results in<br />
general. The camp areas were delineated<br />
automatically according to a certain threshold in<br />
dwelling density.<br />
IDP or refugee camps themselves have an impact on<br />
the surrounding environment due to the additional<br />
dem<strong>and</strong> of the scarce local resources such as water,<br />
grazing areas <strong>and</strong> firewood. Estimating the<br />
magnitude of such impact is of considerable<br />
importance with respect firstly to the sustainability<br />
of camps <strong>and</strong> secondly to conflict prevention. There<br />
is growing concern about the environmental impact<br />
of Darfur's conflict, in particular the impact on<br />
Darfur's wood resources which were already being<br />
depleted at an estimated rate of 1% per annum<br />
be<strong>for</strong>e the conflict (UNEP 2008). In situations such<br />
as Darfur this depletion also has an impact on the<br />
security of the IDPs because the depletion of<br />
resources <strong>for</strong>ces them to collect firewood further<br />
away from the camps, increasing the risk of attack<br />
(UNEP, 2008). The detection <strong>and</strong>, where possible the<br />
quantification of this impact, may provide important<br />
in<strong>for</strong>mation <strong>for</strong> the management of these camps. A<br />
st<strong>and</strong>ard application <strong>for</strong> the detection of changes<br />
with satellite imagery is the analysis of archive<br />
satellite data with coarse geometric but high<br />
temporal resolution <strong>for</strong> a defined observation<br />
period. Such an analysis aims to detect spatial trend<br />
patterns, which are an important factor in long-term<br />
environmental studies. In this study a time-series<br />
analysis of MODIS satellite data from January 2002<br />
to July 2008 was based on the calculation <strong>and</strong><br />
comparison of the Enhanced Vegetation Index (EVI)<br />
of 16-day maximum value composites with a spatial<br />
resolution of 250m.<br />
54<br />
Results<br />
Camp population estimates<br />
Satellite-based extraction of dwellings does not<br />
provide rigorous evidence of the actual number of<br />
people present at the time of data capture. However,<br />
the number of satellite data derived “dwellings”<br />
provides a proxy <strong>for</strong> the number of people present at<br />
the time of data acquisition. As no field data about<br />
the average household sizes per tent were available<br />
<strong>for</strong> Zam Zam <strong>and</strong> Zalingei, three different scenarios<br />
were generated <strong>for</strong> the estimation of population<br />
figures. These were based on the number of<br />
extracted dwellings, various figures from published<br />
literature (Giada et al., 2003; Bush, 1988; UNHCR,<br />
2006) <strong>and</strong> oral communications with Médecins Sans<br />
Frontières (MSF), Intersos <strong>and</strong> UNHCR. Depending<br />
on the particular scenario used <strong>for</strong> the dwelling<br />
extraction from the satellite images, these figures<br />
have shown good agreements with official<br />
population data from the Humanitarian Needs<br />
Profile (HNP) of UN OCHA (United Nations Office <strong>for</strong><br />
the Coordination of Humanitarian Affairs) (OCHA,<br />
2007).<br />
One of the main requests of the WFP was the<br />
estimation of population using the number of<br />
dwelling structures as a proxy. To obtain a reference<br />
dataset, visual interpretations were carried out, as it<br />
was assumed that this method would provide the<br />
most accurate results <strong>for</strong> mapping single buildings<br />
within the IDP camps. This reference data served<br />
then as a comparison of four automatic or semiautomatic<br />
extraction approaches. The four methods<br />
showed different results. A common problem with all<br />
methods was that side-by-side buildings were<br />
detected as a single building leading to an<br />
underestimation of the number of dwellings. Some<br />
buildings were not automatically recognized,<br />
because they have similar spectral characteristics as<br />
ground. In contrast, an overestimation was observed<br />
in other parts because potential “buildings” proved<br />
to be fences, shadows or bare soil.<br />
The results show a large variation between the<br />
different approaches, reaching more than ± 30%<br />
difference between automatic <strong>and</strong> visually counted<br />
dwellings (Table 1).<br />
Method Dorti Ardamata Um Dukhum North<br />
Visual Interpretation 3636 6394 14257<br />
OBIA 1 2352 4869 10281<br />
OBIA 2 2523 3965 15349<br />
Pixel-based Approach 2142 3368 12277<br />
Mathematical Morphology 1 2806 6938 14032<br />
Mathematical Morphology 2 2800 5800 18650<br />
Table 1: Dwelling estimates <strong>for</strong> the three camps using different approaches
The largest differences occur in the northern part of<br />
Um Dukhum, which can be attributed to the fact that<br />
this camp is much more widespread, including more<br />
open spaces, trees <strong>and</strong> rock outcrops compared to<br />
Dorti or Ardamata sites. Also there is no clear<br />
separation between host community <strong>and</strong> IDP's <strong>and</strong><br />
there was no camp map available that would allow<br />
the exclusion of public facilities. The table shows that<br />
there is no clear pattern to be followed. A final<br />
assessment of the accuracy will be possible only with<br />
field assessments (the field validation planned <strong>for</strong><br />
October 2009 had to be interrupted <strong>for</strong> security<br />
reasons).<br />
IDP camp structure <strong>and</strong> dwelling densities<br />
For the Zam Zam <strong>and</strong> Zalingei camp sites the<br />
monitoring of developments between 2002, 2004<br />
<strong>and</strong> 2008 reveals a major increase in the number of<br />
dwellings between 2004 <strong>and</strong> 2008. Further analysis<br />
encompassed density calculations to create dwelling<br />
density maps (dwellings per square km), based on<br />
the semi-automatically extracted dwellings (fig. 4).<br />
Rapid, partly automated mapping techniques were<br />
also applied to analyse the situation in the two<br />
camps of Kerfi <strong>and</strong> Abdi. Results were provided well<br />
within 44 hours after data reception as requested by<br />
EUFOR. Operational products were generated,<br />
highlighting areas of high density dwellings <strong>and</strong><br />
tents as well as newly settled areas. Up-to-date l<strong>and</strong><br />
use/cover in<strong>for</strong>mation maps were derived using the<br />
surroundings, camp limits, settlement infrastructure<br />
<strong>and</strong> single dwellings as indications of human<br />
presence.<br />
Figure 4: Dwelling density map <strong>for</strong> Zam Zam IDP camp at three different dates (2002, 2004, 2008).<br />
55
Environmental impact assessment<br />
The impact analysis <strong>for</strong> the Zam Zam camp is<br />
illustrated in Figure 5. The significantly degraded<br />
areas are all on the western side, within 5 to 10km of<br />
the camp. Areas closest to camps are generally more<br />
secure <strong>and</strong> are hence the most exploited. IDP's from<br />
a camp at Abu Shouk in Al Fashir (approximately<br />
20km away) recently reported that it takes seven<br />
days to collect one cart-load of wood (UNEP, 2008).<br />
Despite the coarse resolution, the MODIS satellite<br />
data provides valuable in<strong>for</strong>mation <strong>for</strong> evaluating<br />
the impact of IDP camps due to its ability to identify<br />
even subtle changes <strong>and</strong> the availability of long timeseries<br />
over large areas. The quantitative in<strong>for</strong>mation<br />
may be used to enhance the qualitative in<strong>for</strong>mation<br />
(e.g. UNEP, 2008) available from higher resolution<br />
data.<br />
Conclusions<br />
The requests described in this paper were prepared<br />
in close cooperation with the end user to ensure that<br />
the final maps <strong>and</strong> interpretations provided the<br />
maximum possible benefit <strong>and</strong> support <strong>for</strong> the<br />
planning of the mission of the respective<br />
organizations in the conflict region. The general<br />
feedback from the user organizations was very<br />
positive but nevertheless there is still space <strong>for</strong><br />
further improvements.<br />
Remote sensing offers a safe way of analysing<br />
refugee/IDP camps <strong>and</strong> gathered in<strong>for</strong>mation can be<br />
an important contribution to logistical issues of<br />
relief organisations. Optical satellite data can be used<br />
<strong>for</strong> an extraction of camp extents, infrastructure,<br />
numbers <strong>and</strong> types of buildings as well as population<br />
estimations <strong>and</strong> monitoring of refugee/IDP camps.<br />
However, improvements in single automatic<br />
processing steps are still necessary, e.g. the<br />
56<br />
extraction of single dwellings from the imagery,<br />
which serves as basis <strong>for</strong> obtaining reliable<br />
population estimates.<br />
Cooperation between a number of partner<br />
organizations in these joint activities has<br />
demonstrated the advantages of bringing together<br />
their different capacities <strong>and</strong> areas of expertise to<br />
provide rapid support to mission planning within the<br />
context of a complex crisis situation. Such mutual<br />
ef<strong>for</strong>ts result in sound <strong>and</strong> reliable in<strong>for</strong>mation<br />
products that can be rapidly distributed to the<br />
requesting organisation. Improvement <strong>and</strong><br />
expansion of future services, would include the<br />
detection <strong>and</strong> monitoring of other important natural<br />
resources such as water.<br />
Figure 5: Trend analysis results <strong>for</strong><br />
Zam Zam camp (orange) withy a 5 km<br />
buffer around the camp. The coarse<br />
red-transparent pixels show areas<br />
with a significant negative trend<br />
derived from a modified seasonal<br />
Mann-Kendell test.
Local Flood Early Warning Based on<br />
Low-Tech Geoin<strong>for</strong>matics<br />
Approaches <strong>and</strong> Community<br />
Involvement A Solution For Rural<br />
Areas in The Philippines<br />
1 2<br />
Norman Kerle & Olaf Neussner<br />
1 International Institute <strong>for</strong> <strong>Geoin<strong>for</strong>mation</strong> Science <strong>and</strong> Earth<br />
Observation (ITC) Department of Earth Systems Analysis,<br />
Hengelosestraat 99, 7500AA Enschede, The Netherl<strong>and</strong>s,<br />
Kerle@itc.nl<br />
2 German Technical Cooperation, Gesellschaft für Technische<br />
Zusammenarbeit (GTZ), PhilAm Life Building, Justice<br />
Romualdez Street, Tacloban, Leyte, Philippines,<br />
drmon@web.de<br />
TIntroduction <strong>and</strong> background<br />
The vast majority of the more than 200 activations of<br />
the International Charter “Space <strong>and</strong> Major<br />
<strong>Disaster</strong>s” to date (International Charter, 2009),<br />
including the very first event in 2001, have been in<br />
response to flood disasters. Such events come in<br />
various <strong>for</strong>ms, at times related to excessive<br />
precipitation due to tropical storms, at others caused<br />
by snow melt, coastal or river dam breaks, volcano<br />
crater rim collapses or subglacial outbursts. With<br />
disasters defined as hazardous events causing<br />
damage that exceeds the coping capacity of the<br />
affected community, the spatial scale of such events<br />
is highly variable, depending largely on the<br />
distribution <strong>and</strong> accumulation of assets in<br />
threatened areas. Such accumulations are becoming<br />
increasingly common, reflecting both global<br />
population growth (<strong>and</strong> the consequent movement<br />
of frequently marginalized people into such areas),<br />
but also an increase in overall global asset wealth<br />
that may be adversely affected (Grimm et al., 2008;<br />
1<br />
57
(Grimm et al., 2008; Kerle <strong>and</strong> Alkema, in press).<br />
Global warming, with associated sea level rise <strong>and</strong><br />
apparently more erratic <strong>and</strong> occasionally more<br />
violent weather patterns, has added to a widespread<br />
increase in flood risk. While weather <strong>for</strong>ecasting<br />
abilities have greatly increased, aided by<br />
sophisticated space infrastructure <strong>and</strong> computer<br />
models, floods continue to affect largely unprepared<br />
communities, <strong>and</strong> often with little or no warning.<br />
Some events, such as the floods in Taiwan caused by<br />
Typhoon Morakot in August 2009, or in Manila<br />
caused by Typhoon Ketsana a month later, are<br />
results of extremely high rainfall, but the magnitude<br />
of casualties <strong>and</strong> damages is also a result of poor<br />
urban planning, clogged drainage systems, lack of<br />
early warning <strong>and</strong> poor preparedness.<br />
Floods are the most frequent disaster type globally<br />
(CRED, 2008), <strong>and</strong> in some parts of the world also<br />
the most costly. The generally straight<strong>for</strong>ward<br />
relationship between excessive upstream rainfall <strong>and</strong><br />
vulnerable areas exposed to potential flooding lends<br />
itself well to a geoin<strong>for</strong>matics-based risk assessment<br />
<strong>and</strong> management approach, <strong>and</strong> working examples<br />
have been widely reported. They can involve detailed<br />
maps of elements at risk <strong>and</strong> their associated flood<br />
vulnerabilities, satellite-based precipitation<br />
estimates, ground-based weather radar, river flow<br />
gauges, <strong>and</strong> sophisticated preparedness <strong>and</strong> early<br />
warning protocols. Many of the required data<br />
acquisition <strong>and</strong> analysis steps have become st<strong>and</strong>ard<br />
<strong>and</strong> automated, <strong>and</strong> hardware <strong>and</strong> data costs are<br />
diminishing, resulting in the implementation of such<br />
solutions also in economically less developed<br />
countries (LDCs).<br />
Weather services or related organisations in many<br />
countries are monitoring the synoptic weather<br />
situation <strong>and</strong> the levels of major rivers, <strong>and</strong> are able<br />
58<br />
to warn of impending floods. However, this is<br />
typically limited to major rivers or vulnerable urban<br />
areas. The part of the population that thus benefits<br />
less from such technical advances is the rural<br />
population especially in LDCs. According to World<br />
Bank estimates some 70% of the World's poor live in<br />
these areas, <strong>and</strong> whatever small development steps<br />
are made are readily compromised by frequent<br />
disaster events. This, there<strong>for</strong>e, raises the question<br />
to what extent geoin<strong>for</strong>matics-based flood<br />
management solutions can be scaled down <strong>and</strong><br />
adapted to rural areas. A solution developed as part<br />
of a German Technical Cooperation (GTZ) project in<br />
Leyte in the Eastern Visayas, the Philippines, is<br />
introduced in this best practice case.<br />
Flood Prone Areas in Binahaan Watershed<br />
Locator Maps<br />
Legend<br />
Municipal center<br />
The flood situation in the Philippines<br />
The Philippines is made up of more than 7000<br />
isl<strong>and</strong>s, <strong>and</strong> annually affected by two monsoon<br />
seasons <strong>and</strong> on average 9 typhoons that make<br />
l<strong>and</strong>fall. While those events can lead to exceptional<br />
rainfall, such as the 450mm in 1 day during Typhoon<br />
Ketsana, or the more than 2000mm in 2 days during<br />
Morakot in Taiwan, local flooding is frequent during<br />
monsoon times. The Philippines is a highly<br />
mountainous country, <strong>and</strong> sizeable catchments<br />
quickly drain large amounts of rainwater into<br />
downstream areas.<br />
Water level gauges<br />
Rain gauges<br />
Altitude (0-1400m)<br />
Binahaan River<br />
Figure 1: Location of the Binahaan watershed in<br />
the Eastern Visayas of the Philippines, <strong>and</strong><br />
overview of the flood monitoring system<br />
Flood Prone Area<br />
(from Mines <strong>and</strong><br />
Geoscience Bureau,<br />
2006, modified by GTZ)<br />
10km
The Philippine Atmospheric, Geophysical <strong>and</strong><br />
Astronomical Service Administration (PAGASA) is<br />
responsible <strong>for</strong> weather <strong>and</strong> flood <strong>for</strong>ecasts, <strong>and</strong><br />
does so with well instrumented <strong>and</strong> automated<br />
systems <strong>for</strong> major rivers. However, such approaches<br />
are not practical or af<strong>for</strong>dable <strong>for</strong> smaller rivers,<br />
most of which are consequently not being<br />
monitored. For these areas a geodata-based system<br />
may still be appropriate, although it has to be lowcost,<br />
robust, sustainable <strong>and</strong> depend on strong<br />
involvement of the local population. This best<br />
practice example describes a system where the local<br />
population is both involved in the data collection <strong>and</strong><br />
transmission, as well as in the early warning.<br />
The Binahaan River basin flood early warning<br />
system<br />
The Binahaan River is located in the province of<br />
Leyte in the Eastern Visayas of the Philippines<br />
(Figure 1). It stretches from a mountain ridge in the<br />
West to the Leyte Gulf in the East, covering an area of<br />
272km2. It has a history of frequent flooding events<br />
in the Eastern lowl<strong>and</strong>s, with an average of more<br />
than one damage-causing flood per year, <strong>and</strong> a small<br />
number of people having drowned during floods that<br />
occurred over the last 2 decades.<br />
The reported damages are largely attributed to<br />
reduced harvest due to submerged crops, mainly rice<br />
<strong>and</strong> some vegetables, <strong>and</strong> also residential buildings<br />
<strong>and</strong> infrastructure occasionally sustaining damages.<br />
An increase in water-borne communicable diseases<br />
has been observed as well. In the view of local<br />
inhabitants the loss of crop, <strong>and</strong> as a result income, is<br />
the most significant impact of the floods. Towards<br />
the end of the monsoon periods, when the capacity<br />
of the watershed to buffer more water is severely<br />
reduced, events with a relatively small return period<br />
may be especially serious by causing extensive <strong>and</strong><br />
widespread disruption.<br />
Objectives <strong>and</strong> basic setup of the LFEWS<br />
While not reducing the flood hazard, the<br />
establishment of early warning systems allows<br />
inhabitants of flood-prone areas to bring moveable<br />
items susceptible to water damage, such as harvests,<br />
livestock, household electronics, furniture <strong>and</strong><br />
motorized vehicles, to safety. This can be in higher<br />
parts of buildings or elevated areas near their<br />
dwellings. As a river basin sustaining frequent floods<br />
(more than one per year) <strong>and</strong> with a relatively large<br />
flood-prone area (64km2), the Binahaan was chosen<br />
as the first site <strong>for</strong> the establishment of a local flood<br />
early warning system (LFEWS) in Region VIII of the<br />
Philippines. The LFEWS was developed in<br />
accordance with basic principles of people-centred<br />
early warning systems.<br />
Rain + River<br />
Level Gauges<br />
Data<br />
Transmission<br />
Activities<br />
It consists of rain <strong>and</strong> river level gauges, an<br />
Operation Centre (OC) near the watershed where<br />
data are received, analyzed <strong>and</strong> the decision about a<br />
warning is taken. A communication chain down to<br />
household level facilitates the transmission of the<br />
warning. The LFEWS also includes evacuation<br />
routes, evacuation centres <strong>and</strong> emergency response<br />
capacity such as search <strong>and</strong> rescue teams (Figure 2).<br />
The provincial government of Leyte is running the<br />
system by setting up the OC, <strong>and</strong> coordinates the<br />
ef<strong>for</strong>ts of the four involved municipalities. They, in<br />
turn, contributed to the establishment of the system<br />
with some community-based approaches. This<br />
included hazard mapping with GPS <strong>and</strong> the<br />
development of disaster preparedness plans at<br />
village levels. The initial investments <strong>for</strong> the LFEWS<br />
(15,000 Euro) were paid by GTZ, <strong>and</strong> all running<br />
costs are covered by the provincial government. A<br />
cost-benefit-analysis estimated that the investment<br />
costs are recovered after eight years by reduced<br />
losses due to timely warnings.<br />
Generic Local Flood Early Warning System<br />
Activities<br />
Actors<br />
Operation<br />
Centre<br />
Analysis <strong>and</strong><br />
Warning<br />
Municipality<br />
Village<br />
Warning Warning<br />
Household<br />
Figure 2: Schematic overview of the Binahaan LFEWS<br />
59
Comm<strong>and</strong> <strong>and</strong> in<strong>for</strong>mation chain<br />
The central part of the LFEWS is a communication<br />
chain starting with reading <strong>and</strong> transmitting rainfall<br />
<strong>and</strong> river level data upstream to the OC. In case a<br />
threshold is exceeded a warning is issued by the OC<br />
<strong>and</strong> sent to the four municipalities. From there<br />
different villages are in<strong>for</strong>med, <strong>and</strong> the message is<br />
passed onto the households. Most steps of the chain<br />
use mobile <strong>and</strong> l<strong>and</strong>line phones, as well as radio<br />
communication. Households are often in<strong>for</strong>med with<br />
bells or megaphones, which is a simple but robust<br />
method.<br />
Warning colour scheme <strong>and</strong> communicating<br />
with the people<br />
The LFEWS supported by GTZ merges local<br />
engagement <strong>and</strong> modern technologies. The rain <strong>and</strong><br />
river level gauges are partly automatic, but many of<br />
them are manually read by volunteers from the<br />
community, with data sent by SMS to the OC. While<br />
most steps in the communication chain are covered<br />
by modern devices such as mobile phones or<br />
h<strong>and</strong>held radios, the final step in the chain is usually<br />
a bell made from a cut gas cylinder. Warnings have<br />
three stages: alert/st<strong>and</strong>by, preparation <strong>and</strong><br />
evacuation (Figure 3). Each stage has specific<br />
conditions to be fulfilled be<strong>for</strong>e the respective<br />
warning level is issued, <strong>and</strong> each stage requires a set<br />
of actions from different institutions such as<br />
emergency services or the preparation of evacuation<br />
centres. The Flood Warning Plan is customized <strong>for</strong><br />
the OC, the town <strong>Disaster</strong> Coordinating Councils<br />
(DCC) <strong>and</strong> the village DCCs. It comes in a colour<br />
scheme with yellow, orange <strong>and</strong> red <strong>for</strong> the three<br />
stages. The acoustic warning signals are easily<br />
recognised. One bang with a long break is Level 1,<br />
two bangs with a long break after is Level 2 <strong>and</strong><br />
continuous banging is Level 3.<br />
60<br />
The potential of low-cost geodata <strong>and</strong> tools in local<br />
flood early warning<br />
In Binahaan it has been difficult to characterize the<br />
watershed <strong>and</strong> the flood prone area from locally<br />
available geodata sources. The official topographic<br />
map is 50 years old <strong>and</strong> little statistical data on the<br />
socio-economic situation are available. Satellite data<br />
can partly fill this gap. The elevation distribution, the<br />
current river bed, <strong>and</strong> the l<strong>and</strong> cover/l<strong>and</strong> use were<br />
identified using Shuttle Radar Topography Mission<br />
[SRTM] (Kummerow et al., 1998) or Aster Global<br />
Digital Elevation Model [GDEM] (see<br />
http://asterweb.jpl.nasa.gov/gdem.asp), <strong>and</strong><br />
SPOT/ASTER optical imagery (e.g. Figure 4).<br />
Figure 3: Colour-coded alerting<br />
scheme used in the LFEWS.
The local capacity to use geoin<strong>for</strong>matics <strong>for</strong> LFEWS<br />
is gradually growing but still limited to a small<br />
number of institutions, such as universities <strong>and</strong> a<br />
few others. Substantial training is needed to enable<br />
more institutions to make full use of the potential of<br />
remote sensing <strong>and</strong> GIS tools. Cost remains a factor<br />
limiting the spreading of geoin<strong>for</strong>matics to many<br />
offices. However, the potential of free or low cost<br />
tools <strong>and</strong> data in flood risk management is<br />
substantial. There are several free <strong>and</strong> open-source<br />
(FOSS) GIS <strong>and</strong> remote sensing programs covering a<br />
wide range of tasks. Nevertheless, <strong>for</strong> specific<br />
processing tasks, such as <strong>for</strong> actual flood modeling<br />
or more advanced image processing, commercial<br />
software is still needed, <strong>and</strong> was also used in the<br />
setting up of the Binahaan LFEWS. Use was made of<br />
free or low-cost satellite data (e.g. L<strong>and</strong>sat, SRTM, or<br />
GDEM). The project also used SPOT data obtained<br />
via a Planet Action project of SPOT Imaging, which<br />
supports projects related to adaptation to climate<br />
change. Also the potential of 3-hourly data from the<br />
Tropical Rainfall Measurement Mission (TRMM)<br />
satellite to estimate real-time rainfall was assessed.<br />
These data are available without charge via the<br />
internet. Historical ground rainfall measurements<br />
were compared with the respective TRMM data.<br />
However, <strong>for</strong> the watershed size considered here, the<br />
error of the TRMM data was too large <strong>for</strong> the data to<br />
be used <strong>for</strong> warning purposes. Nevertheless, the data<br />
have been used successfully elsewhere, <strong>and</strong> new<br />
instruments <strong>and</strong> algorithms suggest that satellitebased<br />
rainfall estimates may soon be reliable enough<br />
<strong>for</strong> most areas. Their most significant advantage is<br />
that <strong>for</strong> areas where no rain or river gauges exist,<br />
early warning will still be possible. Even where<br />
ground instruments are available, real-time satellite<br />
estimates mean an extra time advantage<br />
Figure 4: L<strong>and</strong> use map of Binahaan river basin based on SPOT <strong>and</strong> ASTER data.<br />
61
Accomplishments <strong>and</strong> limitations<br />
The Binahaan River LFEWS has been operating since<br />
2007 <strong>and</strong> largely without flaws (see also<br />
http://www.leyte.org.ph/binahaan/). This means it<br />
did not miss a single flooding event <strong>and</strong> it did not<br />
issue a false alarm. It was activated 13 times, giving<br />
residents between 3 <strong>and</strong> 10 hours to move<br />
possessions <strong>and</strong> evacuate. This also includes<br />
warnings at Level 1 that do not always lead to a Level<br />
2 situation. A survey revealed that the majority of<br />
inhabitants of the flood-prone area are satisfied with<br />
the LFEWS, <strong>and</strong> that flood damage has been reduced.<br />
The data currently available <strong>for</strong> the hydrology <strong>and</strong><br />
characteristics of the watershed (e.g. slope map) are<br />
not sufficiently precise to run actual computer flood<br />
models. This is a constraint, especially when it comes<br />
to rare but very high floods not experienced by the<br />
generation of people currently living in the river<br />
basin. It was also observed that data gathering by<br />
community volunteers is at times erratic <strong>and</strong> does<br />
not provide enough reliability <strong>for</strong> basing the whole<br />
system on volunteer contributions.<br />
The LFEWS introduced here is an effective tool to<br />
issue early warnings <strong>and</strong> thus increase preparedness<br />
<strong>and</strong> reduce damage. However, disaster risk<br />
management (DRM) is a comprehensive strategy<br />
that should also include other aspects of risk<br />
reduction, such as careful urban <strong>and</strong> regional<br />
planning (e.g. prohibiting settlements in highly<br />
flood-prone areas), or flood hazard reduction via<br />
af<strong>for</strong>estation in the watershed (Smith, 2004; Wisner<br />
et al., 2003). Geoin<strong>for</strong>matics has been shown to be<br />
highly useful <strong>for</strong> all aspects of DRM <strong>and</strong> virtually all<br />
natural hazard types (Ebert et al., 2009; Kerle et al.,<br />
2008; Zhang <strong>and</strong> Kerle, 2008), but a real ef<strong>for</strong>t is<br />
needed to set up <strong>and</strong> maintain such systems,<br />
62<br />
which includes building <strong>and</strong> retaining the required<br />
human <strong>and</strong> technical capacity to lead to a lasting<br />
increase in capacity to face environmental hazards<br />
(Smit <strong>and</strong> Pilifosova, 2003). The Binahaan system<br />
demonstrates how low-cost solutions can be as<br />
effective as expensive monitoring installations,<br />
provided they have appropriate political support as<br />
well as that of the affected people, i.e. they have a<br />
sense of ownership.
Development <strong>and</strong> Testing of a Low<br />
Cost Sensor PDGNSS L<strong>and</strong>slide<br />
Monitoring System using the<br />
Example of the Aggenalm L<strong>and</strong>slide<br />
in the Bavarian Alps<br />
Jessica Glabsch, Otto Heunecke, Stefan Schuhbäck<br />
Institute of Geodesy, University of the Federal Armed Forces of<br />
Germany in Munich,Werner-Heisenberg-Weg 39, D-85577<br />
Neubiberg, Email: jessica.glabsch / otto.heunecke /<br />
stefan.schuhbaeck@unibw.de<br />
EIntroduction<br />
Exclusive geodetic <strong>and</strong> geotechnical instrumentation<br />
<strong>for</strong> l<strong>and</strong>slide monitoring tasks is available today but<br />
<strong>for</strong> economical reasons it is not used on a broad<br />
scale. At the same time the number of localities with<br />
urgent need <strong>for</strong> surveillance is rising due to global<br />
climate change, increasing tourism in mountainous<br />
areas <strong>and</strong> the build-up of new infrastructure objects<br />
such as settlements, roads <strong>and</strong> railways. This lack of<br />
adequate surveillance in future can only be<br />
overcome using more cost-effective powerful<br />
surveillance techniques. Furthermore, monitoring<br />
systems should ensure the delivery of data <strong>and</strong><br />
meaningful results to all involved stakeholders,<br />
using permanently open interfaces. In this sense<br />
such monitoring systems should be seen as an<br />
essential part of the spatial data infrastructure.<br />
63
Satellite based positioning techniques are very<br />
commonly used <strong>for</strong> geodetic monitoring of objects<br />
such as l<strong>and</strong>slides. Currently a low cost (LC) PDGNSS<br />
monitoring system on a commercial off-the-shelf<br />
basis, has been developed at the Institute of Geodesy,<br />
University of the Federal Armed Forces of Germany<br />
in Munich (Pink 2007, Günther et al. 2008, Glabsch<br />
et al. 2009) as a cost-effective readily available<br />
technique <strong>for</strong> monitoring tasks.<br />
GNSS NRTP approach - brief theory<br />
To meet the required accuracies of a few millimetres<br />
<strong>for</strong> point position in monitoring applications, only<br />
carrier phase (CP) based GNSS methods come into<br />
consideration, which is the so-called precise<br />
differential positioning (PDGNSS). By using PDGNSS<br />
techniques to observe discrete points permanently<br />
in a monitoring network, the results should be<br />
available with a minimum of delay, involving near<br />
real-time processing (NRTP). This approach is based<br />
on the evaluation of CP measurements recorded over<br />
certain, in principle freely <strong>and</strong> individually selectable<br />
time spans at different locations. Depending on the<br />
receivers, the satellite visibility <strong>and</strong> the expected<br />
velocities of the points, usually a time interval of<br />
about 15min referred to as an 'epoch' in the<br />
following with a recording frequency of 1Hz or<br />
similar can be considered <strong>for</strong> the CP raw data<br />
acquisition <strong>for</strong> l<strong>and</strong>slide monitoring tasks. Once the<br />
raw data from several locations at least one should<br />
be on stable ground <strong>and</strong> the others are spread on the<br />
slope is available at a central computing location the<br />
baseline processing can start immediately.<br />
64<br />
St<strong>and</strong>ard WLAN can be chosen <strong>for</strong> permanent<br />
wireless communication between the different<br />
locations <strong>and</strong> the central computing station. Thus the<br />
combination of sensing, communication <strong>and</strong><br />
affiliated computing <strong>for</strong>ms a geo-sensor network<br />
(GSN) <strong>and</strong> the locations the reference <strong>and</strong> object<br />
points are designated as sensor nodes (SNs). Since<br />
the distances range up to several kilometers,<br />
normally special WLAN antennas or alternatively<br />
repeater stations are needed on site.<br />
For economical reasons simple LC L1 navigation<br />
receivers have been investigated at the Institute of<br />
Geodesy (Pink 2007, Günther et al. 2008, Glabsch et<br />
al. 2009) as the sensor component at the SNs. The<br />
main prerequisite of these receivers is that they must<br />
have the possibility to read-out the CP raw data, <strong>for</strong><br />
instance via RS232 or USB. Most of the simple<br />
navigation receivers make use of these data <strong>for</strong> some<br />
internal smoothing operations, but do not have the<br />
ability of an autonomous phase-based positioning, as<br />
do the customary rovers commonly available in the<br />
real-time kinematic (RTK) systems. Finally, the<br />
chosen NRTP concept opens up the possibilities of<br />
the well-known options of highly sophisticated postprocessing<br />
<strong>for</strong> all kinds of simple receivers in a<br />
geodetic monitoring network adjustment, which are<br />
of course not solely restricted to low cost equipment.<br />
In addition to the length of an epoch, a short delay<br />
due to gathering <strong>and</strong> evaluating all data at the<br />
computing station has to be accepted in applying this<br />
concept. Considering the expected l<strong>and</strong>slide<br />
movement rates <strong>and</strong> the essential advanced warning<br />
times, the concept of “near real-time” should present<br />
no limitations on its intended use <strong>for</strong> early warning<br />
of l<strong>and</strong>slides.<br />
System layout - example of GSN Aggenalm<br />
(project alpEWAS)<br />
Aggenalm L<strong>and</strong>slide monitoring concept<br />
The Aggenalm L<strong>and</strong>slide will be discussed as a<br />
practical realization of the above briefly described LC<br />
PDGNSS NRTP approach. This work is embedded in a<br />
comprehensive development of a widespread <strong>and</strong><br />
cost-effective GSN <strong>for</strong> l<strong>and</strong>slide monitoring in the<br />
alpEWAS project. The project is funded by the<br />
German Federal Ministry of Education <strong>and</strong> Research<br />
(BMBF) in the geo-scientific research <strong>and</strong><br />
development program “Geotechnologien”. For more<br />
details please see Thuro et al. (2009a, 2009b) <strong>and</strong><br />
refer to www.alpewas.de.<br />
Innovative geodetic <strong>and</strong> geotechnical measuring<br />
techniques are applied <strong>for</strong> monitoring the l<strong>and</strong>slide<br />
mechanisms at the test site Aggenalm in the<br />
Bavarian Alps. Time Domain Reflectometry (TDR)<br />
which is an automated low cost inclinometer, low<br />
cost Global Navigation Satellite System receivers<br />
(GNSS) <strong>and</strong> a recently developed reflectorless Video-<br />
Tacheometric Positioning System (VTPS) are being<br />
investigated in this project. By combining the data of<br />
all these different measuring systems, 3D<br />
de<strong>for</strong>mation in<strong>for</strong>mation can be derived not only<br />
with high spatial, but also with high temporal<br />
resolution, as all three systems can operate<br />
continuously. However, at present, the VTPS is used<br />
only temporarily at the Aggenalm L<strong>and</strong>slide site. The<br />
three techniques are combined in a multifunctional<br />
GSN as shown schematically in Fig. 1. All sensor<br />
nodes can be read at two places which are connected<br />
to the base station. All data traffic is h<strong>and</strong>led in a<br />
WLAN supplemented by some cabled connections<br />
<strong>for</strong> economical <strong>and</strong> practical reasons. A central<br />
computer manages all system operations, e.g. data<br />
collection <strong>and</strong> logging <strong>and</strong> controlling of the sensor
nodes. For remote maintenance <strong>and</strong> supervising a<br />
DSL internet connection via satellite is set up at the<br />
base station using additionally a relay station at the<br />
so-called main sensor node. The central station is a<br />
personal computer <strong>and</strong> hence connected to the local<br />
power network (220 V). At the Aggenalm L<strong>and</strong>slide,<br />
although not m<strong>and</strong>atory, the main sensor node with<br />
a high diversity of different sensors <strong>and</strong><br />
functionalities is also cable-connected to the local<br />
power network. All other sensor nodes have a<br />
battery-operated autarkic power supply (solar panel,<br />
charge controller <strong>and</strong> battery). An additional fuel cell<br />
is installed at the GNSS reference sensor node,<br />
because during winter the solar radiation at this<br />
location is very low. In the following only the GNSS<br />
component of the GSN Aggenalm is described.<br />
Figure 1: Schematic<br />
configuration of the<br />
GSN Aggenalm<br />
L<strong>and</strong>slide<br />
(Thuro et al. 2009a).<br />
LC PDGNSS hardware components<br />
Sensor component<br />
To meet harsh environmental conditions, Novatel<br />
Smart Antennas are selected as positioning sensors.<br />
This receiver type is an encapsulated system of<br />
board <strong>and</strong> antenna. See Fig. 2a <strong>for</strong> some<br />
specifications. Two different models are used at<br />
present: older Superstar II receivers with GPS<br />
functionality only; <strong>and</strong> the newer OEMV-1G receivers<br />
providing GPS <strong>and</strong> GLONASS functionality. Besides<br />
code based position, the carrier phase is recorded<br />
<strong>and</strong> can be read-out by the serial port. Depending on<br />
the satellite visibility such a 12/14 channel L1<br />
receiver with a recording frequency of 1Hz generates<br />
about 0.3 0.6MByte of binary data in a time period<br />
of 15min.<br />
Selected specifications:<br />
Rec. type<br />
No. channels<br />
Accuracy<br />
CP<br />
Novatel<br />
Smart Antenna<br />
Superstar II<br />
12 L1 GPS<br />
1 cm rms<br />
Weight: 575 g<br />
Size:<br />
115 mm diameter x<br />
90 mm height<br />
Novatel Smart-<br />
V1G Antenna<br />
OEMV-1G<br />
14 L1 GPS<br />
12 L1 Glonass<br />
0.15 cm rms<br />
Figure 2a: Novatel Smart <strong>and</strong> Smart-V1G Antenna.<br />
Figure 2b: GNSS SN (Novatel Smart Antenna, WLAN-<br />
Antenna, solar panel, alu-box with battery, charge<br />
controller <strong>and</strong> wireless device server).<br />
65
Communication component<br />
Widespread <strong>and</strong> cost-effective deployment of a GSN<br />
especially needs to make use of commercial off-theshelf<br />
wireless communication techniques <strong>and</strong><br />
st<strong>and</strong>ardized protocols. An infrastructural WLAN is<br />
used <strong>for</strong> the connection of the SNs in the field.<br />
Compared with conventional radio data<br />
transmission, the key benefits of a WLAN are: more<br />
cost-effective acquisition; easier addressability of the<br />
SNs; lower power consumption in autarkic usage;<br />
not subject to authorisation requirements; different<br />
possibilities of encryption exist; <strong>and</strong> a suitable high<br />
data transfer rate is achievable, which is a<br />
precondition <strong>for</strong> using the LC PDGNSS approach.<br />
All measuring devices are connected to<br />
wireless/wired device servers, which normally<br />
operate with two or more serial ports. Such a unit<br />
serves as a serial port to an Ethernet converter <strong>and</strong><br />
comprises an essential interface between every SN<br />
<strong>and</strong> the communication network. To bridge distances<br />
of more than 500m, special external antennas are<br />
used to provide adequate WLAN connectivity, even<br />
in environmental extremes such as heavy rain, ice<br />
<strong>and</strong> snow. However, a more or less free line-of-sight<br />
between the transmitters <strong>and</strong> receptors is essential.<br />
Autarkic power management<br />
Secure energy supply of the SNs is of top priority,<br />
especially <strong>for</strong> long-term monitoring without loss of<br />
data <strong>and</strong> permanent year-round operability in<br />
mountainous regions. The concept at Aggenalm<br />
provides solar panels together with back-up<br />
batteries. Additionally fuel cells are an alternative<br />
option. Based on the total power consumption of<br />
about 2.9W <strong>for</strong> a single LC PDGNSS SN as shown in<br />
Fig. 2b, back-up batteries with a capacity of 130Ah<br />
are chosen to enable the system to operate<br />
66<br />
continuously <strong>for</strong> up to 20 days without need <strong>for</strong><br />
recharging. This time span called autonomy factor<br />
seems to be suitable <strong>for</strong> Alpine environmental<br />
conditions which receive snow <strong>for</strong> nearly 6 months<br />
in a year <strong>and</strong> have long periods of overcast sky.<br />
Charge controllers protect the batteries from total<br />
discharge or overcharge <strong>and</strong> also transmit metadata<br />
to the system administrator predicting potential<br />
failures caused by power shortfalls.<br />
Computing resources<br />
The data sink <strong>and</strong> processing unit is implemented by<br />
a customary personal computer. Dem<strong>and</strong>s <strong>for</strong><br />
PDGNSS computing resources at the Aggenalm are<br />
small due to the fact that there are only four SNs onsite.<br />
For a steady program running an uninterrupted<br />
power supply (UPS) is highly recommended. Remote<br />
access <strong>and</strong> control by a host computer using an<br />
internet connection is an indispensable element of<br />
the developed system, especially because of<br />
maintenance <strong>and</strong> data backups. Due to missing<br />
infrastructural requirements this is per<strong>for</strong>med by<br />
SkyDSL in the Aggenalm project, see Fig. 1.<br />
Software<br />
Data h<strong>and</strong>ling <strong>and</strong> processing is accomplished<br />
by several different software packages based<br />
on a modular design. The core of the PDGNSS<br />
monitoring component is the Central Control<br />
Application (CCA), see Fig. 3. It is developed<br />
using the graphical programming language<br />
LabView®, National Instruments. All<br />
necessary steps from system initialization,<br />
data collection, to the h<strong>and</strong>over of processed<br />
<strong>and</strong> checked baselines <strong>for</strong> subsequent time<br />
series analysis, are actuated <strong>and</strong> supervised.<br />
Several subprograms, e.g. sensor activation<br />
are termed as virtual instruments (VIs).<br />
The modular, prospective design offers the option to<br />
integrate a great diversity of PDGNSS sensors<br />
(Glabsch et al. 2009b). Interfaces permit embedding<br />
of existing <strong>and</strong> proven software packages, especially<br />
<strong>for</strong> baseline processing with e.g. Waypoint GrafNav<br />
(Waypoint 2007). From every embedded software<br />
tool a comm<strong>and</strong> line based control is the essential<br />
requirement. Some more details of the CCA are given<br />
in Glabsch et al. (2009a).<br />
Figure 3: Central Control Application (CCA) work<br />
flow (see Glabsch et al. 2009a).
Some results<br />
The LC PDGNSS system at Aggenalm passed the<br />
first practical test in winter 2008/09 very<br />
satisfactorily. Snow coverage of 2 metres <strong>and</strong><br />
temperatures below -15°C had no negative effects<br />
on the different components. A winter impression<br />
from the site is presented with Fig. 4. Data<br />
recording has operated without failure since<br />
February 2009. Springtime with snow melt, which<br />
is generally a period of extraordinary concern <strong>for</strong><br />
l<strong>and</strong>slide movement processes, <strong>and</strong> also a period<br />
of continuous <strong>and</strong> heavy rainfall in June 2009,<br />
could be completely observed.<br />
Figure 4: Winter impression at Aggenalm<br />
L<strong>and</strong>slide. The picture shows a Novatel PDGNSS<br />
sensor <strong>and</strong> the weather station.<br />
Figure 5: Shadowing situation at the Aggenalm. On the right an obstacle mask <strong>for</strong> the baseline between SN #1 <strong>and</strong><br />
#4 <strong>for</strong> a time slot of 2 hours in summer 2009.<br />
However, no detailed assessment of the slide will<br />
be per<strong>for</strong>med here. In focus is only the achievable<br />
data quality with the developed LC PDGNSS<br />
system.<br />
However, the “raw” GNSS solutions which means<br />
the epoch solutions from the baseline processing<br />
of each sensor on the slope, have to be filtered to<br />
reject outliers <strong>and</strong> to bypass gaps. Outliers mainly<br />
occur due to temporary bad satellite visibility<br />
(typically shadowing effects in mountainous areas).<br />
With an increased number of satellites in future,<br />
hopefully a much better coverage will be available<br />
<strong>and</strong> reliable GNSS-based positioning will be<br />
permanently possible, even under often restricted<br />
conditions at l<strong>and</strong>slide sites (see Fig. 5).<br />
The quality of the processed horizontal position<br />
raw data (height is worse by a factor of 3) of<br />
sensor #3 (Lampl Alm) <strong>for</strong> a selected day is shown<br />
as an example in Fig. 6. After the elimination of<br />
incorrect measurements the total variations of the<br />
horizontal positions are clearly less than 1.5cm.<br />
67
68<br />
Figure 6: Variations of the horizontal position during a representative day. Depicted are the<br />
15min. solutions of SN #3 where all outliers are eliminated <strong>and</strong> the gaps are closed.<br />
Figure 7a: Medium-term trend of SN #2 (moving average filter of 6 hours between February<br />
<strong>and</strong> December 2009). Even small movements (in downhill direction) are quite clear. The<br />
estimated movement rates of the slide from <strong>for</strong>mer sporadic measurements are at the order of<br />
2cm per year which can be confirmed by the developed system. However, small gaps due to<br />
system breakdown <strong>and</strong> other failures in March <strong>and</strong> December can also be seen.<br />
Figure 7b: Medium-term trend of SN #3 (moving average filter of 6 hours between February<br />
<strong>and</strong> December 2009). For interpretation see text at Fig7a.<br />
In order to predict long term trends of the<br />
de<strong>for</strong>mation process the use of longer filter intervals,<br />
e.g. 6 hours, is applicable. Referring to Fig. 7a <strong>and</strong> 7b<br />
even small movements are clearly become visible,<br />
e.g. in springtime under the influence of snow melt<br />
(April May) or periods of heavy rainfall (which<br />
occurred at the end of June 2009 in the Alps).<br />
The depicted results of the LC PDGNSS monitoring<br />
system <strong>and</strong> especially the fact that measuring data is<br />
available in near real-time with a high spatialtemporal<br />
resolution, allows further geological<br />
assessment <strong>and</strong> interpretation of the l<strong>and</strong>slide. In<br />
combination with data from other systems (e.g. TDR,<br />
video-tacheometer <strong>and</strong> weather station at<br />
Aggenalm) an additional benefit <strong>for</strong> geo-mechanical<br />
models <strong>and</strong> prediction of collapse can be obtained by<br />
an integrative analysis. In contrast to relative<br />
measurement methods such as TDR in boreholes or<br />
extensometers <strong>for</strong> the surveillance of cleavings,<br />
PDGNSS provides absolute 3D positions allowing<br />
reliable statements about absolute motions <strong>and</strong> the<br />
precise direction in space. The developed LC PDGNSS<br />
monitoring component there<strong>for</strong>e can be seen as a<br />
key system <strong>for</strong> economic l<strong>and</strong>slide monitoring.<br />
However, further ef<strong>for</strong>t has to be made to increase<br />
reliability <strong>and</strong> accuracy. The actual work<br />
concentrates on a comprehensive quality<br />
management <strong>and</strong> on developing additional<br />
processing <strong>and</strong> estimation procedures within the<br />
CCA.
Interoperable data access - Integration of the<br />
PDGNSS component in the evaluation concept<br />
at the Aggenalm L<strong>and</strong>slide<br />
One important aspect <strong>for</strong> an up-to-date monitoring<br />
system is ease of use of the results. Status<br />
in<strong>for</strong>mation of the observed object - including<br />
manifold metadata - should be attained as fast as<br />
possible <strong>and</strong> easily underst<strong>and</strong>able to the<br />
corresponding users (e.g. administrators, experts,<br />
stakeholders, common viewers). In times of<br />
worldwide network-links by the internet,<br />
interoperability has top priority. Trouble-free data<br />
exchange between heterogeneous systems is only<br />
possible with st<strong>and</strong>ardized interfaces. There<strong>for</strong>e<br />
providing open, st<strong>and</strong>ardized interfaces is an<br />
essential criterion.<br />
Interoperable data exchange requires the<br />
unavoidable renunciation of file-based data storage<br />
to a flexible <strong>and</strong> powerful (geo) database solution.<br />
The management of huge amounts of data with<br />
parallel <strong>and</strong> permanent access shared normally by<br />
several different users is possible due to modern<br />
data base management systems (DBMS). To satisfy<br />
requirements of “interoperability”, the GSN at<br />
Aggenalm L<strong>and</strong>slide uses an open source MySQL<br />
database. The data flow <strong>and</strong> interaction of the three<br />
different measuring methods is depicted<br />
schematically in Fig. 8. The LC PDGNSS component<br />
fits into the complete system as a so-called “sensor<br />
plug-in”. The flexible design of the developed<br />
software package described in section 3.3 allows<br />
st<strong>and</strong>alone adaptation, as well as trouble-free<br />
integration in a more complex data flow.<br />
Figure 8: Structure of the<br />
alpEWAS sensor control<br />
<strong>and</strong> data management<br />
solution. The hatched<br />
elements are currently<br />
still under development<br />
(Thuro et al. 2009b).<br />
69
Conclusion<br />
The LC PDGNSS NRTP approach described above<br />
demonstrates today's possibilities in monitoring<br />
tasks with cost-effective satellite methods. The<br />
achievable data quality using LC PDGNSS equipment<br />
is characterized briefly. Finally, the assignment of a<br />
flexible database solution meets the compulsory<br />
requirement of interoperable data exchange.<br />
It becomes apparent that while results obtained so<br />
far are already very satisfactorily, there is a further<br />
need <strong>for</strong> intensive research <strong>and</strong> development. Our<br />
main work actually concentrates on improving<br />
accuracy <strong>and</strong> reliability of the system, <strong>and</strong> as well on<br />
investigation of suitable “cheap” GNSS sensors. Of<br />
course the developed system can also be embedded<br />
<strong>for</strong> location finding in any widespread<br />
multifunctional GSN <strong>and</strong> is not restricted to l<strong>and</strong>slide<br />
monitoring.<br />
Acknowledgement<br />
The project “alpEWAS” is supported by a grant of the<br />
German Ministry of Economy <strong>and</strong> Technology within<br />
the Geotechnology Program.<br />
70
Tunnel Monitoring <strong>and</strong> Alarming<br />
Controlled by a Project In<strong>for</strong>mation<br />
System<br />
Introduction<br />
S<br />
Klaus Chmelina<br />
Geodata ZT GmbH, Hütteldorferstraße 85, A-1150 Vienna,<br />
Austria, klaus.chmelina@geodata.at, www.geodata.com<br />
Severe disasters happen quite often in underground<br />
construction projects such as at urban tunnel sites<br />
(see Fig. 1). After such man-made disasters we<br />
always ask the same questions: Could we have been<br />
warned? Could this have been avoided?<br />
In order to ensure tunnel construction projects are<br />
safe <strong>and</strong> better managed, Kronos has been<br />
developed <strong>and</strong> has already been successfully applied<br />
in a number of projects. Kronos is an integrated<br />
in<strong>for</strong>mation system allowing <strong>for</strong> the acquisition,<br />
checking, storage, analysis, visualisation, reporting,<br />
<strong>and</strong> finally a warning system <strong>for</strong> tunnel project data.<br />
Its particular advantage is that, compared to existing<br />
solutions, all safety-relevant data produced on site<br />
(e.g. monitoring data) is integrated into one single<br />
data management system <strong>and</strong> utilized by most<br />
modern <strong>and</strong> efficient alarm functions. This makes<br />
possible the automatic execution of complex<br />
monitoring <strong>and</strong> alarm processes including<br />
thous<strong>and</strong>s of data sources such as online monitoring<br />
sensors <strong>and</strong> tunnelling machines. The system is<br />
described briefly <strong>and</strong> two major European tunnel<br />
construction sites are presented as examples of its<br />
use to monitor <strong>and</strong> provide alarms on impending<br />
disasters.<br />
Figure 1: Recent tunnel collapses, from upper left to lower<br />
right: Sao Paolo 2007 Cologne 2009 Hangzhou 2008<br />
Munich 1994 Lausanne 2005 Singapore 2004<br />
71
Kronos<br />
Kronos is an in<strong>for</strong>mation system developed by<br />
Geodata that is designed to store, manage <strong>and</strong> utilize<br />
the data categories shown in Fig. 2.<br />
Authorized users can access the system either locally<br />
or remotely (e.g. via internet) through user-friendly<br />
interfaces to carry out data input/output or<br />
import/export, produce various types of problemoriented<br />
visualisations, etc. Integrated services<br />
per<strong>for</strong>m automatic data acquisition, reporting <strong>and</strong><br />
alarms <strong>and</strong> are capable to transfer huge volumes of<br />
data from <strong>and</strong> to the system without user<br />
interaction.<br />
Kronos at Budapest Metro Line M4<br />
Project introduction<br />
The new line M4 of Budapest Metro (see Fig. 3)<br />
connects the districts Kelenföld in Buda <strong>and</strong><br />
Rakospalota in Pest. The line has a length of 7.2 km<br />
with 10 stations. The excavation of the two parallel<br />
tunnels is done with two Tunnel Boring Machines<br />
(TBM), each having a total length of 113 m <strong>and</strong> a<br />
cutter head diameter of 6.1 m. The difficult<br />
geological conditions on the side of Pest, the passage<br />
72<br />
Figure 2: Data categories covered by the in<strong>for</strong>mation system Kronos<br />
under historical buildings, <strong>and</strong> the<br />
crossing of the river Danube with<br />
a minimum of overburden created<br />
a major challenge <strong>for</strong> the<br />
engineers responsible <strong>for</strong> the<br />
execution of an extensive<br />
geotechnical monitoring program.<br />
The station buildings are<br />
constructed by cut <strong>and</strong> cover <strong>and</strong>,<br />
partly with the New Austrian<br />
Tunnelling Method (NATM).<br />
Figure 3: Map of Budapest Metro line M4 displayed in Kronos<br />
Kronos application<br />
The geotechnical monitoring at Budapest Metro is<br />
based on different types of monitoring sensors such<br />
as 3d targets (measured with totalstations), levelling<br />
points, inclinometers, tilt meters, rod extensometers,<br />
etc. A total of nearly 10.000 monitoring sensors <strong>and</strong><br />
points are installed in the city on the surface <strong>and</strong><br />
underground.
Figure 4: Kronos user interface showing a live-map situation of<br />
Budapest city with monitoring points in alarm status while two<br />
tunnel boring machines are excavating underground.<br />
Figure 5: Thessaloniki Metro overview map<br />
Their monitoring data are transferred periodically<br />
from Budapest to the Geodata office in Graz<br />
(Austria), where the Kronos database server is<br />
located. There, all data are stored <strong>and</strong> an automatic<br />
alarm service is operating. The service manages <strong>and</strong><br />
executes 260 alarm rules at 3 alarm levels (warning,<br />
alert, alarm) that permanently check all data <strong>and</strong> in<br />
the case of a potential emergency immediately <strong>and</strong><br />
automatically sends alarms to about 31 different<br />
alarm receivers on site. As the system not only<br />
captures monitoring data but also integrates further<br />
project data (e.g. TBM progress), all data can be<br />
linked <strong>and</strong> used <strong>for</strong> alarms <strong>and</strong> interpretation. Fig. 4<br />
shows an example where monitoring points on the<br />
surface (some indicating an alarm) are displayed<br />
live, together with the actual positions of the two<br />
operating TBMs so that their influence on the<br />
monitored de<strong>for</strong>mations can be better interpreted.<br />
Kronos can also use the TBM data to dynamically<br />
change the current alarm levels of the monitoring<br />
sensors <strong>and</strong> points <strong>and</strong>/or even automatically<br />
increase their measuring frequency. In this way, a<br />
dynamic monitoring <strong>and</strong> alarm notification can be<br />
per<strong>for</strong>med. A unique characteristic of this project is<br />
that the system installation follows a modern server<br />
hosting concept where data is not stored locally onsite,<br />
but transferred over hundreds of kilometres<br />
(including across a state border) to a remote, subcontracted<br />
data processing centre that is accessed<br />
<strong>and</strong> distributes data via the internet.<br />
Figure 6: Measurement data transferred monthly to Kronos at Thessaloniki Metro<br />
73
Kronos at Thessaloniki Metro<br />
Project introduction<br />
The currently built Thessaloniki metro<br />
network (see Fig. 5) comprises 13 modern<br />
plat<strong>for</strong>m stations <strong>and</strong> 9.5 km of track (with<br />
two independent single track tunnels)<br />
constructed mostly (7.7 km) by means of<br />
two tunnel boring machines. The<br />
remaining section of the line is constructed<br />
by the cut <strong>and</strong> cover method.<br />
Kronos application<br />
For the Thessaloniki project Kronos takes<br />
over responsibility <strong>for</strong> monitoring, data<br />
management <strong>and</strong> emergency alarms, but<br />
also per<strong>for</strong>ms additional tasks such as the<br />
on-line transfer <strong>and</strong> display of data from<br />
tunnel boring machines <strong>and</strong> automatic<br />
measurement systems, geological<br />
documentation, <strong>and</strong> document<br />
management <strong>and</strong> automatic reporting. Onsite,<br />
more than 30 different users (experts<br />
from the client <strong>and</strong> contractor) are<br />
connected to the system <strong>and</strong> receive all<br />
necessary project data, <strong>and</strong> if desired even<br />
automatically generated <strong>and</strong> periodically<br />
sent reports. To guarantee the safety of the<br />
overlaying <strong>and</strong> adjacent buildings <strong>and</strong><br />
structures <strong>and</strong> to verify the assumptions<br />
made during the project planning, a huge<br />
geotechnical monitoring program is<br />
executed.<br />
74<br />
Figure 7: Contour map of settlements measured by automatic totalstations that are<br />
connected online to the system allows <strong>for</strong> live-interpretation of subsidence.<br />
I
It employs numerous computer controlled onlinesensors<br />
such as geodetic totalstations that<br />
automatically measure every few seconds the 3D<br />
coordinates of hundreds of targets installed on<br />
buildings <strong>and</strong> other structures. Fig. 6 shows the huge<br />
volumes of measured data transferred to <strong>and</strong><br />
managed by the system month-by-month, which at<br />
its peak reached 300.000 measurements per month.<br />
In the project the Kronos database server is installed<br />
locally <strong>and</strong> also maintained by a local administrator.<br />
The many different data sources/providers in the<br />
project are either connected online or obliged to<br />
provide their data in specified data <strong>for</strong>mats to assure<br />
uni<strong>for</strong>m data quality <strong>and</strong> appropriate data transfer<br />
speeds. From the distributed sources an automatic<br />
data collection service transfers, checks <strong>and</strong> imports<br />
the data to the database. In case of missing data or<br />
data quality problems, corresponding feedback is<br />
given immediately. After successful data imports all<br />
available online data displays are refreshed (see Fig.<br />
7 <strong>and</strong> 8) <strong>and</strong> all further services invoked (e.g. the<br />
alarms).<br />
Conclusion<br />
The two examples described represent best practice<br />
on how a modern in<strong>for</strong>mation system supports<br />
monitoring <strong>and</strong> alarming <strong>for</strong> tunnel construction<br />
sites. Its main advantage is that it accomplishes a<br />
highly efficient site data management where all data<br />
is integrated into one central plat<strong>for</strong>m <strong>and</strong> where<br />
well-organized <strong>and</strong> systematic data transfer from<br />
<strong>and</strong> to this plat<strong>for</strong>m is realized. No longer is it<br />
necessary to deal with data that is stored in various<br />
different, disconnected <strong>and</strong> incompatible systems.<br />
Problems arising from time consuming data search,<br />
data loss <strong>and</strong> inconsistencies, erroneous or<br />
redundant data are avoided. Further advantages are<br />
that all data can be accessed by multiple users, any<br />
time, from anywhere <strong>and</strong> at the click of a button. All<br />
relevant in<strong>for</strong>mation is permanently available, which<br />
significantly improves the communication among<br />
experts <strong>and</strong> decision makers. This intelligent <strong>and</strong><br />
extensive alarm system can take into account all<br />
project data. The system thus, contributes<br />
significantly to safer tunnel construction.<br />
Figure 8: The settlements in fig. 7 can be analysed<br />
in combination with the live-display of TBM<br />
per<strong>for</strong>mance data<br />
75
AIntroduction<br />
Volcanic <strong>Risk</strong> <strong>Management</strong>:<br />
the Case of Mt. Etna<br />
2006 Eruption<br />
Claudia Spinetti (a), Laura Colini (a), Maria Buongiorno<br />
(a), Chiara Cardaci (b), Grazia Ciminelli (c),Stefano<br />
Corradini (a), Francesco Guglielmino (d), Massimo<br />
Musacchio (a),Gaetano Pace (e), Daniele Pellegrino (c),<br />
Sergio Perelli (e), Luca Pietranera (c), Giuseppe Puglisi<br />
(d), Pierluigi Soddu (b)<br />
(a) Istituto Nazionale di Geofisica e Vulcanologia (INGV), Roma, Italy<br />
(b) Dipartimento di Protezione Civile (DPC), Roma, Italy<br />
(c) Telespazio S.p.A., Roma, Italy<br />
(d) Istituto Nazionale di Geofisica e Vulcanologia (INGV-CT), Catania, Italy<br />
(e) Advanced Computer System S.p.A. (ACS), Roma, Italy<br />
Active volcanoes are spread all over the world <strong>and</strong> are<br />
located in specific areas correlated to geologic<br />
structures. In the last 10,000 years more than 1300<br />
volcanoes have erupted, but only half of the eruptions<br />
have been reported in historical texts. It has been<br />
estimated that every year 50 volcanic eruptions may<br />
occur threatening about 10% of the worldwide<br />
population (Andres <strong>and</strong> Kasgnoc, 1998). Considering<br />
the constant increase in human population <strong>and</strong> that<br />
many major cities are placed in the proximity of active<br />
volcanoes, the number of people subjected to the risks<br />
caused by volcanic eruptions is also increasing.<br />
Explosive eruptions represent a serious hazard not<br />
only <strong>for</strong> the human population, but also <strong>for</strong> aviation<br />
safety. Because of the increases in air routes <strong>and</strong> in the<br />
number of flights, the probability that volcanic ash<br />
dispersed into the atmosphere is at flight levels is<br />
actually about 20 days/yr. From 1973 to 2000 IATA<br />
estimates that more than 1000 airplanes around the<br />
world have been damaged by volcanic ash with an<br />
economic loss of about $250 million.<br />
Figure 1: The Mount Etna<br />
(photo courtesy of B. Behncke (INGV-CT))<br />
77
In the framework of the FP6 program, the European<br />
Union has funded the Eurorisk-Preview (Prevention,<br />
In<strong>for</strong>mation <strong>and</strong> Early Warning) project<br />
(http://www.preview-risk.com/). The project<br />
addresses European Civil Protections with the aim of<br />
developing, at a European scale, new tools <strong>and</strong><br />
in<strong>for</strong>mation services to support risk management. In<br />
this framework, Earthquakes <strong>and</strong> Volcanoes<br />
plat<strong>for</strong>ms have been developed by a network of<br />
partners* <strong>for</strong> the operative needs of the Italian Civil<br />
Protection <strong>and</strong> using the most advanced research<br />
<strong>and</strong> technology outcomes.<br />
Mt. Etna in Sicily (Italy) <strong>and</strong> Pico de Teide in Canary<br />
Isl<strong>and</strong>s (Spain) have been the volcanic test sites. Mt.<br />
Etna is the most active volcano in Europe causing<br />
several problems to the neighbouring population<br />
with its frequent eruptions. Tenerife in Canary<br />
Isl<strong>and</strong>s is potentially in danger since caldera collapse<br />
has occurred in past eruptions of Pico de Teide.<br />
Given the high density population <strong>and</strong> the tourism<br />
on the isl<strong>and</strong>s, new technologies are needed to<br />
investigate its reactivation, as a seismic swarm<br />
occurred on 2004.<br />
After intense exchange between partners, the service<br />
product chain of Volcanoes plat<strong>for</strong>m has been built<br />
according to the following steps (Figure 2):<br />
1) Ingestion: acquisition of Earth Observation (EO)<br />
satellite historical series;<br />
2) Core process: analysis of satellite data to<br />
retrieve scientific products <strong>and</strong> integration<br />
with ground network data;<br />
3) Repository: build the database;<br />
4) Distribution: build the Web portal in a Geographical<br />
In<strong>for</strong>mation System where the scientific<br />
products are shown <strong>and</strong> available <strong>for</strong><br />
querying, according to Civil Protection needs.<br />
* Project partners: ACS, COERI, DPC, EMSC, Geopapp,<br />
INGV, IREA-CNR, NOA, Telespazio, UCM<br />
78<br />
When the service was ready <strong>for</strong> a past eruption of Mt.<br />
Etna, a new eruption occurred in 2006. We took the<br />
opportunity to test the service during this eruption.<br />
The EO products<br />
The scientific products consist of geophysical<br />
parameters related to the volcano status, derived<br />
from the analysis of the Earth Observation data.<br />
These parameters differ according to the type of<br />
volcanic phenomena. When a volcano is in a<br />
quiescent phase the most relevant parameters are:<br />
surface de<strong>for</strong>mation, surface temperature, <strong>and</strong> gas<br />
<strong>and</strong> particulate emissions into the atmosphere. A<br />
change in the volcanic behaviour is reflected in<br />
changes of these parameters. When the volcano is in<br />
the eruption phase, the relevant parameters are the<br />
velocity of the active lava flow <strong>and</strong> the volcanic ash<br />
emitted into the atmosphere. All these parameters<br />
are EO products when presented as geospatial<br />
in<strong>for</strong>mation in the <strong>for</strong>m of thematic maps.<br />
The Web-GIS<br />
The Volcanoes plat<strong>for</strong>m has been designed to<br />
improve access to satellite derived in<strong>for</strong>mation. The<br />
design of its architecture has been developed to<br />
organise <strong>and</strong> harmonise heterogeneous value-added<br />
data <strong>and</strong> provide a common access point, which<br />
should be simple, efficient <strong>and</strong> comprehensive,<br />
including all data exploited by Civil Protection, <strong>and</strong><br />
able to anticipate possible integration with data<br />
coming from other services.<br />
To reach this goal a GIS (Geographical In<strong>for</strong>mation<br />
System) published on the Web (Web-GIS) was<br />
designed. The objective of the web application is to<br />
display the EO products, taking advantage of their<br />
spatial relationships. Data <strong>and</strong> EO products are<br />
collected <strong>and</strong> stored in a central repository based on<br />
a relational database PostgreSQL.<br />
The Web-GIS displays EO products as images, graphs<br />
<strong>and</strong> data related to monitoring volcanic <strong>and</strong> seismic<br />
risk. It can be accessed by any web browser so that it<br />
can be exploited by authorised personnel remotely<br />
from their office, or in the field.<br />
The system is organised in the 3 phases of the risk<br />
management:<br />
�Knowledge <strong>and</strong> prevention<br />
�Crisis<br />
�Post-crisis<br />
Image data or thematic maps are selected <strong>for</strong> display<br />
by identifying the EO product <strong>and</strong> the time<br />
window in which the data is to be searched.<br />
The Web-GIS can be reached at<br />
http://preview.acsys.it/preview/ login.php.<br />
Example of EO products selected are the<br />
volcanic plume aerosol optical characteristics<br />
(Spinetti et al., 2007) in the Knowledge <strong>and</strong><br />
Prevention section. Due to the adoption of<br />
Open Geospatial Consortium (OGC) st<strong>and</strong>ards,<br />
the user can integrate the data with others<br />
stored in their own environment.<br />
Figure2: This image shows the scheme of<br />
the service production chain.
Mt. Etna 2006 eruption<br />
Mt. Etna (3300 m a.s.l.) is located in the eastern part<br />
of Sicily <strong>and</strong> is one the major degassing volcanoes in<br />
the world (Romano, 1982). Its quiescent state is<br />
periodically interrupted by eruptive periods<br />
characterized by lava flows <strong>and</strong> volcanic ash<br />
emissions that cause different hazards <strong>and</strong> problems<br />
to the local population. The ash fallout damages the<br />
inhabited <strong>and</strong> cultivated areas; the volcanic ash that<br />
remains in air creates serious hazards to air traffic as<br />
it spreads over the East Mediterranean area at high<br />
altitude; this causes local economic loss due to the<br />
closure of airports.<br />
In mid-July 2006 Mt. Etna exhibited 15 days of lava<br />
flows down to an isolated area. A new eruption<br />
started in September characterized by lava flows <strong>and</strong><br />
a series of episodic explosive activities producing ash<br />
plumes that drifted several kilometres away from the<br />
vent. These episodes occurred frequently from<br />
September to December showing weak intensity <strong>and</strong><br />
short duration compared to 2001 <strong>and</strong> 2002<br />
eruptions. The 2006 Mt. Etna eruption provided the<br />
opportunity to per<strong>for</strong>m the pre-operative test of the<br />
project <strong>and</strong> to sharpen the development tool.<br />
Ground surface de<strong>for</strong>mation measured by SAR<br />
Volcano surface changes (ground de<strong>for</strong>mations) are<br />
directly related to what is happening deep below the<br />
surface. In general a surface inflation is related to<br />
feeding of the magma into the plumbing system,<br />
while a deflation is related to the discharge of<br />
magma. Most of the de<strong>for</strong>mations can be detected<br />
<strong>and</strong> measured with precise surveying techniques,<br />
such as GPS, tiltmeters, EDM <strong>and</strong> most recently<br />
satellite InSAR technique (Interferometric Synthetic<br />
Aperture Radar).<br />
This technique combines several radar images<br />
recorded by Earth orbiting satellites to show subtle<br />
movements of the ground surface over time <strong>and</strong> to<br />
map ground de<strong>for</strong>mation of large areas (Puglisi et al.,<br />
2008).<br />
In the begin of the 2006 eruption we tested the<br />
efficiency of European Space Agency procedures to<br />
rapidly obtain data in order to measure ground<br />
de<strong>for</strong>mation using InSAR technique (ESA provided<br />
data via Category-1 n. 3560). Figure 3 shows the<br />
InSAR core process results <strong>for</strong> the period July 2005 -<br />
July 2006.<br />
The results locate the magmatic source at about<br />
2.7km below the summit of the craters. The source is<br />
in agreement with the volcanic activity that occurred<br />
in the period Sept-Oct 2006 (Guglielmino et al.,<br />
2007). We underst<strong>and</strong> that the operative results<br />
derived from the InSAR technique only are useful <strong>for</strong><br />
monitoring ground de<strong>for</strong>mation if they are<br />
accompanied by a historical series of de<strong>for</strong>mations<br />
<strong>and</strong> a model source constrained by ground<br />
measurements (GPS data). All these in<strong>for</strong>mation<br />
have been implemented <strong>for</strong> the Mt. Etna case.<br />
Figure 3: This image shows: a) ERS image. b) Phase interferogram obtained by combining an ERS pair from 20 July<br />
2005 <strong>and</strong> 5 July 2006. c) Interferogram obtained by subtracting the terrain model. d) Synthetic interferogram<br />
obtained by inverting GPS data. e) GPS displacement vectors (July 2005 -July 2006). The black arrows represent<br />
the horizontal displacement vectors <strong>and</strong> the blue are those modelled as compatible with a volcanic pressure-source<br />
(in red). f) Cross section showing the source model in red.<br />
79
Volcanic ash measured by NASA-MODIS<br />
satellites<br />
November 24th 2006, at about 03:00 UTC, a<br />
paroxysmal event occurred with ash emission lasting<br />
about 14 hours (Andronico at al., 2009; Figure 4a).<br />
This event produced the largest volume of ash in the<br />
entire September-December eruptive period. On that<br />
day the wind was blowing from the N-NW direction.<br />
A change in wind direction caused the ash plume to<br />
move towards the city of Catania. The episode was<br />
recorded at 12:20 UTC by MODIS on board Aqua<br />
satellite (Figure 4b). The finest ash travelled more<br />
than 80km from the summit craters. The ash fallout<br />
caused the closure of Catania Airport.<br />
The pre-operative test went through the following<br />
steps:<br />
1) The DPC requested activation of the EO<br />
volcanic ash product to project partners with an<br />
observation pre<strong>for</strong>matted report.<br />
2) Ingestion: after pre-processing, the MODIS<br />
data acquired from Telespazio through the Matera<br />
ground receiving station were automatically sent to<br />
INGV in near-real time.<br />
80<br />
3) Core process: INGV ran its scientific models<br />
<strong>and</strong> algorithms in order to derive the EO product.<br />
The Brightness Temperature Difference procedure<br />
with the atmospheric water vapour correction was<br />
applied to infrared MODIS channels to detect<br />
volcanic ash, discriminate it from meteorological<br />
clouds <strong>and</strong> identify the affected area. The retrieved<br />
mean ash optical thickness at 0.55n µ, the mean ash<br />
particle radius <strong>and</strong> the ash loading in the plume<br />
were derived to be 0.4, 3.5 µ <strong>and</strong> 3620 tons<br />
respectively.<br />
4) Distribution: ACS developed an interactive<br />
web-interface (Figure 5a) linked to the main Web-<br />
GIS in the Crisis risk management phase. INGV<br />
created the pre<strong>for</strong>matted observation report with<br />
the volcanic ash in<strong>for</strong>mation on: area affected by<br />
volcanic ash, the volcanic plume dispersal direction;<br />
dimensions <strong>and</strong> altitude in the atmosphere <strong>and</strong> the<br />
volcanic ash loading (Figure 5b). The pre<strong>for</strong>matted<br />
observation report was published in the Web-GIS via<br />
WMS st<strong>and</strong>ard protocol (Figure 6).<br />
Figure 4: Mt. Etna ash plume on 24 November 2006: a) picture taken 30 km from summit carters<br />
(photo courtesy of B. Behncke); b) MODIS data on Aqua RGB image.<br />
Total time processing was estimated to be less than 1<br />
hour, after receiving MODIS data. The test end when<br />
the eruption terminated in late December.<br />
Figure 5: This image shows the report creation:<br />
a) Interactive web-interface where INGV insert<br />
the volcanic ash in<strong>for</strong>mation; b) Web-published<br />
pre<strong>for</strong>matted observation report.
Conclusions<br />
A Web-GIS developed separately <strong>for</strong> the Earthquakes<br />
<strong>and</strong> Volcanoes plat<strong>for</strong>ms has been developed<br />
according to end-users requirements. The EO<br />
products relating to the selected eruption occurring<br />
at Mt. Etna (Sicily) in 2001 have been integrated with<br />
the geophysical in<strong>for</strong>mation derived from the ground<br />
network. The Web-GIS has been designed to supply<br />
specific in<strong>for</strong>mation in a user-friendly <strong>and</strong> efficient<br />
way <strong>and</strong> to support Civil Protection in the decision<br />
process.<br />
During the 2006 Mt. Etna eruption we per<strong>for</strong>med a<br />
successfully pre-operative test on the two phases. In<br />
the first phase, we tested the European Space Agency<br />
procedures to rapidly receive the EO data to obtain<br />
the ground surface de<strong>for</strong>mation. In the second phase<br />
characterized by paroxysmal events with volcanic<br />
ash emission, we tested the procedures to give<br />
relevant in<strong>for</strong>mation on volcanic ash to DPC to<br />
support their decision making process. This test<br />
does not address the precise location of events <strong>for</strong><br />
prevention <strong>and</strong> mitigation purposes, but responds to<br />
the needs of decision-makers to better underst<strong>and</strong><br />
the situation <strong>and</strong> to identify vulnerable populations.<br />
The Preview project work <strong>and</strong> the pre-operative test<br />
is an example of successful collaboration between<br />
industry <strong>and</strong> a national body using results from the<br />
scientific community in a practical way the <strong>for</strong> the<br />
risk management.<br />
The work carried out will be further developed to an<br />
operational stage through the new project SAFER<br />
funded by the European Union in the FP7<br />
framework.<br />
Figure 6: This image shows the Web-GIS portal in Crisis section with the<br />
selected volcanic ash EO product. In left bottom is marked the availability of the<br />
observation report.<br />
81
SIntroduction<br />
Audit of Indian Ocean<br />
Tsunami Aid in Aceh<br />
with Geo-in<strong>for</strong>mation<br />
Wietske Bijker*, Egbert Jongsma**,<br />
Richard A Kidd ***<br />
* Faculty of Geo-in<strong>for</strong>mation Science <strong>and</strong> Earth Observation<br />
(ITC), University of Twente, Enschede, The Netherl<strong>and</strong>s,<br />
bijker@itc.nl<br />
**Netherl<strong>and</strong>s Court of Audit, The Hague, The Netherl<strong>and</strong>s,<br />
e.jongsma@rekenkamer.nl<br />
***Geospatial Consultant, Cairo, Egypt,<br />
richard.a.kidd@gmail.com<br />
Supreme Audit Institutions (SAIs) have a role in<br />
safeguarding the spending of public funds by<br />
providing assurance with their audit activities: they<br />
provide assurance on the financial statements of<br />
government <strong>and</strong> public entities. Auditing also has<br />
another important function besides assurance; it is a<br />
learning tool <strong>for</strong> management that provides an<br />
assessment of weaknesses <strong>and</strong> strengths in<br />
per<strong>for</strong>mance.<br />
SAIs have a role in assessing whether governments<br />
<strong>and</strong> public entities are well prepared <strong>for</strong> natural<br />
disasters (disaster preparedness <strong>and</strong> risk<br />
mitigation). They also have a role when disasters<br />
happen <strong>and</strong> government <strong>and</strong> public entities are<br />
planning, coordinating, funding <strong>and</strong> implementing<br />
disaster-relief ef<strong>for</strong>ts.<br />
When the Indian Ocean Tsunami happened in 2004,<br />
the 189 members of the international organisation<br />
of SAIs (INTOSAI) realised that this disaster would<br />
also have an effect on the SAIs from affected <strong>and</strong><br />
Figure 1: Map of newly built houses in Lampuuk Village with contractor zones, projected on a 2007 KOMPSAT-2 image. The<br />
entire village is within 2 kilometres of the coastline. Individual houses are indicated by symbols (green = inhabited, red = not<br />
inhabited). The map was made by BPK staff during a training course (Source: SAADRA Program TF 057426). KOMPSAT-2<br />
image courtesy of Korean Aerospace Institute (KARI).<br />
83
<strong>and</strong> donor countries. For SAIs of affected countries,<br />
such as Indonesia <strong>and</strong> Sri Lanka, it posed a huge<br />
challenge to audit the management of disasterrelated<br />
aid. But also <strong>for</strong> SAIs from major donor<br />
countries the Tsunami-disaster posed a challenge:<br />
how could the SAIs provide assurance on public<br />
funds that are mixed with other public <strong>and</strong> private<br />
funds while those funds flow from one organisation<br />
to another <strong>and</strong> from one country to another? To be<br />
able to provide assurance, an audit trail is needed to<br />
provide insight <strong>and</strong> accountability into the<br />
movement of public funds from source to final<br />
destination.<br />
In November 2005 the Governing Board of INTOSAI<br />
decided to create a Task Force on the Accountability<br />
<strong>for</strong> <strong>and</strong> Audit of <strong>Disaster</strong>-related Aid with the aim to<br />
reconstruct an audit trail <strong>for</strong> the Tsunami-related aid<br />
flows <strong>and</strong> to learn about how to improve<br />
transparency <strong>and</strong> accountability <strong>for</strong> these flows.<br />
The flow of disaster-related aid is a geographical<br />
movement from source to destination. Furthermore,<br />
aid (e.g. funds <strong>for</strong> education) is intended to lead to a<br />
certain output (i.e. school building <strong>and</strong> training of<br />
teachers) <strong>and</strong> finally an outcome (i.e. the education)<br />
on a specific location. Geography, there<strong>for</strong>e, plays an<br />
important role in any audit trail, but is specifically<br />
important with regard to disasters.<br />
The INTOSAI Task Force was charged with exploring<br />
the possibilities of using geo-in<strong>for</strong>mation in auditing<br />
disaster-related aid in order to minimize waste,<br />
competition, fraud <strong>and</strong> corruption of the aid funds.<br />
The Task Force's research question was broad: how<br />
<strong>and</strong> under what conditions can the use of geoin<strong>for</strong>mation<br />
in auditing help to ensure the regularity,<br />
efficiency <strong>and</strong> effectiveness of disaster-related aid?<br />
84<br />
This paper describes the methodology <strong>and</strong> results of<br />
the INTOSAI Task Force's study into the potential use<br />
of geo-in<strong>for</strong>mation <strong>for</strong> auditing disaster-related aid.<br />
Detection <strong>and</strong> mapping of new houses<br />
To study the potential role of geo-in<strong>for</strong>mation in<br />
audit of disaster-related aid, the Task Force focussed<br />
on the reconstruction of houses in the Indonesian<br />
province of Aceh (Nanggroe Aceh Darussalam, NAD),<br />
the most affected area of the Tsunami-hit countries,<br />
where over 150,000 houses were damaged or<br />
destroyed. The interest was not only if new houses<br />
were constructed, but also where, so it could be<br />
determined if houses were constructed at the correct<br />
location.<br />
Looking at disaster prevention <strong>and</strong> mitigation, it is<br />
also of interest whether newly constructed or<br />
reconstructed houses were built in areas that are not<br />
prone to disaster. For example, if houses were built<br />
too close to the coastline, then the risk <strong>for</strong><br />
destruction at a next Tsunami would be high <strong>and</strong> so<br />
would the risk of aid funds being wasted. After the<br />
2004 Tsunami, the Government of Indonesia<br />
regulated that houses should be built at least two<br />
kilometres from the coastline (in some areas the<br />
Tsunami reached two kilometres inl<strong>and</strong>), there<strong>for</strong>e<br />
reducing potential risk of destruction. Accurately<br />
mapping the location of the reconstructed houses in<br />
the province would provide a mechanism to assess<br />
compliance with this Governmental requirement. It<br />
would also provide the possibility to benchmark<br />
between implementing agencies: SAIs auditees are<br />
government agencies <strong>and</strong> private entities such as<br />
non-governmental organisations (NGO's). In this<br />
respect, situations such as the Indian Ocean Tsunami<br />
provided SAIs with the unique possibility of<br />
benchmarking government per<strong>for</strong>mance against that<br />
of private entities.<br />
The basic idea behind the proposed method (see<br />
Figure 2) is to use two maps of the objects of<br />
interest: one at the start <strong>and</strong> one at the end of the<br />
audit period <strong>and</strong> to detect the changes by applying<br />
overlay-techniques (Bijker <strong>and</strong> Sanjaya 2008). Use<br />
of decision rules <strong>for</strong> change detection limits the<br />
result to provide only the changes of interest. These<br />
changes of interest can be sorted by administrative<br />
unit when combined with an administrative map <strong>and</strong><br />
compared to the in<strong>for</strong>mation supplied by the<br />
institution which is being audited. Field sampling<br />
assesses the accuracy of the change detection <strong>and</strong><br />
provides further detail on the nature <strong>and</strong> origin of<br />
the changes <strong>and</strong> the objects under study. Depending<br />
upon the required spatial resolution (i.e. sufficient to<br />
accurately locate <strong>and</strong> measure the object of interest)<br />
the maps would usually be derived from satellite<br />
images or orthorectified aerial photographs<br />
(orthophotos). This generic approach could be<br />
applied <strong>for</strong> all spatial objects under audit, such as<br />
<strong>for</strong>ests, houses, agricultural fields, <strong>and</strong> <strong>for</strong><br />
environmental impact assessment.<br />
The method depends on data availability at the time<br />
of the audit. For the Aceh case study, high resolution<br />
(30cm) orthophotos, acquired in June 2005,<br />
provided by the Indonesian National Coordinating<br />
Agency <strong>for</strong> Surveys <strong>and</strong> Mapping (Bakosurtanal) via<br />
BRR's Spatial In<strong>for</strong>mation <strong>and</strong> Mapping Centre (SIM-<br />
Centre), along with the panchromatic 1m KOMPSAT-<br />
2 (Korea Multi-Purpose Satellite-2) images, donated<br />
by the Korean Aerospace Research Institute (KARI),<br />
acquired in May 2007 were available. Vector data<br />
(Topographic Line Map, at 1:10,000 scale) extracted<br />
from the 2005 high resolution orthophotos was also<br />
available.
Combining the 2005 map of building footprints<br />
detailing the start of the rehabilitation phase, with<br />
that of 2007 showing the current state at the time of<br />
case study, provides all the buildings constructed<br />
between clearing the Tsunami debris <strong>and</strong> the end of<br />
the reconstruction period. Overlaying the map of<br />
new houses with the map of administrative<br />
boundaries provides the number <strong>and</strong> locations of<br />
new houses per administrative unit. These numbers<br />
can be compared with the in<strong>for</strong>mation on housing<br />
projects available through the Agency <strong>for</strong><br />
Rehabilitation <strong>and</strong> Reconstruction of NAD <strong>and</strong> Nias<br />
(BRR) Recovery Aceh Nias Database (RAND)<br />
database <strong>and</strong> other project in<strong>for</strong>mation. Lay-out<br />
plans of housing projects existed only as paper<br />
sketches.<br />
Based on location <strong>and</strong> degree of completion, as<br />
detected by comparing the building footprint maps,<br />
the Indonesian SAI, Badan Pemeriksa Keuangan RI<br />
(BPK) can take a stratified r<strong>and</strong>om or stratified<br />
systematic sample of these projects, <strong>for</strong> auditing<br />
according to its audit objective. Fraud is likely if<br />
there is a large discrepancy between the quantities<br />
of houses built according to the RAND database or<br />
project in<strong>for</strong>mation, <strong>and</strong> the map of new houses. In<br />
such a case, the BPK field teams may want to take<br />
extra field samples to determine the reason <strong>for</strong> this<br />
discrepancy. Visualizing the spatial distribution of<br />
contractors <strong>and</strong> projects on maps shows the auditors<br />
whether there were likely to be any monopolies of<br />
building contractors in certain areas, <strong>and</strong> focus their<br />
audits accordingly. Using the map of new houses, the<br />
audit data of the houses in the sample can be<br />
extrapolated <strong>for</strong> the whole study area.<br />
Figure 2: GIS based method <strong>for</strong> auditing housing projects<br />
In the case of the housing audit conducted by the SAI<br />
of Indonesia (BPK), the results of the analysis of the<br />
KOMPSAT-2 imagery providing the housing<br />
footprints <strong>for</strong> 2007, were not ready be<strong>for</strong>e the field<br />
teams started their survey, so the method shown in<br />
Figure 2, was adapted (Bijker <strong>and</strong> Sanjaya 2008).<br />
While the field teams of the BPK were conducting<br />
their survey, suitable remote sensing methods were<br />
developed to detect houses on the KOMPSAT-2<br />
imagery <strong>and</strong> used to create the map of new houses<br />
<strong>for</strong> selected sites (Du 2008).<br />
The field teams took copies of the 2005 orthophotos<br />
to the field <strong>and</strong> delineated the sites of the housing<br />
projects on these images, as shown in Figure 3. The<br />
project delineations of the field teams were digitized<br />
<strong>and</strong> combined with the map of new houses. In this<br />
way, thematic (audit) data of the housing projects<br />
could be related to the new houses mapped from the<br />
imagery.<br />
85
Check <strong>for</strong> compliance with risk regulation<br />
When the available Topographic L<strong>and</strong> Map <strong>and</strong> the<br />
housing data from the RAND were combined, it was<br />
possible to map all settlements within two<br />
kilometres of the coastline. A limited number of<br />
inspection sites were selected, where it was possible<br />
to collect field data including the use of a h<strong>and</strong>held<br />
Global Positioning System (GPS) to ensure positional<br />
accuracy. To be able to provide a benchmark,<br />
inspection sites were selected from various<br />
implementing agencies. To ascertain if newly<br />
constructed houses complied with government<br />
regulations, it is a straight<strong>for</strong>ward process to simply<br />
map the distance from the coast. As can be seen from<br />
Figure 4, some of the houses were constructed<br />
within 300 metres of the coastline. We can also see<br />
from this example that houses built by NGOs are<br />
located even closer to the coastline.<br />
Lessons learned<br />
From the housing audit in Aceh Indonesia, it is clear<br />
that many limitations exist concerning the<br />
availability of data. Data required <strong>for</strong> the audit do not<br />
exist or are not provided by the auditee. The<br />
combined use of GIS <strong>and</strong> remote sensing could help<br />
in resolving this problem. Data accuracy <strong>and</strong><br />
methods to assess the accuracy of spatial (audit)<br />
data still require more attention. As with all data<br />
used by an audit institute, reliability of the data used<br />
in the audit is important <strong>for</strong> its credibility <strong>and</strong> the<br />
confidence of the general public.<br />
86<br />
Figure 3: Sketching of housing projects by field team
GIS is a useful <strong>and</strong> cost-effective technology <strong>for</strong> the<br />
preparation <strong>and</strong> planning of an audit, <strong>and</strong> can be<br />
used to visualize where risk of fraud is highest <strong>and</strong> to<br />
limit the amount of data that has to be collected in<br />
the field, (INTOSAI Tsunami Task Force, 2008).<br />
Remote sensing can be used to acquire spatial data,<br />
which is not yet available as maps, also allowing<br />
independent verification of certain objects <strong>and</strong><br />
processes. In the field, having the data at h<strong>and</strong> in a<br />
mobile GIS <strong>and</strong> storing the data immediately in a<br />
digital <strong>for</strong>m speeds up the survey <strong>and</strong> reduces the<br />
risk of errors, <strong>and</strong> also possibly the number of<br />
samples needed. For presentation of the results of<br />
the audit, maps are very effective <strong>for</strong> summarizing<br />
in<strong>for</strong>mation <strong>and</strong> <strong>for</strong> showing spatial relations.<br />
The housing audit in Aceh has made INTOSAI more<br />
aware of the crucial role geography plays in<br />
compliance <strong>and</strong> per<strong>for</strong>mance of the public entities it<br />
audits. Using geo-in<strong>for</strong>mation helps SAIs to<br />
underst<strong>and</strong> <strong>and</strong> tackle the complexity of policy<br />
implementation in situations such as disaster areas.<br />
It also leads to more efficient <strong>and</strong> effective audits,<br />
thus enhancing the contribution of SAIs to good<br />
governance. The Netherl<strong>and</strong>s Court of Audit<br />
launched a knowledge centre on GIS <strong>and</strong> Audit to<br />
further develop GIS as an audit tool:<br />
www.courtofaudit.nl/english/gis<strong>and</strong>audit.<br />
Acknowledgements<br />
The authors like to thank the Badan Pemeriksa<br />
Keuangan RI, the Indonesian Supreme Audit<br />
Institute, <strong>and</strong> the SIM-Centre, BRR <strong>for</strong> their support<br />
of the pilot study on auditing housing projects with<br />
geo-in<strong>for</strong>mation. Furthermore, they would like to<br />
thank the KARI <strong>for</strong> providing the satellite imagery,<br />
the World Bank <strong>and</strong> the Netherl<strong>and</strong>s Ministry <strong>for</strong><br />
Development Cooperation <strong>for</strong> funding the pilot<br />
study.<br />
Figure 4: Mapping compliance with risk regulation<br />
87
Population Estimation <strong>for</strong><br />
Megacities: Solving <strong>Disaster</strong><br />
<strong>Management</strong> Challenges Using<br />
Remote Sensing, Web-GIS <strong>and</strong><br />
Advanced Technologies<br />
1 2<br />
Eike-Marie Nolte , Beverley J. Adams ,<br />
1<br />
3<br />
Friedemann Wenzel , Walter Svekla<br />
1 Center <strong>for</strong> <strong>Disaster</strong> <strong>Management</strong> <strong>and</strong> <strong>Risk</strong> Reduction<br />
Technology, Geophysical Institute, Karlsruhe Institute of<br />
Technology (KIT)<br />
2 ImageCat Inc, Ashtead, Surrey, UK<br />
3 ImageCat Inc., Long Beach, Cali<strong>for</strong>nia, USA<br />
TIntroduction <strong>and</strong> background<br />
The 21st century is the Century of the City. More than<br />
3 billion of the earth's inhabitants live within urban<br />
settlements (UN, 2008), but by 2050, it is predicted<br />
that 6 billion people 70 % of the world's population<br />
- will reside in urban areas (UN, 2008). It is expected<br />
that urban areas throughout the world will absorb<br />
population growth over the next four decades, while<br />
at the same time drawing in rural populations.<br />
Comprehensive disaster management seeks to<br />
reduce the devastating impacts of natural hazards,<br />
through resilient activities undertaken throughout<br />
the disaster management cycle; <strong>for</strong> example, from<br />
pre-event risk modelling, to post-event mitigation<br />
<strong>and</strong> emergency response. For casualty <strong>and</strong> loss<br />
estimation, risk models require building <strong>and</strong><br />
infrastructure inventory data, demographic <strong>and</strong><br />
socio-economic data. In the case of post-event<br />
response, in<strong>for</strong>mation is needed on the extent <strong>and</strong><br />
severity of damage.<br />
89
Inventory data <strong>for</strong> pre-event risk modelling<br />
From a theoretical st<strong>and</strong>point, when developing<br />
inventory data to support risk modelling, it is<br />
important to follow the principal of model<br />
consistency, whereby the level of detail with which a<br />
given parameter is measured, is consistent with the<br />
accuracy <strong>and</strong> the reliability of the risk model as a<br />
whole. In a methodological context, pre-event risk<br />
<strong>and</strong> loss estimation models operate respectively on<br />
different spatial levels such as postcode, district,<br />
municipality boundary, region or even country.<br />
Traditional techniques <strong>for</strong> data acquisition <strong>and</strong> the<br />
maintenance of up-to-date inventory databases are<br />
very time- <strong>and</strong> cost-intensive. Taking India as an<br />
example, more than 2 million people were involved<br />
in the 2001 census building survey.<br />
Of existing inventory development techniques, many<br />
were conceived <strong>for</strong> small scale analyses, <strong>and</strong> as such,<br />
do not match the requirements of either today's or<br />
the future's megacities (see, <strong>for</strong> example, Prasad et<br />
al., 2009). In the case of India, large city extents, rapid<br />
<strong>and</strong> dynamic urban development, <strong>and</strong> very complex<br />
urban structures, dem<strong>and</strong> new methodologies <strong>for</strong> data<br />
acquisition. Introducing efficiencies into the data<br />
development sequence is a high priority.<br />
Remote sensing <strong>and</strong> GIS/Web-GIS are increasingly<br />
recognised as useful tools <strong>for</strong> facing the challenges of<br />
inventory data development <strong>for</strong> megacities. Satellite<br />
<strong>and</strong> aerial imagery have enormous potential to<br />
provide detailed in<strong>for</strong>mation at different resolutions,<br />
across a range of time periods. In addition, with the<br />
advent of internet-based records <strong>and</strong> data sharing, a<br />
variety of statistical inventory data are now publicly<br />
available. However, the accuracy of these datasets is<br />
unknown <strong>and</strong> their quality is typically nonst<strong>and</strong>ardised.<br />
90<br />
Population inventory <strong>for</strong> Indian megacities<br />
India is a prominent example of a nation where<br />
urbanization is rapid, spatially varied, <strong>and</strong><br />
exceptionally dynamic. By 2050, India's total<br />
population of 1.6 billion is expected to overtake that<br />
of China (1.4 billion), of which 0.9 billion will be<br />
urban dwellers (UN, 2008). If, as expected, high rates<br />
of urbanisation are sustained in coming decades,<br />
many cities will reach megacity status (more than 10<br />
million inhabitants) in the near future. Further, due<br />
to its geologic setting, India is regularly struck by<br />
devastating earthquakes (Ravi, 2008). In 2001, the<br />
state of Gujarat (northwest India) was hit by a 7.9M<br />
event, causing widespread damage to buildings <strong>and</strong><br />
infrastructure <strong>and</strong> 20,000 fatalities (MCEER, 2009).<br />
Only 4 years later, 88,000 people died in the Kashmir<br />
region following a 7.6M earthquake (MCEER, 2009).<br />
To meet the requirements <strong>for</strong> st<strong>and</strong>ardised <strong>and</strong><br />
efficient methods of inventory creation set by<br />
professionals undertaking risk modelling, a new<br />
approach is being developed through cooperation<br />
between the Center <strong>for</strong> <strong>Disaster</strong> <strong>Management</strong> <strong>and</strong><br />
<strong>Risk</strong> Reduction Technology (CEDIM, www.cedim.de)<br />
<strong>and</strong> ImageCat (www.imagecatinc.com), which uses a<br />
combination of remote sensing <strong>and</strong> secondary<br />
sources to generate inventory data products. As a<br />
first step, a comprehensive catalogue of inventory<br />
parameters employed in risk models spanning<br />
different spatial levels was developed. This catalogue<br />
includes 30 parameters subdivided into two<br />
categories:<br />
(1) Parameters that can be directly extracted from<br />
satellite imagery such as building outlines<br />
(2) Parameters that can be inferred by integrating<br />
imagery with secondary data such as population<br />
density.<br />
The second step involved selecting of a high priority<br />
‘pilot parameter’. From historical records of deadly<br />
earthquakes, it is evident that the severity of human<br />
loss is strongly related to occupancy levels of<br />
vulnerable structures during an event. It may be<br />
concluded that with the goal of minimising human<br />
suffering <strong>and</strong> loss, in<strong>for</strong>mation on population <strong>and</strong> its<br />
distribution is a crucial parameter <strong>for</strong> comprehensive<br />
disaster management. Accordingly, this was selected<br />
as the ‘pilot parameter’<br />
Test study site Ahmedabad (Gujarat, NW-India)<br />
The rapidly growing urban agglomeration of<br />
Ahmedabad in northern India was chosen as the test<br />
site. At the time of the 2001 Census, approximately<br />
3.5 million people lived in Ahmedabad. With an<br />
annual population growth rate of 2.4%, the<br />
population is projected to reach 4.3 million by 2011.<br />
Ahmedabad can, without doubt, be called a megacity<br />
of tomorrow, which is at risk from earthquakes<br />
(Figure 1). In the case of the 2001 Gujurat event that<br />
took place approximately 225km east of the Kutch<br />
region, widespread ground motion with a recorded<br />
peak ground acceleration of 0.11g (Eidinger et al.,<br />
2001) caused significant building damage.
Tiered conceptual framework <strong>for</strong> population<br />
estimation<br />
A tiered conceptual framework is proposed <strong>for</strong> the<br />
Ahmedabad case study, which is an applicationdriven<br />
approach, aimed at developing population<br />
data <strong>for</strong> input to risk model parameters. The selected<br />
levels correspond to the operating unit of analysis,<br />
ranging from postcode/district/city boundaries <strong>for</strong><br />
risk-sensitive planning, to a single building <strong>for</strong><br />
response <strong>and</strong> recovery missions. This framework,<br />
which may ultimately be st<strong>and</strong>ardised <strong>for</strong> other<br />
cities, poses a number of technical challenges.<br />
Figure 1: Examples of buildings affected by the 2001 Gujarat earthquake:<br />
(Left) heavily damaged residential building,<br />
(Right) multi-storey building that has fallen on one side (Bhuj, India) (Image courtesy by M. Markus, 2001)<br />
For each level, the relevant data have to be identified,<br />
their availability verified, <strong>and</strong> their accuracy<br />
evaluated. For example, data from Indian Census are<br />
only updated on a decadal basis. In order to integrate<br />
census in<strong>for</strong>mation with other data such as remote<br />
sensing imagery, the relevant census data should be<br />
projected to match the image acquisition year.<br />
Moreover, the significance <strong>and</strong> accuracy of Census<br />
data as well as other statistical data have to be<br />
carefully evaluated.<br />
The assumption that data <strong>and</strong> in<strong>for</strong>mation reflect<br />
reality should be h<strong>and</strong>led with care, as despite<br />
ef<strong>for</strong>ts to identify uncertainty, residual uncertainties<br />
will always remain. Cautious evaluation of available<br />
data that includes cross calculation <strong>and</strong> statistical<br />
analysis should lead to a data product that can be<br />
called the most likely status.<br />
In addition to data-related uncertainties, modelbased<br />
uncertainties also need to be considered. The<br />
modelling of population is typically based on<br />
relationships that are assumed to be true <strong>for</strong> the test<br />
site (<strong>for</strong> example, number of people resident at<br />
91
different times of day). Since no two cities are alike,<br />
the transferability of such relationships needs to be<br />
carefully examined. The broadest unit of analysis<br />
considered in this conceptual framework is the<br />
administrative city boundary (Tier 1). At Tier 1, the<br />
approach considers three population estimation<br />
models <strong>for</strong> which processing time, data requirement<br />
<strong>and</strong> cost increase with in<strong>for</strong>mation detail.<br />
Model 1: City population, uses an areal overlay<br />
methodology based on the simplified assumption<br />
that population is uni<strong>for</strong>mly distributed across the<br />
city. This is a very simple case.<br />
Model 2: Urban population, employs Quickbird<br />
satellite images to extract the urban areas (oppose to<br />
non-inhabited regions) in which the population is<br />
supposed to be uni<strong>for</strong>mly distributed. This<br />
assumption is still an oversimplification.<br />
Model 3: Occupancy-based population differentiates<br />
occupancy categories within the urban areas so that<br />
population can be estimated <strong>for</strong> each of the<br />
categories (Figure 2).<br />
92<br />
Damage in<strong>for</strong>mation <strong>for</strong> disaster response<br />
There is no substitute <strong>for</strong> real-time or near-real-time<br />
data <strong>and</strong> in<strong>for</strong>mation in the aftermath of a disaster.<br />
Post-event activities require quick <strong>and</strong> accurate<br />
in<strong>for</strong>mation about damage <strong>and</strong> casualties to<br />
coordinate a response to the catastrophe. Within the<br />
re/insurance arena, geographically referenced<br />
damage in<strong>for</strong>mation is vital as an independent<br />
source of loss estimation <strong>and</strong> to determine insurance<br />
claims. For humanitarian relief, estimates of affected<br />
population <strong>and</strong> casualties are critical <strong>for</strong> planning<br />
relief <strong>and</strong> response activities. Although increasingly,<br />
disaster in<strong>for</strong>mation is becoming publicly available<br />
through internet posting, its value is often limited by<br />
the absence of metadata regarding its time <strong>and</strong> geolocation<br />
(e.g., geotagging), both of which are central<br />
to rendering it actionable.<br />
Internet-based loss estimation<br />
One example of a fully-georeferenced risk model is<br />
the Internet-based earthquake loss estimation tool<br />
InLET (Figure 3), designed <strong>and</strong> developed by<br />
ImageCat (www.imagecatinc.com). InLET is the first<br />
online real-time loss estimation system available to<br />
emergency managers <strong>and</strong> responders. Immediately<br />
following an earthquake, the United States<br />
Geological Survey (USGS) broadcasts Internet alerts<br />
using their ShakeCast plat<strong>for</strong>m. InLET which 'listens'<br />
<strong>for</strong> such alerts, is automatically triggered <strong>and</strong><br />
produces loss estimation results based on details of<br />
the earthquake event. Integrating hazard intelligence<br />
with population <strong>and</strong> building inventory data from US<br />
Census Bureau enables loss estimation algorithms to<br />
immediately estimate fatalities <strong>and</strong> building damage<br />
at the level of the census tract. The InLET framework<br />
is readily transferable to other earthquake prone<br />
parts of the World such as India.<br />
Figure 2: Occupancy-based population estimates at Tier 1 using Model 3. The left figure displays the relative day time population<br />
distribution, the right figure displays the population change between day- <strong>and</strong> night-time population.
Remote sensing <strong>and</strong> advanced technologies <strong>for</strong><br />
situation/damage assessment<br />
Post-disaster, satellite <strong>and</strong> aerial imagery has<br />
increasingly become accepted as a valuable source of<br />
intelligence <strong>for</strong> underst<strong>and</strong>ing both human <strong>and</strong><br />
geophysical aspects of disasters. As Gillespie <strong>and</strong><br />
Adams (2008) note, initiatives such as the<br />
International Charter: Space <strong>and</strong> Major <strong>Disaster</strong>s<br />
have made significant headway in making remote<br />
sensing-based situation assessments <strong>and</strong> damage<br />
in<strong>for</strong>mation available.<br />
Currently, general access to Charter data is not<br />
available, since it is limited to a group of Authorized<br />
Users. In contrast, increasing public access to remote<br />
sensing <strong>and</strong> GIS techniques is the mission of a new<br />
initiative known as Community Remote Sensing,<br />
which is a flagship project <strong>for</strong> the 2010 IGARSS<br />
Symposium.<br />
The Virtual <strong>Disaster</strong> Viewer<br />
(www.virtualdisasterviewer.com) is one such<br />
prototype community remote sensing tool<br />
(Bevington et al., 2009). The mission of VDV is to<br />
underst<strong>and</strong> disasters though shared knowledge. It is<br />
a t<strong>and</strong>em visualisation <strong>and</strong> participatory tool,<br />
designed <strong>for</strong> rapid data sharing <strong>and</strong> in<strong>for</strong>mation<br />
extraction during the initial response phase of<br />
disasters. VDV's first <strong>for</strong>ay into the disaster realm<br />
was following the 2008 Wenchuan, China<br />
earthquake, when it was simultaneously used by a<br />
panel of international engineers <strong>and</strong> remote sensing<br />
experts spread around the World, to provide remote<br />
damage assessment by analysing high-resolution<br />
satellite imagery of the impact zone.<br />
Figure 4 shows building damage assessment results<br />
<strong>for</strong> the Chinese city of YingXiu, which was conducted<br />
by more than 100 participants.<br />
Figure 3: Inlet is a real-time earthquake loss estimation tool. In an actual event, in less than one minute a real-time USGS<br />
ShakeCast alert automatically triggers a loss/casualty prediction. This map displays Los Angeles building damage at a<br />
parcel level. A similar system could be developed <strong>for</strong> other earthquake prone regions of the World such as India.<br />
VDV has since provided in-field support to<br />
reconnaissance teams from EEFIT (EEFIT, 2009) <strong>and</strong><br />
EERI after recent events including the 2009 L'Acquila<br />
<strong>and</strong> Samoa earthquakes. VDV is also being used as a<br />
repository <strong>for</strong> historical data, making publicly<br />
available to the global research community, archives<br />
of spatially-referenced data of past events that would<br />
otherwise be lost. VDV has considerable potential <strong>for</strong><br />
cataloguing historic earthquake effects within Indian<br />
cities such as Bhuj.<br />
Satellite <strong>and</strong> aerial imagery provide a holistic<br />
perspective across a wide geographic area,<br />
particularly when access to a study region is<br />
restricted. However, it is not without its limitations,<br />
particularly <strong>for</strong> detecting minor <strong>and</strong> moderate<br />
93
damage, together with major effects that are<br />
obscured from overhead viewing such as soft storey<br />
collapses. A detailed street-view perspective<br />
captured using tools like the VIEWS data collection<br />
system designed by ImageCat<br />
(www.imagecatinc.com ) in collaboration with<br />
MCEER (www.mceer.buffalo.edu), fills these<br />
in<strong>for</strong>mation gaps.<br />
VIEWS is a notebook-based field data collection <strong>and</strong><br />
visualization system. It integrates pre- <strong>and</strong> postdisaster<br />
remote sensing imagery with real-time GPS<br />
(Global Positioning System) readings <strong>and</strong> map layers,<br />
<strong>and</strong> operates in conjunction with a high-definition<br />
video (HDV) digital camera <strong>and</strong> digital video<br />
recorder. The VIEWS system was first deployed <strong>for</strong><br />
earthquake field reconnaissance following the<br />
December 2003 Bam (Iran) earthquake (Adams et<br />
al., 2004), <strong>and</strong> has since been utilised following<br />
events including the Indian Ocean tsunami <strong>and</strong> the<br />
2008 Wenchuan earthquake.<br />
Conclusion<br />
Within the risk management arena, to date, the<br />
research focus of remote sensing <strong>and</strong> GIS has<br />
generally been on engineering aspects of urban<br />
inventory. Nevertheless, faced with increasing<br />
human losses from natural disasters as urban<br />
populations exp<strong>and</strong>, the global research community<br />
is beginning to recognise the potential of these<br />
technologies <strong>for</strong> estimating socio-economic<br />
parameters.<br />
It can concluded that with the goal of minimising<br />
future human suffering <strong>and</strong> loss, in<strong>for</strong>mation on<br />
population <strong>and</strong> its distribution is one of the most<br />
crucial parameters <strong>for</strong> resilient disaster<br />
94<br />
<strong>Management</strong>. The case study of Ahmedabad<br />
demonstrates that population data <strong>for</strong> different<br />
spatial levels, as well as in<strong>for</strong>mation on the data<br />
source <strong>and</strong> associated metadata are scarce,<br />
expensive or unavailable. Initial results indicate that<br />
a tiered conceptual framework provides a<br />
transparent <strong>and</strong> consistent system <strong>for</strong> estimating<br />
population at different levels. Implementation of the<br />
framework described is currently being completed<br />
<strong>and</strong> initial results are expected in early 2010.<br />
Remote sensing <strong>and</strong> GIS are also increasingly being<br />
used <strong>for</strong> inventory data development <strong>and</strong> disaster<br />
response within the re/insurance <strong>and</strong> humanitarian<br />
Figure 4: Virtual <strong>Disaster</strong> Viewer post-earthquake<br />
damage assessment <strong>for</strong> the 2008 Wenchuan event,<br />
simultaneously conducted by more than 100 experts<br />
located in Universities, Research Organisations <strong>and</strong><br />
Companies around the World.<br />
in<strong>for</strong>mation systems <strong>for</strong> first responders such as<br />
InLET <strong>and</strong> the Virtual <strong>Disaster</strong> Viewer (VDV), which<br />
enables rapid data development <strong>and</strong> sharing in the<br />
direct aftermath of an event. Initiatives such as the<br />
International Charter provide remote sensing-based<br />
situation assessment <strong>and</strong> damage in<strong>for</strong>mation to<br />
authorised users <strong>and</strong> nations affected by disasters.<br />
For a complete picture, aerial <strong>and</strong> satellite imagery<br />
may need to be augmented with street-view<br />
in<strong>for</strong>mation acquired using systems such as VIEWS.
GIS <strong>for</strong> Emergency <strong>Management</strong><br />
DIntroduction<br />
Mark Cygan*, Tom Patterson**<br />
*map, chart, data production <strong>and</strong> spatial data<br />
infrastructure manager, ESRI<br />
**Wildl<strong>and</strong> Fire Specialist, ESRI<br />
�Devastating natural disasters mean there is a great<br />
m<strong>and</strong>ate <strong>for</strong> collaboration among agencies <strong>and</strong><br />
nations. Geographic in<strong>for</strong>mation system (GIS)<br />
technology is a powerful data management tool<br />
that strings together unconnected data sources <strong>for</strong><br />
quicker analysis, organization, <strong>and</strong> sharing of<br />
in<strong>for</strong>mation. Not only does GIS provide a graphic<br />
user interface that enables the user to quickly<br />
navigate through geospatial data, including<br />
complex three-dimensional datasets, it also enables<br />
organizations to visualize <strong>and</strong> maintain overall<br />
situational awareness during normal operations<br />
<strong>and</strong> emergencies.<br />
�GIS is a flexible technology enabling full integration<br />
with other in<strong>for</strong>mation systems. Linking people,<br />
processes, <strong>and</strong> in<strong>for</strong>mation together <strong>and</strong> being able<br />
to access that in<strong>for</strong>mation at comm<strong>and</strong> centers <strong>and</strong><br />
out in the field, are strengths GIS offers agencies as<br />
they respond to events. Following are three<br />
examples of GIS use in a variety of natural disasters.<br />
Figure 1: Bushfires in the Kinglake Complex<br />
Figure-1: <strong>Risk</strong> Cycle Diagram (source: GMES)<br />
95
Case Study: Kinglake Complex Fire, Australia<br />
In February, 2009, multiple days of temperatures<br />
above 41ºC (106ºF) combined with low humidity, 13<br />
years of drought, <strong>and</strong> northerly 100 kilometres per<br />
hour winds to create an alignment of <strong>for</strong>ces that<br />
produced extreme bushfire conditions that far<br />
exceeded the maximum fire danger ever recorded.<br />
Melbourne, Australia recorded its hottest day ever, a<br />
blistering 46.6ºC (116ºF).<br />
Police in the state of Victoria were directed to search<br />
every property within the Kinglake Complex fire<br />
perimeter, 222,500 hectares with more than 8,000<br />
properties <strong>and</strong> structures.. The organization had<br />
never carried out such a large-scale emergency<br />
damage assessment.<br />
The traditional method <strong>for</strong> documenting property<br />
searches was manual. Victoria Police looked at their<br />
current assessment tools, paper maps, <strong>for</strong>ms, <strong>and</strong><br />
binders <strong>and</strong> realized they had a problem. There was<br />
no time <strong>for</strong> errors such as <strong>for</strong>ms being incomplete or<br />
inaccurate, requiring properties to be searched<br />
again. The need <strong>for</strong> accurate, speedy in<strong>for</strong>mation<br />
prompted the use of geospatial technologies <strong>and</strong><br />
real-time mobile GIS to determine the extent of the<br />
devastation <strong>and</strong> to document the location of human<br />
remains. For 43 days, emergency responders helped<br />
carry out search operations. More than 40 GIS<br />
personnel worked 3,600 total hours (306 work<br />
days).<br />
Each night staff members from the Rescue<br />
Coordination Centre drove the 150-kilometre roundtrip<br />
to the incident comm<strong>and</strong> post in Kinglake. They<br />
retrieved <strong>for</strong>ms <strong>and</strong> memory cards <strong>for</strong> cameras, then<br />
manually typed newly captured data from the paper<br />
96<br />
<strong>for</strong>ms into the database. The updated database was<br />
used to generate maps depicting areas searched <strong>and</strong><br />
areas needing to be searched. Search managers<br />
monitored field operations on a continuous basis<br />
with dynamic data constantly coming into comm<strong>and</strong><br />
centres <strong>and</strong> in turn updated in all mobile devices in<br />
the field.<br />
Staff found that the process when collecting<br />
in<strong>for</strong>mation during their massive search was<br />
simplified <strong>and</strong> made faster. Using mobile GIS,<br />
thous<strong>and</strong>s of properties were searched <strong>and</strong> records<br />
were created, managed <strong>and</strong> shared easily.<br />
The officers commented favourably on how much<br />
time the application saved them. These were some of<br />
the same team leaders who had previously used<br />
paper <strong>for</strong>ms <strong>and</strong> had limited or no prior GIS<br />
experience.<br />
Using Mobile GIS to per<strong>for</strong>m the search in less than<br />
three weeks meant a faster, more efficient response<br />
time <strong>and</strong> the ability <strong>for</strong> thous<strong>and</strong>s of homeowners to<br />
return to their properties quickly <strong>and</strong> rebuild their<br />
lives.<br />
Figure 2: In<strong>for</strong>mation was easily integrated into Victoria Police's Web mapping site using a Web<br />
map server feed.
Case Study: GIS Enhances China Relief Ef<strong>for</strong>ts<br />
On May 12, 2008, an earthquake measuring 7.9<br />
struck Sichuan Province in southwestern China. It<br />
was the country's worst natural disaster in more<br />
than 30 years. Roads cracked; buildings burst; <strong>and</strong><br />
terrible destruction resulted in approximately<br />
70,000 killed, 20,000 missing, <strong>and</strong> more than 5<br />
million homeless.<br />
GIS was used in many ways to assist in response <strong>and</strong><br />
recovery:<br />
Epidemic Monitoring<br />
An epidemic monitoring <strong>and</strong> reporting system was<br />
developed using mobile phones. Staff visited various<br />
clinics <strong>and</strong> medical facilities to collect data, using<br />
GPS-enabled phones <strong>and</strong> devices that could<br />
wirelessly transmit data tied to locations back to the<br />
primary epidemic tracking system.<br />
Resource Planning<br />
The Ministry of Civil Affairs In<strong>for</strong>mation Center<br />
launched the Sichuan Earthquake Portal as a<br />
comprehensive earthquake status, relief, <strong>and</strong><br />
recovery in<strong>for</strong>mation system. Civil Affairs staff could<br />
assess risks <strong>and</strong> hazards to populations, property,<br />
<strong>and</strong> natural resources while prioritizing where<br />
refugee camps should be placed <strong>and</strong> determining<br />
how <strong>and</strong> where resources needed to be supplied to<br />
each camp.<br />
Situational Awareness<br />
The Inner Mongolia Public Security Bureau deployed<br />
an Emergency Comm<strong>and</strong> System supporting the<br />
operation of 20 emergency vehicles. The vehicles,<br />
equipped with GPS <strong>and</strong> GIS, used an automated<br />
vehicle location system to track activities. As vehicles<br />
picked up injured people <strong>and</strong> transferred them to<br />
hospitals, staff could monitor events from the bureau<br />
in real time to see where trucks were at all times <strong>and</strong><br />
ensure operations were running as smoothly as<br />
possible.<br />
The Ministry of Transport collected image <strong>and</strong><br />
remote-sensing in<strong>for</strong>mation to assess road damage.<br />
It distributed the new data to other agencies to<br />
support their specific missions. For instance,<br />
government officials could look at an area where<br />
food assistance was needed, see which roadways<br />
were not usable, <strong>and</strong> determine alternate routes to<br />
get supplies to where they were needed as quickly as<br />
possible.<br />
Figure 3: A resident distribution map<br />
helped control outbreaks of disease.<br />
Rings describe the path of outbreak <strong>and</strong><br />
population centres affected.<br />
Health<br />
The Shanghai Bureau of Health used GIS softwarebased<br />
medical support system to send health<br />
officials into the field to provide services <strong>and</strong><br />
situational updates on items such as the number of<br />
wounded, types of incidents occurring, available staff<br />
on-site, <strong>and</strong> additional staffing requirements needed.<br />
Similar to the work done by China CDC, health staff<br />
would visit medical centres <strong>and</strong> per<strong>for</strong>m statistical<br />
audits that were captured on their mobile devices.<br />
When they returned to their comm<strong>and</strong> centres, the<br />
captured data was uploaded <strong>for</strong> senior health<br />
managers to see exactly what was happening <strong>and</strong><br />
where.<br />
GIS helped create a virtual network that connected<br />
people, organizations, <strong>and</strong> resources <strong>and</strong> provided<br />
an integrated operational plat<strong>for</strong>m.<br />
97
Case Study: Aceh Province, Indonesia<br />
Easily the largest natural disaster in recent history,<br />
the 9.1-magnitude earthquake <strong>and</strong> resulting tsunami<br />
on December 26, 2004, brought incredible<br />
devastation to many coastal countries in South East<br />
Asia. From the beginning, GIS played an important<br />
role in relief ef<strong>for</strong>ts. GIS maps acted as guides to<br />
affected areas <strong>and</strong> were used to coordinate<br />
emergency services <strong>and</strong> rebuilding.<br />
To begin coordination of the relief ef<strong>for</strong>t, emergency<br />
responders needed to be guided to affected areas.<br />
Maps were required to visualize where supplies<br />
should go <strong>and</strong> which organizations would be able to<br />
assist. Within days of the devastation, the United<br />
Nations (UN) set up a Humanitarian In<strong>for</strong>mation<br />
Centre (HIC). Based in tents at the heart of the<br />
catastrophe, HIC collected data from the Indonesian<br />
government, nongovernmental organizations<br />
(NGOs), <strong>and</strong> international agencies. UN HIC delivered<br />
GIS data <strong>and</strong> maps to the responding humanitarian<br />
community, allowing workers to deliver assistance<br />
more effectively immediately after the emergency.<br />
GIS Use during Tsunami <strong>Disaster</strong> Response<br />
Apart from providing in<strong>for</strong>mative topographic maps<br />
to coordinate relief ef<strong>for</strong>ts, GIS was used in specific<br />
sectors during the initial response to the disaster.<br />
Health<br />
The most immediate concerns were the containment<br />
of any outbreak of disease <strong>and</strong> prevention of further<br />
deaths as a result of starvation. In<strong>for</strong>mation on the<br />
location <strong>and</strong> number of survivors, as well as the<br />
extent of their injuries, was urgently needed to<br />
provide food, water, <strong>and</strong> medical supplies.<br />
The UN HIC team, working with the UN World Health<br />
Organization (WHO), set about collating <strong>and</strong><br />
98<br />
evaluating data using GIS to create an accurate<br />
picture of the damage <strong>and</strong> prioritize need. Activities<br />
were coordinated <strong>and</strong> prioritized; field hospitals <strong>and</strong><br />
mobile health clinics were set up where needed. No<br />
major outbreak of disease occurred, <strong>and</strong> there were<br />
few deaths, contrary to expectations after a disaster<br />
of this magnitude.<br />
Mobile Resource Planning<br />
Since the main west road <strong>and</strong> all seaports were not<br />
usable, transporting food, water, <strong>and</strong> medical<br />
supplies seemed nearly impossible. GIS was used to<br />
plan movement of trucks <strong>and</strong> prioritize shipments.<br />
Infrastructure<br />
Many groundwater reservoirs were polluted,<br />
sanitation at temporary shelters was an issue, <strong>and</strong><br />
drinking water had to be trucked in to the city. GIS<br />
was used to identify risk areas <strong>and</strong> develop<br />
management plans.<br />
Education<br />
Since 50 percent of the schools in the area were<br />
damaged or destroyed, GIS was used to discover<br />
where best to build, or not build, new schools based<br />
on population density <strong>and</strong> proximity to health<br />
facilities. An assessment of damaged facilities was<br />
also taken to identify which ones could be restored<br />
more quickly.<br />
Housing<br />
The simple act of providing shelter presented many<br />
challenges. More than half a million people were left<br />
homeless when l<strong>and</strong> washed away <strong>and</strong> traditional<br />
l<strong>and</strong> markers vanished. L<strong>and</strong> that remained had to<br />
be cleared of millions of tons of debris <strong>and</strong> silt be<strong>for</strong>e<br />
it could be used again, <strong>and</strong> many areas were no<br />
Figure 4: UN HIC worked with WHO to collect <strong>and</strong><br />
evaluate data, using GIS to create an accurate<br />
picture of the damage <strong>and</strong> prioritize need<br />
longer suitable housing locations because of the<br />
impact of the earthquake.<br />
The international aid community responded to the<br />
problem by going to the field to map where houses<br />
once stood <strong>and</strong> determine who owned the<br />
properties. Pseudo l<strong>and</strong> titles were issued with the<br />
signatures of all neighbours <strong>and</strong> the village leader.<br />
GIS was seen as a crucial tool to assist this<br />
coordination among many agencies as they<br />
scrambled to rebuild. While it may take decades <strong>for</strong><br />
affected communities in Australia, China <strong>and</strong><br />
Indonesia to fully recover from the devastation, GIS<br />
will continue to play an important role in the<br />
sustainable development, repatriation, <strong>and</strong><br />
restoration of the disaster affected areas.
REFERENCES<br />
Adams, B.J., Huyck, C.K., Mansouri, B., Eguchi, R.T. <strong>and</strong> Shinozuka, M. (2004a)<br />
Application of high-resolution optical satellite imagery <strong>for</strong> post-earthquake<br />
damage assessment: The 2003 Boumerdes (Algeria) <strong>and</strong> Bam (Iran)<br />
earthquakes, MCEER Research <strong>and</strong> Accomplishments 2003-2004, MCEER:<br />
Buffalo.<br />
Aduah, M., Maathuis, B. & Ali Hussin, Y. 2007. Synergistic use of optical <strong>and</strong> radar<br />
remote sensing <strong>for</strong> mapping <strong>and</strong> monitoring flooding system in Kafue flats<br />
wetl<strong>and</strong> of southern Zambia. <strong>ISPRS</strong> Commission VII meeting, Instanbul.<br />
Ajmar, A. 2007. WFP SDI in support to a UN SDI. Preliminary proposal.<br />
http://www.ungiwg.org/docs/unsdi/ WFP-SDI_ Proposal.pdf<br />
Andres, R. J. <strong>and</strong> Kasgnoc, A. D., "A time-averaged inventory of subaerial volcanic<br />
sulfur emissions". J. Geophys. Res. 103(D-19), 25251-25261 (1998).<br />
Andronico D., Spinetti C., Cristaldi A., Buongiorno M.F., "Observations of Mt. Etna<br />
volcanic ash plumes in 2006: an integrated approach from ground-based <strong>and</strong><br />
polar satellite monitoring system". J. Volcanol. Geotherm. Res. (2009),<br />
DOI:10.1016/j.jvolgeores.2008.11.013.<br />
Australia Indonesia Partnership <strong>for</strong> Reconstruction <strong>and</strong> Development (AIPRD)<br />
(2006). AusAID, Assessment of Priority Mapping Needs Nanggroe Aceh<br />
Darussalam <strong>and</strong> Nias Isl<strong>and</strong>, Northern Sumatra.<br />
Bevington, J., Adams, B.J., Verrucci, E., Rossetto, T., Evans, Amyx, P. <strong>and</strong> Honey, M.<br />
(2009) Virtual <strong>Disaster</strong> Viewer: Underst<strong>and</strong>ing disasters through shared<br />
knowledge: The story so far, Proceedings of the Seventh International Workshop<br />
on Remote Sensing <strong>for</strong> <strong>Disaster</strong> Response, University of Austin, October 2009.<br />
Bijker, W. <strong>and</strong> Sanjaya, H., 2008: Use of Geographical In<strong>for</strong>mation System <strong>for</strong><br />
Audit of <strong>Disaster</strong>-Related aid, Final Report; SAADRA Program TF 057426. BPK,<br />
Jakarta, <strong>and</strong> ITC, Enschede.<br />
Brakenridge, G. & Anderson, E. 2003. Satellite gaging reaches: A strategy <strong>for</strong><br />
MODIS-based river monitoring. 9th Int. Symp. Remote Sens., Int. Soc. Opt. Eng.<br />
(SPIE), Crete: 479485.<br />
Briess, K, H. Jahn, E. Lorenz, D. Oertel, W. Skrbek <strong>and</strong> B. Zhukov, Remote Sensing<br />
Potential of the Bi-spectral InfraRed Detection (BIRD) Satellite. Int. J. Remote<br />
Sensing, 24, 865-872 (2003).<br />
Budge, A.M., K.K. Benedict <strong>and</strong> W. Hudspeth. 2006. Developing Web-based<br />
Mapping Services <strong>for</strong> Public Health. In: Nayak, S., Pathan, S.K., <strong>and</strong> Garg, J.K,<br />
Geospatial Databases <strong>for</strong> Sustainable Development. The Int. Soc. <strong>for</strong> Photog. <strong>and</strong><br />
Rem. Sens. 36(4-B): 565-569.<br />
Bush, R. (1988): Hunger in Sudan: The Case of Darfur. African Affairs, Vol.<br />
87:346, 5-23.<br />
Chinese President Hu Jintao, Speech at the ceremony honoring organizations <strong>and</strong><br />
individuals <strong>for</strong> their contributions to relief work after the May 12 earthquake at<br />
the Great Hall of the People in Beijing, China, Oct. 8, 2008.<br />
http://news.xinhuanet.com/english/2008-10/08/content_10166294.htm; PPT<br />
CRED (2008) EM-DAT: The OFDA/CRED International <strong>Disaster</strong> Database,<br />
www.em-dat.net.<br />
Csiszar I. (Univ. of Maryl<strong>and</strong>), ECV T13: Fire Disturbance, Assessment of the<br />
Status of the development of st<strong>and</strong>ards <strong>for</strong> the Terrestrial Essential Climate<br />
Variables, Global Terrestrial Observation System (GTOS) draft report, Rome,<br />
1<br />
(2008) .<br />
Dobson, J., Bright, E., Coleman, P., Durfee, R. & Worley, B. 2000. L<strong>and</strong>Scan: A<br />
global population database <strong>for</strong> estimating populations at risk. Photogramm. Eng.<br />
Remote Sens 66, 7: 849857.<br />
Du, Y., 2008: Verification of tsunami reconstruction projects by object-oriented<br />
building extraction from high resolution satellite imagery; ITC, Enschede, The<br />
Netherl<strong>and</strong>s MSc thesis;<br />
http://www.itc.nl/library/papers_2008/msc/gfm/duye.pdf<br />
Ebert, A., Kerle, N., Stein, A. (2009) Urban social vulnerability assessment with<br />
physical proxies <strong>and</strong> spatial metrics derived from air- <strong>and</strong> spaceborne imagery<br />
<strong>and</strong> GIS data. Natural Hazards 48, 275-294.<br />
Eidinger et al (2001): Gujarat (Kutch) India Earthquake of January 26, 2001<br />
Lifeline Per<strong>for</strong>mance. Technical council of lifeline earthquake engineering<br />
Fan Yida, 2008, Study on urgent monitoring <strong>and</strong> assessment in Wenchuan<br />
Earthquake, Journal of Remote Sensing,12(6):858-864<br />
FAO. 2004. FAO Spatial In<strong>for</strong>mation Infrastructure. GeoNetwork. Status Report.<br />
SDRN.<br />
1<br />
.:<br />
With contributions from: Olivier Arino (European Space Agency), Raffaella Geraci (United Nations Food <strong>and</strong><br />
Agriculture Organization), Louis Giglio (Science Systems <strong>and</strong> Applications Inc., USA), Johann G. Goldammer<br />
99
ftp://ftp.fao.org/unfao/bodies/ coaim/pdf/geonetwork.pdf<br />
Giada S., De Groeve T., Ehrlich D. <strong>and</strong> Soille P. (2003) 'In<strong>for</strong>mation extraction<br />
from very high resolution satellite imagery over Lukole refugee camp,<br />
Tanzania', International Journal of Remote Sensing, 24:22, 4251-4266.<br />
Gillespie, A. <strong>and</strong> Adams, B.J. (2008) An introduction to the International Charter:<br />
Space <strong>and</strong> Major <strong>Disaster</strong>s, Proceedings of the Sixth International Workshop on<br />
Remote Sensing <strong>for</strong> <strong>Disaster</strong> Response, EUCentre Pavia, September 2008.<br />
http://tlc.unipv.it/6_RSDMA/6th%20Workshop%20Program.htm<br />
Glabsch, J., Heunecke, O., Schuhbäck, S. (2009a): Monitoring the Hornbergl<br />
l<strong>and</strong>slide using a recently developed low cost GNSS sensor network. Journal of<br />
Applied Geodesy, No. 3, pp. 179-192, de Gruyter publishing house, Berlin.<br />
Glabsch, J., Heunecke, O., Schuhbäck, S. (2009b): A low cost PDGNSS based<br />
sensor network <strong>for</strong> l<strong>and</strong>slide monitoring. Paper submitted to International<br />
Journal of Digital Earth (IJDE).<br />
Grimm, N.B., Faeth, S.H., Golubiewski, N.E., Redman, C.L., Wu, J.G., Bai, X.M.,<br />
Briggs, J.M. (2008) Global change <strong>and</strong> the ecology of cities. Science 319, 756-760.<br />
Guglielmino F., Spinetti C., Bon<strong>for</strong>te A., Buongiorno M.F., Fernández J., Puglisi G.,<br />
"Pre-Operative Test-Case of Eurorisk-Preview Project During the 2006 Mt. Etna<br />
Eruption". ESA Envisat Symposium proceedings (2007).<br />
Günther, J., Heunecke, O., Pink, S., Schuhbäck, S. (2008): Developments towards a<br />
low cost GNSS based sensor network <strong>for</strong> the monitoring of l<strong>and</strong>slides. 13th FIG<br />
International Symposium on De<strong>for</strong>mation Measurements <strong>and</strong> Analysis, Lisbon,<br />
May 12 15 2008.<br />
Henricksen, B. 2007. A UNSDI Vision, Implementation Strategy <strong>and</strong> Reference<br />
Architecture. UNGIWG. www.ungiwg.<br />
org/docs/unsdi/UNSDI_Compendium_13_02_2007.pdf<br />
Henry, J., Chastanet, P., Fellah, K. & Desnos, Y. 2003. ENVISAT Multi-Polarised<br />
ASAR Data <strong>for</strong> flood Mapping: 11361138. 0-7803-7929-2/03. IEEE.<br />
(Global Fire Monitoring Center, Max Planck Institute <strong>for</strong> Chemistry, Germany), William de<br />
Groot (Natural Resources Canada, Canadian Forest Service), Christopher O. Justice<br />
(University of Maryl<strong>and</strong>, USA)<br />
Shobha Kondragunta (National Oceanic <strong>and</strong> Atmospheric Administration, USA), Elaine<br />
Prins (University of Wisconsin, Madison Cooperative Institute <strong>for</strong> Meteorological Satellite<br />
Studies - Consultant, USA), Reuben Sessa (United Nations Food <strong>and</strong> Agriculture<br />
Organization), Kevin Tansey (University of Leicester, UK), Martin Wooster (King's College<br />
London, UK).<br />
100<br />
Henry, J., Fellah, K., Cl<strong>and</strong>illon, S., Allenbach, B. & De Fraipont, P. 2002. Earth<br />
observation <strong>and</strong> case-based systems <strong>for</strong> flood risk management: 14961498. 0-<br />
7803-7536-X. IEEE.<br />
Idmc (2009): Internal Displacement: Global Overview of Trends <strong>and</strong><br />
Developments in 2008<br />
International Charter (2009) International Charter "Space <strong>and</strong> Major <strong>Disaster</strong>s”,<br />
http://www.disasterscharter.org.<br />
INTOSAI Tsunami Task Force, 2008: Lessons on the Accountability <strong>for</strong> <strong>and</strong> Audit<br />
of <strong>Disaster</strong>-related Aid; http://eca.europa.eu/portal/page/portal/intosaiaada/home.<br />
Jäger, R., Kälber, I., Oswald, M., Bertges, M. (2006): GNSS/GPS/LPS based Online<br />
Control <strong>and</strong> Alarm System (GOCA) - Mathematical Models <strong>and</strong> Technical<br />
Realisation of a System <strong>for</strong> Natural <strong>and</strong> Geotechnical De<strong>for</strong>mation Monitoring<br />
<strong>and</strong> Analysis -, in: Proceedings of 3rd IAG / 12th FIG Symposium, Baden, May<br />
2224, 2006.<br />
Kaiser, J. 2005. Mounting evidence indicts fine particle pollution. Science<br />
307(1717): 1858-1861.<br />
Kemper T., Jenerowicz M., Soille P., Pesaresi M. (2010): Detection of dwellings in<br />
Darfur camps. Submitted to IEEE Journal of Selected Topics in Applied Earth<br />
Observations <strong>and</strong> Remote Sensing<br />
Kerle, N., Alkema, D. (in press) Multi-scale flood risk assessment in urban areas<br />
of South-East Asia In: Richter, M., Weil<strong>and</strong>, U. (eds.) Applied Urban Ecology: A<br />
Global Framework Blackwell Publishing Ltd Ox<strong>for</strong>d, UK.<br />
Kerle, N., Heuel, S., Pfeifer, N. (2008) Real-time data collection <strong>and</strong> in<strong>for</strong>mation<br />
generation using airborne sensors. In: Zlatanova, S., Li, J. (eds.) Geospatial<br />
in<strong>for</strong>mation technology <strong>for</strong> emergency response. Taylor & Francis, Leiden, The<br />
Netherl<strong>and</strong>s, 43-74.<br />
Kidd, R., McCallum, I., Fritz, S., Kraxner, F., Obersteiner, M. (2009). GEO<br />
In<strong>for</strong>mation For <strong>Disaster</strong> Recovery - Case Study: The use of Orthophotos in Aceh,<br />
Indonesia. IIASA Interim Report IR-09-011, 49 pp.<br />
Kranz O., Lang S., Cl<strong>and</strong>illon S. (2009b): Earth Observation in Conflict Mitigation.<br />
Co-ordinated Mission. GIM International, Issue 7, Volume 23, July 2009
Kranz O., Lang S., Tiede D., Zeug G., Kemper T., Caspard M., Cl<strong>and</strong>illon S. (2009a):<br />
GMES Services <strong>for</strong> Conflict Prevention <strong>and</strong> Mitigation: Supporting the DG RELEX<br />
in Mission Planning. In: <strong>Geoin<strong>for</strong>mation</strong> <strong>and</strong> Cartography <strong>for</strong> early warning <strong>and</strong><br />
crisis response (in press), 179 - 196.<br />
Kummerow, C., Barnes, W., Kozu, T., Shiue, J., Simpson, J. (1998) The Tropical<br />
Rainfall Measuring Mission (TRMM) sensor package. Journal of Atmospheric <strong>and</strong><br />
Oceanic Technology 15, 809-817.<br />
Li Deren, 2009, Remote Sensing in the Wenchuan Earthquake, Photogrammetric<br />
Engineering & Remote Sensing Vol 75(5):506-509<br />
Li Suju, 2009, Natural disaster management based space technology in China,<br />
Presentations made at the 46th session of Scientific <strong>and</strong> Technical<br />
Subcommittee,http://www.unoosa.org/oosa/en/COPUOS/stsc/2009/presentai<br />
ons<br />
Mansourian, A., Rajabifard, A. & Javad, M. 2005. SDI conceptual modeling <strong>for</strong><br />
disaster management. <strong>ISPRS</strong> Workshop on Service <strong>and</strong> Application of Spatial<br />
Data Infrastructure, Hangzhou XXXVI (4/W6): 125130.<br />
McCallum, I., Kidd, R., Fritz, S., Kraxner, F., Obersteiner, M., (2008). B<strong>and</strong>a Aceh-<br />
The Value of Earth Observation Data in <strong>Disaster</strong> Recovery <strong>and</strong> Reconstruction: A<br />
Case Study. IIASA Interim Report IR-08-048, 24 pp.<br />
MCEER, (2009) Major Indian Earthquakes of the 20th Century.<br />
http://mceer.buffalo.edu/infoservice/Reference_Services/major_indian_earthqu<br />
ake.asp<br />
Morain, S. <strong>and</strong> W. Sprigg. 2005. Initial Benchmark Report <strong>for</strong> Public Health. NASA<br />
Cooperative Agreement NNS04AA19A. Sep. 30. 36 pages.<br />
Morain, S. <strong>and</strong> W. Sprigg. 2007. Verification <strong>and</strong> Validation Report. NASA<br />
Cooperative Agreement NNSO4AA19A. Sep 30, 21 pages.<br />
Morain, S.A. <strong>and</strong> A.M. Budge, 2008. Environmental Sensing <strong>and</strong> Human Health.<br />
Chapter 29 in: Z. Li, J. Chen, <strong>and</strong> E. Baltsavias (eds.), Advances in<br />
Photogrammetry, Remote Sensing <strong>and</strong> Spatial Analysis. Leiden: CRC<br />
Press/Balkema.<br />
Morain, S.A. <strong>and</strong> W.S. Sprigg. 2008. Final Benchmark Report on Public Health<br />
Applications in Remote Sensing. NASA Cooperative Agreement NNSO4AA19A.<br />
Sep 30. 98 pages.<br />
Nickovic, S., G. Kallos, A. Papadopoulos <strong>and</strong> O. Kakaliagou. 2001. A Model <strong>for</strong><br />
Prediction of Desert Dust Cycle in the Atmosphere. JGR, 106(18):113-119.<br />
OCHA (2007): Camp data.<br />
[http://www.unsudanig.org/library/mapcatalogue/darfur/ data/camps/], (20<br />
August 2008)<br />
Oertel D. (German Aerospace Center - DLR), ECOFIRE Study on Scientific<br />
Assessment of Space-borne High Temperature Event Observing Mission<br />
Concepts, (ESA/ESTEC Contract 17690/30/NL/FF) Berlin, (2005)²<br />
Pink, S. (2007): Entwicklung und Erprobung eines multifunktionalen<br />
Geosensornetzwerkes für ingenieurgeodätische Überwachungsmessungen,<br />
Dissertation, Scientific series of the Studiengang Geodäsie <strong>and</strong> <strong>Geoin<strong>for</strong>mation</strong>,<br />
University of the Federal Armed Forces of Germany in Munich, Issue 83.<br />
Prasad, J.S.R., Yogendra, S., Kaynia, & Lindholm, C. (2009): Socioeconomic<br />
Clusting in Seismic <strong>Risk</strong> Assessment of Urban Housing Stock. Earthquake<br />
Spectra, Vol. 25 /3, pp. 619-614<br />
Puglisi G., Bon<strong>for</strong>te A., Ferretti A., Guglielmino F., Palano M., Prati C., "Dynamics of<br />
Mt. Etna be<strong>for</strong>e, during, <strong>and</strong> after the July-August 2001 eruption inferred from<br />
GPS <strong>and</strong> differential synthetic aperture radar interferometry data", J. Geophys.<br />
Res., 113, B06405, (2008), DOI: 10.1029/2006JB004811.<br />
Revi, A. (2008): Climate change risk: an adaptation <strong>and</strong> mitigation agenda <strong>for</strong><br />
Indian cities. Environment & Urbanization. International Institute <strong>for</strong><br />
Environment <strong>and</strong> Development (IIED)<br />
Romano R., "Succession of volcanic activity in the Etnean area". Mt. Etna a<br />
Review of Recent Earth Sciences Studies, Mem. Soc. Geol. It. 23, 27-48 (1982).<br />
Schumann, G., Hostache, R., Puech, C. & Hoffmann, L. 2007. High-resolution 3-D<br />
flood in<strong>for</strong>mation from radar imagery <strong>for</strong> flood hazard management. IEEE<br />
transactions on geoscience <strong>and</strong> remote sensing 45, 6: 17151725.<br />
Skrbek W. <strong>and</strong> E. Lorenz, HSRS An infrared sensor <strong>for</strong> hot spot detection. Proc.<br />
SPIE, 3437, 167176 (1998).<br />
With contributions from: Boris Zhukov, Eckehard Lorenz, Volker Tank, Michael Hess, Stefan Voigt,<br />
Franz Schreier, Thomas Holzer-Popp, Doris Hiepe (German Aerospace Center /DLR/, Germany),<br />
Martin Wooster (Department of Geography King's College London /KCL/, University of London, United<br />
Kingdom), Florian Siegert (Remote Sensing Solution GmbH /RSS/,Germany), Johannn G. Goldammer<br />
(Global Fire Monitoring Center(GFMC/, Max Planck Institute <strong>for</strong> Chemistry, Germany), Susana<br />
Martinez (Ingeneria y Servicios Aerospaciales S. A. /INSA/, Spain), Hendrik Lübberstedt (OHB-System<br />
/OHB/Germany).<br />
101
Smit, B., Pilifosova, O. (2003) From adaptation to adaptive capacity <strong>and</strong><br />
vulnerability reduction. In: Huq, S., Smith, J., Klein, R.T.J. (eds.) Enhancing the<br />
Capacity of Developing Countries to Adapt to Climate Change. Imperial College<br />
Press, London, 9-25.<br />
Smith, K. (2004) Environmental Hazards. Routledge, London <strong>and</strong> New York.<br />
Spinetti C. <strong>and</strong> Buongiorno M.F., "Volcanic Aerosol Optical Characteristics of Mt.<br />
Etna Tropospheric Plume Retrieved by Means of Airborne Multispectral Images.<br />
J. Atm. Solar-Ter. Phys., 69 (9), 981-994 (2007), DOI:<br />
10.1016/j.jastp.2007.03.014.<br />
Thuro, K., Wunderlich, Th., Heunecke, O., Singer, J., Schuhbäck, S., Wasmeier, P.,<br />
Glabsch, J., Festl, J. (2009a): Low cost 3D early warning system <strong>for</strong> instable alpine<br />
slopes the Aggenalm L<strong>and</strong>slide monitoring system. Geomechanics <strong>and</strong><br />
Tunnelling 2 (2009), No. 3, pp. 221 237, Ernst & Sohn publishing house, Berlin.<br />
Thuro, K., Wunderlich, Th., Heunecke, O., Singer, J., Wasmeier, P., Schuhbäck, S.,<br />
Festl, J., Glabsch, J. (2009b): alpEWAS The Aggenalm L<strong>and</strong>slide Innovative<br />
Developments <strong>for</strong> an Effective Geo Sensor Network <strong>for</strong> L<strong>and</strong>slide Monitoring <strong>and</strong><br />
Early Warning. In Stroink, L. (ed.): Geotechnologien Science Report No. 13, pp. 33<br />
48, Status Seminar 12 13 October 2009, Technische Universität München<br />
UN (2008): Population Division of the Department of Economic <strong>and</strong> Social<br />
Affairs of the United Nations Secretariat, World Population Prospects: The 2008<br />
Revision.<br />
UN. 2006a. Delivering as One. Report of the High-level Panel on UN System-wide<br />
Coherence in the areas of Development, Humanitarian Assistance <strong>and</strong> the<br />
Environment. http://www.un.org/events/panel/resources/pdfs/HLP-SWC-<br />
FinalReport.pdf<br />
UN. 2006b. Investing in the UN: For A Stronger Organization Worldwide. New<br />
York: UN Department <strong>for</strong> Public In<strong>for</strong>mation.<br />
http://www.un.org/re<strong>for</strong>m/investinginun/pdfs/re<strong>for</strong>mbook.pdf<br />
UN. 2008. Report on activities carried put in 2007 in the framework of the UN<br />
Plat<strong>for</strong>m <strong>for</strong> Space-Based Infromation <strong>for</strong> <strong>Disaster</strong> <strong>Management</strong> <strong>and</strong> Emergency<br />
Response. http://www.unoosa.org/pdf/reports/ac105/AC105_899E.pdf<br />
UNEP (2008): Destitution, distortion <strong>and</strong> de<strong>for</strong>estation. The impact of conflict on<br />
the timber <strong>and</strong> woodfuel trade in Darfur. Geneva: United Nations Environment<br />
Program.<br />
102<br />
UNHCR (2006): Specifications <strong>and</strong> List of tests <strong>for</strong> future reference Light-Weight<br />
Emergency Tent (UNHCR LWET).<br />
[http://www.unhcr.org/admin/ADMIN/44c48eca2.pdf], (20 August 2008)<br />
UNHCR (2009a): Figures at a Glance.<br />
[http://www.unhcr.org/pages/49c3646c11.html], (27.10.2009)<br />
UNHCR (2009b), Global Appeal 2009 Sudan. [http://www.unhcr.org/cgibin/texis/vtx/page?page=49e483b76],<br />
(27.10.2009)<br />
UNHCR (2009c): 2008 Global Trends: Refugees, Asylum-seekers, Returnees,<br />
Internally Displaced <strong>and</strong> Stateless Persons.<br />
[http://www.unhcr.org/4a375c426.html] (08.11.2009)<br />
Voigt, S., Kemper, T., Riedlinger, T., Kiefl, R., Scholte, K. & Mehl, H. 2007. Satellite<br />
image analysis <strong>for</strong> disaster <strong>and</strong> crisis-management support. IEEE transactions on<br />
geoscience <strong>and</strong> remote sensing 45, 6: 15201528.<br />
Wang, S., Liu, Y., Yi, Z. & Wei, C. 2002. Study on the method of extablishment of<br />
normal water extent database. Flood monitoring using remote sensing: 2048-<br />
2050. 0-7803-7536-X. IEEE.<br />
Waypoint (2007): Waypoint Product Group, GrafNav/GrafNet User Guide,<br />
Publication Number OM-200000105.<br />
Wisner, B., Blaikie, P., Cannon, T., Davis, I. (2003) At <strong>Risk</strong>: Natural Hazards,<br />
People's Vulnerability <strong>and</strong> <strong>Disaster</strong>s. Routledge, London.<br />
Wooster M., B. Zhukov <strong>and</strong> D. Oertel, Fire radiative energy release <strong>for</strong><br />
quantitative study of biomass burning: derivation from the BIRD experimental<br />
satellite <strong>and</strong> comparison to MODIS fire products, Remote Sens. Environm., 86,<br />
83-107 (2003).<br />
Yin, D., S. Nickovic, B. Barbaris, B. Ch<strong>and</strong>y <strong>and</strong> W. Sprigg. 2005. Modeling Windblown<br />
Desert Dust in the Southwestern United States <strong>for</strong> Public Health Warning:<br />
a Case Study. Atmospheric Environment, 39 pp. 6243-6254.<br />
Zhang, Y., Kerle, N. (2008) Satellite remote sensing <strong>for</strong> near-real time data<br />
collection. In: Zlatanova, S., Li, J. (eds.) Geospatial In<strong>for</strong>mation Technology <strong>for</strong><br />
Emergency Response. Springer, 75-102.<br />
Zou Ming, 2009, Atlas of disaster monitoring <strong>and</strong> evaluation on Wenchuan<br />
Earthquake:120
Support from Space: The United<br />
Nations Plat<strong>for</strong>m <strong>for</strong> Space-based<br />
In<strong>for</strong>mation <strong>for</strong> <strong>Disaster</strong><br />
<strong>Management</strong> <strong>and</strong> Emergency<br />
Response (UN-SPIDER)<br />
Robert Backhaus, Lorant Czaran, Natalie Epler,<br />
Michael Leitgab, Young Suc Lyu, Shirish Ravan,<br />
David Stevens, Peter Stumpf, Joerg Szarzynski,<br />
Juan-Carlos Villagran de Leon<br />
United Nations Office <strong>for</strong> Outer Space Affairs (UNOOSA)<br />
W<br />
Why Space-based In<strong>for</strong>mation <strong>for</strong> <strong>Disaster</strong><br />
<strong>Management</strong>?<br />
During a disaster, situational awareness can mean<br />
the difference between life <strong>and</strong> death. Satellites<br />
provide reliable <strong>and</strong> rapid communication,<br />
observation <strong>and</strong> positioning tools, especially when<br />
crucial on-the-ground infrastructure is damaged.<br />
<strong>Risk</strong> assessment, disaster mitigation <strong>and</strong> prevention<br />
also benefit greatly from space-based data. In<br />
general terms, applying space technology to support<br />
disaster management in its various aspects, requires<br />
the application of suitable spectral ranges of<br />
electromagnetic radiation <strong>for</strong> observation <strong>and</strong><br />
imaging, atmospheric sounding, radio<br />
communication, navigation <strong>and</strong> positioning, while<br />
taking advantage of the orbital positions of satellites.<br />
Images from earth observing satellites are used to<br />
produce maps of disaster areas <strong>for</strong> overview<br />
in<strong>for</strong>mation <strong>and</strong> damage assessment, <strong>and</strong> to provide<br />
specific data layers <strong>for</strong> applications in Geographic<br />
In<strong>for</strong>mation Systems (GIS), e.g. <strong>for</strong> early warning,<br />
risk <strong>and</strong> vulnerability mapping.<br />
Figure 1: Flooded farm l<strong>and</strong> <strong>and</strong> infrastructure in northern Namibia in January 2010<br />
103
Satellite communication serves to warn people at<br />
risk in remote areas, <strong>and</strong> to connect a disaster area<br />
to the outside world, providing medical in<strong>for</strong>mation<br />
(telemedicine) or geographic in<strong>for</strong>mation <strong>and</strong> data<br />
to support mapping activities. Global Navigation<br />
Satellite Systems (GNSS) provide positional<br />
in<strong>for</strong>mation on disaster related events <strong>and</strong> objects<br />
<strong>and</strong> support relief <strong>for</strong>ces in the field.<br />
Nevertheless, potential users worldwide are still<br />
facing questions about the existence, availability,<br />
accessibility, quality, costs, <strong>and</strong> timeliness of spacebased<br />
in<strong>for</strong>mation. There is clearly still a widespread<br />
need <strong>for</strong> an in<strong>for</strong>mation gateway to space-based<br />
in<strong>for</strong>mation <strong>for</strong> disaster management support.<br />
104<br />
Where mechanisms <strong>for</strong> providing earth observation<br />
data <strong>for</strong> disaster management are already available,<br />
their applications are restricted to supporting only<br />
response measures in the immediate aftermath of a<br />
disastrous event, not <strong>for</strong> covering pre-disaster<br />
activities such as mitigation <strong>and</strong> early warning, or<br />
monitoring of slow-onset disasters. An outst<strong>and</strong>ing<br />
example of these restrictions is given by the Terms of<br />
Reference of the International Charter Space <strong>and</strong><br />
Major <strong>Disaster</strong>s.<br />
http://www.disasterscharter.org/web/charter/charter<br />
What is UN-SPIDER ? M<strong>and</strong>ate <strong>and</strong> Mission<br />
The world of disaster management <strong>and</strong> space-based<br />
technologies is complex. Knowledge <strong>and</strong> expertise<br />
are widely dispersed. Institutions <strong>and</strong> practitioners<br />
need support, orientation <strong>and</strong> advice to access <strong>and</strong><br />
use available data, in<strong>for</strong>mation, knowledge <strong>and</strong><br />
services. In recognition of these needs the United<br />
Nations General Assembly, in its resolution<br />
A/RES/61/110 of 14 December 2006, established<br />
UN-SPIDER as a programme implemented by the<br />
United Nations Office <strong>for</strong> Outer Space Affairs<br />
(UNOOSA), with the following mission statement:<br />
“Ensure that all countries <strong>and</strong> international <strong>and</strong><br />
regional organizations have access to <strong>and</strong> develop<br />
the capacity to use all types of space-based<br />
in<strong>for</strong>mation to support the full disaster<br />
management cycle.”<br />
UN-SPIDER is a plat<strong>for</strong>m which advances the use of<br />
space-based technologies <strong>for</strong> disaster management<br />
<strong>and</strong> emergency response, by<br />
� being a gateway to space in<strong>for</strong>mation <strong>for</strong><br />
disaster management support;<br />
�serving as a bridge to connect the disaster<br />
management <strong>and</strong> space communities;<br />
�being a facilitator of capacity-building <strong>and</strong><br />
institutional strengthening.<br />
To fulfil these tasks, the UN-SPIDER core team relies<br />
on a global network of Regional Support Offices <strong>and</strong><br />
National Focal Points.<br />
Figure 2: In the field: mobile satellite-based system<br />
<strong>for</strong> monitoring disaster areas, developed by the<br />
Institute <strong>for</strong> Communication <strong>and</strong> Navigation of the<br />
German Aerospace Center (DLR).
What UN-SPIDER is doing -<br />
Its Tools <strong>and</strong> Activities<br />
The goals of UN-SPIDER are to bring the conceptual<br />
tools to reality. In parallel, the organization of<br />
international <strong>and</strong> regional UN-SPIDER Workshops is<br />
a well-proven means to raise awareness, to transfer<br />
knowledge, to support the establishment of<br />
Communities of Practice, <strong>and</strong> to foster alliances.<br />
Between these events, the flow of in<strong>for</strong>mation is<br />
maintained by an E-Newsletter <strong>and</strong> monthly<br />
updates.<br />
SpaceAid<br />
The major field of work of UN-SPIDER comprises<br />
activities which might be described as brokering<br />
space-based in<strong>for</strong>mation, by developing <strong>and</strong><br />
implementing the SpaceAid concept. SpaceAid is UN-<br />
SPIDER's framework to facilitate fast <strong>and</strong> efficient<br />
access to space-based in<strong>for</strong>mation <strong>for</strong> countries, <strong>and</strong><br />
international <strong>and</strong> regional organizations. This<br />
includes all types of in<strong>for</strong>mation provided by earth<br />
observation satellites, communication satellites <strong>and</strong><br />
GNSS. The activation of the International Charter<br />
Space <strong>and</strong> Major <strong>Disaster</strong>s through UNOOSA on<br />
behalf of other UN agencies is also part of this<br />
framework.<br />
SpaceAid support can be accessed by the UN-SPIDER<br />
National Focal Points, UN-SPIDER Regional Support<br />
Offices <strong>and</strong> UN agencies. UN-SPIDER is also working<br />
on bringing in local partners. Authorized<br />
government agencies as well as major international<br />
<strong>and</strong> regional organizations will also have access to<br />
SpaceAid as procedures develop. Users can request<br />
the support of SpaceAid through a hotline that can<br />
be accessed by telephone, e-mail or fax. A central<br />
unit coordinates <strong>and</strong> follows-up on all requests. This<br />
framework is operational on a 24 hours<br />
per day/7 days a week basis in order to respond<br />
timely to a disaster.<br />
UN-SPIDER requests or facilitates the activation of<br />
international provider mechanisms, which includes<br />
the International Charter Space <strong>and</strong> Major <strong>Disaster</strong>s,<br />
Sentinel Asia, SAFER etc. This approach may be<br />
illustrated by a short case report.<br />
In Montserrat, a British Overseas Territory in the<br />
Caribbean, seismic activity at the Soufriere Hills<br />
Volcano started to increase on 26 July 2008. This<br />
volcano has been intermittently active <strong>for</strong> 13 years.<br />
On 28 July, an explosion took place on the west side<br />
of a large lava dome at the summit. The dome<br />
partially collapsed, <strong>and</strong> there was a strong possibility<br />
that the explosion had caused instability in the rest<br />
of the dome, which could cause further collapses <strong>and</strong><br />
endanger inhabited areas of the isl<strong>and</strong><br />
The Montserrat Volcano Observatory (MVO) is part<br />
of Montserrat's disaster management system <strong>and</strong><br />
plays an important role in providing early warning to<br />
the authorities of a possible eruption of the volcano.<br />
MVO Staff however, were not able to make any<br />
assessment of the stability of the dome at that time,<br />
due to persistent clouds obscuring the volcano.<br />
There<strong>for</strong>e, aerial surveys or optical satellite imagery<br />
could not be applied. An additional challenge was to<br />
obtain a set of comparable be<strong>for</strong>e/after images that<br />
would allow the staff to analyze the terrain <strong>and</strong><br />
determine the extent of change in the volcanic dome.<br />
Within this backdrop Roderick Stewart, MVO Acting<br />
Director, requested assistance from the scientific<br />
community, including his fellow participants at the<br />
recent UN-SPIDER workshop <strong>for</strong> the Caribbean<br />
region, in order to obtain satellite imagery of the<br />
volcano.<br />
The assistance obtained led to several satellite<br />
imagery acquisitions <strong>and</strong> the activation of the<br />
International Charter Space <strong>and</strong> Major <strong>Disaster</strong>s. A<br />
set of high resolution radar images fulfilled the<br />
requirements <strong>and</strong> were analyzed <strong>for</strong> terrain change<br />
after the explosion. The imagery allowed MVO to<br />
determine that the lava dome had not been<br />
destabilized by the explosion. As a result, the<br />
Government of Montserrat was able to save valuable<br />
resources by cancelling an evacuation that had been<br />
planned as a precautionary measure. While most of<br />
the International Charter activations happen after a<br />
disaster has struck, the Caribbean isl<strong>and</strong> of<br />
Montserrat provided an example of how satellite<br />
imagery can be used to assess <strong>and</strong> prepare <strong>for</strong> an<br />
imminent disaster.<br />
As a Cooperating Body to the Charter, UNOOSA has<br />
already been providing such support since 2003. It<br />
has requested the activation of the Charter a total of<br />
75 times by the end of March 2010, which makes the<br />
United Nations, through UNOOSA, the largest single<br />
user of the International Charter. Through the UN-<br />
SPIDER SpaceAid Framework, UNOOSA continues to<br />
be the main contributor to ensuring access <strong>and</strong> use<br />
of space-based in<strong>for</strong>mation to support emergency<br />
response in developing countries.<br />
In 2009, the SpaceAid framework has provided<br />
support to disaster response <strong>and</strong> recovery ef<strong>for</strong>ts in<br />
Morocco, Namibia, Tajikistan, Afghanistan, Senegal,<br />
Mauritania, Burkina Faso, the Philippines, Samoa,<br />
Laos <strong>and</strong> Fiji (in chronological order), followed by<br />
support <strong>for</strong> response <strong>and</strong> relief activities in the<br />
Solomon Isl<strong>and</strong>s, Haiti <strong>and</strong> Gaza/oPt, Cook Isl<strong>and</strong>s,<br />
Tonga, Ukraine, Chile, Ug<strong>and</strong>a <strong>and</strong> Turkey (as of 8<br />
March 2010).<br />
105
For each disaster, a SpaceAid Updates page is created<br />
on the UN-SPIDER Knowledge Portal, accumulating<br />
links to all available space-based in<strong>for</strong>mation <strong>and</strong><br />
sharing it widely to the disaster response<br />
community.<br />
The SpaceAid mechanism is open, <strong>and</strong> thus not<br />
limited in respect of users or providers, <strong>and</strong><br />
there<strong>for</strong>e it fills existing gaps in coverage. UN-<br />
SPIDER works with commercial providers of<br />
imagery <strong>and</strong> will <strong>for</strong>malize relations with<br />
st<strong>and</strong>ardized agreements. Users indicate their needs<br />
in consultation with UN-SPIDER experts. User<br />
requests are <strong>for</strong>warded to all partners of the<br />
framework. The providers select products to be<br />
provided on a voluntary basis. All partners have the<br />
opportunity to contribute to any request, <strong>and</strong> all<br />
opportunities to obtain imagery free of charge will<br />
be exploited. Partners in<strong>for</strong>m other potential<br />
providers of their intended contribution on the UN-<br />
SPIDER Knowledge Portal to avoid duplication of<br />
ef<strong>for</strong>ts.<br />
In a collective ef<strong>for</strong>t, UN-SPIDER works with<br />
partners to develop an on-line tool to automatically<br />
task available satellites. Once the required<br />
technology becomes functional, SpaceAid will also be<br />
in a position to task multiple satellites according to<br />
the needs of requesting users. Tasking schedules <strong>and</strong><br />
available products will be <strong>for</strong>warded to users.<br />
UN-SPIDER continuously seeks <strong>and</strong> coordinates<br />
possible external sources <strong>for</strong> funding to provide<br />
space-based in<strong>for</strong>mation to users. Financial<br />
resources are pooled to establish a SpaceAid<br />
Imagery Fund. This will allow making available highresolution<br />
images <strong>and</strong> other in<strong>for</strong>mation in the event<br />
of a disaster, to all interested users with no license<br />
restrictions. End users, the respective space <strong>and</strong><br />
disaster management communities, media <strong>and</strong><br />
Figure 3: Technical Advisiory Mission <strong>and</strong> SpaceAid support<br />
106<br />
interested individuals are being in<strong>for</strong>med on a<br />
regular basis of the opportunities <strong>and</strong> achievements<br />
of SpaceAid.<br />
Technical Advisory Support<br />
Technical Advisory Missions are part of UN-SPIDER's<br />
support at the national level. Governments or<br />
national institutions may officially request a UN-<br />
SPIDER Technical Advisory Mission. The mission<br />
objective is to assess the existing use of space-based<br />
technology <strong>and</strong> in<strong>for</strong>mation <strong>for</strong> disaster<br />
management <strong>and</strong> emergency response, to identify<br />
potential areas where space applications could play a<br />
greater role, <strong>and</strong> to provide recommendations on<br />
how to improve access to <strong>and</strong> use of space-based<br />
technology <strong>and</strong> in<strong>for</strong>mation.<br />
Technical Advisory Missions make use of the<br />
expertise available in the regions or internationally.<br />
To support national activities, external experts are<br />
invited to join a UN-SPIDER mission in the<br />
requesting countries, thus enhancing horizontal<br />
cooperation in the region <strong>and</strong> strengthening the<br />
links between disaster management <strong>and</strong> space<br />
communities.
Alternatively, technical advice to national institutions<br />
may also be provided by other means such as<br />
bilateral meetings, telecommunication, video<br />
conference, or by facilitating direct cooperation<br />
between the national institution <strong>and</strong> providers of<br />
space-based in<strong>for</strong>mation.<br />
Up to March 2010, UN-SPIDER has carried out<br />
<strong>for</strong>mal Technical Advisory Missions to Burkina Faso,<br />
Ecuador, the Dominican Republic, Fiji, Ghana, Haiti,<br />
Jamaica, Namibia, Samoa, <strong>and</strong> Togo.<br />
Capacity-building<br />
Capacity-building ef<strong>for</strong>ts are essential <strong>for</strong> UN-<br />
SPIDER to fulfil its mission in developing countries.<br />
Capacity-building goes beyond training of<br />
individuals, <strong>and</strong> includes the strengthening of<br />
institutional frameworks <strong>and</strong> procedures. Shortterm<br />
training programmes target specific contents,<br />
such as particular tools or processes, with the aim of<br />
strengthening the capacity of individuals. Long-term<br />
activities are tailored to enhance capacities of<br />
agencies or to enhance the synergies among them.<br />
Activities in this component include workshops <strong>and</strong><br />
exercises (2- 5 days), short, intensive training events<br />
(spring or summer schools, block courses, 1- 3<br />
weeks), <strong>and</strong> courses (one to several months).<br />
Workshops will target very specific topics <strong>and</strong> will be<br />
structured in such a way that they concentrate on<br />
specific skills. In a similar fashion, contingency <strong>and</strong><br />
near-real-time exercises will be set up with realistic<br />
scenarios in mind to complement other training<br />
activities.<br />
Short, intensive training events (<strong>for</strong> example spring<br />
<strong>and</strong> summer schools or block courses) will include<br />
lectures as well as h<strong>and</strong>s-on training on basic space<br />
technology utilization, GIS, interpretation <strong>and</strong><br />
visualization of spatial data, <strong>and</strong> applications via<br />
examples <strong>and</strong> case studies.<br />
Courses will provide an overall view to use spacebased<br />
in<strong>for</strong>mation <strong>for</strong> disaster <strong>and</strong> risk management,<br />
targeting the use of this in<strong>for</strong>mation <strong>for</strong> a variety of<br />
hazards <strong>and</strong>, in the case of emergency response,<br />
addressing not only the use of in<strong>for</strong>mation, but also<br />
other spatial applications such as GNSS <strong>and</strong> satellite<br />
communications.<br />
Training activities are carried out through the<br />
network of Regional Centres on Space Science <strong>and</strong><br />
Technology Education affiliated to the United<br />
Nations, as well as other Centres of Excellence such<br />
as the International Institute <strong>for</strong> Geo-In<strong>for</strong>mation<br />
Science <strong>and</strong> Earth Observation (ITC) in the<br />
Netherl<strong>and</strong>s, the Asian Institute of Technology (AIT)<br />
in Thail<strong>and</strong>, the University of Salzburg Centre <strong>for</strong><br />
Geoin<strong>for</strong>matics (Z_GIS) in Austria, <strong>and</strong> with the<br />
support of space centres such as the German<br />
Aerospace Center (DLR).<br />
The capacity-building ef<strong>for</strong>ts are coordinated with<br />
the support of the Regional Support Offices <strong>and</strong><br />
National Focal Points, <strong>and</strong> with other regional <strong>and</strong><br />
international organizations such as the International<br />
Strategy <strong>for</strong> <strong>Disaster</strong> Reduction (ISDR); the Group on<br />
Earth Observations (GEO); United Nations agencies,<br />
such as the UN Office <strong>for</strong> the Coordination of<br />
Humanitarian Affairs (UNOCHA), the World<br />
Meteorological Organization (WMO), the United<br />
Nations Development Programme (UNDP) <strong>and</strong> the<br />
United Nations Educational, Scientific <strong>and</strong> Cultural<br />
Organization (UNESCO); <strong>and</strong> regional organizations<br />
targeting risk reduction <strong>and</strong> emergency response<br />
such as the Coordinating Centre <strong>for</strong> the Prevention of<br />
Natural <strong>Disaster</strong>s in Central America (CEPREDENAC)<br />
<strong>and</strong> Caribbean <strong>Disaster</strong> Emergency Response<br />
Agency (CDERA) in the American hemisphere; the<br />
Asian <strong>Disaster</strong> Preparedness Center (ADPC) <strong>and</strong> the<br />
Asian <strong>Disaster</strong> Reduction Centre (ADRC) in Asia; <strong>and</strong><br />
the International Federation of the Red Cross <strong>and</strong><br />
Red Crescent Societies (IFRC).<br />
The UN-SPIDER Knowledge Portal: A Webbased<br />
Plat<strong>for</strong>m <strong>for</strong> In<strong>for</strong>mation <strong>and</strong><br />
Communication<br />
What is the Knowledge Portal?<br />
The Knowledge Portal is UN-SPIDER's response to<br />
the need <strong>for</strong> a comprehensive in<strong>for</strong>mation gateway<br />
to space-based in<strong>for</strong>mation <strong>for</strong> disaster management<br />
support. It is a web portal <strong>for</strong> in<strong>for</strong>mation,<br />
communication <strong>and</strong> process support <strong>and</strong> offers<br />
orientation <strong>and</strong> guidance, <strong>and</strong> provides updates on<br />
the latest UN-SPIDER activities. In<strong>for</strong>mation on<br />
SpaceAid <strong>and</strong> updates on current disasters is issued,<br />
as are reports about Technical Advisory Missions<br />
<strong>and</strong> UN-SPIDER workshops. Questions about<br />
availability, quality, accessibility <strong>and</strong> costs of spacebased<br />
in<strong>for</strong>mation are answered on the Portal.<br />
The portal is open to the public <strong>and</strong> anyone involved<br />
in the fields of disaster management <strong>and</strong>/or satellite<br />
technology. You are cordially invited to visit<br />
http://www.un-spider.org <strong>and</strong> register as a user.<br />
107
What is the content of the Knowledge Portal?<br />
The Knowledge Portal features the following<br />
sections: SpaceAid, Advisory Support, Knowledge<br />
Base, Network, <strong>and</strong> About Us. They offer a<br />
combination of guides to space technology<br />
application, consultant activities, technical <strong>and</strong><br />
institutional background in<strong>for</strong>mation, <strong>and</strong><br />
communication plat<strong>for</strong>ms <strong>for</strong> users <strong>and</strong><br />
Communities of Practice. Furthermore, there is a<br />
News section where users are in<strong>for</strong>med about recent<br />
UN-SPIDER activities <strong>and</strong> where they can also access<br />
current <strong>and</strong> past issues of the UN-SPIDER Newsletter<br />
<strong>and</strong> monthly Updates. An events calendar in<strong>for</strong>ms<br />
the visitor about upcoming workshops <strong>and</strong><br />
conferences. If UN-SPIDER organizes or co-organizes<br />
these meetings, an online registration <strong>for</strong>m can be<br />
provided on the Portal.<br />
The SpaceAid section supports the activities of<br />
SpaceAid described above. It is the place where fast<br />
<strong>and</strong> efficient access to space-based in<strong>for</strong>mation is<br />
made available. It contains in<strong>for</strong>mation on available<br />
space-based products <strong>and</strong> services, on their<br />
application, sources, access options <strong>and</strong><br />
procurement procedures. It covers the full disaster<br />
management cycle, all earth-directed space<br />
technology, <strong>and</strong> all types of major natural or manmade<br />
disasters. For example, during recent disasters<br />
such as the earthquake in Chile on 27 February<br />
2010, an update page on the respective response <strong>and</strong><br />
recovery ef<strong>for</strong>ts was created <strong>and</strong> constantly<br />
amended with in<strong>for</strong>mation on newly available data.<br />
The SpaceAid section further provides an overview<br />
108<br />
of relevant organizational frameworks such as the<br />
SpaceAid framework <strong>and</strong> the mechanism of the<br />
International Charter Space <strong>and</strong> Major <strong>Disaster</strong>s. The<br />
underst<strong>and</strong>ing of these frameworks, mechanisms,<br />
procedures <strong>and</strong> workflows is a prerequisite to<br />
bringing technological assets to bear on disaster<br />
management with the best possible efficiency.<br />
Furthermore, the user finds guidance on space<br />
applications <strong>and</strong> how disaster management can<br />
benefit from them. Guides <strong>and</strong> case reports outlining<br />
the underlying principles, methodical workflows <strong>and</strong><br />
best practices, advantages <strong>and</strong> restrictions, <strong>and</strong><br />
accessibility of data <strong>and</strong> services are offered in order<br />
to in<strong>for</strong>m the user <strong>and</strong> to support the decision<br />
making process.<br />
The Visual Globe, which is currently still under<br />
development, is a search tool which offers a surface<br />
<strong>for</strong> displaying the content of geocoded items. First<br />
<strong>and</strong> <strong>for</strong>emost it is designed to support the work of<br />
SpaceAid. In<strong>for</strong>mation about ongoing <strong>and</strong> past<br />
disasters will be displayed in the respective<br />
geographic region. Users on site will have the<br />
opportunity to upload ground truth data such as<br />
photographs or coordinates etc. to the disaster<br />
in<strong>for</strong>mation on the Visual Globe.<br />
Furthermore it will enable<br />
users to find the contact data<br />
of experts on certain topics as<br />
well as the representatives of<br />
Regional Support Offices <strong>and</strong><br />
National Focal Points based<br />
on a geographical search.<br />
Figure 5: The Visual Globe<br />
Figur e 4: Structure<br />
of the Knowledge Portal In the Advisory Support section, the visitor is given<br />
an overview on the UN-SPIDER Technical Advisory<br />
Support framework <strong>and</strong> respective Missions that are<br />
being conducted by expert teams upon specific<br />
request. The available reports can give other<br />
interested users an idea of how such missions are<br />
conducted <strong>and</strong> how the participants can benefit from<br />
them. They also give an idea of which stakeholders<br />
can be involved in these missions <strong>and</strong> how the<br />
regional networking can be strengthened through<br />
them.<br />
Furthermore, the visitor will find in<strong>for</strong>mation on the<br />
UN-SPIDER capacity building strategy. Once they are<br />
fully developed <strong>and</strong> available, e-learning modules<br />
will be announced on this site as well as h<strong>and</strong>s-on<br />
courses <strong>and</strong> other training opportunities.<br />
Figure 6: SpaceAid page on the<br />
Knowledge Portal
The Knowledge Base provides guides on<br />
technologies, on disaster management <strong>and</strong> on health<br />
support. The technology guides offer background<br />
in<strong>for</strong>mation on satellite technology <strong>and</strong> specific<br />
satellite missions, while the disaster management<br />
guides provide in<strong>for</strong>mation about policies <strong>and</strong><br />
procedures concerning the management of different<br />
disaster types. Health support guides focus on the<br />
application of space technology in disaster medicine.<br />
The Knowledge Base is meant to supply people<br />
involved in disaster management with basic<br />
knowledge <strong>and</strong> background in<strong>for</strong>mation outside<br />
operational situations. The knowledge gained about<br />
the application of satellite technology will then<br />
benefit the decision making process in the event of a<br />
disaster <strong>and</strong> especially <strong>for</strong> disaster management<br />
policy <strong>and</strong> emergency planning. Knowledge about<br />
technological background <strong>and</strong> about best practices is<br />
crucial <strong>for</strong> developing mitigation <strong>and</strong> preparedness<br />
strategies.<br />
Given the complexity of disasters on the ground <strong>and</strong><br />
the organizational tasks of disaster management,<br />
guiding in<strong>for</strong>mation on how to apply a particular<br />
technique has to be specific to the type of disaster<br />
<strong>and</strong> the disaster management cycle phase (mitigation,<br />
preparedness, relief <strong>and</strong> response, recovery <strong>and</strong><br />
reconstruction). Guiding in<strong>for</strong>mation on the<br />
application of a given space technique may also refer<br />
to more general humanitarian aspects such as health,<br />
critical infrastructure, humanitarian aid <strong>and</strong> security,<br />
e.g. in case of complex emergency situations not<br />
attributable to a specific disaster type. In order to<br />
facilitate the search <strong>for</strong> the right in<strong>for</strong>mation, the<br />
Space Application Matrix is being developed. This is<br />
an intuitive in<strong>for</strong>mation retrieval tool which allows<br />
combining disaster type, DM cycle phase, <strong>and</strong><br />
satellite technology to render relevant search results.<br />
The Knowledge Base is complemented by a glossary<br />
<strong>and</strong> directory of institutions whose activities are<br />
related to disaster management <strong>and</strong> the use of space<br />
technology.<br />
Network provides links to the UN-SPIDER Regional<br />
Support Offices <strong>and</strong> National Focal Points, as well as<br />
access to an extensive contact data base.<br />
Furthermore, a communication plat<strong>for</strong>m is offered to<br />
Communities of Practice that need a joint working<br />
space to communicate <strong>and</strong> share content among<br />
themselves or with an open community. If <strong>for</strong><br />
example, a member of the disaster management<br />
community wants to contact a UN-SPIDER National<br />
Focal Point or Regional Support Office, they can find<br />
contact data <strong>and</strong> in<strong>for</strong>mation about the respective<br />
institutions on the Knowledge Portal.<br />
Figure 7: The Space Application Matrix<br />
Further, UN-SPIDER provides space on the Portal to<br />
Communities of Practice that wish to cooperate on a<br />
certain topic related to the m<strong>and</strong>ate of the<br />
Programme. For example, the Expert Group on<br />
Capacity Building <strong>and</strong> the UN-SPIDER Global<br />
Thematic Partnership have set up workspaces on the<br />
Portal where they can share documents <strong>and</strong> discuss<br />
amongst each other the content <strong>and</strong> development of<br />
their respective projects. The African Sub-Sahara<br />
Flood/Disease SensorWeb Pilot Project is also<br />
making use of this communication plat<strong>for</strong>m <strong>and</strong><br />
further communities will be supported.<br />
Finally, About Us in<strong>for</strong>ms about the m<strong>and</strong>ate of UN-<br />
SPIDER, its organization <strong>and</strong> the staff. Current <strong>and</strong><br />
previous Newsletters <strong>and</strong> Updates can also be<br />
downloaded from here.<br />
It remains to be<br />
emphasized that the<br />
continued successful<br />
operations of the UN-<br />
SPIDER Knowledge<br />
Portal is dependent<br />
on a dynamic user<br />
community which<br />
provides regular<br />
input <strong>and</strong> feedback.<br />
After all, it is a<br />
communication tool<br />
<strong>and</strong> not a one-way<br />
in<strong>for</strong>mation plat<strong>for</strong>m.<br />
Figure 8: Community of the Practice on the Knowledge Portal<br />
109
How is UN-SPIDER organized? Structure <strong>and</strong><br />
Funding<br />
The organizational framework of UN-SPIDER has<br />
three cornerstones: the UN-SPIDER staff, the<br />
network of Regional Support Offices <strong>and</strong> the<br />
National Focal Points.<br />
The Director of the Office <strong>for</strong> Outer Space Affairs is<br />
the supervisor of the UN-SPIDER Programme <strong>and</strong> is<br />
responsible <strong>for</strong> its overall implementation. The<br />
Director is assisted by a Programme Coordinator to<br />
help plan <strong>and</strong> coordinate all activities, including<br />
coordination with the Regional Support Offices. The<br />
Programme Coordinator works closely with the<br />
Heads of the Bonn Office <strong>and</strong> the future Beijing<br />
Office as well as with the Programme Officer who<br />
leads the Outreach Activities <strong>and</strong> Capacity Building,<br />
in the implementation of all programme activities.<br />
110<br />
Regional Support Offices are regional <strong>and</strong> national<br />
Centres of Expertise in the use of space technology in<br />
disaster management which agree to <strong>for</strong>m a network<br />
<strong>for</strong> implementing the activities of the programme in<br />
their respective regions in a coordinated manner. A<br />
Regional Support Office should be a leading national<br />
or regional institution with notable expertise in the<br />
use of space technology <strong>for</strong> disaster management. It<br />
has to be nominated by its government or governing<br />
body.<br />
Cooperation Agreements have been signed with<br />
Regional Support Offices in Algeria, the I. R. Iran,<br />
Nigeria, Pakistan, Romania, Ukraine, <strong>and</strong> the Asian<br />
<strong>Disaster</strong> Reduction Center in Japan. UN-SPIDER has<br />
also received <strong>for</strong>mal offers from the Philippines,<br />
South Africa, the University of the West Indies, <strong>and</strong><br />
the Water Center <strong>for</strong> the Humid Tropics of Latin<br />
America <strong>and</strong> The Caribbean (CATHALAC), <strong>and</strong> has<br />
in<strong>for</strong>med the respective regional groups of these<br />
offers (as of 8 March 2010).<br />
National Focal Points are the national institutions<br />
representing the disaster management <strong>and</strong>/or space<br />
application communities. They are nominated by<br />
their respective government to work with UN-<br />
SPIDER to strengthen national disaster management<br />
planning <strong>and</strong> policies <strong>and</strong> in the implementation of<br />
specific national activities that incorporate spacebased<br />
technology solutions to support disaster<br />
management.<br />
As of March 2010, the following 40 United Nations<br />
Member States had nominated a UN-SPIDER<br />
National Focal Point: Austria, Belarus, Belize, Bolivia,<br />
Bosnia & Herzegovina, Burkina Faso, Burundi, China,<br />
Cote d'Ivoire, Croatia, Egypt, El Salvador, Ethiopia,<br />
India, Iraq, Jordan, Kenya, Malawi, Malta, Mauritania,<br />
Mauritius, Morocco, Myanmar, New Zeal<strong>and</strong>, Nigeria,<br />
Philippines, Qatar, Republic of Korea, Senegal,<br />
Singapore, Spain, Syria, Tajikistan, Tanzania,<br />
Thail<strong>and</strong>, Trinidad <strong>and</strong> Tobago, Tunisia, Turkey,<br />
Ukraine, <strong>and</strong> the United Arab Emirates. The National<br />
Focal Points in these countries represent a wide<br />
range of organizations such as disaster management<br />
authorities, civil protection units, disaster risk<br />
reduction plat<strong>for</strong>ms, space agencies <strong>and</strong> mapping<br />
organizations.<br />
The activities of UN-SPIDER are being implemented<br />
successfully with the support <strong>and</strong> the voluntary<br />
contributions (cash <strong>and</strong> in-kind) received from a<br />
number of Member States as well as from private<br />
companies, which is gratefully acknowledged.<br />
Figure 9: UN-Spider Team
An exemplary case: The African Sub-Sahara<br />
Flood/Disease SensorWeb Pilot Project<br />
The following outline demonstrates how various UN-<br />
SPIDER activities may translate into concrete<br />
projects.<br />
<strong>Disaster</strong> management agencies in the Southern<br />
African Region have to adapt to an increasing<br />
number of natural disasters mainly caused by floods<br />
<strong>and</strong> drought. The effects of global climate change will<br />
most probably aggravate this situation <strong>and</strong><br />
substantially increase the economic impact,<br />
threatening the livelihoods of an increasing number<br />
of people. In addition, vector borne diseases <strong>and</strong><br />
Figure 10: Network of Regional Support Offices, National Focal Points<br />
epidemics of weather- <strong>and</strong> climate-sensitive<br />
infectious diseases, including malaria, meningitis,<br />
<strong>and</strong> cholera, cause massive disruption to societies<br />
<strong>and</strong> put a heavy burden on national <strong>and</strong> local health<br />
systems.<br />
During the floods in Namibia in March 2008, the UN-<br />
SPIDER team was instrumental in ensuring access to<br />
the International Charter Space <strong>and</strong> Major <strong>Disaster</strong>s<br />
<strong>and</strong> other opportunities to support the Namibian<br />
government with satellite data. A severe flood had<br />
started at the end of January <strong>and</strong> reached its peak<br />
around mid-March. The Namibian government<br />
declared the state of emergency on 5 March. A<br />
request to provide satellite imagery <strong>for</strong> the northern<br />
<strong>and</strong> north-eastern regions of Namibia reached<br />
UNOOSA from the Department of Water Affairs,<br />
Ministry of Agriculture Water <strong>and</strong> Forestry (MAWF),<br />
<strong>and</strong> the country office of the United Nations<br />
Development Program (UNDP) in Namibia, asking<br />
<strong>for</strong> international support to obtain high resolution,<br />
cloud free satellite imagery on a priority basis.<br />
Subsequently, on March 14, UNOOSA activated the<br />
International Charter to help Namibia to manage the<br />
impacts of the floods including the outbreak of<br />
cholera. UN-SPIDER provided support <strong>and</strong> followedup<br />
closely with both UNDP <strong>and</strong> the Department of<br />
Water Affairs of Namibia, helping the country to take<br />
full advantage of international support.<br />
In January 2009 the Government of Namibia<br />
requested a Technical Advisory Mission of UN-<br />
SPIDER to assess the existing use of space-based<br />
technology <strong>and</strong> in<strong>for</strong>mation <strong>for</strong> disaster<br />
management <strong>and</strong> emergency response in Namibia.<br />
Specifically, the mission was requested to identify<br />
potential areas where space-based technology <strong>and</strong><br />
in<strong>for</strong>mation could play a greater role, <strong>and</strong> to propose<br />
recommendations on how to improve Namibia's<br />
access to <strong>and</strong> use of space-based technology <strong>and</strong><br />
in<strong>for</strong>mation. Following a meeting during the<br />
International UN-SPIDER Workshop in October 2008<br />
in Bonn, with the governmental focal point <strong>for</strong> the<br />
mission, the Department of Water Affairs, Ministry of<br />
Agriculture Water <strong>and</strong> Forestry, three experts from<br />
UN-SPIDER <strong>and</strong> the German Aerospace Center's<br />
crisis in<strong>for</strong>mation team (DLR/ZKI) were fielded to<br />
Windhoek, Namibia from 27 January to 2 February<br />
2009 to provide technical advice <strong>and</strong> train local<br />
experts in remote sensing techniques <strong>for</strong> flood<br />
mapping. A two day kick-off workshop on 29 <strong>and</strong> 30<br />
January 2009 brought together relevant disaster<br />
management stakeholders to evaluate past<br />
experiences <strong>and</strong> <strong>for</strong>mulate lessons learnt.<br />
111
A field visit to the flood-prone region with h<strong>and</strong>s-on<br />
training on GPS applications <strong>for</strong> disaster managers<br />
followed by training <strong>for</strong> technical experts to improve<br />
end-user adapted geospatial emergency response<br />
products <strong>and</strong> services completed the mission. The<br />
workshop <strong>and</strong> training were funded by the German<br />
Technical Cooperation (GTZ).<br />
Again in late February <strong>and</strong> March 2009, severe<br />
flooding affected Northern Namibia due to heavy<br />
local rains <strong>and</strong> an inflow of water from northern<br />
regions. On 27 February 2009, UNOOSA again<br />
activated the International Charter.<br />
112<br />
Whereas the first call was extended in time to<br />
specific regions in Northern Namibia, a second call<br />
followed <strong>for</strong> the affected areas bordering the<br />
Okavango <strong>and</strong> the Zambesi Rivers in North/North<br />
Eastern Namibia. In addition to the Charter<br />
activation, UN-SPIDER was involved in a range of<br />
activities to provide supplemental in<strong>for</strong>mation, data<br />
<strong>and</strong> imagery.<br />
Finally, the community that was brought together by<br />
this approach decided not only to support Namibia<br />
during the relief situation but to implement a pilot<br />
project with more far reaching goals.<br />
The idea was to collect weekly high resolution<br />
imagery from satellites such as EO-1, Formosat <strong>and</strong><br />
Radarsat <strong>and</strong> to validate the satellite data against<br />
ground measurements so that the satellite data can<br />
be used <strong>for</strong> better <strong>for</strong>ecasting of floods <strong>and</strong> <strong>for</strong><br />
improved situational awareness <strong>for</strong> in-country<br />
emergency workers. A technical workshop was held<br />
at the UN-SPIDER Bonn Office in August 2009 with<br />
representatives from UN-SPIDER, NASA, NOAA, DLR,<br />
the Namibia Department of Hydrology <strong>and</strong> Ukraine<br />
Space Research Institute to begin planning ahead.<br />
Figure 11:<br />
UN-SPIDER activities in<br />
Namibia 2008-2010
The pilot project is envisaged to combine high<br />
resolution satellite imagery with in-situ data <strong>and</strong><br />
modelling approaches in order to derive a<br />
scientifically sound, operational trans-boundary<br />
flood management system <strong>for</strong> the Southern African<br />
region, <strong>and</strong> to provide useful flood <strong>and</strong> water-borne<br />
disease <strong>for</strong>ecasting tools <strong>for</strong> local decision makers.<br />
Some personnel at NASA Goddard Space Flight<br />
Center are already engaged in studying Malaria Early<br />
Warning Systems <strong>and</strong> other vector-borne diseases<br />
related to floods. Additionally, UN-SPIDER<br />
addressed this issue to the community attending the<br />
Second United Nations International UN-SPIDER<br />
Bonn Workshop in October 2008. Recommendations<br />
from the respective institutions in Namibia such as<br />
the Ministry of Health <strong>and</strong> Social Services are<br />
prerequisite to successfully integrating any<br />
outcomes from this project into the National Health<br />
Emergency Preparedness <strong>and</strong> Response Plan.<br />
Finally, in January 2010 the Department of Water<br />
Affairs, Ministry of Agriculture, Water <strong>and</strong> Forestry<br />
in Namibia together with UN-SPIDER organized a<br />
regional follow-up activity <strong>for</strong> a Flood <strong>Management</strong><br />
Pilot Project in Namibia in order to promote the<br />
access <strong>and</strong> use of space-based technologies <strong>and</strong><br />
solutions <strong>for</strong> disaster management <strong>and</strong> emergency<br />
response within relevant communities. The activities<br />
in Windhoek were preceded by a visit to the<br />
northern regions Caprivi <strong>and</strong> Oshana that were<br />
affected by the flood in 2009. Additionally, meetings<br />
with representatives of the Northern Regional<br />
Councils were arranged.<br />
Subsequently, a technical meeting with stakeholders<br />
in Windhoek was arranged with the mayor to<br />
provide in<strong>for</strong>mation, feedback <strong>and</strong> lessons learnt<br />
from the Namibian disaster management<br />
institutions, as well as national <strong>and</strong> regional relief<br />
practitioners, <strong>and</strong> to provide technical expert<br />
knowledge on the use of space technology to better<br />
facilitate international collaboration in the future.<br />
Following the field mission communications were<br />
finalised to include the technical solutions provided<br />
by the international expert team <strong>and</strong> the user needs<br />
in the different regions. Substantial output regarding<br />
user requirements, data <strong>and</strong> in<strong>for</strong>mation structure,<br />
capacity development, <strong>and</strong> necessary steps <strong>for</strong><br />
developing support <strong>for</strong> national policy planning were<br />
generated by six working groups. Finally, the mission<br />
team reported at a high-level debriefing committee,<br />
including the Minister <strong>for</strong> Agriculture, Water <strong>and</strong><br />
Forestry, who explicitly appreciated the international<br />
support to Namibia <strong>and</strong> the set of technical<br />
solutions, <strong>and</strong> announced the political commitment<br />
of the Government of Namibia to support further<br />
activities of the pilot project.<br />
113
114
Global Spatial Data Infrastructure Association (GSDI)<br />
What are Spatial Data Infrastructures?<br />
Spatial data infrastructures (SDIs) are the fundamental spatial datasets, the st<strong>and</strong>ards that enable integration, the<br />
distribution networks that provide access, the policies <strong>and</strong> administrative principles that ensure compatibility, the<br />
people including users, providers, <strong>and</strong> value adders, at each level; local through to state, national, regional <strong>and</strong> global.<br />
Spatial data is vital to making sound decisions at all levels. <strong>Disaster</strong> management, response <strong>and</strong> recovery is one<br />
example of an area in which decision-makers are benefiting from spatial in<strong>for</strong>mation, together with the associated<br />
spatial data infrastructures that support in<strong>for</strong>mation discovery, access, <strong>and</strong> use of this in<strong>for</strong>mation in the decisionmaking<br />
process.<br />
115
GSDI Association<br />
The Global Spatial Data Infrastructure Association (GSDI) is an inclusive<br />
organization of organizations, agencies, firms, <strong>and</strong> individuals from around the<br />
world promoting international cooperation <strong>and</strong> collaboration in support of local,<br />
national <strong>and</strong> international spatial data infrastructure developments that will<br />
allow nations <strong>and</strong> their citizens to better address social, economic, <strong>and</strong><br />
environmental issues of pressing importance.<br />
Mission of the GSDI Association<br />
The mission of the GSDI Association is to<br />
�Serve as a point of contact <strong>and</strong> effective voice <strong>for</strong> those in the global<br />
community involved in developing, implementing <strong>and</strong> advancing spatial<br />
data infrastructure concepts.<br />
�Foster spatial data infrastructures that support sustainable social,<br />
economic, <strong>and</strong> environmental systems integrated from local to global<br />
scales.<br />
�Promote the in<strong>for</strong>med <strong>and</strong> responsible use of geographic in<strong>for</strong>mation<br />
<strong>and</strong> spatial technologies <strong>for</strong> the benefit of society.<br />
Goals of the GSDI Association<br />
The primary activities of the GSDI Association<br />
�support the establishment <strong>and</strong> expansion of local, national, <strong>and</strong> regional<br />
(multi-nation) spatial data infrastructures that are globally compatible.<br />
�provide an organization to foster international communication <strong>and</strong><br />
collaborative ef<strong>for</strong>ts <strong>for</strong> advancing spatial data infrastructure<br />
innovations.<br />
116<br />
�support interdisciplinary research <strong>and</strong> education activities that advance<br />
spatial data infrastructure concepts, theories <strong>and</strong> methods.<br />
�enable better public policy <strong>and</strong> scientific decision-making through<br />
spatial data infrastructure advancements.<br />
�promote the ethical use of <strong>and</strong> access to geographic in<strong>for</strong>mation.<br />
�foster spatial data infrastructure developments in support of important<br />
worldwide needs such as improving local to national economic<br />
competitiveness, addressing local to global environmental quality <strong>and</strong><br />
change, increasing efficiency, effectiveness, <strong>and</strong> equity in all levels of<br />
government, <strong>and</strong> advancing the health, safety <strong>and</strong> social wellbeing of<br />
humankind in all nations.<br />
The Scientific <strong>and</strong> Technical Program of the GSDI Association<br />
Much of the work of the GSDI Association is planned <strong>and</strong> accomplished through<br />
st<strong>and</strong>ing committees whose memberships are made up from individuals from<br />
full member organizations <strong>and</strong> members of the International Geospatial Society.<br />
The st<strong>and</strong>ing committees include:<br />
�Technical Committee<br />
�Legal <strong>and</strong> Socioeconomic Committee<br />
�Outreach <strong>and</strong> Membership Committee<br />
�Societal Impacts Committee.
GSDI Aspirations<br />
The GSDI Association by concentrating on specific<br />
strategic tasks aspires to:<br />
�more closely align its organizational activities by<br />
addressing member needs <strong>and</strong> societal needs<br />
identified <strong>and</strong> prioritized by its organizational <strong>and</strong><br />
individual members<br />
�provide more effective communication<br />
mechanisms to better enable its members to work<br />
collaboratively<br />
�achieve visible <strong>and</strong> measurable outcomes in<br />
furtherance of the core missions <strong>and</strong> goals of the<br />
organization.<br />
Additionally, the GSDI Association through the<br />
provisioning of significantly exp<strong>and</strong>ed services <strong>and</strong><br />
products aspires to be the global organization of<br />
choice <strong>for</strong>:<br />
�local to global agencies, private companies,<br />
academic institutions <strong>and</strong> non-profit<br />
organizations engaged in advancing the uses<br />
of SDIs <strong>and</strong> improving decision-making<br />
through the use of SDIs<br />
�individual geospatial specialists interested<br />
in solving local to global societal problems.<br />
Organizational Structure<br />
The GSDI Association consists of a Council comprised of the delegates from the Full Member organizations<br />
<strong>and</strong> two representatives from the International Geospatial Society , the Board of Directors which is the main<br />
administrative body of the Council <strong>and</strong> the St<strong>and</strong>ing Committees.<br />
The GSDI Association has two classes of membership: full members <strong>and</strong> individual members. Full members<br />
include organizations such as government agencies <strong>and</strong> organizations, private companies, industry<br />
organizations, academic institutions, not-<strong>for</strong>-profit organizations, <strong>and</strong> similar organizations that influence<br />
the development of spatial data infrastructures at national, regional, <strong>and</strong> international levels. Individual<br />
members are those individuals that are members of the International Geospatial Society (IGS).<br />
St<strong>and</strong>ing Committees<br />
(Art IX)<br />
•Technical Committee<br />
•Legal <strong>and</strong> Socio Economic Committee<br />
•Outreach <strong>and</strong> Membership Committee<br />
•Societal Impacts Committee<br />
International<br />
Geospatial Society<br />
(IGS)<br />
Individuals qualifying under Art IV(4)<br />
GSDI Board of Directors<br />
(Art VI)<br />
Eleven Elected members<br />
Plus President, President-Elect <strong>and</strong> Past Pres<br />
plus appointments from regional bodies, industry<br />
advisory council <strong>and</strong> President of IGS<br />
appoints<br />
elects<br />
GSDI Association Council<br />
Officers<br />
(Art. VI)<br />
•President<br />
•President-Elect<br />
•Executive Director<br />
•Secretary (appointed)<br />
•Treasurer (appointed)<br />
Delegates from Member Organizations [Art IV(2)&(3)]<br />
Pres <strong>and</strong> V. Pres Delegates<br />
Full Members<br />
Government, industry, academic, <strong>and</strong> not<strong>for</strong>-profit<br />
agencies, organizations <strong>and</strong><br />
institutions qualifying as members under<br />
Art IV(1)<br />
GSDI Association<br />
Business Office<br />
117
Activities of GSDI Association in support of global disaster management initiatives<br />
118<br />
Emergency Response <strong>and</strong> Recovery Readiness<br />
Even in large wealthy nations, local communities are<br />
told that they should not expect substantial direct<br />
delivery of goods <strong>and</strong> services from national or<br />
international relief agencies <strong>for</strong> at least 72 hours<br />
after a major widespread disaster. Thus local<br />
communities must be prepared to rely on their own<br />
public <strong>and</strong> private emergency response <strong>and</strong><br />
management systems in that most critical of time<br />
periods immediately after a disaster occurs.<br />
If the components of a spatial data infrastructure are<br />
in place <strong>and</strong> are in use on a daily basis by local users<br />
<strong>for</strong> accomplishing mapping, vehicle routing, asset<br />
management, service delivery <strong>and</strong> similar tasks, then<br />
the in<strong>for</strong>mation infrastructure is much more likely to<br />
be available <strong>and</strong> useful <strong>for</strong> accomplishing similar<br />
tasks during a calamity. Learning how to use<br />
geospatial <strong>and</strong> affiliated communication<br />
technologies doesn’t occur overnight. Nor will data<br />
needed to respond to emergencies appear out of thin<br />
air. For these reasons, the GSDI Association<br />
encourages the building of long-term SDI from local<br />
to global scales within <strong>and</strong> among all nations of the<br />
world.<br />
GSDI Conferences<br />
One of the principal activities of the association is to<br />
provide a GSDI Conference <strong>for</strong> SDI-related<br />
professionals, scientists, <strong>and</strong> applications, on a<br />
regular basis to share <strong>and</strong> exchange ideas. Since<br />
1996, experts in SDI <strong>and</strong> spatial data management<br />
matters have come together to share their<br />
experiences in advancing SDI plat<strong>for</strong>ms from local to<br />
international levels. A continuing theme of GSDI is<br />
realizing spatially enabled societies. The pressing<br />
needs of societies are a particular emphasis of GSDI<br />
conferences <strong>and</strong> include a focus on disaster<br />
prevention, warning, management, response, <strong>and</strong><br />
recovery.<br />
Small Grants Program<br />
Nations with the few economic resources are the<br />
hardest hit in the event of a natural or human made<br />
disaster. Many more lives may be lost <strong>and</strong> recovery<br />
will typically take much longer. The GSDI Association<br />
supports an annual small grants program to support<br />
national or sub-national activities that foster<br />
partnerships, develop in-country technical capacity,<br />
improve data compatibility <strong>and</strong> access, <strong>and</strong> increase<br />
political support <strong>for</strong> spatial data infrastructure <strong>and</strong><br />
earth observations application development. Priority<br />
is given to projects in developing nations <strong>and</strong><br />
countries with economies in transition.<br />
Developing Partnerships<br />
<strong>and</strong> Spreading Knowledge<br />
GSDI provides a global venue <strong>for</strong> networking,<br />
communicating <strong>and</strong> learning among its members.<br />
Through the Geographic In<strong>for</strong>mation Knowledge<br />
Networks (GIK Network) GSDI enhances<br />
communications <strong>and</strong> sharing among geospatial<br />
specialists <strong>and</strong> organizations from all nations <strong>and</strong> <strong>for</strong><br />
the global geographic in<strong>for</strong>mation community at<br />
large ( http://giknetwork.org).<br />
Open Access to Data, Tools <strong>and</strong> Learning<br />
Materials<br />
The GSDI Association <strong>and</strong> its members promote<br />
open access to the greatest extent possible to spatial<br />
data as well as to educational materials in how to use<br />
geospatial technologies <strong>and</strong> establish SDI. If those<br />
affected by a disaster can’t gain access to the detailed<br />
geospatial data <strong>and</strong> technologies they need when<br />
they need it, the data <strong>and</strong> technologies have no value<br />
<strong>and</strong> might as well not exist. In order to support<br />
learning, all past books developed by the GSDI<br />
Association have been published using open access<br />
licenses, the articles in all the proceedings from the<br />
past world conferences are openly published on the<br />
web <strong>and</strong> its web pages are all posted using creative<br />
commons licenses. Thus, legal <strong>and</strong> economic barriers<br />
to sharing among those interested in pursuing<br />
knowledge on topics such as emergency response<br />
<strong>and</strong> recovery are reduced greatly.
TWhat is Geodesy?<br />
The<br />
International Association<br />
of Geodesy<br />
The classical definition of Geodesy is the science<br />
concerned with the Shape, Size, <strong>and</strong> the Gravity Field<br />
of the Earth. Geodesy today is much more than that.<br />
It is a geo-science that treats the Earth as a complex<br />
dynamic system, a body consisting of many layers,<br />
surrounded by the atmosphere <strong>and</strong> the oceans.<br />
Geodesy deals with:<br />
�the monitoring of the solid Earth (e.g.<br />
tectonic <strong>and</strong>non-tectonic displacements);<br />
�the monitoring of variations in the liquid<br />
Earth (sea level rise, ice sheets);<br />
�monitoring variations in the Earth’s rotation<br />
(polar motion, the length of the day);<br />
�determining orbits <strong>for</strong> scientific satellites<br />
(including Earth Observation Satellites);<br />
�monitoring the atmosphere with satellite<br />
geodetic techniques (ionosphere,<br />
troposphere);<br />
�monitoring the temporal variations in the<br />
gravity field of the Earth;<br />
�determining positions, <strong>and</strong> their changes<br />
with time, of points on or above the surface<br />
of the Earth with the utmost precision.<br />
Geodesy continues to provide the scientific basis of<br />
Navigation by the exploitation of the existing <strong>and</strong><br />
planned Global Navigation Satellite Systems (GNSS),<br />
such as GPS, GLONASS, GALILEO, COMPASS. Its<br />
activities have a link to fundamental Astronomy via<br />
the global terrestrial reference system.<br />
Geodesy is experiencing spectacular growth <strong>and</strong><br />
each year new frontiers of Earth science knowledge<br />
are being explored, such as temporal variations of<br />
positions <strong>and</strong> gravity (l<strong>and</strong> de<strong>for</strong>mations, post<br />
glacial rebound, sea level rise, etc.). It is contributing<br />
to both everyday mapping <strong>and</strong> navigation purposes,<br />
<strong>and</strong> to the deeper underst<strong>and</strong>ing of our living planet,<br />
the Earth.<br />
119
The Association<br />
The International Association of Geodesy (IAG) is the<br />
scientific organization responsible <strong>for</strong> the field of<br />
Geodesy. The origin of IAG goes back to 1862, the<br />
year, in which the “Mitteleuropäische Gradmessung”,<br />
predecessor of IAG, was established. It promotes<br />
scientific cooperation <strong>and</strong> geodetic research on a<br />
global scale, <strong>and</strong> contributes to it through its various<br />
research bodies. It is an active member Association<br />
of the International Union of Geodesy <strong>and</strong><br />
Geophysics (IUGG), which itself is a member of the<br />
International Council <strong>for</strong> Science (ICSU).The<br />
scientific work of the Association is per<strong>for</strong>med<br />
within a component structure consisting of:<br />
�Commissions,<br />
�Inter-commission Committees,<br />
�Services,<br />
�the Communication <strong>and</strong> Outreach Branch<br />
(COB), <strong>and</strong><br />
�the Global Geodetic Observing System.<br />
IAG’s Mission<br />
The mission of the Association is the advancement of<br />
Geodesy. IAG implements its mission by:<br />
�advancing geodetic theory through research<br />
<strong>and</strong> teaching,<br />
�collecting, analysing <strong>and</strong> modelling<br />
observational data,<br />
�stimulating technological development, <strong>and</strong><br />
�providing a consistent representation of the<br />
figure,<br />
�rotation <strong>and</strong> gravity field of the Earth <strong>and</strong><br />
planets, <strong>and</strong> their temporal variations.<br />
The official IAG Website:<br />
http://www.iag-aig.org<br />
The website of the IAG Office:<br />
http://iag.dgfi.badw.de<br />
120<br />
AG objectives<br />
�To foster geodetic research <strong>and</strong> development,<br />
�to support <strong>and</strong> maintain geodetic reference<br />
systems,<br />
�to provide observational <strong>and</strong> processed data,<br />
st<strong>and</strong>ards,<br />
�methodologies <strong>and</strong> models,<br />
�to stimulate development of space techniques to<br />
increase the resolution of geodetic data,<br />
�to initiate, coordinate <strong>and</strong> promote international<br />
cooperations, <strong>and</strong><br />
�to promote the development of geodetic<br />
activities accross the globe, especially in<br />
developing countries.<br />
IAG Meetings<br />
The IAG holds its own<br />
“General Assembly” every<br />
four years in conjuction with<br />
the General Assembly of the<br />
IUGG, at the same time <strong>and</strong><br />
the same place. In addition,<br />
the Association organizes<br />
“Scientific Assemblies”,<br />
independently from the<br />
IUGG, generally in the midterm<br />
between General<br />
Assemblies. Other meetings<br />
that the IAG sponsors or<br />
supports include numerous<br />
international symposia <strong>and</strong><br />
workshops covering broad<br />
fields of Geodesy <strong>and</strong> closely<br />
associated sciences <strong>and</strong><br />
engineering.<br />
IAG Publications<br />
The IAG publications include:<br />
�the<br />
Journal of Geodesy,<br />
�the<br />
IAG Symposia series,<br />
�the<br />
Geodesist’s H<strong>and</strong>book,<br />
�the<br />
“Travaux de l’Association Internationale de<br />
Géodésie”,<br />
�the<br />
IAG special publications,<br />
�the<br />
IAG Newsletter.<br />
The structure of IAG
Global Navigation<br />
Satellite Systems<br />
assisting “precision<br />
farming”. Precision<br />
farming helps to<br />
reduce the amount of<br />
fertilizers <strong>and</strong><br />
chemicals used in<br />
agriculture.<br />
IAG is one of the member<br />
Associations of the IUGG<br />
Why is Geodesy fundamental to Society?<br />
Traditionally, Geodesy has been viewed as a service<br />
science, providing important utility to other<br />
geosciences, <strong>and</strong> supporting many applications. In<br />
the past, the main “customers” of Geodesy came<br />
from the surveying <strong>and</strong> mapping profession, while<br />
today Geodesy serves all Earth sciences, including<br />
the geophysical, oceanographic, atmospheric,<br />
hydrological <strong>and</strong> environmental science<br />
communities.<br />
Moreover Geodesy has served<br />
society by providing<br />
reference frames <strong>for</strong> a wide<br />
range of practical<br />
applications, such as<br />
navigation on l<strong>and</strong>, sea <strong>and</strong> in<br />
the air, <strong>and</strong> from construction<br />
of infrastructure to the<br />
determination of reliable<br />
boundaries of real estate<br />
properties. In the past these<br />
reference frames were<br />
created on a national or<br />
regional level.<br />
Today, GNSS provides access to precise point<br />
coordinates in a global reference frame anytime <strong>and</strong><br />
anywhere on the Earth’s surface with centimetrelevel<br />
accuracy.<br />
A deeper underst<strong>and</strong>ing of the Earth is not possible<br />
without sufficient observations of a large set of<br />
parameters characteristic <strong>for</strong> various Earth system<br />
processes. Earth observations are not only necessary<br />
<strong>for</strong> a scientific underst<strong>and</strong>ing of the Earth, but they<br />
are also fundamental <strong>for</strong> many societal benefit areas,<br />
ranging from disaster prevention <strong>and</strong> mitigation to<br />
the protection of the biosphere, the environment <strong>and</strong><br />
human health. Thus this science contributes to a<br />
prosperous global society.<br />
Geodesy is fundamental in meeting these global<br />
challenges. It provides the foundation in which all<br />
Earth observation systems are ultimately built. But<br />
Modern Geodesy does more: with its “three pillars”<br />
of geokinematics, Earth gravity field, <strong>and</strong> Earth<br />
rotation, it also provides comprehensive<br />
observations of changes in the Earth’s shape, gravity<br />
field <strong>and</strong> rotation. These fundamental geodetic<br />
quantities are intimately related to mass transport<br />
in the fluid envelope of the solid Earth <strong>and</strong> its<br />
interior, as well asto the dynamics of<br />
the Earth System.<br />
New geodetic techniques are leading to fundamental<br />
changes not only in all areas of navigation <strong>and</strong><br />
transport, but also <strong>for</strong> applications in process control<br />
(e.g. farming, construction, mining, resource<br />
management), construction <strong>and</strong> monitoring of<br />
infrastructure (e.g., offshore plat<strong>for</strong>ms, reservoirs,<br />
dams, bridges <strong>and</strong> other large engineering<br />
structures), surveying <strong>and</strong> mapping, <strong>and</strong> Earth<br />
observation.<br />
Geodetic techniques are<br />
crucial in the assessment of<br />
geohazards <strong>and</strong> anthropogenic<br />
hazards, <strong>and</strong> they play<br />
a pivotal role in early<br />
warning systems helping to<br />
mitigate the consequences of<br />
such disasters. Geodesy<br />
there<strong>for</strong>e contributes to<br />
increased security, to a<br />
better use of resources, <strong>and</strong><br />
in general to the progress<br />
towards the sustainable<br />
development.<br />
Geodesy helps to underst<strong>and</strong> ocean currents by mapping<br />
the sea surface topography using Altimetry <strong>and</strong> modelling<br />
the gravity field using Gradiometry (Photo:ESA))<br />
The Kvarken<br />
Archipelago<br />
(below). In<br />
western Finl<strong>and</strong><br />
is an oust<strong>and</strong>ing<br />
example of postglacial<br />
uplift.<br />
The ground is<br />
still rising about<br />
8mm a year,<br />
thus new l<strong>and</strong> is<br />
emerging from<br />
the water.<br />
121
IAG Services<br />
The IAG is the home of a number of scientific<br />
services whose goals are to provide the user<br />
community with various geodetic products <strong>and</strong>/or<br />
in<strong>for</strong>mation <strong>and</strong> to foster international cooperation:<br />
BGI (Bureau Gravimetrique<br />
International)<br />
URL: http://bgi.cnes.fr<br />
BGI collects existing gravity measurement on a<br />
worldwide basis.<br />
BIPM - Section Time, Frequency<br />
<strong>and</strong> Gravimetry<br />
URL: http://www.bipm.org/en/scientific/tfg/<br />
BIPM is responsible <strong>for</strong> the maintenance of the<br />
International Atomic Time (TAI) <strong>and</strong> the<br />
Coordinated Universal Time (UTC).<br />
IAS (International Altimetry Service)<br />
URL: http://ias.dgfi.badw.de<br />
The IAS provides a point of contact <strong>for</strong><br />
general in<strong>for</strong>mation on satellite altimetry.<br />
IBS (IAG Bibliographic Service)<br />
URL: http://www.bkg.bund.de<br />
I BS maintains a literature database <strong>for</strong> geodesy,<br />
photogrammetry <strong>and</strong> cartography<br />
(GEOPHOKA).<br />
ICET (International Centre<br />
<strong>for</strong> Earth Tides)<br />
URL: htt://www.astro.oma.be/ICET<br />
ICET collects <strong>and</strong> analyses measurements on Earth<br />
Tides.<br />
ICGEM (International Centre <strong>for</strong><br />
Global Gravity Field Models)<br />
URL: http://icgem.gfz-potsdam.de/ICGEM<br />
ICGEM collects existing gravity field models <strong>and</strong><br />
provides services to utilize these models.<br />
IDEMS (International Digital<br />
Elevation Model Service)<br />
URL: http://www.cse.dmu.ac.uk/EAPRS/iag<br />
IDEMS collects <strong>and</strong> validates digital models of the<br />
global topography.<br />
122<br />
IDS (International DORIS Service)<br />
URL: http://ids.cls.fr<br />
IDS provides DORIS data <strong>and</strong> data products <strong>for</strong> a<br />
wide range of scientific <strong>and</strong> practical applications.<br />
IERS (International Earth Rotation<br />
<strong>and</strong> Reference Systems Service)<br />
URL: http://www.iers.org<br />
IERS provides <strong>and</strong> maintains the International Celestial<br />
Reference System <strong>and</strong> Frame, the Int. Terrestrial<br />
Reference System <strong>and</strong> Frame, <strong>and</strong> it provides Earth<br />
orientation parameters, st<strong>and</strong>ards, <strong>and</strong> models.<br />
IGeS (International Geoid Service)<br />
URL: http://www.iges.polimi.it<br />
IGeS collects software <strong>and</strong> data referring to the<br />
geoid.<br />
IGFS (Int. Gravity Field Service)<br />
URL: http://www.igfs.net<br />
IGFS is responsible <strong>for</strong> the collection, validation,<br />
archiving <strong>and</strong> dissemination of gravity data.<br />
IGS (International GNSS Service)<br />
URL: http://www.igs.org<br />
IGS provides important data <strong>and</strong> products <strong>for</strong> the use<br />
of GNSS <strong>for</strong> Earth science, as well as many societal<br />
applications.<br />
ILRS (Int. Laser Ranging Service)<br />
URL: http://ilrs.gsfc.nasa.gov<br />
ILRS collects, analyses <strong>and</strong> distributes Satellite <strong>and</strong><br />
Lunar Laser Ranging data.<br />
IVS (Int. VLBI Service <strong>for</strong> Geodesy <strong>and</strong><br />
Astrometry)<br />
URL: http://ivscc.gsfc.nasa.gov<br />
IVS coordinates Very Long Baseline Interferometry<br />
(VLBI) observing programmes, sets st<strong>and</strong>ards,<br />
develops conventions <strong>for</strong> VLBI observations.<br />
PSMSL (Permanent Service <strong>for</strong> Mean<br />
Sea Level)<br />
URL: http://www.pol.ac.uk/psmsl<br />
PSMSL is responsible <strong>for</strong> the collection, analysis <strong>and</strong><br />
interpretation of sea level data from a global<br />
network of tide gauges.<br />
The Global Geodetic<br />
Observing System (GGOS)<br />
URL: http://www.ggos.org<br />
GGOS is an official component of IAG as well as a<br />
participating organization of the Group on Earth<br />
Observations (GEO).<br />
GGOS provides observations of the three fundamental<br />
geodetic observables <strong>and</strong> their variations, that is the<br />
Earth’s shape, the Earth’s gravity field, <strong>and</strong> the Earth’s<br />
rotational motion. Thus GGOS ensures the basis to<br />
maintain a stable, accurate <strong>and</strong> global reference frame,<br />
which is crucial <strong>for</strong> all Earth observation. GGOS<br />
contributes to the Global Earth Observing System of<br />
Systems (GEOSS) not only with the global reference<br />
frame, but also with observations related to the global<br />
hydrological cycle, the dynamics<br />
of the atmosphere <strong>and</strong> oceans<br />
<strong>and</strong> geohazards.
The International Cartographic<br />
Association (ICA)<br />
What is Cartography <strong>and</strong> geographic<br />
In<strong>for</strong>mation?<br />
A map is a symbolised image of geographical reality,<br />
representing selected features or characteristics,<br />
resulting from the creative ef<strong>for</strong>t of its author's<br />
execution of choices, <strong>and</strong> is designed <strong>for</strong> use when<br />
spatial relationships are of primary relevance.<br />
Maps <strong>and</strong> geographic in<strong>for</strong>mation (GI) have special<br />
power through their ability to connect <strong>and</strong> integrate<br />
data sets by the inherent geographical location, <strong>and</strong><br />
present the in<strong>for</strong>mation contents in a user‐friendly<br />
<strong>and</strong> underst<strong>and</strong>able visual <strong>and</strong> tactual way. Such<br />
ability has long been recognized as an intrinsic<br />
property of the map artefact, as well as<br />
contemporary geodatabases. The power of maps <strong>and</strong><br />
geographic data h<strong>and</strong>ling has been recently<br />
recognized in many real world applications <strong>and</strong><br />
strategic decision making situations related to<br />
current topics like crisis management, early warning<br />
systems, ef<strong>for</strong>ts <strong>for</strong> supporting sustainability <strong>and</strong><br />
decreasing global poverty.<br />
(From the ICA Research Agenda)<br />
1<br />
123
The International Cartographic Association<br />
International Cartographic Association (ICA) is the<br />
world authoritative body <strong>for</strong> cartography, the<br />
discipline dealing with the conception, production,<br />
dissemination <strong>and</strong> study of maps<br />
The ICA was founded on June 9, 1959, in Bern,<br />
Switzerl<strong>and</strong>. The first General Assembly was held in<br />
Paris in 1961. The first President was Professor<br />
Eduard Imhof, of ETH Zurich, Switzerl<strong>and</strong>, who held<br />
this position between 1961 <strong>and</strong> 1964.<br />
The activities of the ICA are important <strong>for</strong> promoting<br />
<strong>and</strong> advancing the theory <strong>and</strong> praxis of cartography.<br />
Throughout its 50‐year history, ICA has brought<br />
together researchers, government mapping agencies,<br />
commercial cartographic publishers, software<br />
developers, educators, earth <strong>and</strong> environmental<br />
scientists, <strong>and</strong> those with a passion <strong>for</strong> maps.<br />
The mission of the International Cartographic<br />
Association is to promote the discipline <strong>and</strong><br />
profession of cartography in an international<br />
context.<br />
The International Cartographic Association<br />
exists:<br />
2<br />
• To contribute to the underst<strong>and</strong>ing <strong>and</strong> solution<br />
of worldwide problems through the use of<br />
cartography in decision‐making processes.<br />
• To foster the international dissemination of<br />
environmental, economic, social <strong>and</strong> spatial<br />
in<strong>for</strong>mation through mapping.<br />
• To provide a global <strong>for</strong>um <strong>for</strong> discussion of the<br />
role <strong>and</strong> status of cartography.<br />
• To facilitate the transfer of new cartographic<br />
technology <strong>and</strong> knowledge between nations,<br />
especially to the developing nations.<br />
• To carry out or to promote multi‐national<br />
124<br />
cartographic research in order to solve scientific<br />
<strong>and</strong> applied problems.<br />
• To enhance cartographic education in the broadest<br />
sense through publications, seminars <strong>and</strong><br />
conferences.<br />
• To promote the use of professional <strong>and</strong> technical<br />
st<strong>and</strong>ards in cartography.<br />
The Association works with national <strong>and</strong><br />
international governmental <strong>and</strong> commercial bodies<br />
<strong>and</strong> with other international scientific societies to<br />
achieve these aims.<br />
Adopted by the 10th General Assembly of the International<br />
Cartographic Association, Barcelona, Spain, 3 September 1995.<br />
Research Agenda<br />
The ICA Research Agenda specifies the areas of<br />
research activities that the Association will address,<br />
namely:<br />
• Geographic In<strong>for</strong>mation;<br />
• Metadata <strong>and</strong> SDIs;<br />
• Geospatial Analysis <strong>and</strong> Modelling;<br />
• Usability;<br />
• Geovisualization, Visual Analytics;<br />
• Map production;<br />
• Cartographic Theory;<br />
• History of Cartography <strong>and</strong> GI Science;<br />
• Education; <strong>and</strong><br />
• Society.<br />
Commissions <strong>and</strong> Working Groups<br />
To achieve its aims, including the implementation of<br />
the Research Agenda, the ICA operates through a<br />
number of Commissions <strong>and</strong> Working Groups. It<br />
works with national <strong>and</strong> international governmental<br />
<strong>and</strong> commercial bodies <strong>and</strong> with other international<br />
scientific societies. Commissions <strong>and</strong> Working<br />
Groups carry out the general operations of the ICA.<br />
These organisations have addressed the full range of<br />
scientific, technical <strong>and</strong> social research that is the<br />
mark of ICA activity.<br />
The ICA promotes the generation of extensive<br />
publications, generally through its Commissions <strong>and</strong><br />
Working Groups. This activity provides a focus <strong>for</strong><br />
Commissions <strong>and</strong> Working Groups <strong>and</strong> allows <strong>for</strong><br />
knowledge about advances in contemporary<br />
thinking <strong>and</strong> research to be disseminated. The<br />
publications include books, journals <strong>and</strong> the ICA<br />
Newsletter.<br />
ICA Working Group on Early Warning <strong>and</strong><br />
Crisis <strong>Management</strong><br />
For a number of years the ICA has developed a focus<br />
on Early Warning <strong>and</strong> Crisis/<strong>Disaster</strong>/<strong>Risk</strong><br />
management. The ICA Working Group on Early<br />
Warning <strong>and</strong> Crisis <strong>Management</strong> chair, immediate<br />
past‐President Milan Konečný, first elaborated on<br />
the need <strong>for</strong> cartography <strong>and</strong> GIScience to be<br />
actively involved in this area at the Second<br />
International Conference on Early Warning (EWC II)<br />
in 2003. He was concerned that professionals<br />
involved in early warning <strong>and</strong> crises management,<br />
whilst experts in their own particular fields, had a<br />
poor underst<strong>and</strong>ing of how maps, metadata,<br />
st<strong>and</strong>ards, geographical visualization tools could<br />
better support their endeavours.<br />
Prior to the <strong>for</strong>mal <strong>for</strong>mation of the Working Group,<br />
the ICA actively participated in the Early Warning<br />
conference in Bonn in 2002 <strong>and</strong> at the Cartographic<br />
CuttingEdge Technology <strong>for</strong> Natural Hazard<br />
<strong>Management</strong> conference, held in Dresden, Germany<br />
in 2004.<br />
The topic of Early Warning <strong>and</strong> Crises <strong>Management</strong><br />
was incorporated into the 2005 Memor<strong>and</strong>um of
Underst<strong>and</strong>ing between the United Nations Office<br />
<strong>for</strong> Outer Space Affairs <strong>and</strong> the International<br />
Cartographic Association, It was agreed “to utilize,<br />
when appropriate, the scientific, technological,<br />
expertise of ICA through the reviews, evaluations or<br />
recommendations on matters relating to the use <strong>and</strong><br />
applications of GNNS, early warning <strong>and</strong> disaster<br />
management, <strong>and</strong> management of natural<br />
resources”.<br />
The <strong>for</strong>mal proposal to <strong>for</strong>m a Working Group on<br />
Early Warning <strong>and</strong> Crisis <strong>Management</strong> was made at<br />
the 13th ICA General Assembly, held in conjunction<br />
with the International Cartographic Conference, in<br />
La Coruna, Spain in 2005. The initial Chair of the<br />
Working Group was Dr Wilber from Kenya.<br />
The Working Group on Early Warning <strong>and</strong> Crisis<br />
<strong>Management</strong> is now an active contributor the work<br />
of the International Cartographic Association <strong>and</strong> its<br />
outreach <strong>and</strong> training activities. The endeavours of<br />
the Working Group are focussed on contributing to<br />
promoting the importance of geospatial in<strong>for</strong>mation<br />
<strong>and</strong> tools to in<strong>for</strong>m in early warning <strong>and</strong> how access<br />
to appropriate geospatial tools can assist in times of<br />
emergency. As well, the Working Group actively<br />
disseminates the knowledge about the use of maps<br />
<strong>and</strong> geospatial in<strong>for</strong>mation to the wider<br />
international emergency mitigation <strong>and</strong><br />
management community.<br />
The aims of the Working Group<br />
• To provide leadership in the development of<br />
concepts, ontologisation <strong>and</strong><br />
st<strong>and</strong>ardization of early warning <strong>for</strong> hazard,<br />
risk <strong>and</strong> vulnerability mapping <strong>and</strong><br />
cartographic modelling.<br />
• To promote the cartographic use of<br />
remotely sensed <strong>and</strong> other geospatial data<br />
<strong>and</strong> various analysis techniques <strong>for</strong> early<br />
warning <strong>and</strong> crisis management by<br />
organizing conferences, seminar <strong>and</strong><br />
workshops.<br />
• To investigate psychological condition of<br />
end user given by their personal character<br />
<strong>and</strong> situation <strong>and</strong> psychological condition of<br />
rescued persons.<br />
• To promote capacity building <strong>and</strong> quality<br />
mapping, <strong>and</strong> cartographic modelling<br />
including modern technology <strong>for</strong> early<br />
warning <strong>and</strong> crisis management through<br />
topic related publications.<br />
• To participate <strong>and</strong> contribute to global<br />
initiatives in early warning <strong>and</strong> crisis<br />
management <strong>for</strong> instance through the<br />
maintenance of a website.<br />
• To promote hazard, risk <strong>and</strong> vulnerability<br />
mapping <strong>for</strong> crisis management <strong>and</strong><br />
communication.<br />
• To develop mechanisms <strong>and</strong> networks <strong>for</strong><br />
exchange of in<strong>for</strong>mation among<br />
stakeholders on crisis management <strong>and</strong><br />
early warning.<br />
Activities of the ICA Working Group on Early<br />
Warning <strong>and</strong> Crisis <strong>Management</strong><br />
In 2005, at the XVIII General Assembly of the Pan‐<br />
American Institute <strong>for</strong> Geography <strong>and</strong> History in<br />
Venezuela, the ICA Working Group promoted the<br />
need to develop cartography <strong>and</strong> GIS applications <strong>for</strong><br />
early warning prevention <strong>and</strong> management of<br />
disasters to the Latin American community.<br />
The 2005 ICA conference in La Coruna, Spain ICA<br />
included a special seminar Cartography in the SDI<br />
Changing World, The Role of SDI <strong>and</strong> Cartography in<br />
our contemporary World <strong>for</strong> monitoring <strong>and</strong> disaster<br />
alleviation.<br />
In 2006 a poster was prepared by the Working<br />
Group ‐ “Cartography <strong>and</strong> Geoin<strong>for</strong>matics <strong>for</strong> Early<br />
Warning”. The poster was widely disseminated<br />
within the cartography <strong>and</strong> GIScience international<br />
community. It was aimed at the promotion of the<br />
work of the Working Group within the community<br />
<strong>and</strong> to illustrate to the general public the need to<br />
ensure that essential geospatial in<strong>for</strong>mation was<br />
available during times of crises. The poster was<br />
launched at the Third International Conference on<br />
Early Warning, organized by the United Nations <strong>and</strong><br />
the International Strategy <strong>for</strong> <strong>Disaster</strong> Reduction<br />
(ISDR), held in Bonn, Germany in 2006.<br />
In 2007 the work of the ICA Working Group on Early<br />
Warning <strong>and</strong> Crises <strong>Management</strong> was promoted in<br />
the Asia‐pacific region. The Working Group was<br />
actively involved in the Workshop on <strong>Disaster</strong><br />
<strong>Management</strong>, associated with the 2nd Indonesian<br />
Geospatial Technology Exhibition (IGTE) in Jakarta,<br />
Indonesia.<br />
The start of 2008 saw the beginning of a number of<br />
seminars organized by or with direct contributions<br />
from the ICA Working Group. The first was the Early<br />
Warning <strong>and</strong> disaster/crises management conference<br />
was held in Borovets, Bulgaria. The second was the<br />
Workshop on Cartography in Early Warning <strong>and</strong><br />
Crises <strong>Management</strong> <strong>and</strong> Round Table, held at<br />
AutoCarto 8, Shepherdstown, West Virginia, USA.<br />
This event addressed natural anthropogenic<br />
disasters; current global, regional <strong>and</strong> local<br />
initiatives in early warning <strong>and</strong> crises management;<br />
paradigms of action; exchange of best practices <strong>for</strong><br />
activities in the field; avoidance of shortcuts in crises<br />
situations; sharing <strong>and</strong> st<strong>and</strong>ardizing of data on<br />
material reserves <strong>and</strong> potential human provisions;<br />
3<br />
125
the interconnection between current OGC/ISO<br />
activities <strong>and</strong> crises management.<br />
The main activity of the Working Group in 2009 was<br />
conducting a Joint Symposium with the JBGIS Gi4DM<br />
‐ Cartography <strong>and</strong> Geoin<strong>for</strong>matics <strong>for</strong> Early Warning<br />
<strong>and</strong> Emergency <strong>Management</strong> ‐ held in January 2009<br />
in Prague, Czech Republic. The symposium topics<br />
were organized under the themes of: frameworks<br />
<strong>and</strong> tools; technologies <strong>and</strong> infrastructures; citizens<br />
in early warning <strong>and</strong> emergency management; e‐<br />
government <strong>and</strong> e –governance; <strong>and</strong> cartographic<br />
<strong>and</strong> Geoin<strong>for</strong>matics applications. A ‘Round Table’ on<br />
Spatially Enabled Early Warning <strong>and</strong> Emergency<br />
<strong>Management</strong> was held at the Symposium.<br />
In early April 2009, the Working Group promoted its<br />
activities at a seminar on the Potentials in Early<br />
Warning <strong>and</strong> Emergency <strong>Management</strong> at the<br />
international GeoSiberia conference in Novosibirsk.<br />
Following the success of the sessions it was decided<br />
to include meetings of the WG as part of future<br />
GeoSiberia conferences.<br />
At the International Cartographic Conference, held in<br />
Santiago, Chile in November 2009 the Working<br />
Group met <strong>and</strong> a number of papers related to<br />
cartography <strong>and</strong> Geoin<strong>for</strong>matics <strong>for</strong> Early Warning<br />
were presented. Two sessions in the ICC program<br />
were devoted to problems of Emergency<br />
<strong>Management</strong>. As well, as part of an outreach activity<br />
the Working Group conducted an excursion to the<br />
Chilean Military Center <strong>for</strong> Crises <strong>Management</strong> <strong>and</strong><br />
the Chilean Civilian Emergency <strong>Management</strong> Office<br />
both located in Santiago de Chile.<br />
In April 2010 in Novosibirsk, Russia, a seminar was<br />
held on Early Warning <strong>and</strong> Crises/<strong>Disaster</strong><br />
<strong>Management</strong>. This was a joint event between the<br />
ICA, the International Society on Digital Earth‐ISDE<br />
4<br />
126<br />
<strong>and</strong> SSGA, with the participation of colleagues from<br />
the <strong>ISPRS</strong> <strong>and</strong> FIG.<br />
A number of events are in preparation <strong>for</strong> 2010.<br />
These are: Nessebar, Bulgaria, June 2010 ‐ Digital<br />
Earth Summit <strong>and</strong> 3rd Conference on Cartography<br />
<strong>and</strong> GIS ‐ a seminar on Early Warning <strong>and</strong><br />
<strong>Disaster</strong>/Crises <strong>Management</strong>: European Concepts <strong>for</strong><br />
Crises <strong>Management</strong> <strong>and</strong> Early Warning; <strong>and</strong> Orl<strong>and</strong>o,<br />
USA, November 2010 ‐ a workshop on Crises<br />
<strong>Management</strong> <strong>and</strong> Early Warning at AutoCarto 2010.<br />
The 25th International Cartography Conference <strong>and</strong><br />
the 15th General Assembly of the International<br />
Cartographic Association will take place between 3–<br />
8 July 2011, in Paris, France. The Working Group on<br />
Early Warning <strong>and</strong> Crisis <strong>Management</strong> will hold a<br />
focused meeting in Paris in conjunction with the<br />
conference. (See the Web site at:<br />
http://www.icc2011.fr/ <strong>for</strong> further in<strong>for</strong>mation<br />
about the conference).<br />
Summary<br />
In summary, the International Cartographic<br />
Association began to be active in Early Warning <strong>and</strong><br />
Crises <strong>Management</strong> in 2003. This followed with a<br />
number of activities that have now become part of<br />
the Working Group’s activities ‐ seminars at<br />
Borovets <strong>and</strong> Nessebar in Bulgaria, seminars in<br />
Novosibirsk, Russia, at AutoCarto USA <strong>and</strong> at<br />
International Cartographic Conferneces. The<br />
working Group continues to address the issues of<br />
Crises <strong>Management</strong> <strong>and</strong> Early Warning in<br />
collaboration with members of the JBGIS.<br />
Professor Dr. Milan Konecný, Immediate past‐<br />
President, International Cartographic Association<br />
<strong>and</strong> Chair ICA Working Group on Early Warning <strong>and</strong><br />
Crisis <strong>Management</strong><br />
Professor Dr. Dr. William Cartwright, President,<br />
International Cartographic Association
The International Federation of<br />
Surveyors (FIG)<br />
Stig Enemark,<br />
FIG president, Professor in L<strong>and</strong> <strong>Management</strong>,<br />
Aalborg University, Denmark<br />
AWhat is a surveyor ?<br />
A surveyor is a professional person with the<br />
academic qualifications <strong>and</strong> technical expertise to<br />
practise the science of measurement <strong>and</strong> mapping;<br />
to assemble <strong>and</strong> manage geographic related<br />
in<strong>for</strong>mation; to use that in<strong>for</strong>mation <strong>for</strong> efficient<br />
administration of l<strong>and</strong> <strong>and</strong> properties <strong>and</strong> the <strong>and</strong><br />
the natural <strong>and</strong> built environment; <strong>and</strong> to instigate<br />
the advancement <strong>and</strong> development of such practices.<br />
Practice of the surveyor's profession may involve<br />
one or more of the following activities which may be<br />
carried out in association with other professionals:<br />
positioning <strong>and</strong> mapping; l<strong>and</strong> <strong>and</strong> engineering<br />
surveying; spatial in<strong>for</strong>mation management;<br />
boundary surveying <strong>and</strong> l<strong>and</strong> registration; l<strong>and</strong><br />
administration <strong>and</strong> l<strong>and</strong>-use planning; l<strong>and</strong><br />
valuation <strong>and</strong> real estate management; <strong>and</strong><br />
construction economics <strong>and</strong> management.<br />
In the application of these activities surveyors take<br />
into account the relevant legal, economic,<br />
environmental <strong>and</strong> social aspects affecting each<br />
project.<br />
127
What is FIG?<br />
FIG is the premier international organization<br />
representing the interests of surveyors worldwide. It<br />
is a federation of the national member associations<br />
<strong>and</strong> covers the whole range of professional fields<br />
within the global surveying community. It provides<br />
an international <strong>for</strong>um <strong>for</strong> discussion <strong>and</strong><br />
development aiming to promote professional<br />
practice <strong>and</strong> st<strong>and</strong>ards.<br />
FIG was founded in 1878 in Paris <strong>and</strong> was known as<br />
the Fèdèration Internationale des Gèometres. This<br />
has become anglicized to the International<br />
Federation of Surveyors. It is a UN-recognized nongovernment<br />
organization (NGO), representing more<br />
than 100 countries throughout the world, <strong>and</strong> its aim<br />
is to ensure that the disciplines of surveying <strong>and</strong> all<br />
who practise them meet the needs of the markets<br />
<strong>and</strong> communities that they serve.<br />
In general, FIG will strive to enhance the global<br />
st<strong>and</strong>ing of the surveying profession through both<br />
education <strong>and</strong> practice, increase political relations<br />
both at national <strong>and</strong> international level, help<br />
eradicating poverty, promote democratisation, <strong>and</strong><br />
facilitate economic, social <strong>and</strong> environmental<br />
sustainability.<br />
FIG's activities are governed by a work plan, which is<br />
regularly reviewed against a longer-term strategic<br />
plan. The current work plan 2007-2010 is entitled<br />
“Building the Capacity”. FIG recognises the particular<br />
needs of capacity building in developing countries to<br />
meet the challenges of fighting poverty <strong>and</strong><br />
developing a basis <strong>for</strong> a sustainable future.<br />
128<br />
FIG also recognises that markets <strong>for</strong> surveyors'<br />
services are constantly changing. The plan there<strong>for</strong>e<br />
lays emphasis on strengthening professional<br />
institutions; promoting professional development;<br />
<strong>and</strong> encouraging surveyors to acquire new skills <strong>and</strong><br />
techniques <strong>for</strong> meeting the needs of society <strong>and</strong> the<br />
environment.<br />
Ten commissions lead FIG's technical <strong>and</strong> professional<br />
work. Each member association appoints a delegate to<br />
each of the commissions. Detailed in<strong>for</strong>mation on the<br />
work of the commissions, their work plans, working<br />
groups, seminars, newsletters <strong>and</strong> publications can be<br />
found at the FIG website: www.FIG.net
FIG approach to natural disaster prevention <strong>and</strong><br />
management<br />
Due to the increasing frequency of disasters<br />
worldwide <strong>and</strong> their humanitarian <strong>and</strong> economic<br />
consequences, a lot of international organizations,<br />
<strong>and</strong> NGOs are looking at developing techniques <strong>and</strong><br />
tools <strong>for</strong> disaster risk management, such as UN/ISDR<br />
(2004), FIG (2006) <strong>and</strong> RICS (2009).<br />
The process of disaster risk management <strong>for</strong>ms an<br />
ongoing circle of activities related to the situation<br />
be<strong>for</strong>e (risk identification, prevention,<br />
preparedness), during (emergency relief) <strong>and</strong> after a<br />
disaster (recovery, reconstruction) where the latter<br />
should then feed back into improving the resilience<br />
of vulnerable communities <strong>and</strong> reduce future risks<br />
leading towards sustainable development.<br />
The contribution of surveyors relate mainly to the<br />
situation be<strong>for</strong>e <strong>and</strong> after a disaster while<br />
emergency relief during the disaster in undertaken<br />
mainly by the humanitarian organistaions.<br />
The FIG publication no 38:<br />
The Contribution of the<br />
Surveying Profession to<br />
<strong>Disaster</strong> <strong>Risk</strong> <strong>Management</strong><br />
(2006) clearly outlines the<br />
wide scope of surveyor's<br />
abilities including l<strong>and</strong><br />
management, geodetic<br />
engineering, geo-in<strong>for</strong>matics,<br />
satellite technology, <strong>and</strong><br />
remote sensing that can make<br />
an important contribution to<br />
improve, simplify <strong>and</strong> to<br />
shorten the disaster<br />
management process.<br />
Billion dollar whether disaster in the USA 1980-2008. (Source: NOAA)<br />
The total number of disasters (such as drought,<br />
earthquake, flood, slide, volcanic eruption, hurricane,<br />
etc.) has increased from about 150 in 1980 to more<br />
than 400 in 2000. In the USA, <strong>for</strong> example, more than<br />
90 weather disasters have occurred the last 30 years<br />
with the total costs exceeding 700 billion USD.<br />
There is wisdom in the statement of Kofi Annan,<br />
the <strong>for</strong>mer UN Secretary General: “While many<br />
people are aware of the terrible impact of disasters<br />
throughout the world, few realise this is a problem<br />
that we can do something about.”<br />
129
L<strong>and</strong> administration systems in support of<br />
natural disaster risk management<br />
Sustainable l<strong>and</strong> administration systems provide<br />
clear identification of the individual l<strong>and</strong> parcels <strong>and</strong><br />
l<strong>and</strong> rights attached to these parcels. This<br />
in<strong>for</strong>mation on the people to l<strong>and</strong> relationship is<br />
crucial in the immediate post disaster situation.<br />
Following the relief <strong>and</strong> early recovery transition<br />
period where focus is on the overriding<br />
humanitarian ef<strong>for</strong>ts of saving lives <strong>and</strong> providing<br />
immediate relief the recovery <strong>and</strong> reconstruction<br />
phase will to a large extent relate to re-establishing<br />
the situation of legal rights to l<strong>and</strong> <strong>and</strong> properties<br />
<strong>and</strong> the reconstruction of buildings <strong>and</strong><br />
infrastructure. Sustainable l<strong>and</strong> administration<br />
systems provide the basis <strong>for</strong> managing these<br />
processes.<br />
<strong>Disaster</strong> risks should be identified as area zones in<br />
the l<strong>and</strong> use plans <strong>and</strong> l<strong>and</strong> in<strong>for</strong>mation systems<br />
with the relevant risk assessments <strong>and</strong> in<strong>for</strong>mation<br />
attached. Such disaster risk zones may relate to sea<br />
level rise, earthquakes, volcano eruption, flooding,<br />
draught, hurricanes, etc, <strong>and</strong> the in<strong>for</strong>mation should<br />
relate to the predicted risks as known through<br />
statistics <strong>and</strong> positioning measurement systems.<br />
By combining the disaster risk in<strong>for</strong>mation with the<br />
relevant in<strong>for</strong>mation on l<strong>and</strong> tenure, l<strong>and</strong> value, <strong>and</strong><br />
l<strong>and</strong> use the necessary risk prevention <strong>and</strong><br />
mitigation measures can be identified <strong>and</strong> assessed<br />
in relation to legal, economic, physical, <strong>and</strong> social<br />
consequences.<br />
In disaster zones relevant measures should be taken<br />
to build the preparedness <strong>for</strong> managing any disaster<br />
events. L<strong>and</strong> is necessary <strong>for</strong> emergency shelter <strong>and</strong><br />
<strong>for</strong> restoration of livelihoods. L<strong>and</strong> grabbing is a<br />
key risk in this process. Humanitarian actors are<br />
there<strong>for</strong>e confronted with the l<strong>and</strong> issue as they<br />
undertake emergency shelter <strong>and</strong> protection activity.<br />
130<br />
Right: Good governance <strong>and</strong> capacity<br />
building <strong>for</strong> disaster risk reduction <strong>and</strong><br />
sustainable development (FIG 2006).<br />
Building the capacity <strong>for</strong> disaster prevention<br />
<strong>and</strong> management<br />
Good governance <strong>and</strong> capacity building are central<br />
components in the process <strong>and</strong> implementation of<br />
disaster risk management <strong>and</strong> sustainable<br />
development.<br />
The capacity to be prepared <strong>for</strong> <strong>and</strong> manage natural<br />
disasters will of course include the use of early<br />
warning systems that provide timely <strong>and</strong> effective<br />
in<strong>for</strong>mation in due time <strong>for</strong> taking the necessary<br />
actions <strong>and</strong> preparing <strong>for</strong> an efficient response.<br />
Another key issue is to establish the necessary<br />
political commitment <strong>for</strong> integrating mitigating<br />
Left: Key elements of disaster risk<br />
management (FIG, 2006)<br />
measures <strong>and</strong> disaster risk reduction into the l<strong>and</strong><br />
administration systems, <strong>and</strong> to implement these<br />
policies through organisational structures <strong>and</strong><br />
regulatory frameworks.<br />
FIG (2006): The Contribution of the Surveying<br />
Profession to <strong>Disaster</strong> <strong>Risk</strong> <strong>Management</strong>. FIG<br />
Publication No. 38. FIG Office, Copenhagen,<br />
Denmark.<br />
RICS (2009): The Built Environment Professions in<br />
<strong>Disaster</strong> <strong>Risk</strong> Reduction <strong>and</strong> Response. RICS,<br />
London.<br />
UN-ISDR (2004): Living with <strong>Risk</strong>s: A Global Review<br />
of <strong>Disaster</strong> Reduction Initiatives. United Nations.
T<br />
The Map Trade Association<br />
(IMTA)<br />
Why are maps <strong>and</strong> geographic in<strong>for</strong>mation<br />
important to risk <strong>and</strong> disaster management?<br />
By Mark Cygan, IMTA (Americas) director <strong>and</strong><br />
S<strong>and</strong>y Hill, IMTA, executive director<br />
The International Map Trade Association (IMTA) is a<br />
worldwide organization in the mapping, geospatial<br />
<strong>and</strong> geographic in<strong>for</strong>mation industry. A truly global<br />
organization, IMTA's mission is to connect the<br />
business of maps worldwide. IMTA welcomes<br />
members from every corner of the world <strong>and</strong> the<br />
association is made up of three regions: Europe,<br />
Africa, <strong>and</strong> the Middle East; Asia <strong>and</strong> the Pacific; <strong>and</strong><br />
the Americas. Each region organizes it own local<br />
activities ensuring wherever based, IMTA is both<br />
relevant <strong>and</strong> accessible.<br />
New technologies, cartography techniques, <strong>and</strong><br />
mapping products are emerging all the time <strong>and</strong><br />
keeping up-to-date with industry developments can<br />
be a real challenge. IMTA organizes global<br />
conferences, committees, discussion groups <strong>and</strong><br />
newsletters to facilitate the exchange of in<strong>for</strong>mation.<br />
The large community is accessible via<br />
www.maptrade.org <strong>and</strong> provides a community <strong>for</strong><br />
sharing ideas.<br />
Maps are the products of cartography, art, science<br />
<strong>and</strong> technology, <strong>and</strong> graphically communicate <strong>and</strong><br />
represent the world we live in <strong>and</strong> the events that<br />
occur in it, helping us gain underst<strong>and</strong>ing.<br />
July 2008 Fires in Northern <strong>and</strong> Central<br />
Cali<strong>for</strong>nia<br />
During the summer of 2008, more than 2,780<br />
individual fires burned large portions of <strong>for</strong>ests <strong>and</strong><br />
chaparral in Cali<strong>for</strong>nia. A majority of the fires were<br />
started by lightning from dry thunderstorms, a<br />
storm producing thunder <strong>and</strong> lightning but no rain.<br />
The fires broke out after three years of below normal<br />
rainfall, <strong>and</strong> that spring was recorded as the driest<br />
on record <strong>for</strong> many regions in the area. More than<br />
800,000 acres burned, making these the greatest in<br />
Cali<strong>for</strong>nia history by burned area. Aid from around<br />
the world, including workers from Greece, Chile,<br />
Argentina, Brazil, Australia, Canada, Mexico <strong>and</strong> New<br />
Zeal<strong>and</strong> was present to help fight the fires. More<br />
than 20,000 personnel were committed to combat<br />
the flames, including 467 h<strong>and</strong> crews, 1,503 engines,<br />
423 water tenders, 291 bulldozers, 142 helicopters,<br />
400 soldiers <strong>and</strong> numerous air tankers. The loss of<br />
life was high, with 23 fatalities.<br />
During the fire, agencies used digitally mapped data,<br />
spatial analysis, <strong>and</strong> modeling to better plan <strong>and</strong><br />
carry out fire suppression operations. GIS was used<br />
to assist in the deployment <strong>and</strong> tracking of Cali<strong>for</strong>nia<br />
state assets fighting the hundreds of fires taking<br />
place.<br />
GIS experts deployed during previous fires again<br />
worked with Cali<strong>for</strong>nia State fire fighters <strong>and</strong> federal<br />
<strong>and</strong> local agencies <strong>for</strong> tactical planning as part of the<br />
overall response. Incident management teams used<br />
GIS to map active fire perimeters, hot spots, burned<br />
areas, <strong>and</strong> affected communities. Protection<br />
priorities were established with the assistance of GIS<br />
by assessing highly flammable accumulations of<br />
vegetation combined with steep terrain that<br />
threatened homes, infrastructure, <strong>and</strong> natural<br />
resource values. GIS-generated maps were also used<br />
<strong>for</strong> public in<strong>for</strong>mation sharing, including fire<br />
locations, road closures, damaged properties,<br />
evacuations, shelter locations, <strong>and</strong> Red Cross<br />
assistance.<br />
Imagery was very important during the active fire<br />
stage. Fourteen L<strong>and</strong>sat images acquired between 5<br />
July 2008, <strong>and</strong> 8 July 8 2008, were mosaicked to<br />
provide a continuous 30-meter resolution overview<br />
of active <strong>and</strong> contained wildfires in northern<br />
Cali<strong>for</strong>nia.<br />
As wildfires were contained, additional L<strong>and</strong>sat 5<br />
<strong>and</strong> 7 imagery was used to map post fire soil burn<br />
severity <strong>and</strong> vegetation mortality, refine <strong>and</strong> verify<br />
fire perimeters, <strong>and</strong> serve as input to models<br />
predicting post fire debris flow hazards. The data<br />
were processed by the USGS Earth Resources<br />
Observation <strong>and</strong> Science Center.<br />
131
The mosaic was used by state <strong>and</strong> local fire management staff as a<br />
graphic to support various fire status briefings.<br />
132<br />
This image is a partial L<strong>and</strong>sat 5 scene of the Humboldt fire region<br />
(outlined as well on the mosaic.) The light blue tone represents smoke<br />
from active fires <strong>and</strong> the dark red area near Humboldt indicates a scar<br />
from a previous fire.
Hurricane Katrina<br />
Hurricane Katrina hit the Atlantic coastline in the<br />
United States in 2005 <strong>and</strong> left disaster in its wake.<br />
Forming over the Bahamas, it crossed southern<br />
Florida causing deaths <strong>and</strong> flooding be<strong>for</strong>e rapidly<br />
gaining strength in the Gulf of Mexico. When it made<br />
its second l<strong>and</strong>fall in southeast Louisiana, it had<br />
caused severe destruction along the Gulf Coast from<br />
central Florida to Texas. The most costly in terms of<br />
damage, estimates <strong>for</strong> rebuilding are well in excess<br />
of $100 billion. Close to 2,000 people lost their lives.<br />
These L<strong>and</strong>sat 7 satellite images show damage from<br />
Hurricane Katrina along the Mississippi Gulf coast<br />
from Biloxi, Mississippi to the edge of Mobile,<br />
Alabama. The bottom image, acquired on September<br />
8, 2005, in comparison to the same area in 2003 (top<br />
image), reveals how the brunt <strong>for</strong>ce of the hurricane<br />
not only affected the coastline, but also reached the<br />
inl<strong>and</strong> areas of the Pascagoula River.<br />
Data comparisons show the nature, magnitude, <strong>and</strong><br />
spatial variability of coastal changes such as beach<br />
erosion, overwash deposition, <strong>and</strong> isl<strong>and</strong> breaching.<br />
These data will also be used to further refine<br />
predictive models of coastal impacts from severe<br />
storms. The data are being made available to local,<br />
state, <strong>and</strong> federal agencies <strong>for</strong> purposes of disaster<br />
recovery <strong>and</strong> erosion mitigation.<br />
Above: L<strong>and</strong>sat 7 satellite data acquired 11/08/2004<br />
B<strong>and</strong>s 5,4,3 with pan merge.<br />
Below: L<strong>and</strong>sat 7 satellite data acquired 9/08/2005<br />
B<strong>and</strong>s 5,4,3 with pan merge<br />
133
Indian Ocean Tsunami Impact on Northwest<br />
Sumatra Coast<br />
The tsunami generated by the great Sumatra<br />
earthquake of 26 December 2004 devastated 200<br />
kilometers of Sumatra coast from Kuede on the north<br />
end of the isl<strong>and</strong> to south of Meulaboh on the west<br />
coast. Of the roughly 223,000 lives lost during this<br />
event, 72% of the casualties were caused by the<br />
near-field tsunami that struck northern Sumatra; the<br />
remaining deaths were due to the far-field tsunami<br />
that impacted coasts around much of the Indian<br />
Ocean. Post-tsunami reconnaissance surveys of the<br />
northwest coast of Sumatra indicate tsunami flow<br />
depths of five to 12 meters along the north coast <strong>and</strong><br />
seven to 20 meters along the west coast; peak run-up<br />
was as high as 39 meters west of Aceh Province near<br />
Lhoknga.<br />
The image pair below illustrates a small portion of<br />
the L<strong>and</strong>sat scene which has experienced extensive<br />
destruction along coastlines, river channels, <strong>and</strong><br />
estuaries. The large affected area, toward the center<br />
of the scene on the right, shows inl<strong>and</strong> intrusion by<br />
the tsunami of greater than 3 kilometers. Upl<strong>and</strong><br />
areas, above 15-20 meters, were largely unaffected.<br />
Studying these flow depths <strong>and</strong> run-up heights show<br />
that the tsunami may have had alternate sources,<br />
such as secondary intraplate faults, contributing to<br />
the tsunami in addition to interpolate slip on the<br />
Sumatra megathrust. Underst<strong>and</strong>ing this means that<br />
tsunami warning times <strong>for</strong> inhabitants are reduced<br />
<strong>and</strong> there is an increased likelihood of devastation by<br />
inundation.<br />
134<br />
L<strong>and</strong>sat Comparison of Pre/Post<br />
Tsunami Acquisitions <strong>for</strong> the<br />
Northwest Sumatra Coast
The International Society <strong>for</strong><br />
Photogrammetry <strong>and</strong> Remote<br />
Sensing (<strong>ISPRS</strong>)<br />
WWhat are Photogrammetry, Remote Sensing<br />
<strong>and</strong> the Spatial In<strong>for</strong>mation Sciences?<br />
Photogrammetry <strong>and</strong> Remote Sensing is the art,<br />
science, <strong>and</strong> technology of obtaining reliable<br />
in<strong>for</strong>mation, from noncontact imaging <strong>and</strong> other<br />
sensor systems, about the Earth <strong>and</strong> its environment,<br />
<strong>and</strong> other physical objects <strong>and</strong> processes through<br />
recording, measuring, analyzing <strong>and</strong> representation.<br />
Spatial In<strong>for</strong>mation Science is the art, science,<br />
<strong>and</strong> technology of obtaining reliable spatial,<br />
spectral <strong>and</strong> temporal relationships between<br />
physical objects, <strong>and</strong> of processes <strong>for</strong><br />
integration with other data <strong>for</strong> analysis,<br />
portrayal <strong>and</strong> representation, independently of<br />
scale.<br />
135
Mission of <strong>ISPRS</strong>?<br />
The International Society <strong>for</strong> Photogrammetry <strong>and</strong><br />
Remote Sensing is a non-governmental organisation<br />
devoted to the development of international cooperation<br />
<strong>for</strong> the advancement of photogrammetry,<br />
remote sensing <strong>and</strong> spatial in<strong>for</strong>mation sciences <strong>and</strong><br />
their applications. The Society operates without any<br />
discrimination on grounds of race, religion,<br />
nationality, or political philosophy. Established in<br />
1910 by Professor Dolezal from the Technical<br />
University of Vienna, Austria, <strong>ISPRS</strong> is the oldest<br />
international umbrella organisation in its fields,<br />
which may be summarized as addressing<br />
“in<strong>for</strong>mation from imagery.”<br />
Role of <strong>ISPRS</strong><br />
The principal activities of <strong>ISPRS</strong> are:<br />
1. Stimulating the <strong>for</strong>mation of national or<br />
regional Societies of Photogrammetry <strong>and</strong><br />
Remote Sensing.<br />
2. Initiating <strong>and</strong> coordinating research in<br />
photogrammetry <strong>and</strong> remo te sensing <strong>and</strong><br />
spatial in<strong>for</strong>mation sciences.<br />
3. Holding international Symposia <strong>and</strong><br />
Congresses at regular intervals.<br />
4. Ensuring worldwide circulation of the<br />
records of discussion <strong>and</strong> the results of<br />
research by publication of the International<br />
Archives of Photogrammetry, Remote<br />
Sensing <strong>and</strong> Spatial In<strong>for</strong>mation Sciences.<br />
5. Encouraging the publication <strong>and</strong> exchange of<br />
scientific papers <strong>and</strong> journals dealing with<br />
photogrammetry <strong>and</strong> remote sensing.<br />
136<br />
Figure 1: <strong>ISPRS</strong> is a Society of National Societies <strong>and</strong><br />
Organisations<br />
The scientific <strong>and</strong> technical programme of<br />
<strong>ISPRS</strong><br />
The scientific <strong>and</strong> technical programme <strong>ISPRS</strong> is<br />
organized by eight Technical Commissions. Each<br />
Commission is comprised of a number of Working<br />
Groups which are responsible <strong>for</strong> particular topics<br />
within the Commissions' areas of responsibility. The<br />
<strong>ISPRS</strong> conference programme includes a quadrennial<br />
Congress, Technical Commission Symposia held in<br />
the even numbered year between the Congresses<br />
<strong>and</strong> workshops organized by the Working Groups at<br />
regular intervals.
Activities of the <strong>ISPRS</strong> WG IV/8: 3D Spatial<br />
Data Integration <strong>for</strong> <strong>Disaster</strong> <strong>Management</strong> <strong>and</strong><br />
Environmental Monitoring<br />
This working group is a continuation of the WG IV/8<br />
'Spatial data integration <strong>for</strong> emergency response'<br />
which worked during the period 2004 to 2008. The<br />
group was <strong>for</strong>med to address the urgent dem<strong>and</strong>s<br />
<strong>for</strong> better, more sophisticated <strong>and</strong> appropriate<br />
means <strong>for</strong> managing the consequences of man-made<br />
<strong>and</strong> natural risks. The focus was on interoperability<br />
of emergency services, harmonisation of data <strong>and</strong><br />
provision of appropriate in<strong>for</strong>mation to ensure that<br />
needs of citizens receive high-quality attention. The<br />
most dem<strong>and</strong>ing Response Phase was studied<br />
explicitly by investigating user needs <strong>and</strong><br />
requirements <strong>for</strong> provision of tools <strong>for</strong> an efficient<br />
collaboration <strong>and</strong> underst<strong>and</strong>ing between different<br />
rescue teams such as the Health Sector, Police, Fire<br />
Brigade <strong>and</strong> civil protection.<br />
Figure 2: Indoor 3D visualisation <strong>and</strong> analysis<br />
What is the current status? Many international<br />
activities (projects) have taken place to ensure<br />
timely supply of harmonized data as soon as<br />
practicable after a disaster to aid in the provision of<br />
appropriate services. Geoportals <strong>and</strong> web access<br />
points have been developed worldwide to provide<br />
easy search <strong>and</strong> access 24 hours per day. Early<br />
warning centres have been established in several<br />
countries. Many bottlenecks in the provision of<br />
spatial data have been resolved by ensuring the most<br />
appropriate data is provided, supported by an<br />
integrated systems approach.<br />
However, most of the operational systems use twodimensional<br />
data sets. Systems capable of seamless<br />
integration of 3D topographic (GIS), geological,<br />
meteorological, BIM models are not yet available.<br />
There has been insufficient research on 3D indoor<br />
modelling <strong>for</strong> safe evacuation <strong>and</strong> navigation in<br />
urban environments. Appropriate models <strong>for</strong> 3D<br />
analysis <strong>and</strong> simulations, e.g. prediction of plume<br />
movement, have received little attention. It is our<br />
firm underst<strong>and</strong>ing that 3D technology can better<br />
aid disaster management <strong>and</strong> environmental<br />
monitoring.<br />
Figure 3: Outdoor 3D visualisation <strong>and</strong> analysis<br />
�The goal of this Working Group is to contribute to<br />
the investigation of user requirements, research,<br />
development, <strong>and</strong> testing new technologies <strong>for</strong><br />
intelligent use of spatial in<strong>for</strong>mation in the Response<br />
Phase of risk <strong>and</strong> disaster management. The work of<br />
the WG in the period 2008-2012 concentrates on the<br />
following topics:<br />
�Integration of 3D GIS <strong>and</strong> intelligent image<br />
analysis systems <strong>for</strong> emergency management in<br />
urban environments;<br />
�Application of low-cost <strong>and</strong> real-time digital<br />
imaging <strong>and</strong> mobile mapping technologies <strong>for</strong><br />
emergency response;<br />
�3D data structures, algorithms, <strong>and</strong> st<strong>and</strong>ards <strong>for</strong><br />
emergency data management <strong>and</strong> exchange;<br />
�Geo-ontology <strong>and</strong> semantics <strong>for</strong> emergency<br />
response;<br />
�Innovative knowledge-based systems <strong>for</strong><br />
browsing <strong>and</strong> analysis in distributed<br />
environments;<br />
�3D visualization of scenes <strong>and</strong> situations<br />
(including indoor) on different mobile front-ends;<br />
�Analysis of emergency management needs <strong>for</strong><br />
production <strong>and</strong> updating of spatial in<strong>for</strong>mation.<br />
137
Activities of the <strong>ISPRS</strong> WG VIII/1 - <strong>Disaster</strong><br />
<strong>Management</strong><br />
This working group was <strong>for</strong>med to investigate, from<br />
a scientific <strong>and</strong> technical point of view, the role of<br />
remote sensing in managing the consequences of<br />
natural <strong>and</strong> man-made disasters <strong>and</strong> aims at<br />
in<strong>for</strong>ming <strong>and</strong> activating people involved in disaster<br />
monitoring, mitigation <strong>and</strong> damage assessment from<br />
both from public institutions <strong>and</strong> private companies.<br />
The main goals are:<br />
1. The development of appropriate tools <strong>and</strong><br />
methodologies <strong>for</strong> disaster management using<br />
remote sensing connected to GIS technologies;<br />
2. In collaboration with Commission I, define an<br />
integrated system of observation comprising<br />
space, aerial, <strong>and</strong> in-situ measurements <strong>for</strong><br />
disaster early warning, monitoring, damage<br />
assessment, <strong>and</strong> mitigation;<br />
3. To enhance the cooperation with various partners<br />
such as CEOS, the International Global Observing<br />
Strategy (IGOS), UN Agencies <strong>and</strong> all<br />
Private/Institutional Organizations involved in<br />
the <strong>Disaster</strong> <strong>Management</strong> cycle..<br />
The focus is on: generation of vulnerability <strong>and</strong><br />
hazard zone maps <strong>for</strong> different types of disasters,<br />
such as <strong>for</strong>est fires, cyclones, floods, drought,<br />
volcano eruptions, earthquakes, l<strong>and</strong>slides etc.;<br />
identification <strong>and</strong> assessment of potential risk zones;<br />
integration of remotely sensed observations <strong>and</strong><br />
communication strategies with enhanced predictive<br />
modeling capabilities <strong>for</strong> disaster detection, early<br />
warning, monitoring, <strong>and</strong> damage assessment;<br />
138<br />
development of disaster management plans <strong>for</strong> pre-,<br />
during <strong>and</strong> post-disaster situations <strong>and</strong> enhanced<br />
support <strong>for</strong> early warning systems, emergency<br />
events mitigation <strong>and</strong> decision making; collaborating<br />
with International Associations when appropriate.<br />
This emergency represents a milestone <strong>for</strong> the whole<br />
scientific community, individual volunteer groups, as<br />
well as the key players in the major satellite<br />
providers <strong>and</strong> internet geo-providers (Google <strong>and</strong><br />
Microsoft) who have contributed an enormous<br />
amount <strong>and</strong> variety of data towards this emergency<br />
response. Now, it is time to develop solutions <strong>for</strong><br />
effective processing, analysis <strong>and</strong> application of the<br />
spatial data, taking into account the lesson learnt<br />
from the latest experiences.<br />
Currently, tremendous ef<strong>for</strong>ts are being<br />
made by the international community to<br />
respond to <strong>and</strong> assist people affected<br />
by the earthquake in Haiti.<br />
Figure 4-5:<br />
Above: Port-au-Prince affected areas<br />
Left: Port-au-Prince road damage<br />
assessment map
JBGIS Members <strong>and</strong> Sponsors<br />
139
WFP'S EMERGENCY PREPAREDNESS AND RESPONSE BRANCH.<br />
Emergency Preparedness is a key policy <strong>for</strong> the World Food Programme the<br />
world's largest humanitarian agency. Investing in disaster preparedness <strong>and</strong><br />
mitigation measures is the second of WFP's five strategic objectives - the core of<br />
its vision <strong>and</strong> operation.<br />
Preparedness means having the in<strong>for</strong>mation, technology, planning <strong>and</strong> thinking<br />
in place to anticipate an emergency so as to respond to it more rapidly <strong>and</strong><br />
efficiently. It means monitoring man-made <strong>and</strong> natural hazards closely,<br />
analyzing this in<strong>for</strong>mation carefully <strong>and</strong><br />
methodically <strong>and</strong> making it easily accessible to key decision makers <strong>and</strong> the<br />
wider staff of WFP. It means using the newest <strong>and</strong> most innovative technologies<br />
to make WFP's work faster, leaner <strong>and</strong> smarter.<br />
EARLY WARNING<br />
The Early Warning team at the Emergency Preparedness <strong>and</strong> Response Branch<br />
provides a comprehensive monitoring service - watching droughts, floods,<br />
tropical storms, volcanic activity, earthquakes - alongside the social <strong>and</strong><br />
economic hazards which can turn a crisis into an emergency. Its analytical<br />
expertise allows WFP to react when it can see a disaster in the making.<br />
The team combs the international media <strong>and</strong> uses both internal <strong>and</strong> external<br />
humanitarian sources to provide <strong>for</strong>ecasts, warnings <strong>and</strong> alerts - both to WFP<br />
staff <strong>and</strong> to those of other agencies. It produces daily news headlines <strong>and</strong> early<br />
warning developments, provides key dates on a weekly <strong>and</strong> three-monthly basis<br />
<strong>and</strong> produces WFP's contribution to the Early Warning Early Action Report. This<br />
is a key inter-agency resource - every quarter it is presented to key UN<br />
humanitarian agencies at the Inter-Agency Sub-Committee, which the Chief of<br />
Emergency Preparedness <strong>and</strong> Response Branch co-chairs.<br />
The Emergency Preparedness <strong>and</strong> Response Branch is now in the process of<br />
further extending its social <strong>and</strong> economic early warning capacity. It has brought<br />
on board important technical, academic <strong>and</strong> commercial partners <strong>and</strong> is leading<br />
the development of a web-based system to better gather <strong>and</strong> manage<br />
in<strong>for</strong>mation, as well as to mine data. New areas - such as social networking - are<br />
being explored to ensure that the warning signs which can save lives are picked<br />
up. These new tools are vital when our changing climate is provoking more<br />
competition <strong>for</strong> natural resources.<br />
140<br />
INFORMATION MANAGEMENT<br />
World Food Programme<br />
Fighting Hunger Worldwide<br />
Today's world is abuzz with in<strong>for</strong>mation - it's hard to easily <strong>and</strong> efficiently access<br />
what is most important <strong>and</strong> useful. Alongside its Early Warning in<strong>for</strong>mation<br />
service, the Emergency Preparedness <strong>and</strong> Response Branch manages WFP's<br />
large resource of geographical <strong>and</strong> geo-spatial in<strong>for</strong>mation. It is working to bring<br />
it all together, in one place to promote easy access <strong>and</strong> to avoid duplication.<br />
EPweb - the dedicated Emergency Preparedness website complements this<br />
mission. Constantly updated <strong>and</strong> exp<strong>and</strong>ed, EPweb now holds nearly 3,000<br />
maps, in<strong>for</strong>mation on food prices, on where WFP's offices <strong>and</strong> stocks are<br />
worldwide, alongside in-depth in<strong>for</strong>mation about individual countries <strong>and</strong> areas<br />
of concern. EPweb allows decision-makers <strong>and</strong> field staff straight<strong>for</strong>ward <strong>and</strong><br />
rapid access to in<strong>for</strong>mation - helping them to mitigate the effects of an<br />
emergency. When a disaster such as an earthquake or hurricane strikes special<br />
Crisis pages are immediately activated to help speed up <strong>and</strong> streamline WFP's<br />
response, with in<strong>for</strong>mation gathered together <strong>for</strong> easy access in one place.
IMPORTANT EXTERNAL PARTNERSHIPS<br />
The partnerships which the Emergency Preparedness <strong>and</strong> Response Branch has<br />
<strong>for</strong>med are impressive. It is co-operating with leading academic institutions -<br />
such as Columbia University in the United States - <strong>and</strong> with several national<br />
space agencies. The Emergency Preparedness <strong>and</strong> Response Branch's<br />
relationship with ITHACA (International Technology <strong>for</strong> Humanitarian<br />
Assistance Cooperation <strong>and</strong> Action) a specialist research institute at Italy's<br />
prestigious Politecnico of Turin is especially vibrant. The closeness of this<br />
relationship allows WFP's Emergency Preparedness <strong>and</strong> Response Branch to<br />
deliver satellite imagery of an area hit by a natural disaster to field staff <strong>and</strong> key<br />
decision-makers within 24 to 48 hours. Additional in<strong>for</strong>mation is then mapped<br />
on to show clearly on one page how many people may be affected <strong>and</strong> where<br />
they are. Known as Rapid Impact Analysis, this type of analytical mapping is<br />
invaluable in helping WFP know where help is most needed.<br />
TECHNOLOGY AND PREPAREDNESS<br />
WFP is further building on this <strong>and</strong> other technological partnerships. With<br />
ITHACA <strong>and</strong> the Dartmouth Flood Observatory in the United States,<br />
sophisticated flood modelling <strong>and</strong> <strong>for</strong>ecasting is being developed. Two decades<br />
of historical data are combined with new in<strong>for</strong>mation on rainfall from remote<br />
sensors, so as to predict what may happen next. As we adapt to the more severe<br />
weather patterns brought on by climate change - <strong>and</strong> to the additional stresses<br />
brought by rapid urbanisation - we're working with our partners to better<br />
<strong>for</strong>ecast drought <strong>and</strong> to tailor our work more accurately in the world's growing<br />
cities.<br />
HAZARD MAPPING<br />
In the first hours <strong>and</strong> days of any emergency, <strong>for</strong> WFP having the right<br />
in<strong>for</strong>mation is critical. But, <strong>for</strong>ewarned is <strong>for</strong>earmed - if there's a picture of what<br />
has happened in the past <strong>and</strong> who are the people affected, it is even better. So<br />
the Emergency Preparedness <strong>and</strong> Response Branch is pushing the frontiers of<br />
mapping natural hazards to produce better preparedness planning. In areas<br />
most at risk of severe weather, it is integrating huge amounts of data onto multilayered<br />
maps to produce a single page image of a potential emergency. For<br />
cyclone-prone Madagascar, slopes, watersheds <strong>and</strong> areas of de<strong>for</strong>estation were<br />
mapped together with population density in<strong>for</strong>mation, <strong>for</strong> a picture of where<br />
help will most be needed. For Haiti, which suffers hurricanes more frequently<br />
than it does earthquakes, food insecurity has been added to the process. In Niger<br />
<strong>and</strong> Afghanistan, livelihoods vulnerable to flooding were mapped. This level of<br />
preparedness lets WFP know where it may have to go to help people, <strong>and</strong><br />
importantly, where it may not have to. It makes our response faster <strong>and</strong> lets us<br />
use our resources sensibly <strong>and</strong> efficiently.<br />
PLANNING AHEAD FOR A POSSIBLE GLOBAL CRISIS<br />
If we use all our preparedness skills <strong>and</strong> resources wisely, we can prepare <strong>for</strong><br />
<strong>and</strong> mitigate crises which in the past have hit the world much harder. In 2009, an<br />
influenza p<strong>and</strong>emic was declared the first <strong>for</strong> over 40 years. But WFP's<br />
P<strong>and</strong>emic Response Unit (within the Emergency Preparedness <strong>and</strong> Response<br />
Branch) had already been thinking ahead. It has built up valuable experience<br />
which can now be transferred <strong>for</strong> use in other situations. Staff have been trained<br />
in how to stay safe, medical supplies have been pre-positioned, p<strong>and</strong>emic<br />
preparedness plans have been tested on the ground <strong>and</strong> specialised computer<br />
simulators have been developed. This shouldensure that WFP can continue with<br />
its job of feeding hungry people.<br />
141
A Foundation <strong>for</strong> the Advancement of Society<br />
The Compagnia di San Paolo is one of the largest private foundations in Europe. It<br />
was founded in 1563 as a private brotherhood <strong>and</strong> later evolved into a banking<br />
institute <strong>and</strong> charitable institution. The new charter was adopted in March 2000.<br />
The Foundation is actively involved in civil society <strong>and</strong> pursues aims of public<br />
interest <strong>and</strong> social use, in order to foster the civil, cultural <strong>and</strong> economic<br />
development of the community in which it operates.<br />
These institutional activities are funded with the earnings on the financial assets<br />
accumulated over the centuries, that the Compagnia is committed to preserve <strong>for</strong><br />
the generations to come.<br />
The Compagnia di San Paolo is actively engaged in the following sectors: scientific,<br />
economic <strong>and</strong> legal research; education; art; conservation <strong>and</strong> promotion of the<br />
cultural heritage; cultural activities <strong>and</strong> the per<strong>for</strong>ming arts; health; assistance to<br />
socially deprived categories.<br />
The Compagnia pursues its objectives according to annual <strong>and</strong> multi-annual plans,<br />
by awarding grants to public <strong>and</strong> non-profit entities <strong>and</strong> through direct<br />
involvement in programmes <strong>and</strong> the participation of specialised “operational<br />
bodies” created <strong>and</strong> supported by the Compagnia, also in cooperation with other<br />
institutions, in relevant fields of interest.<br />
The Compagnia is a member of the European Foundation Centre in Brussels <strong>and</strong> of<br />
ACRI the Italian Association of Foundations of Banking Origin.<br />
142
144