Annual Report 2012

Create successful ePaper yourself
Turn your PDF publications into a flip-book with our unique Google optimized e-Paper software.
Growing Opportunity / <strong>2012</strong> <strong>Annual</strong> <strong>Report</strong>
ii 01 02 03 04 05<br />
Abolition of the Canadian Wheat Board monopoly in<br />
western Canada creates opportunity in commercial<br />
and large farm consolidation and infrastructure.<br />
Winnipeg, Canada<br />
Corn production in the USA may exceed 14 billion<br />
bushels in 2013 as US farmers are expected to<br />
seed 97 million acres of corn in 2013.<br />
South America may grow more corn and soybeans than the<br />
United States for the first time in 2013.
07 08 09 10 11<br />
iii<br />
<strong>2012</strong> ANNUAL REPORT<br />
Approximately 24 million hectares of cropland has<br />
been abandoned in Russia since 1991. Once returned<br />
to full production, this cropland has the potential to<br />
generate 42 million tonnes of output.<br />
Chinese born in 2009 will consume 38 times more than<br />
those born in 1960. Indians born in 2009 will consume<br />
13 times more than those born in 1960.<br />
The amount of grain lost in sub-Saharan Africa<br />
each year has the potential to feed over 48<br />
million people.<br />
The global population is expected to grow to 9 billion by 2050.
iv 01 02 03 04 05<br />
CEO MESSAGE<br />
01
07 08 09 10 11<br />
01<br />
<strong>2012</strong> ANNUAL REPORT<br />
Sales Drivers<br />
USA Corn Production<br />
Compared to Prior Year<br />
CEO MESSAGE<br />
40%<br />
30%<br />
20%<br />
10%<br />
Production yield<br />
Duration of Harvest<br />
0%<br />
-10%<br />
-20%<br />
2010 2011 <strong>2012</strong> 2013<br />
Forecast<br />
per USDA<br />
On behalf of our Board of Directors and the entire team at AGI we are<br />
pleased to present our <strong>2012</strong> <strong>Annual</strong> <strong>Report</strong>. We look back at <strong>2012</strong> as a tale<br />
of two halves. A strong first half based on the optimism of a huge corn crop<br />
in the USA, and a disappointing second half based on the most severe<br />
drought the USA has experienced in nearly 60 years. However, <strong>2012</strong> was<br />
also a year of continuing operational improvement, including considerable<br />
gains on the R&D front and inspiring performance in offshore, new market<br />
development. We will give Mother Nature her due, but we will also<br />
acknowledge the considerable progress being made on other fronts.<br />
Such is the beauty of agriculture. The memories of a<br />
tough year are soon replaced with the optimism of a<br />
better year ahead.<br />
<strong>2012</strong> saw record sales in both Canadian and offshore markets. However,<br />
with 60% of our current business driven off USA crop production there<br />
was no escaping the drought. Indeed, over the past few years we have<br />
seen average corn yields in the US drop approximately 25%. Last summer’s<br />
heat wave matured the crop quickly and dried it in the field, and with grain<br />
prices at record highs much of the crop went straight to market without<br />
ever seeing the farm gate. It is hard to think of a less perfect scenario for<br />
our business. Our primary demand drivers are crop production volume and<br />
yield which are impacted by conditions during harvest. Grain prices are<br />
less significant and usually run counter to the volume driver. High grain<br />
prices do however keep farmers’ balance sheets strong and incentivize<br />
them to plant heavily in the following year, using optimal inputs. As we<br />
enter 2013, planting intentions for corn appear to be at record levels.<br />
Based on probabilities, we should have more normal growing and harvest<br />
seasons. With a huge crop, corn prices should fall considerably, resulting<br />
in a return to more typical levels of on-farm storage. Such is the beauty<br />
of agriculture. The memories of a tough year are soon replaced with the<br />
optimism of a better year ahead.
02 01 02 03 04 05<br />
CEO MESSAGE<br />
$60M<br />
EBITDA<br />
Adjusted EBITDA<br />
Edwards/ Twister<br />
Mepu<br />
$35M<br />
Wheatheart<br />
$50M<br />
$30M<br />
Batco<br />
Airlanco<br />
$25M<br />
$40M<br />
$30M<br />
$20M<br />
$15M<br />
$10M<br />
$5M<br />
Applegate<br />
Westfield<br />
Tramco<br />
2009 <strong>2012</strong><br />
Estimated <strong>2012</strong><br />
Drought Effect<br />
EBITDA related to FX<br />
rate higher than par<br />
$0<br />
1st Half<br />
2nd Half<br />
2011 <strong>2012</strong> Estimated <strong>2012</strong><br />
Drought Effect<br />
Portable Handling<br />
Permanent Handling<br />
Storage & Conditioning<br />
Other<br />
Union Iron<br />
Hi Roller<br />
We estimate that the <strong>2012</strong> USA drought<br />
impacted EBITDA by approximately $10-$12m<br />
this past year and will negatively impact results<br />
in the first half of 2013. As devastating as it was,<br />
the drought was at least moderated by recent<br />
strategic initiatives. The graph above compares<br />
how things would have looked had the drought<br />
hit 3 years earlier. The illustration underscores<br />
the value of the ventures funded by our 2009<br />
convertible debenture. Catalogue expansion and<br />
related new market developments have clearly<br />
made a difference to the size and diversity of our<br />
business. That said, the drought also highlights<br />
our need to further diversify our geography in<br />
order to achieve greater balance.<br />
In early <strong>2012</strong>, our Board approved a new<br />
organizational structure that grouped our<br />
10 operating divisions into 3 business lines,<br />
complete with operational Vice Presidents. This<br />
gives us better focus on collective challenges<br />
and opportunities. Paul Franzmann has assumed<br />
the role of Senior Vice President, Operations<br />
blending strategic and operational leadership.<br />
Our remaining core structure was augmented<br />
with the addition of a Vice President, Strategic<br />
Planning & Development and a Vice President,<br />
Marketing. In the past we have had bursts<br />
of rapid M&A activity followed by prolonged<br />
periods of digestion. We now have a team in<br />
place that gives us both the ability to achieve<br />
our short and medium term organic growth<br />
objectives, as well as the capacity to execute<br />
future strategic acquisitions. This structure<br />
also provides the depth needed for internal<br />
succession planning.<br />
Early in the development of our company we<br />
relied heavily on R&D for organic growth.<br />
However, with 9 acquisitions post IPO we have<br />
had considerable focus on integration and<br />
operational improvements, often redirecting<br />
engineering resources to the shop floor. <strong>2012</strong><br />
saw the revitalization of the R&D function,<br />
restoring its market driven focus. We have<br />
a number of product line extension projects
07 08 09 10 11<br />
03<br />
<strong>2012</strong> ANNUAL REPORT<br />
currently underway, including high capacity<br />
modular dryers at Mepu, 105’ diameter<br />
storage bins at Nobleford and larger/faster<br />
augers at Westfield. We are also entering<br />
new market space with projects such as the<br />
on-farm seed treater in partnership with<br />
Bayer Crop Science.<br />
<strong>2012</strong> also marked the retirement of Art<br />
Stenson, founder of our original division, Batco<br />
Manufacturing, and co-founder of AGI.<br />
Art demonstrated a keen talent as an<br />
innovator. His designs allowed us to grow a<br />
start-up company into a market leader in only<br />
a few short years. Art’s fierce ownership of<br />
customer satisfaction expressed the essence<br />
of entrepreneurship. It is a quality that became<br />
firmly embedded into the core of AGI’s culture.<br />
We are very grateful for Art’s many contributions<br />
to the development of our company and wish<br />
him well in his retirement years; he has certainly<br />
earned it.<br />
Batco remains one of our top performing<br />
divisions, with lots of growth potential still<br />
ahead. We are extremely fortunate to have<br />
Doug Weinbender taper his focus from that of an<br />
operational Vice President at AGI, into the leader<br />
of Batco and its future development. In the fall of<br />
2013 we will move production into a much larger<br />
manufacturing facility in Swift Current, gaining<br />
considerable capacity and accommodating<br />
the installation of a new powder coat paint<br />
line. Doug’s leadership will provide us with a<br />
great opportunity to take Batco to a new level in<br />
the marketplace.
04 01 02 03 04 05<br />
CEO MESSAGE<br />
Active Quotes by<br />
Business Line<br />
$50M<br />
International Sales<br />
<strong>2012</strong> Sales by Geography<br />
Australia / New Zealand 9%<br />
RUK 36%<br />
$40M<br />
$30M<br />
$20M<br />
53%<br />
24%<br />
23%<br />
Latin America 5%<br />
Rest of World 5%<br />
International United States Canada<br />
Middle East / Africa 7%<br />
Central & Western<br />
Europe 36%<br />
Storage & Conditioning<br />
Portable Handling<br />
Permanent Handling<br />
Other<br />
$10M<br />
$0M<br />
2011 <strong>2012</strong><br />
Repeat Business<br />
Note: Offshore<br />
sales originating<br />
from Winnipeg<br />
Sales Team<br />
Our ongoing focus and commitment to<br />
developing a global footprint gained momentum<br />
in <strong>2012</strong>. In particular the combined region of<br />
Russia, Ukraine and Kazakhstan (RUK) has<br />
demonstrated notable traction. We are most<br />
encouraged by the level of repeat business our<br />
team is achieving abroad. While AGI has many<br />
dedicated teams doing great work on a number<br />
of fronts, the enthusiasm, commitment and<br />
results from the International Team are simply<br />
outstanding. In fact, our progress in RUK is such<br />
that we have already outgrown Mepu’s capacity<br />
for market support. In turn, we will refocus<br />
their efforts on Central and Western European<br />
countries, better related to its small farm<br />
catalogue. Concurrently, we are expanding our<br />
sales and support office in Riga, Latvia for the<br />
larger corporate farm sector. The graph above<br />
demonstrates our progress to date in a very<br />
competitive environment.<br />
In the first full year of operating our new bin<br />
manufacturing plant we have validated our<br />
investment thesis. While the bin business on<br />
its own offers only limited margins, particularly<br />
as a small player, it has indeed acted as a<br />
catalyst for new market development. In<br />
emerging markets, nearly 80% of our bin sales<br />
are bundled with higher margined catalogue<br />
items. Our next challenge will be to level load<br />
production sufficiently to optimize capacity and<br />
manufacturing efficiencies. North American<br />
business is typically arranged with this strategy<br />
in mind. Today the process of qualifying new<br />
offshore customers and working through the<br />
details of their requirements is often lengthy and<br />
subject to change. We expect it will improve as<br />
emerging markets mature over time.<br />
As we enter 2013 we are anxious to return<br />
to the optimism that global fundamentals<br />
support. Although our worst showing on a<br />
four-quarter rolling basis will be as of June 30,<br />
2013, if early indications hold true we should be<br />
in for a much more enjoyable second half. Last<br />
August we made it clear to everyone that our<br />
intentions were to ride out the effects of the<br />
drought without changing our dividend policy.<br />
Our resolve was based on the knowledge that<br />
we can cycle out of the drought and return to a<br />
more reasonable payout ratio.
07 08 09 10 11<br />
05<br />
<strong>2012</strong> ANNUAL REPORT<br />
Our ongoing focus and<br />
commitment to developing<br />
a global footprint gained<br />
momentum in <strong>2012</strong>.<br />
Before closing, I would like to take a moment to<br />
pay our respects to John Brodie, who passed<br />
away unexpectedly on February 24, 2013. John<br />
served as Audit Chair and Director of AGI since<br />
our IPO in May 2004. His steady hand was<br />
evident, providing great strength and guidance<br />
to Rob, Steve and me throughout the challenges<br />
we have faced over the past nine years. He was<br />
held in very high esteem with his fellow directors<br />
on both a professional and personal basis.<br />
We extend our sincere condolences to his<br />
family. He will be greatly missed.<br />
I would like to thank all of our shareholders<br />
for their continued support. We are confident<br />
in our ability to grow the business. AGI’s<br />
franchise is intact. We have some of the top<br />
grain handling brands in our industry, supported<br />
by specialized plants with dominant market<br />
positions. We are offering complete solutions<br />
to customers in emerging markets, leveraging<br />
the handling equipment as the differentiator.<br />
Our geographic footprint is growing, providing<br />
increased diversification. We also have a proven<br />
platform for growth through acquisitions. All of<br />
these elements are directed at a sector with<br />
compelling global fundamentals.<br />
Sincerely,<br />
Gary Anderson<br />
President & CEO
06<br />
01 02 03 04 05<br />
management’s discussion & analysis<br />
02
07 08 09 10 11<br />
07<br />
<strong>2012</strong> ANNUAL REPORT<br />
Management’s Discussion & Analysis<br />
This Management’s Discussion and Analysis (“MD&A”) should be read<br />
in conjunction with the audited consolidated financial statements and<br />
accompanying notes of Ag Growth International Inc. (“Ag Growth”, the<br />
“Company”, “we”, “our” or “us”) for the year ended December 31, <strong>2012</strong>.<br />
Results are reported in Canadian dollars unless otherwise stated.<br />
The financial information contained in this MD&A has been prepared<br />
in accordance with International Financial <strong>Report</strong>ing Standards (“IFRS”).<br />
All dollar amounts are expressed in Canadian currency, unless<br />
otherwise noted.<br />
Throughout this MD&A references are made to “trade sales”, “EBITDA”,<br />
“adjusted EBITDA”, “gross margin”, “funds from operations” and “payout<br />
ratio”. A description of these measures and their limitations are discussed<br />
under “Non-IFRS Measures”.<br />
This MD&A contains forward-looking statements. Please refer to the<br />
cautionary language under the heading “Risks and Uncertainties” and<br />
“Forward-Looking Statements” in this MD&A and in our most recently filed<br />
<strong>Annual</strong> Information Form.<br />
SUMMARY OF RESULTS<br />
A brief summary of our operating results can be found below. A more<br />
detailed narrative is included later in this MD&A under “Explanation of<br />
Operating Results”.<br />
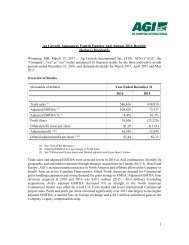
(thousands of dollars) Year Ended December 31<br />
<strong>2012</strong> 2011<br />
Trade sales (1) $314,616 $301,014<br />
Adjusted EBITDA (1) $49,492 $53,274<br />
Net Profit before Mepu goodwill impairment $19,078 $24,523<br />
Net Profit $17,188 $24,523<br />
Diluted profit per share before Mepu<br />
impairment $1.53 $1.95<br />
Diluted profit per share $1.37 $1.95<br />
(1)<br />
See “non-IFRS Measures”.<br />
Ag Growth entered <strong>2012</strong> with enthusiasm as farmers in the U.S. were poised<br />
to plant a record number of corn acres, conditions in western Canada were<br />
expected to return to normal after two abnormally wet planting seasons<br />
and internationally the Company looked forward to building on its recent<br />
success and growing its relationships and market presence.<br />
The first half of <strong>2012</strong> progressed roughly as anticipated and trade sales and<br />
adjusted EBITDA for the six months ended June 30, <strong>2012</strong> increased 13%<br />
and 8% over the prior year, respectively. As the second quarter came to a<br />
close, the Company appeared poised for an exceptional second half as U.S.<br />
farmers had planted a record number of corn acres, conditions in Canada<br />
were excellent and the Company’s international sales backlog significantly<br />
exceeded the prior year.
08<br />
01 02 03 04 05<br />
management’s discussion & analysis<br />
However, as the drought signs that first appeared late in June <strong>2012</strong> became<br />
more firmly entrenched and the extent of the drought became more<br />
apparent, demand for grain handling equipment, particularly higher margin<br />
portable equipment, decreased substantially. The U.S. drought of <strong>2012</strong> is<br />
widely considered to be one of the most severe on record, encompassing<br />
most major grain growing areas of the U.S. and materially reducing crop<br />
production and yield per acre:<br />
<strong>2012</strong> 2011 Change<br />
Projected U.S. corn<br />
production, bushels (1) 10.8 billion 12.4 billion (13%)<br />
Corn yield, bushels (1) 123 per acre 147 per acre (16%)<br />
(1)<br />
Per United States Department of Agriculture Crop Production <strong>2012</strong> Summary report.<br />
Ag Growth’s adjusted EBITDA in the first half of <strong>2012</strong> reflected strong<br />
preseason activity and prior to the appearance of the drought the Company<br />
anticipated very strong in-season sales in the third and fourth quarters.<br />
The impact of the drought on the second half of <strong>2012</strong> is illustrated in the<br />
table below:<br />
(thousands of dollars) 1 st Half 2 nd Half<br />
Adjusted EBITDA – <strong>2012</strong> 32,226 17,266<br />
Adjusted EBITDA – 2011 29,865 23,409<br />
Increase (decrease) 2,361 (6,143)<br />
Trade Sales (see non-IFRS Measures)<br />
The Company achieved record sales in both Canada and internationally in<br />
<strong>2012</strong>. As a result, despite the severity of the U.S. drought, trade sales in the<br />
year ended December 31, <strong>2012</strong> increased $13.6 million or 5% compared to<br />
2011. The largest single driver of sales growth in <strong>2012</strong> was a substantial<br />
increase in international business, particularly in the countries of the former<br />
Soviet Union (the “FSU”). Also contributing was robust demand in western<br />
Canada and the acquisition of Airlanco. The Company’s significant growth<br />
in offshore business and the impact of the <strong>2012</strong> U.S. drought are reflected in<br />
our regional sales breakdown:<br />
(thousands of dollars) Year Ended December 31<br />
<strong>2012</strong> 2011 Change % Change<br />
Canada $76,223 $ 63,746 $12,477 20%<br />
US 166,457 182,727 (16,270) (9%)<br />
Overseas 71,936 54,541 17,395 32%<br />
Total $314,616 $301,014 $13,602 5%<br />
Gross Margin (see non-IFRS Measures)<br />
The Company’s gross margin percentage for the year ended December 31,<br />
<strong>2012</strong> was 32.2% (2011 – 34.0%). The decrease in gross margin percentage<br />
compared to the prior year was largely the result of sales mix as the U.S.<br />
drought most significantly impacted sales and throughput at the Company’s<br />
higher margin portable grain handling equipment divisions. Ag Growth’s<br />
international sales, comprised primarily of storage and commercial grain<br />
handling products, achieve gross margins similar to those in North America.<br />
Ag Growth will often provide complete grain storage and handling systems<br />
when selling internationally and these projects may include equipment<br />
not currently manufactured by the Company. Ag Growth outsources this<br />
equipment and resells it to the customer at a low gross margin percentage.<br />
Excluding these goods purchased for resale, the Company’s gross margin in<br />
<strong>2012</strong> was 33.0% (2011 – 34.0%).
07 08 09 10 11<br />
09<br />
<strong>2012</strong> ANNUAL REPORT<br />
Adjusted EBITDA (see non-IFRS Measures)<br />
Adjusted EBITDA in <strong>2012</strong> was $49.5 million (2011 - $53.3 million). Adjusted<br />
EBITDA decreased compared to the prior year as drought in the U.S.<br />
materially impacted demand, particularly for higher margin portable grain<br />
handling equipment. Adjusted EBITDA in <strong>2012</strong> benefitted from strong<br />
demand in western Canada and significant international growth that<br />
resulted from increased penetration in the FSU and elsewhere.<br />
Mepu Goodwill Impairment<br />
In the quarter-ended December 31, <strong>2012</strong> Ag Growth recorded a non-cash<br />
goodwill impairment charge of $1.9 million related to its Finland-based<br />
Mepu division. Mepu’s results in 2011 were negatively impacted by<br />
regional weather conditions and in <strong>2012</strong> the division experienced margin<br />
compression due largely to the impact of new product development. Mepu<br />
reported negative EBITDA in 2011 and <strong>2012</strong> of $0.8 million and $0.9 million,<br />
respectively. Under IFRS an impairment test is performed at least annually<br />
that compares the fair value of an asset to its carrying value and based on<br />
this test as at December 31, <strong>2012</strong> management concluded the fair value<br />
of Mepu was less than its carrying value. While reducing reported results<br />
under IFRS, the non-cash impairment charge will not impact the Company’s<br />
business operations, cash position, cash flows from operating activities or<br />
dividend policy.<br />
Diluted profit per share<br />
Diluted profit per share decreased from $1.95 in 2011 to $1.37 in <strong>2012</strong> due<br />
largely to the negative impact of the U.S. drought. In addition, a non-cash<br />
goodwill impairment charge related to the Finland-based Mepu division<br />
and a smaller gain on foreign exchange in the current year negatively<br />
impacted profit per share by approximately $0.16 and $0.22 respectively<br />
as compared to 2011.<br />
CORPORATE OVERVIEW<br />
We are a manufacturer of agricultural equipment with a focus on grain<br />
handling, storage and conditioning products. Our products service most<br />
agricultural markets including the individual farmer, corporate farms and<br />
commercial operations. Our business is affected by regional and global<br />
trends in grain volumes, on-farm and commercial grain storage and<br />
handling practices, and crop prices. Our business is seasonal, with higher<br />
sales occurring in the second and third calendar quarters compared with<br />
the first and fourth quarters. We manufacture in Canada, the U.S. and<br />
Europe and we sell products globally, with most of our sales in the U.S.<br />
Our business is sensitive to fluctuations in the value of the Canadian and<br />
U.S. dollars as a result of our exports from Canada to the U.S. and as a<br />
result of earnings derived from our U.S. based divisions. Fluctuations in<br />
currency impact our results even though we engage in currency hedging<br />
with the objective of partially mitigating our exposure to these fluctuations.<br />
The Company’s average rate of foreign exchange per USD $1.00 in <strong>2012</strong> was<br />
CAD $1.00 (2011 - $0.97).<br />
Our business is also sensitive to fluctuations in input costs, especially steel,<br />
a principal raw material in our products, which represents approximately<br />
26% of the Company’s production costs. Short-term fluctuations in the<br />
price of steel impact our financial results even though we strive to partially<br />
mitigate our exposure to such fluctuations through the use of long-term<br />
purchase contracts, bidding commercial projects based on current input<br />
costs and passing input costs on to customers through sales<br />
price increases.<br />
Acquisitions in Fiscal 2011<br />
Airlanco - On October 4, 2011, the Company acquired the operating assets<br />
of Airlanco, a manufacturer of aeration products and filtration systems<br />
that are sold primarily into the commercial grain handling and processing<br />
sectors. The purchase price of $11.5 million was financed primarily from
10<br />
01 02 03 04 05<br />
management’s discussion & analysis<br />
Ag Growth’s acquisition line of credit while costs related to the acquisition<br />
of $0.2 million and a working capital adjustment of $0.4 million were<br />
financed by cash on hand. The purchase price represents a valuation of<br />
approximately five times Airlanco’s normalized fiscal 2010 EBITDA. Airlanco<br />
is located in Falls City, Nebraska and has traditionally served customers<br />
headquartered or located in North America. The company had sales of<br />
approximately $9.9 million in <strong>2012</strong>, operating out of an 80,000 square foot<br />
facility with 65 employees.<br />
OUTLOOK<br />
Sales of portable grain handling equipment in the first half of 2013 are<br />
expected to be negatively impacted by the U.S. drought of <strong>2012</strong>. Inventory<br />
at the Company’s dealer network is slightly higher than typical, reducing<br />
their need to replenish inventory levels, while poor <strong>2012</strong> crop production<br />
volumes have reduced U.S. farmer grain handling requirements. The new<br />
crop season is expected to change these demand dynamics, however, as<br />
the market begins to focus on anticipated 2013 crop production volumes.<br />
The USDA, at its 2013 Agricultural Outlook Forum, forecast U.S. farmers<br />
will plant 96.5 million acres of corn in 2013 and harvest an all-time record<br />
14.5 billion bushels. The projected harvest would represent a 35% increase<br />
in crop production, the primary demand driver for the Company’s portable<br />
grain handling equipment. Accordingly, based on current conditions,<br />
management is optimistic with respect to demand for portable grain<br />
handling equipment in the second half of 2013.<br />
The widespread drought in the U.S. impacted demand for commercial grain<br />
handling products. Decreased activity in the second half of <strong>2012</strong> resulted in<br />
lower backlogs entering 2013 which is expected to result in muted sales in<br />
the first half of the year. However, optimism appears to be returning to the<br />
marketplace and the Company’s backlog of commercial business has now<br />
surpassed its backlog at the same time in <strong>2012</strong>. Due to longer lead times<br />
associated with commercial business, new orders will largely be realized<br />
in the second half of the year. Based on improving sentiment and a growing<br />
order book management expects a return to strong sales of commercial<br />
equipment in the second half of 2013.<br />
Ag Growth enjoyed great success offshore in <strong>2012</strong>. In 2013, quoting<br />
activity is at new record highs and the Company’s international back<br />
order is significantly higher than at the same time in <strong>2012</strong>. The Company’s<br />
increasing presence in many offshore markets, particularly the FSU,<br />
positions us well for sustained growth. In 2013 the Company will also<br />
introduce 105 foot diameter storage bins and commercial capacity grain<br />
drying equipment which will further complete Ag Growth’s industry leading<br />
commercial product offering. A significant portion of the Company’s current<br />
international business follows similar seasonal patterns to North America,<br />
with sales highest in the second and third quarters.<br />
On balance, the short-term impact of the U.S. drought is expected to temper<br />
demand for both portable and commercial grain handling equipment<br />
in the United States in the first half of 2013. As a result management<br />
expects adjusted EBITDA in the first half of 2013 to fall below <strong>2012</strong> levels,<br />
particularly due to softness in the first quarter. The year-over-year effect of<br />
the drought in the first half of 2013 is expected to be significant but is not,<br />
however, expected to impact adjusted EBITDA to the degree experienced in<br />
the second half of <strong>2012</strong>. The Company’s payout ratio in the first half of 2013<br />
is expected to increase compared to the prior year however the Company’s<br />
dividend policy will not be altered in response to this short-term<br />
weather event.<br />
Management remains very optimistic with respect to the Company’s<br />
prospects in the second half of 2013 and beyond. We look forward with<br />
enthusiasm to leveraging the strength of our brands, strong North American<br />
market share and rapidly increasing international presence to capitalize on<br />
what we believe are strong long-term agricultural fundamentals.
07 08 09 10 11<br />
11<br />
<strong>2012</strong> ANNUAL REPORT<br />
DETAILED OPERATING RESULTS<br />
(thousands of dollars) Year Ended December 31<br />
<strong>2012</strong> 2011<br />
Trade sales (1) $314,616 $301,014<br />
(Loss) gain on FX (2) (274) 4,918<br />
Sales 314,342 305,932<br />
Cost of inventories 213,360 198,767<br />
Depreciation & amortization 5,839 5,436<br />
Cost of sales 219,199 204,203<br />
General and administrative 51,906 49,392<br />
Transaction costs 0 1,676<br />
Depreciation & amortization 4,171 3,758<br />
Impairment of goodwill 1,890 0<br />
Other operating income (122) (100)<br />
Finance costs 13,058 12,668<br />
Finance expense (income) (773) 159<br />
Profit before income taxes 25,013 34,176<br />
Current income taxes 3,771 3,910<br />
Deferred income taxes 4,054 5,743<br />
Profit for the period $17,188 $24,523<br />
Net profit per share<br />
Basic $1.38 $1.97<br />
Diluted $1.37 $1.95<br />
(1)<br />
See “non-IFRS Measures”.<br />
(2)<br />
Primarily related to gains on foreign exchange contracts.
12<br />
01 02 03 04 05<br />
management’s discussion & analysis<br />
EBITDA RECONCILIATION<br />
Year Ended December 31<br />
(thousands of dollars) <strong>2012</strong> 2011<br />
Profit before income taxes $25,013 $34,176<br />
Impairment of goodwill 1,890 0<br />
Finance costs 13,058 12,668<br />
Depreciation and amortization in cost of sales 5,839 5,436<br />
Depreciation and amortization in G&A expenses 4,171 3,758<br />
EBITDA (1) 49,971 56,038<br />
Transaction costs 0 1,676<br />
Loss (gain) on foreign exchange in sales (2) 274 (4,918)<br />
Loss (gain) on foreign exchange in finance income (785) 276<br />
Loss on ineffective hedge 0 126<br />
Loss on sale of property, plant & equipment 32 76<br />
Adjusted EBITDA (1) $49,492 $53,274<br />
(1)<br />
See “non-IFRS Measures”.<br />
(2)<br />
Primarily related to gains on foreign exchange contracts.
07 08 09 10 11<br />
13<br />
<strong>2012</strong> ANNUAL REPORT<br />
ASSETS AND LIABILITIES<br />
(thousands of dollars) December 31<br />
<strong>2012</strong><br />
December 31<br />
2011<br />
Total assets $370,482 $394,566<br />
Total liabilities $180,786 $192,407<br />
EXPLANATION OF OPERATING RESULTS<br />
Trade sales<br />
(thousands of dollars) Year Ended December 31<br />
<strong>2012</strong> 2011<br />
Trade sales $314,616 $301,014<br />
Trade sales excluding acquisitions (1) $304,675 $298,313<br />
(1)<br />
Excluding the results of Airlanco which was acquired on October 4, 2011.<br />
Canada<br />
• Trade sales of $76.2 million represent a record for Ag Growth and an<br />
increase of 20% over the prior year.<br />
• Sales of portable grain handling equipment increased significantly<br />
due to pent up demand after two consecutive years of lower than<br />
typical planted acreage in western Canada and due to new<br />
product development.<br />
• Sales of larger diameter storage bins and commercial grain handling<br />
equipment increased compared to 2011 as the Company continues to<br />
grow its Canadian commercial business.<br />
United States<br />
• Trade sales, excluding the acquisition of Airlanco, decreased 13%<br />
compared to 2011.<br />
• The most severe drought in over half a century resulted in a 13% drop in<br />
corn production compared to 2011 and significantly reduced demand for<br />
portable grain handling equipment.<br />
• Sales of commercial handling equipment in the U.S. remained strong on<br />
a historical basis however did not match the record levels attained in<br />
2011 due in part to negative market sentiment in the current year related<br />
to the drought.<br />
International<br />
• International trade sales increased 32% over 2011 to a record $71.9<br />
million due to increasing repeat business with existing customers and<br />
a growing brand presence offshore, particularly in the FSU where sales<br />
increased to over $30 million. Sales to the FSU are largely insured by<br />
Export Development Canada.<br />
• The Company’s strategy of bundling higher margin grain handling<br />
equipment with grain storage products has been validated as 78% of<br />
international sales included both storage and handling equipment.<br />
• Sales to customers with which the Company also did business in 2011<br />
or earlier continues to increase. These repeat sales exceeded the total<br />
sales achieved by Ag Growth’s Winnipeg based international team in<br />
fiscal 2011. Management believes this favourable level of repeat business<br />
is an indicator of product quality, commitment to customer service and<br />
the establishment of longer term relationships throughout the globe.
14<br />
01 02 03 04 05<br />
management’s discussion & analysis<br />
Gross Profit and Gross Margin<br />
(thousands of dollars) Year Ended December 31<br />
<strong>2012</strong> 2011<br />
Trade sales $314,616 $301,014<br />
Cost of inventories (1) 213,360 198,767<br />
Gross Margin $101,256 $102,247<br />
Gross Margin (1) (as a % of trade sales) 32.2% 34.0%<br />
Gross Margin (2) , excluding goods<br />
purchased for resale 33.0% 34.0%<br />
(1)<br />
Excludes depreciation and amortization included in cost of sales.<br />
(2)<br />
As per (1) but excluding goods purchased for resale.<br />
See explanation below.<br />
The Company’s gross margin percentage for the year ended December 31,<br />
<strong>2012</strong> was 32.2% (2011 – 34.0%). The decrease in gross margin percentages<br />
compared to the 2011 was largely the result of sales mix as the U.S. drought<br />
most significantly impacted sales and throughput at the Company’s higher<br />
margin portable grain handling equipment.<br />
Ag Growth will often provide complete grain storage and handling systems<br />
when selling internationally and these projects may include equipment<br />
not currently manufactured by the Company. Ag Growth outsources this<br />
equipment and resells it to the customer at a low gross margin percentage.<br />
Excluding these goods purchased for resale, the Company’s gross margin in<br />
<strong>2012</strong> was 33.0% (2011 – 34.0%).<br />
The Company’s Twister greenfield storage bin facility commenced<br />
production in June 2011 and experienced start-up issues and related<br />
gross margin compression that negatively impacted 2011 gross margin<br />
percentages. The start-up issues of 2011 have been resolved and the<br />
Company’s storage products are generating positive margins that are<br />
consistent with management expectations.<br />
General and Administrative Expenses<br />
(thousands of dollars) Year Ended December 31<br />
<strong>2012</strong> 2011<br />
G&A (1) $51,906 $49,392<br />
G&A (as a % of trade sales) 16.5% 16.4%<br />
G&A excluding acquisitions $50,348 $48,861<br />
(1)<br />
Transaction costs of $1.7 million are excluded from 2011.<br />
For the year ended December 31, <strong>2012</strong>, general & administrative expenses<br />
excluding acquisitions increased $1.5 million. The change from 2011 is<br />
largely due to the following:<br />
• Sales & Marketing expenses increased $1.9 million as the Company<br />
continued to invest in its international sales development. The increase is<br />
largely due to salaries and travel for sales and support personnel added<br />
throughout fiscal 2011.<br />
• Commission expenses increased $0.9 million month periods due largely<br />
to sales mix.<br />
• Professional fees decreased $1.2 million largely due to expenses in the<br />
prior year related to the Company’s transition to IFRS.<br />
• Share based compensation expenses decreased $0.9 million as there<br />
were no awards outstanding in <strong>2012</strong> under the share award incentive<br />
plan (”SAIP”) and no expense related to a fiscal <strong>2012</strong> long-term incentive<br />
plan (“LTIP”). A new stock based compensation plan was approved by<br />
shareholders in May <strong>2012</strong>. In January 2013, 260,000 grants were awarded<br />
to senior management to incentivise the achievement of EBITDA targets<br />
and further entrench alignment with shareholders.<br />
• The remaining variance is the result of a number of offsetting factors with<br />
no individual variance larger than $0.5 million.
07 08 09 10 11<br />
15<br />
<strong>2012</strong> ANNUAL REPORT<br />
EBITDA and Adjusted EBITDA<br />
(thousands of dollars) Year Ended December 31<br />
<strong>2012</strong> 2011<br />
EBITDA (1) $49,971 $56,038<br />
Adjusted EBITDA (1) $49,492 $53,274<br />
(1)<br />
See the EBITDA reconciliation table above and “non-IFRS Measures” earlier in<br />
this MD&A.<br />
Adjusted EBITDA in <strong>2012</strong> decreased compared to 2011 largely due to the<br />
impact of the severe drought in the United States. EBITDA decreased more<br />
significantly due to a lower gain on foreign exchange in <strong>2012</strong> compared to<br />
the prior year.<br />
Finance Costs<br />
The Company’s bank indebtedness as at December 31, <strong>2012</strong> was nil<br />
(December 31, 2011 – nil) and its outstanding long-term debt and obligations<br />
under capital leases was $34.9 million (December 31, 2011 - $36.0 million).<br />
Long-term debt at December 31, <strong>2012</strong> is primarily comprised of U.S. $25.0<br />
million aggregate principal amount of non-amortizing secured notes that<br />
bear interest at 6.80% and mature October 29, 2016 and U.S. $10.5 million<br />
of non-amortizing term debt, net of deferred financing costs of $0.4 million.<br />
See “Capital Resources” for a description of the Company’s credit facilities.<br />
Finance costs for the year ended December 31, <strong>2012</strong> were $13.1 million<br />
(2011 - $12.7 million). The increase compared to the prior year is largely due<br />
to the debt financed acquisition of Airlanco in October 2011. At December<br />
31, <strong>2012</strong>, the Company had outstanding $114.9 million aggregate principal<br />
amount of convertible unsecured subordinated debentures (December 31,<br />
2011 - $114.9 million). The Debentures bear interest at an annual rate of<br />
7.0% and mature December 31, 2014. See “Capital Resources”.<br />
In addition to interest on the instruments noted above, finance costs include<br />
non-cash interest related to debenture accretion, the amortization of<br />
deferred finance costs, stand-by fees and other sundry cash interest.<br />
Finance Expense (income)<br />
Finance income is comprised of interest earned on the Company’s cash<br />
balances and gains or losses on translation of the Company’s U.S. dollar<br />
denominated long-term debt.<br />
Depreciation and Amortization<br />
Depreciation of property, plant and equipment and amortization of<br />
intangible assets are categorized on the income statement in accordance<br />
with the function to which the underlying asset is related. Depreciation<br />
increased compared to 2011 largely due to the acquisition of Airlanco and<br />
the inclusion of a full year’s depreciation on the Twister storage bin plant<br />
that was commissioned in June 2011. Total depreciation and amortization is<br />
summarized below:<br />
Depreciation Year Ended December 31<br />
(thousands of dollars) <strong>2012</strong> 2011<br />
Depreciation in cost of sales $5,596 $4,933<br />
Depreciation in G&A 565 485<br />
Total Depreciation $6,161 $5,418<br />
Amortization Year Ended December 31<br />
(thousands of dollars) <strong>2012</strong> 2011<br />
Amortization in cost of sales $243 $503<br />
Amortization in G&A 3,606 3,273<br />
Total Amortization $3,849 $3,776
16<br />
01 02 03 04 05<br />
management’s discussion & analysis<br />
Current income tax expense<br />
For the year ended December 31, <strong>2012</strong>, the Company recorded current tax<br />
expense of $3.8 million (2011 – $3.9 million). Current tax expense relates<br />
primarily to certain subsidiary corporations of Ag Growth, including its U.S.<br />
and U.K. based divisions.<br />
Deferred income tax expense<br />
For the year ended December 31, <strong>2012</strong>, the Company recorded deferred<br />
tax expense of $4.1 million (2011 – $5.7 million). As at December 31,<br />
<strong>2012</strong>, management concluded there was not probable realization of<br />
certain tax losses in its Finnish subsidiary and accordingly reversed $0.2<br />
million previously recorded as a tax asset. Excluding this charge and the<br />
impairment of goodwill taken in the year, the Company’s effective tax rate<br />
for the year ended December 31, <strong>2012</strong> was 28.4%. The remaining deferred<br />
tax expense in <strong>2012</strong> relates to the utilization of deferred tax assets plus<br />
a decrease in deferred tax liabilities that related to the application of<br />
corporate tax rates to reversals of temporary differences between the<br />
accounting and tax treatment of depreciable assets, reserves, deferred<br />
compensation plans and deferred financing fees.<br />
Upon conversion to a corporation from an income trust in June 2009 (the<br />
“Conversion”) the Company received certain tax attributes that may be<br />
used to offset tax otherwise payable in Canada. The Company’s Canadian<br />
taxable income is based on the results of its divisions domiciled in Canada,<br />
including the corporate office, and realized gains on foreign exchange.<br />
For the year ending December 31, <strong>2012</strong>, the Company offset $1.8 million<br />
of Canadian tax otherwise payable (2011 – $4.3 million) through the use<br />
of these attributes and since the date of Conversion a cumulative amount<br />
of $23.1 million has been utilized. Utilization of these tax attributes is<br />
recognized in deferred income tax expense on the Company’s income<br />
statement. The Canada Revenue Agency has requested for its review<br />
information relating to the conversion transaction and the Company has<br />
responded to such requests. The Company is confident in its tax filing<br />
position and the unused tax attributes of $47.5 million are recorded as an<br />
asset on the Company’s balance sheet. See “Risks and Uncertainties –<br />
Income Tax Matters”.<br />
Effective tax rate Year Ended December 31<br />
(thousands of dollars) <strong>2012</strong> 2011<br />
Current tax expense $ 3,771 $3,910<br />
Deferred tax expense 4,054 5,743<br />
Total tax $ 7,825 $9,653<br />
Profit before taxes $25,013 $34,176<br />
Total tax % 31.3% 28.2%<br />
Profit and profit per share<br />
For the year ended December 31, <strong>2012</strong>, the Company reported net profit<br />
of $17.1 million (2011 – $24.5 million), basic net profit per share of $1.38<br />
(2011 – $1.97), and fully diluted net profit per share of $1.37 (2011 – $1.95).<br />
Decreases compared to the prior year were primarily the result of the<br />
impact of the U.S. drought on adjusted EBITDA. A smaller gain on foreign<br />
exchange in the current year negatively impacted EBITDA by $4.0 million<br />
and profit per share by approximately $0.22 per share compared to 2011. In<br />
addition, a $1.9 million non-cash goodwill impairment charge related to the<br />
Finland-based Mepu division and the reversal of $0.2 million of Mepu tax<br />
assets impacted net profit by $2.1 million and profit per share of $0.16 per<br />
share.
07 08 09 10 11<br />
17<br />
<strong>2012</strong> ANNUAL REPORT<br />
Selected <strong>Annual</strong> Information<br />
(thousands of dollars, other than per share data)<br />
Twelve Months Ended December 31<br />
<strong>2012</strong><br />
$<br />
2011<br />
$<br />
2010<br />
Sales 314,616 301,014 262,260<br />
EBITDA 49,971 56,038 66,200<br />
Adjusted EBITDA 49,492 53,274 59,730<br />
Net profit 17,188 24,523 30,761<br />
Profit per share – basic 1.38 1.97 2.43<br />
Profit per share – fully diluted 1.37 1.95 2.40<br />
Funds from operations 32,306 40,319 53,067<br />
Payout ratio 93% 75% 50%<br />
Dividends declared per common<br />
share 2.40 2.40 2.07<br />
Total assets 370,482 394,566 398,385<br />
Total long-term liabilities 153,515 151,986 139,831<br />
The following factors impact comparability between years in the<br />
table above:<br />
• Sales, gain (loss) on foreign exchange, net earnings, and net earnings<br />
per share are significantly impacted by the rate of exchange between the<br />
Canadian and U.S. dollars.<br />
• The inclusion of the assets, liabilities and operating results of the<br />
following acquisitions significantly impacts comparisons in the table<br />
above:<br />
• October 1, 2010 – Franklin<br />
• December 20, 2010 – Tramco<br />
• October 4, 2011 – Airlanco<br />
$<br />
QUARTERLY FINANCIAL INFORMATION<br />
(thousands of dollars, other than per share data)<br />
<strong>2012</strong><br />
Average<br />
USD/CAD<br />
Exchange<br />
Rate Sales Profit (loss)<br />
Basic<br />
Profit (loss)<br />
per Share<br />
Diluted<br />
Profit<br />
(loss) per<br />
Share<br />
Q1 $1.00 $72,355 $5,299 $0.42 $0.42<br />
Q2 $1.01 98,115 8,824 $0.71 $0.70<br />
Q3 $1.00 83,855 6,501 $0.52 $0.52<br />
Q4 $1.00 60,017 (3,436) ($0.28) ($0.27)<br />
Fiscal <strong>2012</strong> $1.00 $314,342 $17,188 $1.38 $1.37<br />
2011<br />
Average<br />
USD/CAD<br />
Exchange<br />
Rate Sales Profit<br />
Basic Profit<br />
per Share<br />
Diluted<br />
Profit per<br />
Share<br />
Q1 $0.99 $67,065 $4,706 $0.38 $0.38<br />
Q2 $0.96 88,111 11,994 $0.97 $0.91<br />
Q3 $0.97 83,341 4,570 $0.37 $0.36<br />
Q4 $0.96 67,415 3,253 $0.26 $0.26<br />
Fiscal 2011 $0.97 $305,932 $24,523 $1.97 $1.95<br />
Interim period sales and profit historically reflect seasonality. The third<br />
quarter is typically the strongest primarily due to the timing of construction<br />
of commercial projects and high in-season demand at the farm level. Due to<br />
the seasonality of Ag Growth’s working capital movements, cash provided<br />
by operations will typically be highest in the fourth quarter. The seasonality<br />
of Ag Growth’s business may be impacted by a number of factors including<br />
weather and the timing and quality of harvest in North America.
18<br />
01 02 03 04 05<br />
management’s discussion & analysis<br />
The following factors impact the comparison between periods in the<br />
table above:<br />
• Sales, gain (loss) on foreign exchange, profit, and profit per share in all<br />
periods are significantly impacted by the rate of exchange between the<br />
Canadian and U.S. dollars.<br />
• Sales, net profit and profit per share are significantly impacted by the<br />
acquisition of Airlanco in October 2011.<br />
• A widespread drought in the U.S. significantly impacted sales and profit<br />
in the third and fourth quarters of <strong>2012</strong>.<br />
FOURTH QUARTER<br />
Trade Sales<br />
Trade sales for the three months ended December 31, <strong>2012</strong> were $59.9<br />
million, an 11% decrease from record fourth quarter sales in 2011. The<br />
decrease in trade sales is largely due to the impact of the U.S. drought<br />
which significantly lowered crop production and also resulted in a very<br />
early harvest, limiting in-season fourth quarter sales. Trade sales in Canada<br />
and internationally both increased compared to the prior year.<br />
(thousands of dollars) Three Months Ended December 31<br />
<strong>2012</strong> 2011 Change % Change<br />
Canada $12,111 $11,444 $667 6%<br />
US 30,357 41,556 (11,199) (27%)<br />
Overseas 17,431 14,039 3,392 24%<br />
Total $59,899 $67,039 ($7,140) (11%)<br />
Gross Margin<br />
Gross margin as a percentage of sales for the three months ended<br />
December 31, <strong>2012</strong> was 29.3%, (2011 – 32.9%). Gross margin percentages<br />
in the fourth quarter of <strong>2012</strong> decreased largely due to sales mix, as the U.S.<br />
drought most significantly impacted sales and throughput at the Company’s<br />
higher margin portable grain handling equipment divisions. Generally, gross<br />
margin percentages are low in the fourth quarter of a fiscal year due to low<br />
sales volumes and preseason sales discounts.<br />
Ag Growth will often provide complete grain storage and handling systems<br />
when selling internationally and these projects may include equipment<br />
not currently manufactured by the Company. Ag Growth outsources this<br />
equipment and resells it to the customer at a low gross margin percentage.<br />
Excluding these goods purchased for resale, the Company’s gross margin in<br />
<strong>2012</strong> was 31.4% (2011 – 32.9%).<br />
Expenses<br />
For the three months ended December 31, <strong>2012</strong>, general and administrative<br />
expenses were $12.7 million (2011 – $13.4 million). The decrease from<br />
2011 was primarily the result of a lower expense related to share based<br />
compensation and a reduction in short term bonuses, partially offset by<br />
higher professional fees related to IFRS consulting.<br />
Adjusted EBITDA, EBITDA and Net Earnings<br />
Adjusted EBITDA for the three months ended December 31, <strong>2012</strong> was $4.8<br />
million (2011 – $8.6 million). The decrease resulted primarily from the impact<br />
of the U.S. drought as discussed above.<br />
EBITDA for the three months ended December 31, <strong>2012</strong> was $4.5 million,<br />
compared to $9.7 million in 2011. The decrease in EBITDA is the result of the<br />
factors above and a decrease in the Company’s gain on foreign exchange.<br />
For the three months ended December 31, <strong>2012</strong>, the Company reported a net<br />
loss of $3.4 million (2011 – net earnings of $3.3 million), basic net loss per<br />
share of $0.28 (2011 – net profit per share of $0.26), and a fully diluted net<br />
loss per share of $0.27 (2011 – net profit per share of $0.26).
07 08 09 10 11<br />
19<br />
<strong>2012</strong> ANNUAL REPORT<br />
CASH FLOW AND LIQUIDITY<br />
(thousands of dollars) Year Ended December 31<br />
<strong>2012</strong> 2011<br />
Profit before income taxes $25,013 $34,176<br />
Add charges (deduct credits) to<br />
operations not requiring a current<br />
cash payment:<br />
Depreciation and amortization 10,010 9,194<br />
Translation (gain) loss on FX (1,766) 1,641<br />
Non-cash interest expense 2,543 2,422<br />
Share based compensation 1,174 2,038<br />
Non-cash impairment of goodwill 1,890 0<br />
Loss on sale of assets 32 76<br />
38,896 49,547<br />
Net change in non-cash working<br />
capital balances related to<br />
operations:<br />
Accounts receivable (2,165) (9,607)<br />
Inventory 6,045 (9,850)<br />
Prepaid expenses and other 1,075 5,034<br />
Accounts payable and accruals (4,913) (1,755)<br />
Customer deposits (3,035) 1,445<br />
Provisions 198 280<br />
(2,795) (14,453)<br />
Settlement of SAIP obligation (1,495) (1,998)<br />
Income tax paid (3,012) (5,217)<br />
Cash provided by operations $31,594 $27,879<br />
For the year ended December 31, <strong>2012</strong>, cash provided by operations was<br />
$31.6 million (2011 – $27.9 million). The increase compared to 2011 is largely<br />
the result of a considerable improvement in cash generated from working<br />
capital. Most significantly, cash generated from inventory movement<br />
increased $15.9 million compared to 2011 due to an increased focus on<br />
inventory management and because working capital in 2011 included a<br />
substantial investment in inventory to support the start-up of the Company’s<br />
greenfield storage bin facility.<br />
Working Capital Requirements<br />
Interim period working capital requirements typically reflect the seasonality<br />
of the business. Ag Growth’s collections of accounts receivable are<br />
weighted towards the third and fourth quarters. This collection pattern,<br />
combined with historically high sales in the third quarter that result<br />
from seasonality, typically lead to accounts receivable levels increasing<br />
throughout the year and peaking in the third quarter. Inventory levels<br />
typically increase in the first and second quarters and then begin to decline<br />
in the third or fourth quarter as sales levels exceed production. As a result<br />
of these working capital movements, historically, Ag Growth begins to<br />
draw on its operating lines in the first or second quarter. The operating line<br />
balance typically peaks in the second or third quarter and normally begins<br />
to decline later in the third quarter as collections of accounts receivable<br />
increase. Ag Growth has typically fully repaid its operating line balance by<br />
early in the fourth quarter.<br />
Results for the year ended December 31, <strong>2012</strong> were negatively impacted by<br />
a severe drought in the United States. As a result, sales and the drawdown<br />
of the company’s inventory were negatively impacted in the second half of<br />
<strong>2012</strong> and the Company anticipates this trend will continue in the first half<br />
of 2013. Growth in international business and increasing storage bin sales<br />
may result in an increase in the number of days accounts receivable remain<br />
outstanding and higher than historical inventory levels.
20<br />
01 02 03 04 05<br />
management’s discussion & analysis<br />
Capital Expenditures<br />
Maintenance capital expenditures in the year ended December 31, <strong>2012</strong><br />
were $3.5 million or 1.1% of trade sales (2011 – $3.9 million and 1.3%).<br />
Maintenance capital expenditures in <strong>2012</strong> relate primarily to purchases<br />
of manufacturing equipment, leasehold improvements and building<br />
repairs and were funded through cash on hand, cash from operations<br />
and bank indebtedness.<br />
Ag Growth defines maintenance capital expenditures as cash outlays<br />
required to maintain plant and equipment at current operating capacity and<br />
efficiency levels. Non-maintenance capital expenditures encompass other<br />
investments, including cash outlays required to increase operating capacity<br />
or improve operating efficiency. Ag Growth had non-maintenance capital<br />
expenditures of $1.2 million in the year ended December 31, <strong>2012</strong> (2011 – $5.3<br />
million). Non-maintenance capital expenditures in <strong>2012</strong> relate primarily to<br />
investments in equipment to support growth at the Company’s commercial<br />
divisions. Maintenance capital expenditures in 2013 are expected to<br />
approximate <strong>2012</strong> levels and non-maintenance capital expenditures are<br />
expected to increase due to an investment of approximately $8.7 million<br />
in facility and equipment to support growth in the portable conveyor<br />
market. The facility and equipment investment of $8.7 million is expected<br />
to be financed primarily through the sale of redundant facilities in Swift<br />
Current, SK and Saskatoon, SK, while the remaining capital expenditures<br />
are expected to be financed through a combination of cash on hand, bank<br />
indebtedness and term debt.<br />
Cash Balance<br />
The Company’s cash balance decreased $4.7 million in the year ended<br />
December 31, <strong>2012</strong> (2011 – decrease of $28.1 million). The decrease in <strong>2012</strong><br />
was less than the decline in 2011 due to lower capital expenditures, an<br />
increase in cash provided by non-cash working capital and because 2011<br />
included payments of $9.9 million related to the acquisition of Tramco and<br />
$3.3 million related to the purchase of shares under the Company’s LTIP.<br />
CONTRACTUAL OBLIGATIONS<br />
(thousands of dollars)<br />
Total 2013 2014 2015 2016 2017+<br />
Debentures 114,885 0 114,885 0 0 0<br />
Long-term debt 35,361 7 10,482 0 24,872 0<br />
Operating leases 3,626 959 874 584 394 815<br />
Total obligations 153,872 966 126,241 584 25,266 815<br />
Debentures relate to the aggregate principal amount of debentures issued<br />
by the Company in October 2009 (see “Convertible Debentures” below).<br />
Long-term debt at December 31, <strong>2012</strong> is comprised of U.S. $25.0 million<br />
aggregate principal amount of secured notes issued through a note<br />
purchase and private shelf agreement and U.S. $10.5 million non-amortizing<br />
term debt, net of deferred financing costs The operating leases relate<br />
primarily to vehicle, equipment, warehousing and facility leases and were<br />
entered into in the normal course of business.<br />
As at March 14, 2013, the Company had outstanding commitments of $4.3<br />
million to purchase property, plant and equipment related to the acquisition<br />
of a facility and upgraded equipment to support growth in the portable belt<br />
conveyor market.<br />
CAPITAL RESOURCES<br />
Cash<br />
Cash and cash equivalents at December 31, <strong>2012</strong> were $2.2 million (2011 –<br />
$6.8 million). Although cash provided by operations increased compared<br />
to 2011, the Company’s bank balance is lower than the prior year due to a<br />
lower opening cash balance.
07 08 09 10 11<br />
21<br />
<strong>2012</strong> ANNUAL REPORT<br />
Debt Facilities<br />
On October 29, 2009, the Company issued<br />
USD $25.0 million aggregate principal amount<br />
of secured notes through a note purchase and<br />
private shelf agreement. The notes are nonamortizing,<br />
bear interest at 6.80% and mature<br />
October 29, 2016. Under the note purchase<br />
agreement, Ag Growth is subject to certain<br />
financial covenants, including a maximum<br />
leverage ratio and a minimum debt service<br />
ratio. The Company is in compliance with all<br />
financial covenants.<br />
On March 9, <strong>2012</strong>, the Company renewed its<br />
credit facility with its existing lenders.<br />
The committed lines under the facility are<br />
unchanged under the new facility. The table<br />
below summarizes amounts committed and<br />
drawn (USD converted at $0.9949) as at<br />
December 31, <strong>2012</strong>:<br />
Committed Line $70,385<br />
Bank indebtedness 0<br />
Long-term debt 10,475<br />
Undrawn at<br />
December 31, <strong>2012</strong> $59,910<br />
The renewed credit includes lender approval<br />
to expand the facility by an additional $25<br />
million, bears interest at rates of prime plus<br />
0.0% to prime plus 1.0% (superseded facility –<br />
prime plus 0.50% to prime plus 1.50%) based<br />
on performance calculations and matures on<br />
the earlier of March 8, 2016 or three months<br />
prior to maturity date of the Debentures, unless<br />
refinanced on terms acceptable to the lenders.<br />
Ag Growth is subject to certain financial<br />
covenants, including a maximum leverage ratio<br />
and a minimum debt service ratio, and is in<br />
compliance with all financial covenants.<br />
Convertible Debentures<br />
In October 2009 the Company issued $115 million<br />
aggregate principal amount of convertible<br />
unsecured subordinated debentures (the<br />
“Debentures”) at a price of $1,000 per<br />
Debenture. The Debentures bear interest at an<br />
annual rate of 7.0% payable semi-annually on<br />
June 30 and December 31. Each Debenture is<br />
convertible into common shares of the Company<br />
at the option of the holder at a conversion price<br />
of $44.98 per common share. The maturity date<br />
of the Debentures is December 31, 2014. The<br />
Debentures trade on the TSX under the<br />
symbol AFN.DB.<br />
Net proceeds of the offering of approximately<br />
$109.9 million were used by Ag Growth<br />
for general corporate purposes, to repay<br />
indebtedness, to fund acquisitions and to<br />
finance the expansion of the Company’s storage<br />
bin product line.<br />
On and after December 31, <strong>2012</strong> and prior to<br />
December 31, 2013, the Debentures may be<br />
redeemed, in whole or in part, at the option of
22<br />
01 02 03 04 05<br />
management’s discussion & analysis<br />
the Company at a price equal to their principal amount plus accrued and<br />
unpaid interest, provided that the volume weighted average trading price<br />
of the common shares during the 20 consecutive trading days ending on<br />
the fifth trading day preceding the date on which the notice of redemption<br />
is given is not less than 125% of the conversion price. On and after<br />
December 31, 2013, the Debentures may be redeemed, in whole or in part,<br />
at the option of the Company at a price equal to their principal amount<br />
plus accrued and unpaid interest.<br />
On redemption or at maturity, the Company may, at its option, subject<br />
to regulatory approval and provided that no event of default has<br />
occurred, elect to satisfy its obligation to pay the principal amount of the<br />
Debentures, in whole or in part, by issuing and delivering for each $100<br />
due that number of freely tradeable common shares obtained by dividing<br />
$100 by 95% of the volume weighted average trading price of the common<br />
shares on the Toronto Stock Exchange (“TSX”) for the 20 consecutive<br />
trading days ending on the fifth trading day preceding the date fixed for<br />
redemption or the maturity date, as the case may be. Any accrued and<br />
unpaid interest thereon will be paid in cash. The Company may also elect,<br />
subject to any required regulatory approval and provided that no event of<br />
default has occurred, to satisfy all or part of its obligation to pay interest<br />
on the Debentures by delivering sufficient freely tradeable common<br />
shares to satisfy its interest obligation.<br />
The Debentures trade on the TSX under the symbol AFN.DB.<br />
COMMON SHARES<br />
The following common shares were issued and outstanding at the<br />
dates indicated:<br />
# Common Shares<br />
December 31, 2011 12,545,996<br />
Shares issued under DDCP 2,107<br />
December 31, <strong>2012</strong> and March 14, 2013 12,548,103<br />
On November 17, 2011, Ag Growth commenced a normal course issuer<br />
bid for up to 994,508 common shares, representing 10% of the Company’s<br />
“public float” of common shares at that time. The normal course issuer bid<br />
terminated on November 20, <strong>2012</strong> and no common shares were purchased<br />
under the normal course issuer bid.<br />
Ag Growth has granted 220,000 share awards under its 2007 share award<br />
incentive plan. In fiscal 2010 a total of 140,000 share awards vested and the<br />
equivalent number of common shares was issued to the participants. The<br />
remaining share awards vested as to 40,000 each on January 1, 2011 and<br />
January 1, <strong>2012</strong>, however no common shares were issued on these vesting<br />
dates as the participants were compensated in cash rather than common<br />
shares. No additional share awards are available under this share award<br />
incentive plan.<br />
The administrator of the LTIP has acquired 317,304 common shares to<br />
satisfy its obligations with respect to awards under the LTIP for fiscal 2007,<br />
2008, 2009 and 2010. There was no LTIP award related to fiscal 2011 or fiscal<br />
<strong>2012</strong>. The common shares purchased are held by the administrator until<br />
such time as they vest to the LTIP participants. As at December 31, <strong>2012</strong>,<br />
a total of 242,956 common shares related to the LTIP had vested to<br />
the participants.
07 08 09 10 11<br />
23<br />
<strong>2012</strong> ANNUAL REPORT<br />
On May 11, <strong>2012</strong> the shareholders of Ag Growth authorized a new Share<br />
Award Incentive Plan (the “<strong>2012</strong> SAIP”) which authorizes the Board to<br />
grant restricted Share Awards (“RSU’s”) and performance Share Awards<br />
(“PSU’s”) to officers, employees or consultants of the Company but not to<br />
non-management directors. A total of 465,000 common shares are available<br />
for issuance under the <strong>2012</strong> SAIP. As at December 31, <strong>2012</strong>, no RSU’s or<br />
PSU’s have been granted. As at March 14, 2013, a total of 150,000 RSU’s and<br />
110,000 PSU’s have been granted.<br />
A total of 32,404 deferred grants of common shares are outstanding under<br />
the Company’s Director’s Deferred Compensation Plan.<br />
On March 5, 2013, the Company announced the adoption of a dividend<br />
reinvestment plan (the “DRIP”). Eligible shareholders who elect to reinvest<br />
dividends under the DRIP will initially receive Common Shares issued from<br />
treasury at a discount of 4% from the market price of the Common Shares,<br />
with the market price being equal to the volume-weighted average trading<br />
price of the Common Shares on the Toronto Stock Exchange for the five<br />
trading days preceding the applicable dividend payment date.<br />
Ag Growth’s common shares trade on the TSX under the symbol AFN.<br />
DIVIDENDS<br />
In the year ended December 31, <strong>2012</strong>, Ag Growth declared dividends to<br />
shareholders of $30.1 million (2011 – $30.1 million). Ag Growth’s policy<br />
is to pay monthly dividends. The Company’s Board of Directors reviews<br />
financial performance and other factors when assessing dividend levels.<br />
An adjustment to dividend levels may be made at such time as the Board<br />
determines an adjustment to be in the best interest of the Company.<br />
Financial results in the first half of 2013 are expected to be negatively<br />
impacted by the severe drought experienced in the U.S. in <strong>2012</strong> (see<br />
“Summary of Results”) however the Company’s dividend rate will not be<br />
altered in response to this short-term weather event.<br />
Dividends in a fiscal year are typically funded entirely through cash from<br />
operations, although due to seasonality dividends may be funded on a<br />
short-term basis by the Company’s operating lines. Dividends in the year<br />
ended December 31, <strong>2012</strong> were funded through cash on hand, cash from<br />
operations and bank indebtedness. The Company expects dividends in 2013<br />
will be funded through cash on hand, cash from operations and<br />
bank indebtedness.<br />
FUNDS FROM OPERATIONS<br />
Funds from operations, defined under “Non-IFRS Measures” is cash<br />
flow from operating activities before the net change in non-cash working<br />
capital balances related to operations and stock-based compensation,<br />
less maintenance capital expenditures and adjusted for the gain or loss on<br />
the sale of property, plant & equipment. The objective of presenting this<br />
measure is to provide a measure of free cash flow. The definition excludes<br />
changes in working capital as they are necessary to drive organic growth<br />
and have historically been financed by the Company’s operating facility<br />
(See “Capital Resources”). Funds from operations should not be construed<br />
as an alternative to cash flows from operating, investing, and financing<br />
activities as a measure of the Company’s liquidity and cash flows.
24<br />
01 02 03 04 05<br />
management’s discussion & analysis<br />
(thousands of dollars) Year Ended December 31<br />
<strong>2012</strong> 2011<br />
EBITDA $49,971 $56,038<br />
Share based compensation 1,174 2,038<br />
Non-cash interest expense 2,543 2,422<br />
Translation (gain) loss on FX (1,766) 1,641<br />
Interest expense (13,058) (12,668)<br />
Income taxes paid (3,012) (5,217)<br />
Maintenance capital<br />
expenditures (3,546) (3,935)<br />
Funds from operations (1) $32,306 $40,319<br />
Funds from operations can be reconciled to cash provided by operating<br />
activities as follows:<br />
(thousands of dollars) Year Ended December 31<br />
<strong>2012</strong> 2011<br />
Cash provided by operating activities $31,594 $27,879<br />
Change in non-cash working capital 2,795 14,453<br />
Settlement of SAIP option 1,495 1,998<br />
Maintenance capital expenditures (3,546) (3,935)<br />
Loss on sale of assets (32) (76)<br />
Funds from operations (1) $32,306 $40,319<br />
Shares outstanding (2) 12,572,374 12,562,335<br />
Funds from operations per share $2.57 $3.21<br />
Dividends declared per share $2.40 $2.40<br />
Payout ratio (1) 93% 75%<br />
Funds from operations and the Company’s payout ratio in the current<br />
year were higher than is typical due to the significant impact of the U.S.<br />
drought. Management anticipates the impact of the drought will negatively<br />
impact the Company’s payout ratio in the first half of 2013, however not to<br />
the degree experienced in the second half of <strong>2012</strong>. The payout ratio in the<br />
second half of 2013 is anticipated to benefit from higher year-over-year<br />
adjusted EBITDA (see “Outlook”).<br />
FINANCIAL INSTRUMENTS<br />
Foreign exchange contracts<br />
Risk from foreign exchange arises as a result of variations in exchange<br />
rates between the Canadian and the U.S. dollar and to a lesser extent to<br />
variations in exchange rates between the Canadian dollar and the Euro.<br />
Ag Growth has entered into foreign exchange contracts with<br />
three Canadian chartered banks to partially hedge its foreign currency<br />
exposure as at December 31, <strong>2012</strong>, had outstanding the following foreign<br />
exchange contracts:<br />
Forward Foreign Exchange Contracts<br />
Settlement Dates Face Amount Average Rate<br />
CAD Amount<br />
USD (000’s)<br />
CAD<br />
(000’s)<br />
January - Dec 2013 $53,000 $1.0266 $54,410<br />
January - Dec 2014 $41,000 $1.0165 $41,677<br />
(1)<br />
See “non-IFRS Measures”.<br />
(2)<br />
Fully diluted weighted average, excluding the potential dilution of the Debentures<br />
as the calculation includes the interest expense related to the Debentures.
07 08 09 10 11<br />
25<br />
<strong>2012</strong> ANNUAL REPORT<br />
Settlement Dates<br />
Forward Foreign Exchange Contracts<br />
Face Amount<br />
Euros (000’s)<br />
Average Rate<br />
CAD<br />
CAD Amount<br />
(000’s)<br />
Aug and Dec 2013 €500 $1.3250 $663<br />
Aug and Dec 2014 €500 $1.3290 $665<br />
The fair value of the outstanding forward foreign exchange contracts in<br />
place as at December 31, <strong>2012</strong> was a gain of $1.6 million. Consistent with<br />
prior periods, the Company has elected to apply hedge accounting for<br />
these contracts and the unrealized gain has been recognized in other<br />
comprehensive income for the period ended December 31, <strong>2012</strong>.<br />
Subsequent to December 31, <strong>2012</strong>, the Company entered a number of<br />
foreign exchange forward contracts for the period June 2014 to December<br />
2014 totalling U.S. $13 million at an average rate of $1.0148, and for January<br />
and February 2015 totalling U.S. $5.0 million at an average rate of $1.0417<br />
CRITICAL ACCOUNTING ESTIMATES<br />
The preparation of financial statements in conformity with IFRS requires<br />
management to make estimates and assumptions that affect the reported<br />
amounts of assets and liabilities and disclosure of contingent assets and<br />
liabilities at the date of the financial statements and the reported amount<br />
of revenues and expenses during the period. By their nature, these<br />
estimates are subject to a degree of uncertainty and are based on historical<br />
experience and trends in the industry. Management reviews these<br />
estimates on an ongoing basis. While management has applied judgment<br />
based on assumptions believed to be reasonable in the circumstances,<br />
actual results can vary from these assumptions. It is possible that materially<br />
different results would be reported using different assumptions.<br />
Ag Growth believes the accounting policies that are critical to its<br />
business relate to the use of estimates regarding the recoverability of<br />
accounts receivable and the valuation of inventory, intangibles, goodwill,<br />
convertible debentures and deferred income taxes. Ag Growth’s accounting<br />
policies are described in the notes to its December 31, <strong>2012</strong> audited<br />
financial statements.<br />
Allowance for Doubtful Accounts<br />
Due to the nature of Ag Growth’s business and the credit terms it provides<br />
to its customers, estimates and judgments are inherent in the on-going<br />
assessment of the recoverability of accounts receivable. Ag Growth<br />
maintains an allowance for doubtful accounts to reflect expected credit<br />
losses. A considerable amount of judgment is required to assess the<br />
ultimate realization of accounts receivable and these judgments must<br />
be continuously evaluated and updated. Ag Growth is not able to predict<br />
changes in the financial conditions of its customers, and the Company’s<br />
judgment related to the recoverability of accounts receivable may<br />
be materially impacted if the financial condition of the Company’s<br />
customers deteriorates.<br />
Valuation of Inventory<br />
Assessments and judgments are inherent in the determination of the net<br />
realizable value of inventories. The cost of inventories may not be fully<br />
recoverable if they are slow moving, damaged, obsolete, or if the selling<br />
price of the inventory is less than its cost. Ag Growth regularly reviews its<br />
inventory quantities and reduces the cost attributed to inventory no longer<br />
deemed to be fully recoverable. Judgment related to the determination<br />
of net realizable value may be impacted by a number of factors including<br />
market conditions.<br />
Goodwill and Intangible Assets<br />
Assessments and judgments are inherent in the determination of the<br />
fair value of goodwill and intangible assets. Goodwill and indefinite life<br />
intangible assets are recorded at cost and finite life intangibles are
26<br />
01 02 03 04 05<br />
management’s discussion & analysis<br />
recorded at cost less accumulated amortization.<br />
Goodwill and intangible assets are tested<br />
for impairment at least annually. Assessing<br />
goodwill and intangible assets for impairment<br />
requires considerable judgment and is based<br />
in part on current expectations regarding<br />
future performance. Changes in circumstances<br />
including market conditions may materially<br />
impact the assessment of the fair value of<br />
goodwill and intangible assets.<br />
Deferred Income Taxes<br />
Deferred income taxes are calculated based on<br />
assumptions related to the future interpretation<br />
of tax legislation, future income tax rates, and<br />
future operating results, acquisitions<br />
and dispositions of assets and liabilities.<br />
Ag Growth periodically reviews and adjusts<br />
its estimates and assumptions of income<br />
tax assets and liabilities as circumstances<br />
warrant. A significant change in any of the<br />
Company’s assumptions could materially affect<br />
Ag Growth’s estimate of deferred tax assets<br />
and liabilities. See “Risks and Uncertainties –<br />
Income Tax Matters”.<br />
Future Benefit of Tax-loss<br />
Carryforwards<br />
Ag Growth should only recognize the future<br />
benefit of tax-loss carryforwards where it is<br />
probable that sufficient future taxable income<br />
can be generated in order to fully utilize such<br />
losses and deductions. We are required to<br />
make significant estimates and assumptions<br />
regarding future revenues and profit, and<br />
our ability to implement certain tax planning<br />
strategies, in order to assess the likelihood of<br />
utilizing such losses and deductions. These<br />
estimates and assumptions are subject to<br />
significant uncertainty and if changed could<br />
materially affect our assessment of the ability to<br />
fully realize the benefit of the deferred income<br />
tax assets. Deferred tax asset balances would<br />
be reduced and additional income tax expense<br />
recorded in the applicable accounting period in<br />
the event that circumstances change and we,<br />
based on revised estimates and assumptions,<br />
determined that it was no longer probable that<br />
those deferred tax assets would be fully realized<br />
RISKS AND UNCERTAINTIES<br />
The risks and uncertainties described below<br />
are not the only risks and uncertainties we face.<br />
Additional risks and uncertainties not currently<br />
known to us or that we currently consider<br />
immaterial also may impair operations. If any of<br />
the following risks actually occur, our business,<br />
results of operations and financial condition, and<br />
the amount of cash available for dividends could<br />
be materially adversely affected.<br />
Industry Cyclicality and General<br />
Economic Conditions<br />
The performance of the agricultural industry<br />
is cyclical. To the extent that the agricultural<br />
sector declines or experiences a downturn, this
07 08 09 10 11<br />
27<br />
<strong>2012</strong> ANNUAL REPORT<br />
is likely to have a negative impact on the grain<br />
handling, storage and conditioning industry,<br />
and the business of Ag Growth. Among other<br />
things, the agricultural sector has benefited<br />
from the expansion of the ethanol industry, and<br />
to the extent the ethanol industry declines or<br />
experiences a downturn, this is likely to have a<br />
negative impact on the grain handling, storage<br />
and conditioning industry, and the business<br />
of Ag Growth.<br />
Future developments in the North American and<br />
global economies may negatively impact the<br />
demand for our products. Management cannot<br />
estimate the level of growth or contraction of<br />
the economy as a whole or of the economy of<br />
any particular region or market that we serve.<br />
Adverse changes in our financial condition and<br />
results of operations may occur as a result of<br />
negative economic conditions, declines in<br />
stock markets, contraction of credit availability<br />
or other factors affecting economic<br />
conditions generally.<br />
Risk of Decreased Crop Yields<br />
Decreased crop yields due to poor weather<br />
conditions and other factors are a significant<br />
risk affecting Ag Growth. Both reduced crop<br />
volumes and the accompanying decline in farm<br />
incomes can negatively affect demand for grain<br />
handling, storage and conditioning equipment.<br />
Potential Volatility of Production Costs<br />
Various materials and components are<br />
purchased in connection with Ag Growth’s<br />
manufacturing process, some or all of which<br />
may be subject to wide price variation.<br />
Consistent with past and current practices<br />
within the industry, Ag Growth seeks to manage<br />
its exposure to material and component price<br />
volatility by planning and negotiating significant<br />
purchases on an annual basis, and endeavours<br />
to pass through to customers, most, if not all, of<br />
the price volatility. There can be no assurance<br />
that industry dynamics will allow Ag Growth<br />
to continue to reduce its exposure to volatility<br />
of production costs by passing through price<br />
increases to its customers.<br />
Foreign Exchange Risk<br />
Ag Growth generates the majority of its sales in<br />
U.S. dollars and Euros, but a materially smaller<br />
proportion of its expenses are denominated in<br />
U.S. dollars and Euros. In addition, Ag Growth<br />
may denominate its long term borrowings in U.S.<br />
dollars. Accordingly, fluctuations in the rate of<br />
exchange between the Canadian dollar and the<br />
U.S. dollar and Euro may significantly impact<br />
the Company’s financial results. Management<br />
has implemented a foreign currency hedging<br />
strategy and the Company has entered into<br />
a series of hedging arrangements to partially<br />
mitigate the potential effect of fluctuating<br />
exchange rates. To the extent that Ag Growth<br />
does not adequately hedge its foreign exchange<br />
risk, changes in the exchange rate between the<br />
Canadian dollar and the U.S. dollar and Euro may<br />
have a material adverse effect on Ag Growth’s<br />
results of operations, business, prospects and<br />
financial condition.<br />
Acquisition and Expansion Risk<br />
Ag Growth may expand its operations by<br />
increasing the scope or changing the nature of<br />
operations at existing facilities or by acquiring<br />
or developing additional businesses, products<br />
or technologies. There can be no assurance<br />
that the Company will be able to identify,<br />
acquire, develop or profitably manage additional<br />
businesses, or successfully integrate any<br />
acquired business, products, or technologies<br />
into the business, or increase the scope or<br />
change the nature of operations at existing<br />
facilities without substantial expenses, delays<br />
or other operational or financial difficulties.<br />
The Company’s ability to increase the scope<br />
or change the nature of its operations or<br />
acquire or develop additional businesses may<br />
be impacted by its cost of capital and access<br />
to credit. Acquisitions and expansions may<br />
involve a number of special risks including<br />
diversion of management’s attention, failure to<br />
retain key personnel, unanticipated events or<br />
circumstances, and legal liabilities, some or all<br />
of which could have a material adverse effect on<br />
Ag Growth’s performance. In addition, there can<br />
be no assurance that an increase in the scope or<br />
a change in the nature of operations at existing
28<br />
01 02 03 04 05<br />
management’s discussion & analysis<br />
facilities or that acquired or newly developed<br />
businesses, products, or technologies will<br />
achieve anticipated revenues and income. The<br />
failure of the Company to manage its acquisition<br />
or expansion strategy successfully could have a<br />
material adverse effect on Ag Growth’s results of<br />
operations and financial condition.<br />
International Sales and Operations<br />
A portion of Ag Growth’s sales are generated in<br />
overseas markets and Ag Growth anticipates<br />
increasing its offshore sales and operations in<br />
the future. Sales and operations outside of North<br />
America, particularly in emerging markets, are<br />
subject to various risks, including: currency<br />
exchange rate fluctuations; foreign economic<br />
conditions; trade barriers; competition with<br />
North American and international manufacturers<br />
and suppliers; exchange controls; national<br />
and regional labour strikes; political risks<br />
and risks of increases in duties; taxes and<br />
changes in tax laws; expropriation of property,<br />
cancellation or modification of contract rights,<br />
unfavourable legal climate for the collection<br />
of unpaid accounts; changes in laws and<br />
policies governing operations of foreign-based<br />
companies, as well as risks of loss due to civil<br />
strife and acts of war. Further, the Company’s<br />
business practices in these foreign countries<br />
must comply with the Corruption of Public<br />
Foreign Officials Act (Canada) and other<br />
applicable similar laws. If violations of these<br />
laws were to occur, they could subject us to<br />
fines and other penalties as well as increased<br />
compliance costs. There is no guarantee that<br />
one or more of these factors will not materially<br />
adversely affect Ag Growth’s offshore sales and<br />
operations in the future.<br />
Commodity Prices, International Trade and<br />
Political Uncertainty<br />
Prices of commodities are influenced by a<br />
variety of unpredictable factors that are beyond<br />
the control of Ag Growth, including weather,<br />
government (Canadian, United States and other)<br />
farm programs and policies, and changes in<br />
global demand or other economic factors. A<br />
decrease in commodity prices could negatively<br />
impact the agricultural sector, and the business<br />
of Ag Growth. New legislation or amendments<br />
to existing legislation, including the Energy<br />
Independence and Security Act in the U.S., may<br />
ultimately impact demand for the Company’s<br />
products. The world grain market is subject to<br />
numerous risks and uncertainties, including risks<br />
and uncertainties related to international trade<br />
and global political conditions.<br />
Competition<br />
Ag Growth experiences competition in the<br />
markets in which it operates. Certain of<br />
Ag Growth’s competitors have greater financial<br />
and capital resources than Ag Growth.<br />
Ag Growth could face increased competition<br />
from newly formed or emerging entities, as well<br />
as from established entities that choose to focus<br />
(or increase their existing focus) on<br />
Ag Growth’s primary markets. As the grain<br />
handling, storage and conditioning equipment<br />
sector is fragmented, there is also a risk that a<br />
larger, formidable competitor may be created<br />
through a combination of one or more smaller<br />
competitors. Ag Growth may also face potential<br />
competition from the emergence of new<br />
products or technology.<br />
Seasonality of Business<br />
The seasonality of the demand for Ag Growth’s<br />
products results in lower cash flow in the first<br />
three quarters of each calendar year and may<br />
impact the ability of the Company to make cash<br />
dividends to shareholders, or the quantum of<br />
such dividends, if any. No assurance can be<br />
given that Ag Growth’s credit facility will be<br />
sufficient to offset the seasonal variations in<br />
Ag Growth’s cash flow.<br />
Business Interruption<br />
The operation of Ag Growth’s manufacturing<br />
facilities are subject to a number of business<br />
interruption risks, including delays in obtaining<br />
production materials, plant shutdowns, labour<br />
disruptions and weather conditions/natural<br />
disasters. Ag Growth may suffer damages<br />
associated with such events that it cannot<br />
insure against or which it may elect not to insure<br />
against because of high premium costs or other
07 08 09 10 11<br />
29<br />
<strong>2012</strong> ANNUAL REPORT<br />
reasons. For instance, Ag Growth’s Rosenort<br />
facility is located in an area that is often subject<br />
to widespread flooding, and insurance coverage<br />
for this type of business interruption is limited. Ag<br />
Growth is not able to predict the occurrence of<br />
business interruptions.<br />
Litigation<br />
In the ordinary course of its business, Ag<br />
Growth may be party to various legal actions,<br />
the outcome of which cannot be predicted with<br />
certainty. One category of potential legal actions<br />
is product liability claims. Farming is an inherently<br />
dangerous occupation. Grain handling, storage<br />
and conditioning equipment used on farms or in<br />
commercial applications may result in product<br />
liability claims that require insuring of risk and<br />
management of the legal process.<br />
Dependence on Key Personnel<br />
Ag Growth’s future business, financial condition,<br />
and operating results depend on the continued<br />
contributions of certain of Ag Growth’s executive<br />
officers and other key management and personnel,<br />
certain of whom would be difficult to replace.<br />
Labour Costs and Shortages and<br />
Labour Relations<br />
The success of Ag Growth’s business depends<br />
on a large number of both hourly and salaried<br />
employees. Changes in the general conditions of<br />
the employment market could affect the ability of<br />
Ag Growth to hire or retain staff at current wage<br />
levels. The occurrence of either of these events<br />
could have an adverse effect on the Company’s<br />
results of operations. There is no assurance that<br />
some or all of the employees of Ag Growth will<br />
not unionize in the future. If successful, such<br />
an occurrence could increase labour costs and<br />
thereby have an adverse affect on Ag Growth’s<br />
results of operations.<br />
Distribution, Sales Representative and<br />
Supply Contracts<br />
Ag Growth typically does not enter into written<br />
agreements with its dealers, distributors or<br />
suppliers. As a result, such parties may, without<br />
notice or penalty, terminate their relationship<br />
with Ag Growth at any time. In addition, even<br />
if such parties should decide to continue their<br />
relationship with Ag Growth, there can be no<br />
guarantee that the consideration or other<br />
terms of such contracts will continue on the<br />
same basis.<br />
Availability of Credit<br />
Ag Growth’s credit facility matures on the earlier<br />
of March 8, 2016 or three months prior to the<br />
maturity of the Debentures and is renewable<br />
at the option of the lenders. There can be no<br />
guarantee the Company will be able to obtain<br />
alternate financing and no guarantee that future<br />
credit facilities will have the same terms and<br />
conditions as the existing facility. This may have<br />
an adverse effect on the Company, its ability<br />
to pay dividends and the market value of its<br />
common shares. In addition, the business of<br />
the Company may be adversely impacted in the<br />
event that the Company’s customer base does<br />
not have access to sufficient financing. Sales<br />
related to the construction of commercial grain<br />
handling facilities, sales to developing markets,<br />
and sales to North American farmers may be<br />
negatively impacted.<br />
Interest Rates<br />
Ag Growth’s term and operating credit facilities<br />
bear interest at rates that are in part dependent<br />
on performance based financial ratios. The<br />
Company’s cost of borrowing may be impacted<br />
to the extent that the ratio calculation results<br />
in an increase in the performance based<br />
component of the interest rate. To the extent<br />
that the Company has term and operating loans<br />
where the fluctuations in the cost of borrowing<br />
are not mitigated by interest rate swaps, the<br />
Company’s cost of borrowing may be impacted<br />
by fluctuations in market interest rates.
30<br />
01 02 03 04 05<br />
management’s discussion & analysis<br />
Uninsured and Underinsured Losses<br />
Ag Growth uses its discretion in determining<br />
amounts, coverage limits and deductibility<br />
provisions of insurance, with a view to<br />
maintaining appropriate insurance coverage<br />
on its assets and operations at a commercially<br />
reasonable cost and on suitable terms. This may<br />
result in insurance coverage that, in the event<br />
of a substantial loss, would not be sufficient<br />
to pay the full current market value or current<br />
replacement cost of its assets or cover the cost<br />
of a particular claim.<br />
Cash Dividends are not Guaranteed<br />
Future dividend payments by Ag Growth and<br />
the level thereof is uncertain, as Ag Growth’s<br />
dividend policy and the funds available for<br />
the payment of dividends from time to time<br />
are dependent upon, among other things,<br />
operating cash flow generated by Ag Growth<br />
and its subsidiaries, financial requirements<br />
for Ag Growth’s operations and the execution<br />
of its growth strategy, fluctuations in working<br />
capital and the timing and amount of capital<br />
expenditures, debt service requirements and<br />
other factors beyond Ag Growth’s control.<br />
Income Tax Matters;<br />
Communication with Canada Revenue<br />
Agency Regarding Conversion<br />
Income tax provisions, including current and<br />
deferred income tax assets and liabilities,<br />
and income tax filing positions require estimates<br />
and interpretations of federal and provincial<br />
income tax rules and regulations, and judgments<br />
as to their interpretation and application to Ag<br />
Growth’s specific situation. The amount and<br />
timing of reversals of temporary differences will<br />
also depend on Ag Growth’s future operating<br />
results, acquisitions and dispositions of assets<br />
and liabilities. The business and operations of<br />
Ag Growth are complex and Ag Growth has<br />
executed a number of significant financings,<br />
acquisitions, reorganizations and business<br />
combinations over the course of its history<br />
including the Conversion. The computation<br />
of income taxes payable as a result of these<br />
transactions involves many complex factors<br />
as well as Ag Growth’s interpretation of and<br />
compliance with relevant tax legislation and<br />
regulations. While Ag Growth believes that its<br />
existing and proposed tax filing positions are<br />
probable to be sustained, there are a number<br />
of existing and proposed tax filing positions<br />
including in respect of the Conversion that are<br />
or may be the subject of review by taxation<br />
authorities. Without limitation, there is a risk that<br />
the tax consequences of the Conversion may be<br />
materially different from the tax consequences<br />
anticipated by the Company in undertaking the<br />
Conversion. While the Company is confident<br />
in its tax filing position, there is a risk that the<br />
Canada Revenue Agency (the “CRA”) could<br />
successfully challenge the tax consequences of<br />
the Conversion or prior transactions of any of the<br />
entities involved in the Conversion. Therefore,<br />
it is possible that additional taxes could be<br />
payable by Ag Growth and the ultimate value<br />
of Ag Growth’s income tax assets and liabilities<br />
could change in the future and that changes to<br />
these amounts could have a material adverse<br />
effect on Ag Growth’s consolidated financial<br />
statements and financial position. Further, in the<br />
event of a reassessment of any of Ag Growth’s<br />
tax filings by a taxation authority including the<br />
CRA, Ag Growth would be required to deposit<br />
cash equal to 50% of the tax liability claimed<br />
with the relevant taxation authority in order to<br />
file an objection against such reassessment, the<br />
amount of which deposit could be significant.<br />
See also “Explanation of Operating Results –<br />
Deferred income tax expense”.<br />
Ag Growth May Issue Additional<br />
Common Shares Diluting Existing<br />
Shareholders’ Interests<br />
The Company is authorized to issue an<br />
unlimited number of common shares for such<br />
consideration and on such terms and conditions<br />
as shall be established by the Directors without<br />
the approval of any shareholders, except as<br />
required by the TSX. In addition, the Company<br />
may, at its option, satisfy its obligations<br />
with respect to the interest payable on the<br />
Debentures and the repayment of the face<br />
value of the Debentures through the issuance of<br />
common shares.
07 08 09 10 11<br />
31<br />
<strong>2012</strong> ANNUAL REPORT<br />
Leverage, Restrictive Covenants<br />
The degree to which Ag Growth is leveraged<br />
could have important consequences to the<br />
shareholders, including: (i) the ability to obtain<br />
additional financing for working capital, capital<br />
expenditures or acquisitions in the future may<br />
be limited; (ii) a material portion of Ag Growth’s<br />
cash flow from operations may need to be<br />
dedicated to payment of the principal of and<br />
interest on indebtedness, thereby reducing<br />
funds available for future operations and to<br />
pay dividends; (iii) certain of the borrowings<br />
under the Company’s credit facility may be at<br />
variable rates of interest, which exposes Ag<br />
Growth to the risk of increased interest rates;<br />
and (iv) Ag Growth may be more vulnerable to<br />
economic downturns and be limited in its ability<br />
to withstand competitive pressures. Ag Growth’s<br />
ability to make scheduled payments of principal<br />
and interest on, or to refinance, its indebtedness<br />
will depend on its future operating performance<br />
and cash flow, which are subject to prevailing<br />
economic conditions, prevailing interest rate<br />
levels, and financial, competitive, business<br />
and other factors, many of which are beyond<br />
its control.<br />
The ability of Ag Growth to pay dividends or<br />
make other payments or advances will be<br />
subject to applicable laws and contractual<br />
restrictions contained in the instruments<br />
governing its indebtedness, including the<br />
Company’s credit facility and note purchase<br />
agreement. Ag Growth’s credit facility and<br />
note purchase agreement contain restrictive<br />
covenants customary for agreements of this<br />
nature, including covenants that limit the<br />
discretion of management with respect to<br />
certain business matters. These covenants<br />
place restrictions on, among other things,<br />
the ability of Ag Growth to incur additional<br />
indebtedness, to pay dividends or make certain<br />
other payments and to sell or otherwise dispose<br />
of material assets. In addition, the credit facility<br />
and note purchase agreement contain a number<br />
of financial covenants that will require Ag<br />
Growth to meet certain financial ratios and<br />
financial tests. A failure to comply with these<br />
obligations could result in an event of default<br />
which, if not cured or waived, could permit<br />
acceleration of the relevant indebtedness and<br />
trigger financial penalties including a makewhole<br />
provision in the note purchase agreement.<br />
If the indebtedness under the credit facility<br />
and note purchase agreement were to be<br />
accelerated, there can be no assurance that the<br />
assets of Ag Growth would be sufficient to repay<br />
in full that indebtedness. There can also be no<br />
assurance that the credit facility or any other<br />
credit facility will be able to be refinanced.<br />
NEW ACCOUNTING<br />
PRONOUNCEMENTS<br />
In June <strong>2012</strong>, the IASB issued Consolidated<br />
Financial Statements, Joint Arrangements<br />
and Disclosures of Interest in Other Entities:<br />
Transition Guidance (Amendments to IFRS 10,<br />
IFRS 11, and IFRS 12). The amendments clarify<br />
the transition guidance in IFRS 10 and provide<br />
additional transition relief for all three standards<br />
by limiting the requirement to provide adjusted<br />
comparative information to only the preceding<br />
comparative period. The amendments are<br />
effective for annual periods beginning on or after<br />
January 1, 2013. The Company will apply these<br />
amendments along with the adoption of IFRS 10,<br />
11 and 12 on January 1, 2013.<br />
Additional new or amended accounting<br />
standards that have been previously issued by<br />
the IASB but are not yet effective, and have not<br />
been applied by the Company, are as outlined<br />
in Note 5 of the <strong>2012</strong> annual consolidated<br />
financial statements.<br />
DISCLOSURE CONTROLS<br />
AND PROCEDURES AND<br />
INTERNAL CONTROLS<br />
Disclosure controls and procedures are<br />
designed to provide reasonable assurance that<br />
all relevant information is gathered and reported
32<br />
01 02 03 04 05<br />
management’s discussion & analysis<br />
to senior management, including Ag Growth’s<br />
Chief Executive Officer and Chief Financial<br />
Officer, on a timely basis so that appropriate<br />
decisions can be made regarding<br />
public disclosure.<br />
Management of Ag Growth is responsible<br />
for designing internal controls over financial<br />
reporting for the Company as defined<br />
under National Instrument 52-109 issued<br />
by the Canadian Securities Administrators.<br />
Management has designed such internal<br />
controls over financial reporting, or caused<br />
them to be designed under their supervision,<br />
to provide reasonable assurance regarding<br />
the reliability of financial reporting and the<br />
preparation of the financial statements for<br />
external purposes in accordance with IFRS.<br />
There have been no material changes in<br />
Ag Growth’s internal controls over financial<br />
reporting that occurred in the three month<br />
period ended December 31, <strong>2012</strong>, that have<br />
materially affected, or are reasonably likely to<br />
materially affect, the Company’s internal controls<br />
over financial reporting.<br />
NON-IFRS MEASURES<br />
In analyzing our results, we supplement our<br />
use of financial measures that are calculated<br />
and presented in accordance with IFRS, with<br />
a number of non-IFRS financial measures<br />
including “EBITDA”, “Adjusted EBITDA”,<br />
“gross margin”, “funds from operations”,<br />
“payout ratio” and “trade sales”. A non-IFRS<br />
financial measure is a numerical measure of<br />
a company’s historical performance, financial<br />
position or cash flow that excludes (includes)<br />
amounts, or is subject to adjustments that have<br />
the effect of excluding (including) amounts,<br />
that are included (excluded) in most directly<br />
comparable measures calculated and presented<br />
in accordance with IFRS. Non-IFRS financial<br />
measures are not standardized; therefore, it<br />
may not be possible to compare these financial<br />
measures with other companies’ non-IFRS<br />
financial measures having the same or similar<br />
businesses. We strongly encourage investors<br />
to review our consolidated financial statements<br />
and publicly filed reports in their entirety and not<br />
to rely on any single financial measure.<br />
We use these non-IFRS financial measures<br />
in addition to, and in conjunction with, results<br />
presented in accordance with IFRS. These non-<br />
IFRS financial measures reflect an additional<br />
way of viewing aspects of our operations that,<br />
when viewed with our IFRS results and the<br />
accompanying reconciliations to corresponding<br />
IFRS financial measures, may provide a more<br />
complete understanding of factors and trends<br />
affecting our business.<br />
In the MD&A, we discuss the non-IFRS financial<br />
measures, including the reasons that we believe<br />
that these measures provide useful information<br />
regarding our financial condition, results of<br />
operations, cash flows and financial position,<br />
as applicable and, to the extent material, the<br />
additional purposes, if any, for which these<br />
measures are used. Reconciliations of non-<br />
IFRS financial measures to the most directly<br />
comparable IFRS financial measures are<br />
contained in the MD&A.<br />
Management believes that the Company’s<br />
financial results may provide a more complete<br />
understanding of factors and trends affecting<br />
our business and be more meaningful to<br />
management, investors, analysts and other<br />
interested parties when certain aspects of<br />
our financial results are adjusted for the gain<br />
(loss) on foreign exchange and other operating<br />
expenses and income. This measurement is a<br />
non-IFRS measurement. Management uses the<br />
non-IFRS adjusted financial results and non-IFRS<br />
financial measures to measure and evaluate<br />
the performance of the business and when<br />
discussing results with the Board of Directors,<br />
analysts, investors, banks and other<br />
interested parties.<br />
References to “EBITDA” are to profit before<br />
income taxes, finance costs, amortization,<br />
depreciation, and goodwill and intangible<br />
impairment. References to “adjusted EBITDA”<br />
are to EBITDA before the gain (loss) on foreign<br />
exchange, gains or losses on the sale of
07 08 09 10 11<br />
33<br />
<strong>2012</strong> ANNUAL REPORT<br />
property, plant & equipment and expenses<br />
related to corporate acquisition activity.<br />
Management believes that, in addition to profit<br />
or loss, EBITDA and adjusted EBITDA are<br />
useful supplemental measures in evaluating the<br />
Company’s performance. Management cautions<br />
investors that EBITDA and adjusted EBITDA<br />
should not replace profit or loss as indicators<br />
of performance, or cash flows from operating,<br />
investing, and financing activities as a measure<br />
of the Company’s liquidity and cash flows.<br />
References to “trade sales” are to sales net of<br />
the gain or loss on foreign exchange. References<br />
to “gross margin” are to trade sales less cost of<br />
sales net of the depreciation and amortization<br />
included in cost of sales. Management cautions<br />
investors that trade sales should not replace<br />
sales as an indicator of performance.<br />
References to “funds from operations” are<br />
to cash flow from operating activities before<br />
the net change in non-cash working capital<br />
balances related to operations and stockbased<br />
compensation, less maintenance capital<br />
expenditures and adjusted for the gain or loss<br />
on the sale of property, plant & equipment.<br />
Management believes that, in addition to cash<br />
provided by (used in) operating activities, funds<br />
from operations provide a useful supplemental<br />
measure in evaluating its performance.<br />
References to “payout ratio” are to dividends<br />
declared as a percentage of funds<br />
from operations.<br />
FORWARD-LOOKING<br />
STATEMENTS<br />
This MD&A contains forward-looking statements<br />
that reflect our expectations regarding the future<br />
growth, results of operations, performance,<br />
business prospects, and opportunities of the<br />
Company. Forward-looking statements may<br />
contain such words as “anticipate”, “believe”,<br />
“continue”, “could”, “expects”, “intend”,<br />
“plans”, “will” or similar expressions suggesting<br />
future conditions or events. In particular, the<br />
forward looking statements in this MD&A<br />
include statements relating to the benefits of<br />
acquisitions including the acquisition of Airlanco<br />
(see “Acquisitions in Fiscal 2011”), our business<br />
and strategy, including our outlook for our<br />
financial and operating performance, growth<br />
in sales to developing markets, the benefits of<br />
the expansion of the Company’s grain storage<br />
product line, the future contribution of that plant<br />
to our operating and financial performance, the<br />
effect of crop conditions in our market areas,<br />
the effect of current economic conditions and<br />
macroeconomic trends on the demand for our<br />
products, expectations regarding pricing for<br />
agricultural commodities, our working capital<br />
and capital expenditure requirements, capital<br />
resources, future sales and adjusted EBITDA<br />
and the payment of dividends. Such forwardlooking<br />
statements reflect our current beliefs<br />
and are based on information currently available<br />
to us, including certain key expectations and<br />
assumptions concerning anticipated financial<br />
performance, business prospects, strategies,<br />
product pricing, regulatory developments,<br />
tax laws, the sufficiency of budgeted capital<br />
expenditures in carrying out planned activities,<br />
foreign exchange rates and the cost of materials,<br />
labour and services. Forward-looking statements<br />
involve significant risks and uncertainties. A<br />
number of factors could cause actual results to<br />
differ materially from results discussed in the<br />
forward-looking statements, including changes<br />
in international, national and local business<br />
conditions, weather patterns, crop yields, crop<br />
conditions, seasonality, industry cyclicality,<br />
volatility of production costs, commodity prices,<br />
the cost and availability of capital, foreign<br />
exchange rates, and competition. These risks<br />
and uncertainties are described under “Risks<br />
and Uncertainties” in this MD&A and in our<br />
most recently filed <strong>Annual</strong> Information Form.<br />
We cannot assure readers that actual results<br />
will be consistent with these forward-looking<br />
statements and we undertake no obligation to<br />
update such statements except as expressly<br />
required by law.<br />
ADDITIONAL INFORMATION<br />
Additional information relating to Ag Growth,<br />
including Ag Growth’s most recent <strong>Annual</strong><br />
Information Form, is available on SEDAR<br />
(www.sedar.com).
34<br />
01 02 03 04 05<br />
management’s discussion & analysis<br />
03
07 08 09 10 11<br />
35<br />
<strong>2012</strong> ANNUAL REPORT<br />
Consolidated Financial Statements<br />
INDEPENDENT<br />
AUDITORS’ REPORT<br />
To the Shareholders of Ag Growth<br />
International Inc.<br />
We have audited the accompanying<br />
consolidated financial statements of<br />
Ag Growth International Inc., which comprise<br />
the consolidated statements of financial<br />
position as at December 31, <strong>2012</strong> and<br />
2011, and the consolidated statements of<br />
income, comprehensive income, changes<br />
in shareholders’ equity and cash flows for<br />
the years then ended, and a summary of<br />
significant accounting policies and other<br />
explanatory information.<br />
Management’s<br />
responsibility for<br />
the consolidated<br />
financial statements<br />
Management is responsible for the preparation<br />
and fair presentation of these consolidated<br />
financial statements in accordance with<br />
International Financial <strong>Report</strong>ing Standards,<br />
and for such internal control as management<br />
determines is necessary to enable the<br />
preparation of consolidated financial statements<br />
that are free from material misstatement,<br />
whether due to fraud or error.<br />
Auditors’ responsibility<br />
Our responsibility is to express an opinion on<br />
these consolidated financial statements based<br />
on our audits. We conducted our audits in<br />
accordance with Canadian generally accepted<br />
auditing standards. Those standards require<br />
that we comply with ethical requirements<br />
and plan and perform the audit to obtain<br />
reasonable assurance about whether the<br />
consolidated financial statements are free from<br />
material misstatement.<br />
An audit involves performing procedures to<br />
obtain audit evidence about the amounts<br />
and disclosures in the consolidated financial<br />
statements. The procedures selected depend on<br />
the auditors’ judgment, including the assessment<br />
of the risks of material misstatement of the<br />
consolidated financial statements, whether<br />
due to fraud or error. In making those risk<br />
assessments, the auditors consider internal<br />
control relevant to the entity’s preparation and<br />
fair presentation of the consolidated financial<br />
statements in order to design audit procedures<br />
that are appropriate in the circumstances, but<br />
not for the purpose of expressing an opinion<br />
on the effectiveness of the entity’s internal<br />
control. An audit also includes evaluating the<br />
appropriateness of accounting policies used<br />
and the reasonableness of accounting estimates<br />
made by management, as well as evaluating<br />
the overall presentation of the consolidated<br />
financial statements.<br />
We believe that the audit evidence we<br />
have obtained in our audits is sufficient<br />
and appropriate to provide a basis for our<br />
audit opinion.<br />
Opinion<br />
In our opinion, the consolidated financial<br />
statements present fairly, in all material<br />
respects, the financial position of Ag Growth<br />
International Inc. as at December 31, <strong>2012</strong> and<br />
2011, and its financial performance and its cash<br />
flows for the years then ended in accordance<br />
with International Financial <strong>Report</strong>ing Standards.<br />
Winnipeg, Canada,<br />
March 13, 2013.<br />
Chartered Accountants
36<br />
01 02 03 04 05<br />
financial statements<br />
CONSOLIDATED STATEMENTS OF FINANCIAL POSITION<br />
(in thousands of Canadian dollars)<br />
As at December 31<br />
<strong>2012</strong> 2011<br />
$ $<br />
ASSETS [note 22]<br />
Current assets<br />
Cash and cash equivalents [note 15] 2,171 6,839<br />
Restricted cash [note 16] 34 2,439<br />
Accounts receivable [note 17] 51,856 49,691<br />
Inventory [note 18] 58,513 64,558<br />
Prepaid expenses and other assets 1,645 2,720<br />
Income taxes recoverable 900 1,506<br />
Derivative instruments [note 27] 1,377 —<br />
116,496 127,753<br />
Non-current assets<br />
Property, plant and equipment, net [note 9] 80,854 83,434<br />
Goodwill [note 11] 63,399 65,876<br />
Intangible assets, net [note 10] 72,777 75,510<br />
Available-for-sale investment [note 14] 2,000 2,800<br />
Derivative instruments [note 27] 234 —<br />
Deferred tax asset [note 25] 33,621 38,092<br />
252,885 265,712<br />
Assets held for sale [note 13] 1,101 1,101<br />
Total assets 370,482 394,566
07 08 09 10 11<br />
37<br />
<strong>2012</strong> ANNUAL REPORT<br />
Liabilities and Shareholders’ Equity <strong>2012</strong> 2011<br />
Current liabilities<br />
Accounts payable and accrued liabilities [note 24] 17,351 22,264<br />
Customer deposits 4,983 8,018<br />
Dividends payable 2,510 2,509<br />
Acquisition price, transaction and financing costs<br />
payable [notes 6 and 7] — 1,938<br />
Current portion of long-term debt [note 22] 7 16<br />
Current portion of obligations under finance leases<br />
[note 22] — 131<br />
Current portion of derivative instruments [note 27] — 1,828<br />
Current portion of share award incentive plan<br />
[note 21] — 1,495<br />
Provisions [note 19] 2,420 2,222<br />
27,271 40,421<br />
Non-current liabilities<br />
Long-term debt [note 22] 34,916 35,824<br />
Convertible unsecured subordinated debentures<br />
[note 23] 109,558 107,202<br />
Deferred tax liability [note 25] 9,041 8,960<br />
153,515 151,986<br />
Total liabilities 180,786 192,407<br />
<strong>2012</strong> 2011<br />
Shareholders’ equity [note 20]<br />
Common shares 153,447 151,039<br />
Accumulated other comprehensive loss (2,590) (1,875)<br />
Equity component of convertible debentures 5,105 5,105<br />
Contributed surplus 4,108 5,341<br />
Retained earnings 29,626 42,549<br />
Total shareholders’ equity 189,696 202,159<br />
Total liabilities and shareholders’ equity 370,482 394,566<br />
See accompanying notes<br />
On behalf of the Board of Directors:<br />
Bill Lambert<br />
Director<br />
David A. White, CA, ICD.D<br />
Director
38<br />
01 02 03 04 05<br />
financial statements<br />
CONSOLIDATED STATEMENTS OF INCOME<br />
(in thousands of Canadian dollars, except per share amounts)<br />
Year ended December 31<br />
<strong>2012</strong> 2011<br />
$ $<br />
Sales 314,342 305,932<br />
Cost of goods sold [note 8[d]] 219,199 204,203<br />
Gross profit 95,143 101,729<br />
Expenses<br />
Selling, general and administrative [note 8[e]] 56,077 54,826<br />
Impairment of goodwill [notes 11 and 12] 1,890 —<br />
Other operating income [note 8[a]] (122) (100)<br />
Finance costs [note 8[c]] 13,058 12,668<br />
Finance expense (income) [note 8[b]] (773) 159<br />
70,130 67,553<br />
Profit before income taxes 25,013 34,176<br />
Income tax expense [note 25]<br />
Current 3,771 3,910<br />
Deferred 4,054 5,743<br />
7,825 9,653<br />
Profit for the year 17,188 24,523<br />
Profit per share - basic [note 30] 1.38 1.97<br />
Profit per share - diluted [note 30] 1.37 1.95<br />
CONSOLIDATED STATEMENTS OF<br />
COMPREHENSIVE INCOME<br />
(in thousands of Canadian dollars)<br />
Year ended December 31<br />
<strong>2012</strong> 2011<br />
$ $<br />
Profit for the year 17,188 24,523<br />
Other comprehensive loss<br />
Change in fair value of derivatives designated<br />
as cash flow hedges 2,680 (1,556)<br />
Losses (gains) on derivatives designated as cash<br />
flow hedges recognized in net earnings in the<br />
current period 749 (4,452)<br />
Income tax effect on cash flow hedges (910) 1,702<br />
Exchange differences on translation of foreign<br />
operations (2,646) 2,286<br />
Gain (loss) on available-for-sale financial assets<br />
[note 14] (800) 800<br />
Income tax effect on available-for-sale financial<br />
assets 212 (212)<br />
Other comprehensive loss for the year (715) (1,432)<br />
Total comprehensive income for the year 16,473 23,091<br />
See accompanying notes<br />
See accompanying notes
07 08 09 10 11<br />
39<br />
<strong>2012</strong> ANNUAL REPORT<br />
CONSOLIDATED STATEMENTS OF CHANGES IN SHAREHOLDERS’ EQUITY<br />
(in thousands of Canadian dollars)<br />
Year ended December 31, <strong>2012</strong><br />
Common<br />
shares<br />
Equity<br />
component of<br />
convertible<br />
debentures<br />
Contributed<br />
surplus<br />
Retained<br />
earnings<br />
Cash flow<br />
hedge<br />
reserve<br />
Foreign<br />
currency<br />
reserve<br />
Availablefor-sale<br />
reserve<br />
$ $ $ $ $ $ $ $<br />
As at January 1, <strong>2012</strong> 151,039 5,105 5,341 42,549 (1,340) (1,123) 588 202,159<br />
Profit for the year — — — 17,188 — — — 17,188<br />
Other comprehensive income (loss) — — — — 2,519 (2,646) (588) (715)<br />
Share-based payment transactions [note 21] 2,408 — (1,233) — — — — 1,175<br />
Dividends to shareholders [note 20] — — — (30,111) — — — (30,111)<br />
As at December 31, <strong>2012</strong> 153,447 5,105 4,108 29,626 1,179 (3,769) — 189,696<br />
Total<br />
equity<br />
See accompanying notes
40<br />
01 02 03 04 05<br />
financial statements<br />
CONSOLIDATED STATEMENTS OF CHANGES IN SHAREHOLDERS’ EQUITY<br />
(in thousands of Canadian dollars)<br />
Year ended December 31, 2011<br />
Common<br />
shares<br />
Equity<br />
component of<br />
convertible<br />
debentures<br />
Contributed<br />
surplus<br />
Retained<br />
earnings<br />
Cash flow<br />
hedge<br />
reserve<br />
Foreign<br />
currency<br />
reserve<br />
Availablefor-sale<br />
reserve<br />
$ $ $ $ $ $ $ $<br />
As at January 1, 2011 151,376 5,105 6,121 48,135 2,966 (3,409) — 210,294<br />
Profit for the year — — — 24,523 — — — 24,523<br />
Other comprehensive income (loss) — — — — (4,306) 2,286 588 (1,432)<br />
Conversion of subordinated debentures [note 20] 115 — — — — — — 115<br />
Share-based payment transactions [note 21] (452) — (780) — — — — (1,232)<br />
Dividends to shareholders [note 20] — — — (30,109) — — — (30,109)<br />
As at December 31, 2011 151,039 5,105 5,341 42,549 (1,340) (1,123) 588 202,159<br />
Total<br />
equity<br />
See accompanying notes
07 08 09 10 11<br />
41<br />
<strong>2012</strong> ANNUAL REPORT<br />
CONSOLIDATED STATEMENTS OF CASH FLOWS<br />
(in thousands of Canadian dollars)<br />
Year ended December 31<br />
<strong>2012</strong> 2011<br />
$ $<br />
OPERATING ACTIVITIES<br />
Profit before income taxes for the year 25,013 34,176<br />
Add (deduct) items not affecting cash<br />
Depreciation of property, plant and equipment 6,161 5,418<br />
Amortization of intangible assets 3,849 3,776<br />
Impairment of goodwill 1,890 —<br />
Translation loss (gain) on foreign exchange (1,766) 1,641<br />
Non-cash component of interest expense 2,543 2,422<br />
Share-based compensation expense 1,174 2,038<br />
Loss on sale of property, plant and equipment 32 76<br />
38,896 49,547<br />
Net change in non-cash working capital<br />
balances related to operations [note 15] (2,795) (14,453)<br />
Settlement of SAIP obligation (1,495) (1,998)<br />
Income tax paid (3,012) (5,217)<br />
Cash provided by operating activities 31,594 27,879<br />
INVESTING ACTIVITIES<br />
Acquisition of property, plant and equipment (4,710) (9,254)<br />
Acquisition of shares of Tramco, Inc., net of — (9,930)<br />
cash acquired [note 7]<br />
Acquisition of assets of Airlanco Inc. [note 6] — (11,970)<br />
Transfer from (to) cash held in trust and<br />
2,405 (243)<br />
restricted cash<br />
Proceeds from sale of property, plant and<br />
158 500<br />
equipment<br />
Development of intangible assets (1,615) (1,471)<br />
Transaction and financing costs paid (1,938) (433)<br />
Cash used in investing activities (5,700) (32,801)<br />
FINANCING ACTIVITIES<br />
Repayment of long-term debt (7) (319)<br />
Repayment of obligations under finance leases (131) (439)<br />
Issuance of long-term debt — 10,993<br />
Dividends paid (30,111) (30,109)<br />
Finance costs incurred (313) —<br />
Purchase of shares in the market under the — (3,346)<br />
long-term incentive plan<br />
Cash used in financing activities (30,562) (23,220)<br />
Net decrease in cash and cash equivalents<br />
during the year (4,668) (28,142)<br />
Cash and cash equivalents, beginning of year 6,839 34,981<br />
Cash and cash equivalents, end of year 2,171 6,839<br />
Interest paid 10,509 10,259<br />
See accompanying notes
42<br />
01 02 03 04 05<br />
financial statements<br />
NOTES TO CONSOLIDATED FINANCIAL STATEMENTS<br />
December 31, <strong>2012</strong> (in thousands of Canadian dollars, except where otherwise noted and per share data)<br />
1. ORGANIZATION<br />
The consolidated financial statements of Ag<br />
Growth International Inc. [“Ag Growth Inc.”]<br />
for the year ended December 31, <strong>2012</strong> were<br />
authorized for issuance in accordance with a<br />
resolution of the directors on March 13, 2013.<br />
Ag Growth International Inc. is a listed company<br />
incorporated and domiciled in Canada, whose<br />
shares are publicly traded at the Toronto Stock<br />
Exchange. The registered office is located at 198<br />
Commerce Drive, Winnipeg, Manitoba, Canada.<br />
2. OPERATIONS<br />
Ag Growth conducts business in the grain<br />
handling, storage and conditioning market.<br />
Included in these consolidated financial<br />
statements are the accounts of Ag Growth<br />
Inc. and all of its subsidiary partnerships and<br />
incorporated companies; together, Ag Growth<br />
Inc. and its subsidiaries are referred to as “Ag<br />
Growth” or the “Company”.<br />
3. SUMMARY OF SIGNIFICANT<br />
ACCOUNTING POLICIES<br />
Statement of compliance<br />
These consolidated financial statements have<br />
been prepared in accordance with International<br />
Financial <strong>Report</strong>ing Standards [“IFRS”] as issued<br />
by the International Accounting Standards<br />
Board [“IASB”].<br />
Basis of preparation<br />
The consolidated financial statements are<br />
presented in Canadian dollars, which is also the<br />
functional currency of the parent company, Ag<br />
Growth International Inc. All values are rounded<br />
to the nearest thousand. They are prepared on<br />
the historical cost basis, except for derivative<br />
financial instruments and available-for-sale<br />
investment, which are measured at fair value.<br />
The accounting policies set out below have been<br />
applied consistently to all periods presented in<br />
these consolidated financial statements.<br />
Principles of consolidation<br />
The consolidated financial statements include<br />
the accounts of Ag Growth International Inc.<br />
and its wholly owned subsidiaries, Ag Growth<br />
Industries Partnership, AGX Holdings Inc., Ag<br />
Growth Holdings Corp., Westfield Distributing<br />
(North Dakota) Inc., Hansen Manufacturing<br />
Corp. [“Hi Roller”], Union Iron Inc. [“Union Iron”],<br />
Applegate Trucking Inc., Applegate Livestock<br />
Equipment, Inc. [“Applegate”], Airlanco Inc.<br />
[“Airlanco”], Tramco, Inc. [“Tramco”], Tramco<br />
Europe Ltd., Euro-Tramco B.V., Ag Growth Suomi<br />
Oy and Mepu Oy [“Mepu”] as at December 31,<br />
<strong>2012</strong>. Subsidiaries are fully consolidated from<br />
the date of acquisition, it being the date on<br />
which Ag Growth obtains control, and continue<br />
to be consolidated until the date that such<br />
control ceases. The financial statements of the<br />
subsidiaries are prepared for the same reporting<br />
period as the Company, using consistent<br />
accounting policies. All intra-company balances,<br />
income and expenses and unrealized gains<br />
and losses resulting from intra-company<br />
transactions are eliminated in full.<br />
Business combinations and goodwill<br />
Business combinations are accounted for<br />
using the acquisition method. The cost of an<br />
acquisition is measured as the fair value of the<br />
assets given, equity instruments and liabilities<br />
incurred or assumed at the date of exchange.<br />
Acquisition costs for business combinations<br />
are expensed and included in selling, general<br />
and administrative expenses. Identifiable<br />
assets acquired and liabilities and contingent<br />
liabilities assumed in a business combination are<br />
measured initially at fair values at the date<br />
of acquisition.<br />
Goodwill is initially measured at cost, being the<br />
excess of the cost of the business combination<br />
over Ag Growth’s share in the net fair value of<br />
the acquiree’s identifiable assets, liabilities and<br />
contingent liabilities. Any negative difference
07 08 09 10 11<br />
43<br />
<strong>2012</strong> ANNUAL REPORT<br />
is recognized directly in the consolidated<br />
statement of income. If the fair values of the<br />
assets, liabilities and contingent liabilities can<br />
only be calculated on a provisional basis, the<br />
business combination is recognized using<br />
provisional values. Any adjustments resulting<br />
from the completion of the measurement<br />
process are recognized within 12 months of the<br />
date of acquisition [“measurement period”].<br />
After initial recognition, goodwill is measured<br />
at cost less any accumulated impairment<br />
losses. For the purpose of impairment testing,<br />
goodwill acquired in a business combination<br />
is, from the acquisition date, allocated to each<br />
of Ag Growth’s cash-generating units [“CGU”]<br />
that are expected to benefit from the synergies<br />
of the combination, irrespective of whether<br />
other assets and liabilities of the acquiree are<br />
assigned to those CGUs. Where goodwill forms<br />
part of a CGU and part of the operating unit is<br />
disposed of, the goodwill associated with the<br />
operation disposed of is included in the carrying<br />
amount of the operation when determining<br />
the gain or loss on disposal of operation. If the<br />
Company reorganizes its reporting structure<br />
in a way that changes the composition of one<br />
or more CGUs to which goodwill has been<br />
allocated, the goodwill is reallocated to the units<br />
affected. Goodwill disposed of or reallocated in<br />
these cases is measured based on the relative<br />
values of the operation disposed of and the<br />
portion of the CGU retained, or the relative fair<br />
value of the part of a CGU allocated to a new<br />
CGU compared to the part remaining in the old<br />
organizational structure.<br />
Foreign currency translation<br />
Each entity in Ag Growth determines its own<br />
functional currency and items included in the<br />
financial statements of each entity are measured<br />
using that functional currency.<br />
Transactions in foreign currencies are initially<br />
recorded by Ag Growth entities at their<br />
respective functional currency rates prevailing<br />
at the date of the transaction.<br />
Monetary items are translated at the functional<br />
currency spot rate as of the reporting date.<br />
Exchange differences from monetary items are<br />
recognized in the consolidated statement of<br />
income. Non-monetary items that are not carried<br />
at fair value are translated using the exchange<br />
rates as at the dates of the initial transaction.<br />
Non-monetary items measured at fair value<br />
in a foreign currency are translated using the<br />
exchange rates at the date when the fair value<br />
is determined.<br />
The assets and liabilities of foreign operations<br />
are translated into Canadian dollars at the rate<br />
of exchange prevailing at the reporting date and<br />
their consolidated statements of income are<br />
translated at the monthly rates of exchange. The<br />
exchange differences arising on the translation<br />
are recognized in other comprehensive<br />
income. On disposal of a foreign operation, the<br />
component of other comprehensive income<br />
relating to that particular foreign operation is<br />
recognized in the consolidated statement<br />
of income.<br />
Any goodwill arising on the acquisition of a<br />
foreign operation and any fair value adjustments<br />
to the carrying amounts of assets and liabilities<br />
arising on the acquisition are treated as assets<br />
and liabilities of the foreign operation and<br />
translated at the rate of exchange prevailing at<br />
the reporting date.<br />
Property, plant and equipment<br />
Property, plant and equipment is stated<br />
at cost, net of any accumulated depreciation<br />
and any impairment losses determined. Cost<br />
includes the purchase price, any costs directly<br />
attributable to bringing the asset to the location<br />
and condition necessary and, where relevant,<br />
the present value of all dismantling and<br />
removal costs. Where major components of<br />
property, plant and equipment have different<br />
useful lives, the components are recognized<br />
and depreciated separately. Ag Growth<br />
recognizes in the carrying amount of an item<br />
of property, plant and equipment the cost of<br />
replacing part of such an item when the cost<br />
is incurred and if it is probable that the future<br />
economic benefits embodied with the item<br />
can be reliably measured. All other repair<br />
and maintenance costs are recognized in the
44<br />
01 02 03 04 05<br />
financial statements<br />
consolidated statement of income as an expense<br />
when incurred.<br />
Depreciation is calculated on a straight-line<br />
basis over the estimated useful lives of the<br />
assets as follows:<br />
Buildings and building<br />
components<br />
20 - 60 years<br />
Manufacturing equipment 10 - 20 years<br />
Computer hardware<br />
5 years<br />
Leasehold improvements<br />
Over the<br />
lease period<br />
Equipment under finance leases 10 years<br />
Furniture and fixtures<br />
5 - 10 years<br />
Vehicles<br />
4 - 16 years<br />
An item of property, plant and equipment<br />
and any significant part initially recognized<br />
is derecognized upon disposal or when no<br />
future economic benefits are expected from<br />
its use or disposal. Any gain or loss arising on<br />
derecognition of the asset is included in the<br />
consolidated statement of income when the<br />
asset is derecognized.<br />
The assets’ useful lives and methods of<br />
depreciation of assets are reviewed at each<br />
financial year-end, and adjusted prospectively,<br />
if appropriate. No depreciation is taken on<br />
construction in progress until the asset is placed<br />
in use. Amounts representing direct costs<br />
incurred for major overhauls are capitalized and<br />
depreciated over the estimated useful life of the<br />
different components replaced.<br />
Leases<br />
The determination of whether an arrangement<br />
is, or contains, a lease is based on whether<br />
fulfillment of the arrangement is dependent<br />
on the use of a specific asset or assets or the<br />
arrangement conveys a right to use the asset.<br />
Finance leases, which transfer to Ag Growth<br />
substantially all the risks and benefits incidental<br />
to ownership of the leased item, are capitalized<br />
at the commencement of the lease at the fair<br />
value of the leased property or, if lower, at the<br />
present value of the minimum lease payments.<br />
Lease payments are apportioned between<br />
finance charges and reduction of the lease<br />
liability so as to achieve a constant rate of<br />
interest on the remaining balance of the liability.<br />
Finance charges are recognized in finance costs<br />
in the consolidated statement of income.<br />
Leased assets are depreciated over the<br />
useful life of the asset. However, if there is no<br />
reasonable certainty that Ag Growth will obtain<br />
ownership by the end of the lease term, the<br />
asset is depreciated over the shorter of<br />
the estimated useful life of the asset and the<br />
lease term.<br />
Operating lease payments are recognized as an<br />
expense in the consolidated statement of income<br />
on a straight-line basis over the lease term.<br />
Borrowing costs<br />
Borrowing costs directly attributable to the<br />
acquisition, construction or production of an<br />
asset that necessarily takes a substantial period<br />
of time, which Ag Growth considers to be 12<br />
months or more, to get ready for its intended use<br />
or sale, are capitalized as part of the cost of the<br />
respective assets. All other borrowing costs are<br />
expensed in the period they occur.<br />
Intangible assets<br />
Intangible assets acquired separately are<br />
measured on initial recognition at cost. The<br />
cost of intangible assets acquired in a business<br />
combination is its fair value at the date of<br />
acquisition. Following initial recognition,<br />
intangible assets are carried at cost less any<br />
accumulated amortization and any accumulated<br />
impairment losses. The useful lives of intangible<br />
assets are assessed as either finite or indefinite.<br />
Intangible assets with finite useful lives are<br />
amortized over the useful economic life and<br />
assessed for impairment whenever there is<br />
an indication that the intangible asset may<br />
be impaired. The amortization method and<br />
amortization period of an intangible asset with<br />
a finite useful life is reviewed at least annually.<br />
Changes in the expected useful life or the<br />
expected pattern of consumption of future<br />
economic benefits embodied in the asset are<br />
accounted for by changing the amortization<br />
period or method, as appropriate, and are
07 08 09 10 11<br />
45<br />
<strong>2012</strong> ANNUAL REPORT<br />
treated as changes in accounting estimates.<br />
The amortization expense on intangible<br />
assets with finite lives is recognized in the<br />
consolidated statement of income in the<br />
expense category consistent with the function<br />
of the intangible assets.<br />
Intangible assets with indefinite useful lives,<br />
which include brand names, are not amortized,<br />
but are tested for impairment annually, either<br />
individually or at the CGU level. The assessment<br />
of indefinite life is reviewed annually to<br />
determine whether the indefinite life continues<br />
to be supportable. If not, the change in useful<br />
life from indefinite to finite is made on a<br />
prospective basis.<br />
Internally generated intangible assets are<br />
capitalized when the product or process is<br />
technically and commercially feasible and Ag<br />
Growth has sufficient resources to complete<br />
development. The cost of an internally<br />
generated intangible asset comprises all directly<br />
attributable costs necessary to create, produce<br />
and prepare the asset to be capable of operating<br />
in the manner intended by management.<br />
Expenditures incurred to develop new demos<br />
and prototypes are recorded at cost as internally<br />
generated intangible assets. Amortization of the<br />
internally generated intangible assets begins<br />
when the development is complete and the asset<br />
is available for use and it is amortized over the<br />
period of expected future benefit. Amortization<br />
is recorded in cost of goods sold. During the<br />
period of development, the asset is tested for<br />
impairment at least annually.<br />
Finite life intangible assets are amortized on a<br />
straight-line basis over the estimated useful lives<br />
of the related assets as follows:<br />
Patents<br />
Distribution networks<br />
Demos and prototypes<br />
Order backlog<br />
Software<br />
8 years<br />
8 - 25 years<br />
3 - 15 years<br />
3 - 6 months<br />
8 years<br />
Gains or losses arising from derecognition of an<br />
intangible asset are measured as the difference<br />
between the net disposal proceeds and the<br />
carrying amount of the asset and are recognized<br />
in the consolidated statement of income when<br />
the asset is derecognized.<br />
Impairment of non-financial assets<br />
Ag Growth assesses at each reporting date whether<br />
there is an indication that an asset may be impaired.<br />
If such an indication exists, or when annual testing<br />
for an asset is required, Ag Growth estimates the<br />
asset’s recoverable amount. The recoverable<br />
amount of goodwill as well as intangible assets not<br />
yet available for use is estimated at least annually on<br />
December 31. The recoverable amount is the higher<br />
of an asset’s or CGU’s fair value less costs to sell and<br />
its value in use.<br />
Value in use is determined by discounting estimated<br />
future cash flows using a pre-tax discount rate<br />
that reflects the current market assessment of the<br />
time value of money and the specific risks of the<br />
asset. In determining fair value less costs to sell,<br />
recent market transactions are taken into account,<br />
if available. If no such transactions can be identified,<br />
an appropriate valuation model is used. The<br />
recoverable amount of assets that do not generate<br />
independent cash flows is determined based on the<br />
CGU to which the asset belongs.<br />
Ag Growth bases its impairment calculation on<br />
detailed budgets and forecast calculations that are<br />
prepared separately for each of Ag Growth’s CGUs<br />
to which the individual assets are allocated. These<br />
budgets and forecast calculations generally cover<br />
a period of five years. For periods after five years, a<br />
terminal value approach is used.<br />
An impairment loss is recognized in the<br />
consolidated statement of income if an asset’s<br />
carrying amount or that of the CGU to which it is<br />
allocated is higher than its recoverable amount.<br />
Impairment losses of CGUs are first charged<br />
against the carrying value of the goodwill<br />
balance included in the CGU and then against<br />
the value of the other assets, in proportion<br />
to their carrying amount. In the consolidated<br />
statement of income, the impairment losses<br />
are recognized in those expense categories<br />
consistent with the function of the impaired<br />
asset. For assets other than goodwill, an<br />
assessment is made at each reporting date<br />
as to whether there is any indication that<br />
previously recognized impairment losses may
46<br />
01 02 03 04 05<br />
financial statements<br />
no longer exist or may have decreased. If<br />
such indication exists, Ag Growth estimates<br />
the asset’s or CGU’s recoverable amount.<br />
A previously recognized impairment loss is<br />
reversed only if there has been a change in<br />
the assumptions used to determine the asset’s<br />
recoverable amount since the last impairment<br />
loss was recognized. The reversal is limited<br />
so that the carrying amount of the asset<br />
does not exceed its recoverable amount, nor<br />
exceed the carrying amount that would have<br />
been determined, net of depreciation, had no<br />
impairment loss been recognized for the<br />
asset or CGU in prior years. Such a reversal<br />
is recognized in the consolidated statement<br />
of income.<br />
Goodwill is tested for impairment annually as at<br />
December 31 and when circumstances indicate<br />
that the carrying value may be impaired.<br />
Impairment is determined for goodwill by<br />
assessing the recoverable amount of each<br />
CGU to which the goodwill relates. Where<br />
the recoverable amount of the CGU is less<br />
than its carrying amount, an impairment loss<br />
is recognized. Impairment losses relating to<br />
goodwill cannot be reversed in future periods.<br />
Intangible assets with indefinite useful lives are<br />
tested for impairment annually as at December<br />
31, either individually or at the CGU level, as<br />
appropriate, and when circumstances indicate<br />
that the carrying value may be impaired.<br />
Cash and cash equivalents<br />
All highly liquid temporary cash investments<br />
with an original maturity of three months<br />
or less when purchased are considered to<br />
be cash equivalents. For the purpose of the<br />
consolidated statement of cash flows, cash<br />
and cash equivalents consist of cash and<br />
money market funds, net of outstanding<br />
bank overdrafts.<br />
Inventory<br />
Inventory is comprised of raw materials and<br />
finished goods. Inventory is valued at the<br />
lower of cost and net realizable value, using a<br />
first-in, first-out basis. For finished goods, costs<br />
include all direct costs incurred in production,<br />
including direct labour and materials, freight,<br />
directly attributable manufacturing overhead<br />
costs based on normal operating capacity and<br />
property, plant and equipment depreciation.<br />
Inventories are written down to net realizable<br />
value when the cost of inventories is estimated<br />
to be unrecoverable due to obsolescence,<br />
damage or declining selling prices. Net<br />
realizable value is the estimated selling price in<br />
the ordinary course of business, less estimated<br />
costs of completion and the estimated<br />
costs necessary to make the sale. When<br />
the circumstances that previously caused<br />
inventories to be written down below cost no<br />
longer exist, or when there is clear evidence of<br />
an increase in selling prices, the amount of the<br />
write-down previously recorded is reversed.<br />
Financial instruments<br />
Financial assets and liabilities<br />
Ag Growth classifies its financial assets<br />
as [i] financial assets at fair value through<br />
profit or loss, [ii] loans and receivables or [iii]<br />
available-for-sale, and its financial liabilities<br />
as either [i] financial liabilities at fair value<br />
through profit or loss [“FVTPL”] or [ii] other<br />
financial liabilities. Derivatives are designated<br />
as hedging instruments in an effective hedge,<br />
as appropriate. Appropriate classification of<br />
financial assets and liabilities is determined<br />
at the time of initial recognition or when<br />
reclassified in the consolidated statement of<br />
financial position.<br />
All financial instruments are recognized initially<br />
at fair value plus, in the case of investments<br />
and liabilities not at fair value through profit<br />
or loss, directly attributable transaction costs.<br />
Financial instruments are recognized on the<br />
trade date, which is the date on which Ag<br />
Growth commits to purchase or sell the asset.
07 08 09 10 11<br />
47<br />
<strong>2012</strong> ANNUAL REPORT<br />
Financial assets at fair value through<br />
profit or loss<br />
Financial assets at FVTPL include financial<br />
assets held-for-trading and financial assets<br />
designated upon initial recognition at FVTPL.<br />
Financial assets are classified as held-fortrading<br />
if they are acquired for the purpose of<br />
selling or repurchasing in the near term. This<br />
category includes cash and cash equivalents<br />
and derivative financial instruments entered into<br />
that are not designated as hedging instruments<br />
in hedge relationships as defined by IAS 39.<br />
Financial assets at FVTPL are carried in the<br />
consolidated statement of financial position<br />
at fair value with changes in the fair value<br />
recognized in finance income or finance costs<br />
in the consolidated statement of income.<br />
Ag Growth has currently not designated<br />
any financial assets upon initial recognition<br />
as FVTPL.<br />
Derivatives embedded in host contracts<br />
are accounted for as separate derivatives<br />
and recorded at fair value if their economic<br />
characteristics and risks are not closely<br />
related to those of the host contracts and the<br />
host contracts are not held-for-trading. These<br />
embedded derivatives are measured at fair<br />
value with changes in fair value recognized<br />
in the consolidated statement of income.<br />
Reassessment only occurs if there is a change<br />
in the terms of the contract that significantly<br />
modifies the cash flows that would otherwise<br />
be required.<br />
Loans and receivables<br />
Loans and receivables are non-derivative<br />
financial assets with fixed or determinable<br />
payments that are not quoted in an active<br />
market. Assets in this category include<br />
receivables. Loans and receivables are initially<br />
recognized at fair value plus transaction costs.<br />
They are subsequently measured at amortized<br />
cost using the effective interest method less any<br />
impairment. The effective interest amortization is<br />
included in finance income in the consolidated<br />
statement of income. The losses arising from<br />
impairment are recognized in the consolidated<br />
statement of income in finance costs.<br />
Available-for-sale financial investments<br />
Available-for-sale financial investments include<br />
equity and debt securities. Equity investments<br />
classified as available-for-sale are those which<br />
are neither classified as held-for-trading nor<br />
designated at FVTPL. Debt securities in this<br />
category are those which are intended to be<br />
held for an indefinite period of time and which<br />
may be sold in response to needs for liquidity or<br />
in response to changes in the market conditions.<br />
After initial measurement, available-forsale<br />
financial investments are subsequently<br />
measured at fair value with unrealized gains<br />
or losses recognized as other comprehensive<br />
income in the available-for-sale reserve until the<br />
investment is derecognized, at which time the<br />
cumulative gain or loss is recognized in other<br />
operating income, or determined to be impaired,<br />
at which time the cumulative loss is reclassified<br />
to the consolidated statement of income in<br />
finance costs and removed from the availablefor-sale<br />
reserve.<br />
For a financial asset reclassified out of the<br />
available-for-sale category, any previous gain<br />
or loss on that asset that has been recognized<br />
in equity is amortized to profit or loss over<br />
the remaining life of the investment using<br />
the effective interest method. Any difference<br />
between the new amortized cost and the<br />
expected cash flows is also amortized over the<br />
remaining life of the asset using the effective<br />
interest method. If the asset is subsequently<br />
determined to be impaired, then the amount<br />
recorded in equity is reclassified to the<br />
consolidated statement of income.<br />
Derecognition<br />
A financial asset is derecognized when the<br />
rights to receive cash flows from the asset have<br />
expired or when Ag Growth has transferred its<br />
rights to receive cash flows from the asset.
48<br />
01 02 03 04 05<br />
financial statements<br />
Impairment of financial assets<br />
Ag Growth assesses at each reporting date<br />
whether there is any objective evidence that<br />
a financial asset or a group of financial assets<br />
is impaired. A financial asset is deemed to<br />
be impaired if, and only if, there is objective<br />
evidence of impairment as a result of one or<br />
more events that has occurred after the initial<br />
recognition of the asset [an incurred “loss<br />
event”] and that loss event has an impact on<br />
the estimated future cash flows of the financial<br />
asset or the group of financial assets that can be<br />
reliably estimated.<br />
For financial assets carried at amortized<br />
cost, Ag Growth first assesses individually<br />
whether objective evidence of impairment<br />
exists individually for financial assets that<br />
are individually significant, or collectively<br />
for financial assets that are not individually<br />
significant. If Ag Growth determines that no<br />
objective evidence of impairment exists for<br />
an individually assessed financial asset, it<br />
includes the asset in a group of financial assets<br />
with similar credit risk characteristics and<br />
collectively assesses them for impairment.<br />
Assets that are individually assessed for<br />
impairment and for which an impairment<br />
loss is, or continues to be, recognized<br />
are not included in a collective assessment<br />
of impairment.<br />
If there is objective evidence that an impairment<br />
loss has occurred, the amount of the loss<br />
is measured as the difference between the<br />
asset’s carrying amount and the present value<br />
of estimated future cash flows. The present<br />
value of the estimated future cash flows is<br />
discounted at the financial asset’s original<br />
effective interest rate.<br />
The carrying amount of the asset is reduced<br />
through the use of an allowance account and<br />
the amount of the loss is recognized in profit or<br />
loss. Interest income continues to be accrued<br />
on the reduced carrying amount and is accrued<br />
using the rate of interest used to discount the<br />
future cash flows for the purpose of measuring<br />
the impairment loss. The interest income is<br />
recorded as part of finance income in the<br />
consolidated statement of income.<br />
Loans and receivables, together with the<br />
associated allowance, are written off when<br />
there is no realistic prospect of future<br />
recovery. If, in a subsequent year, the amount<br />
of the estimated impairment loss increases or<br />
decreases because of an event occurring after<br />
the impairment was recognized, the previously<br />
recognized impairment loss is increased or<br />
reduced by adjusting the allowance account.<br />
If a write-off is later recovered, the recovery is<br />
credited to finance costs in the consolidated<br />
statement of income.<br />
For available-for-sale financial investments,<br />
Ag Growth assesses at each reporting date<br />
whether there is objective evidence that an<br />
investment or a group of investments is impaired.<br />
In the case of equity investments classified as<br />
available-for-sale, objective evidence would<br />
include a significant or prolonged decline in<br />
the fair value of the investment below its cost.<br />
“Significant” is evaluated against the original<br />
cost of the investment and “prolonged” against<br />
the period in which the fair value has been<br />
below its original cost. Where there is evidence<br />
of impairment, the cumulative loss – measured<br />
as the difference between the acquisition cost<br />
and the current fair value, less any impairment<br />
loss on that investment previously recognized<br />
in the consolidated statement of income – is<br />
removed from other comprehensive income<br />
and recognized in the consolidated statement<br />
of income. Impairment losses on equity<br />
investments are not reversed through the<br />
consolidated statement of income; increases in<br />
their fair value after impairment are recognized<br />
directly in other comprehensive income. In the<br />
case of debt instruments classified as availablefor-sale,<br />
impairment is assessed based on the<br />
same criteria as financial assets carried at<br />
amortized cost. However, the amount recorded<br />
for impairment is the cumulative loss measured<br />
as the difference between the amortized cost<br />
and the current fair value, less any impairment<br />
loss on that investment previously recognized
07 08 09 10 11<br />
49<br />
<strong>2012</strong> ANNUAL REPORT<br />
in the consolidated statement of income. If,<br />
in a subsequent year, the fair value of a debt<br />
instrument increases and the increase can<br />
be objectively related to an event occurring<br />
after the impairment loss was recognized<br />
in the consolidated statement of income,<br />
the impairment loss is reversed through the<br />
consolidated statement of income.<br />
Financial liabilities at FVTPL<br />
Financial liabilities at FVTPL include financial<br />
liabilities held-for-trading and financial liabilities<br />
designated upon initial recognition at FVTPL.<br />
Financial liabilities are classified as held-fortrading<br />
if they are acquired for the purpose of<br />
selling in the near term. This category includes<br />
derivative financial instruments entered into by<br />
the Company that are not designated as hedging<br />
instruments in hedge relationships as defined<br />
by IAS 39.<br />
Gains or losses on liabilities held-for-trading<br />
are recognized in the consolidated statement<br />
of income.<br />
Ag Growth has not designated any financial<br />
liabilities upon initial recognition as FVTPL.<br />
Other financial liabilities<br />
Financial liabilities are measured at amortized<br />
cost using the effective interest rate method.<br />
Financial liabilities include long-term debt<br />
issued, which is initially measured at fair<br />
value, which is the consideration received,<br />
net of transaction costs incurred, net of equity<br />
component. Transaction costs related to the<br />
long-term debt instruments are included in the<br />
value of the instruments and amortized using<br />
the effective interest rate method. The effective<br />
interest expense is included in finance costs in<br />
the consolidated statement of income.<br />
Derecognition<br />
A financial liability is derecognized when the<br />
obligation under the liability is discharged or<br />
cancelled or expires.<br />
When an existing financial liability is replaced by<br />
another from the same lender on substantially<br />
different terms, or the terms of an existing<br />
liability are substantially modified, such an<br />
exchange or modification is treated as a<br />
derecognition of the original liability and the<br />
recognition of a new liability, and the difference<br />
in the respective carrying amounts is recognized<br />
in the consolidated statement of income.<br />
Interest income<br />
For all financial instruments measured at<br />
amortized cost, interest income or expense is<br />
recorded using the effective interest method,<br />
which is the rate that exactly discounts the<br />
estimated future cash payments or receipts<br />
through the expected life of the financial<br />
instrument or a shorter period, where<br />
appropriate, to the net carrying amount of the<br />
financial asset or liability. Interest income is<br />
included in finance income in the consolidated<br />
statement of income.<br />
Derivative instruments and<br />
hedge accounting<br />
Ag Growth uses derivative financial instruments<br />
such as forward currency contracts and interest<br />
rate swaps to hedge its foreign currency risk<br />
and interest rate risk. Such derivative financial<br />
instruments are initially recognized at fair value<br />
on the date on which a derivative contract is<br />
entered into and are subsequently remeasured<br />
at fair value. Derivatives are carried as financial<br />
assets when the fair value is positive and as<br />
financial liabilities when the fair value<br />
is negative.<br />
Ag Growth analyzes all of its contracts, of<br />
both a financial and non-financial nature, to<br />
identify the existence of any “embedded”<br />
derivatives. Embedded derivatives are<br />
accounted for separately from the host contract<br />
at the inception date when their risks and<br />
characteristics are not closely related to those<br />
of the host contracts and the host contracts are<br />
not carried at fair value.
50<br />
01 02 03 04 05<br />
financial statements<br />
Any gains or losses arising from changes in the<br />
fair value of derivatives are recorded directly in<br />
the consolidated statement of income, except for<br />
the effective portion of cash flow hedges, which<br />
is recognized in other comprehensive income.<br />
For the purpose of hedge accounting, hedges<br />
are classified as:<br />
• Fair value hedges when hedging the exposure<br />
to changes in the fair value of a recognized<br />
asset or liability or an unrecognized firm<br />
commitment [except for foreign currency risk].<br />
• Cash flow hedges when hedging exposure<br />
to variability in cash flows that is either<br />
attributable to a particular risk associated<br />
with a recognized asset or liability or a highly<br />
probable forecast transaction or the foreign<br />
currency risk in an unrecognized<br />
firm commitment.<br />
At the inception of a hedge relationship, Ag<br />
Growth formally designates and documents<br />
the hedge relationship to which Ag Growth<br />
wishes to apply hedge accounting and the<br />
risk management objective and strategy for<br />
undertaking the hedge. The documentation<br />
includes identification of the hedging instrument,<br />
the hedged item or transaction, the nature of<br />
the risk being hedged and how the entity will<br />
assess the effectiveness of changes in the<br />
hedging instrument’s fair value in offsetting<br />
the exposure to changes in the cash flows<br />
attributable to the hedged risk. Such hedges<br />
are expected to be highly effective in achieving<br />
offsetting changes in cash flows and are<br />
assessed on an ongoing basis to determine<br />
whether they have been highly effective<br />
throughout the financial reporting periods for<br />
which they were designated.<br />
Hedges that meet the strict criteria for hedge<br />
accounting are accounted for as follows:<br />
Cash flow hedges<br />
The effective portion of the gain or loss on the<br />
hedging instrument is recognized directly as<br />
other comprehensive income in the cash flow<br />
hedge reserve, while any ineffective portion<br />
is recognized immediately in the consolidated<br />
statement of income in other operating income<br />
or expenses. Amounts recognized as other<br />
comprehensive income are transferred to the<br />
consolidated statement of income when the<br />
hedged transaction affects profit or loss, such as<br />
when the hedged financial income or financial<br />
expense is recognized or when a forecast sale<br />
occurs. Where the hedged item is the cost of a<br />
non-financial asset or non-financial liability, the<br />
amounts recognized as other comprehensive<br />
income are transferred to the initial carrying<br />
amount of the non-financial asset or liability.<br />
If the forecast transaction or firm commitment<br />
is no longer expected to occur, the cumulative<br />
gain or loss previously recognized in equity<br />
is transferred to the consolidated statement<br />
of income. If the hedging instrument expires<br />
or is sold, terminated or exercised without<br />
replacement or rollover, or if its designation as<br />
a hedge is revoked, any cumulative gain or loss<br />
previously recognized in other comprehensive<br />
income remains in other comprehensive income<br />
until the forecast transaction or firm commitment<br />
affects profit or loss.<br />
Ag Growth uses primarily forward currency<br />
contracts as hedges of its exposure to foreign<br />
currency risk in forecast transactions and<br />
firm commitments.<br />
Offsetting of financial instruments<br />
Financial assets and financial liabilities are offset<br />
and the net amount reported in the consolidated<br />
statement of financial position if, and only if, there<br />
is a currently enforceable legal right to offset the<br />
recognized amounts and there is an intention to<br />
settle on a net basis, or to realize the assets and<br />
settle the liabilities simultaneously.<br />
Fair value of financial instruments<br />
Fair value is the estimated amount that Ag<br />
Growth would pay or receive to dispose of these<br />
contracts in an arm’s length transaction between<br />
knowledgeable, willing parties who are under<br />
no compulsion to act. The fair value of financial<br />
instruments that are traded in active markets at<br />
each reporting date is determined by reference to
07 08 09 10 11<br />
51<br />
<strong>2012</strong> ANNUAL REPORT<br />
quoted market prices, without any deduction for<br />
transaction costs.<br />
For financial instruments not traded in an<br />
active market, the fair value is determined<br />
using appropriate valuation techniques that<br />
are recognized by market participants. Such<br />
techniques may include using recent arm’s length<br />
market transactions, reference to the current fair<br />
value of another instrument that is substantially<br />
the same, discounted cash flow analysis or other<br />
valuation models.<br />
Provisions<br />
Provisions are recognized when Ag Growth<br />
has a present obligation, legal or constructive,<br />
as a result of a past event, it is probable that<br />
an outflow of resources embodying economic<br />
benefits will be required to settle the obligation<br />
and a reliable estimate can be made of the<br />
amount of the obligation. Where Ag Growth<br />
expects some or all of a provision to be<br />
reimbursed, for example under an insurance<br />
contract, the reimbursement is recognized<br />
as a separate asset but only when the<br />
reimbursement is virtually certain. The expense<br />
relating to any provision is presented in the<br />
consolidated statement of income, net of any<br />
reimbursement. If the effect of the time value<br />
of money is material, provisions are discounted<br />
using a current pre-tax rate that reflects, where<br />
appropriate, the risks specific to the liability.<br />
Where discounting is used, the increase in<br />
the provision due to the passage of time is<br />
recognized as a finance cost.<br />
Warranty provisions<br />
Provisions for warranty-related costs are<br />
recognized when the product is sold or<br />
service provided. Initial recognition is based<br />
on historical experience.<br />
Profit per share<br />
The computation of profit per share is based on<br />
the weighted average number of shares<br />
outstanding during the period. Diluted profit Per<br />
share is computed in a similar way to basic profit<br />
per share except that the weighted average shares<br />
outstanding are increased to include Additional<br />
shares assuming the exercise of share options,<br />
share appreciation rights and convertible debt<br />
options, if dilutive.<br />
Revenue recognition<br />
Revenue is recognized to the extent that it is<br />
probable that the economic benefits will flow to Ag<br />
Growth and the revenue can be reliably measured,<br />
regardless of when the payment is being made.<br />
Revenue is measured at the fair value of the<br />
consideration received or receivable, taking into<br />
account contractually defined terms of payment<br />
and excluding taxes or duty. Ag Growth assesses<br />
its revenue arrangements against specific criteria<br />
in order to determine if it is acting as principal or<br />
agent. Ag Growth has concluded that it is acting as<br />
a principal in all of its revenue arrangements. The<br />
following specific recognition criteria must also be<br />
met before revenue is recognized:<br />
Sale of goods<br />
Revenue from the sale of goods is in general<br />
recognized when significant risks and rewards<br />
of ownership are transferred to the customer.<br />
Ag Growth generally recognizes revenue when<br />
products are shipped, free on board shipping<br />
point; the customer takes ownership and<br />
assumes risk of loss; collection of the related<br />
receivable is probable; persuasive evidence of an<br />
arrangement exists; and, the sales price is fixed<br />
or determinable. Customer deposits are recorded<br />
as a current liability when cash is received from<br />
the customer and recognized as revenue at the<br />
time product is shipped, as noted above.<br />
In transactions involving the sale of specific<br />
customer products, Ag Growth applies layaway<br />
sales accounting. Under layaway sales, Ag<br />
Growth recognizes revenue prior to the product<br />
being shipped, provided the following criteria are<br />
met as of the reporting date:<br />
• The goods are ready for delivery to the<br />
customer; this implies the goods have been<br />
produced to the specifications of the customer<br />
and Ag Growth has assessed, through its<br />
quality control processes, that the goods<br />
comply with the specifications;<br />
• A deposit of more than 80% of the total
52<br />
01 02 03 04 05<br />
financial statements<br />
contract value for the respective goods has<br />
been received;<br />
• The goods are specifically identified for the<br />
customer in Ag Growth’s inventory tracking<br />
system; and<br />
• Ag Growth does not have any other obligation<br />
than to ship the product, or to store the product<br />
until the customer picks it up.<br />
Bill and hold<br />
Ag Growth applies bill and hold sales<br />
accounting. Under bill and hold sales, Ag Growth<br />
recognizes revenue when the buyer takes title,<br />
provided the following criteria are met as of the<br />
reporting date:<br />
• It is probable that delivery will be made;<br />
• The item is on hand, identified and ready for<br />
delivery to the buyer at the time the sale<br />
is recognized;<br />
• The buyer specifically acknowledges the<br />
deferred delivery instructions; and<br />
• The usual payment terms apply.<br />
Construction contracts<br />
Ag Growth from time to time enters into<br />
arrangements with its customers that are<br />
considered construction contracts. These<br />
contracts [or a combination of contracts] are<br />
specifically negotiated for the construction of an<br />
asset or a combination of assets that are closely<br />
interrelated or interdependent in terms of their<br />
design, technology and function or their ultimate<br />
purpose or use.<br />
Ag Growth principally operates fixed price<br />
contracts. If the outcome of such a contract<br />
can be reliably measured, revenue associated<br />
with the construction contract is recognized<br />
by reference to the stage of completion of the<br />
contract activity at period-end [the percentage<br />
of completion method].<br />
The outcome of a construction contract can be<br />
estimated reliably when: [i] the total contract<br />
revenue can be measured reliably; [ii] it is<br />
probable that the economic benefits associated<br />
with the contract will flow to the entity; [iii] the<br />
costs to complete the contract and the stage of<br />
completion can be measured reliably; and [iv]<br />
the contract costs attributable to the contract<br />
can be clearly identified and measured reliably<br />
so that actual contract costs incurred can be<br />
compared with prior estimates.<br />
When the outcome of a construction contract<br />
cannot be estimated reliably [principally during<br />
early stages of a contract], contract revenue is<br />
recognized only to the extent of costs incurred<br />
that are expected to be recoverable. In applying<br />
the percentage of completion method, revenue<br />
recognized corresponds to the total contract<br />
revenue [as defined above] multiplied by the<br />
actual completion rate based on the proportion<br />
of total contract costs [as defined above]<br />
incurred to date and the estimated costs<br />
to complete.<br />
Income taxes<br />
Ag Growth and its subsidiaries are generally<br />
taxable under the statutes of their country<br />
of incorporation.<br />
Current income tax assets and liabilities for the<br />
current and prior period are measured at the<br />
amount expected to be recovered from or paid<br />
to the taxation authorities. The tax rates and<br />
tax laws used to compute the amount are those<br />
that are enacted or substantively enacted at<br />
the reporting date in the countries where Ag<br />
Growth operates and generates taxable income.<br />
Current income tax relating to items recognized<br />
directly in equity is recognized in equity and<br />
not in the consolidated statement of income.<br />
Management periodically evaluates positions<br />
taken in the tax returns with respect to situations<br />
in which applicable tax regulations are subject<br />
to interpretation and establishes provisions<br />
where appropriate.<br />
Ag Growth follows the liability method of<br />
accounting for deferred taxes. Under this<br />
method, income tax liabilities and assets are<br />
recognized for the estimated tax consequences<br />
attributable to the temporary differences<br />
between the carrying value of the assets and<br />
liabilities on the financial statements and their<br />
respective tax bases.
07 08 09 10 11<br />
53<br />
<strong>2012</strong> ANNUAL REPORT<br />
Deferred tax liabilities are recognized for all<br />
taxable temporary differences, except:<br />
• Where the deferred tax liability arises from<br />
the initial recognition of goodwill or of an<br />
asset or liability in a transaction that is not a<br />
business combination and, at the time of the<br />
transaction, affects neither the accounting<br />
profit nor the taxable profit or loss.<br />
• In respect of taxable temporary differences<br />
associated with investments in subsidiaries,<br />
where the timing of the reversal of the<br />
temporary differences can be controlled and it<br />
is probable that the temporary differences will<br />
not reverse in the foreseeable future.<br />
Deferred tax assets are recognized for all<br />
deductible temporary differences, carryforward<br />
of unused tax credits and unused tax losses, to<br />
the extent that it is probable that taxable profit<br />
will be available against which the deductible<br />
temporary differences and the carryforward of<br />
unused tax credits and unused tax losses can<br />
be utilized.<br />
The carrying amount of deferred tax assets is<br />
reviewed at each reporting date and reduced<br />
to the extent that it is no longer probable that<br />
sufficient taxable profit will be available to<br />
allow all or part of the deferred tax asset to<br />
be utilized. Unrecognized deferred tax assets<br />
are reassessed at each reporting date and are<br />
recognized to the extent that it has become<br />
probable that future taxable profits will allow<br />
the deferred tax asset to be recovered. Deferred<br />
tax assets and liabilities are measured at the<br />
tax rates that are expected to apply in the year<br />
when the asset is realized or the liability is<br />
settled, based on tax rates [and tax laws] that<br />
have been enacted or substantively enacted at<br />
the reporting date.<br />
Deferred tax items are recognized in correlation<br />
to the underlying transaction either in the<br />
consolidated statement of income, other<br />
comprehensive income or directly in equity<br />
Deferred tax assets and deferred tax liabilities<br />
are offset if a legally enforceable right exists<br />
to offset current tax assets against current<br />
income tax liabilities and the deferred taxes<br />
relate to the same taxable entity and the same<br />
taxation authority.<br />
Tax benefits acquired as part of a business<br />
combination, but not satisfying the criteria<br />
for separate recognition at that date, would<br />
be recognized subsequently if information<br />
about facts and circumstances changed.<br />
The adjustment would either be treated as a<br />
reduction to goodwill if it occurred during the<br />
measurement period or in profit or loss, when it<br />
occurs subsequent to the measurement period<br />
Sales tax<br />
Revenues, expenses and assets are recognized<br />
net of the amount of sales tax, except where<br />
the sales tax incurred on a purchase of<br />
assets or services is not recoverable from the<br />
taxation authority, in which case the sales tax<br />
is recognized as part of the cost of acquisition<br />
of the asset or as part of the expense item as<br />
applicable and where receivables and payables<br />
are stated with the amount of sales tax included.<br />
The net amount of sales tax recoverable from,<br />
or payable to, the taxation authority is included<br />
as part of receivables or payables in the<br />
consolidated statement of financial position<br />
Share-based compensation plans<br />
Employees of Ag Growth may receive<br />
remuneration in the form of share-based<br />
payment transactions, whereby employees<br />
render services and receive consideration in<br />
the form of equity instruments [equity-settled<br />
transactions, long-term incentive plan and<br />
directors deferred compensation plan] or<br />
cash [cash-settled transactions, share award<br />
incentive plan]. In situations where equity<br />
instruments are issued and some or all of the<br />
goods or services received by the entity as<br />
consideration cannot be specifically identified,<br />
the unidentified goods or services received are<br />
measured as the difference between the fair<br />
value of the share-based payment transaction<br />
and the fair value of any identifiable goods or<br />
services received at the grant date and are<br />
capitalized or expensed as appropriate.
54<br />
01 02 03 04 05<br />
financial statements<br />
Equity-settled transactions<br />
The cost of equity-settled transactions is<br />
recognized, together with a corresponding<br />
increase in other capital reserves, in equity,<br />
over the period in which the performance and/or<br />
service conditions are fulfilled.<br />
The cumulative expense recognized for equitysettled<br />
transactions at each reporting date<br />
until the vesting period reflects the extent to<br />
which the vesting period has expired and Ag<br />
Growth’s best estimate of the number of the<br />
shares that will ultimately vest. The expense or<br />
credit recognized for a period represents the<br />
movement in cumulative expense recognized<br />
as at the beginning and end of that period and<br />
is recognized in the consolidated statement of<br />
income in the respective function line. When<br />
options and other share-based compensation<br />
awards are exercised or exchanged, the<br />
amounts previously credited to contributed<br />
surplus are reversed and credited to<br />
shareholders’ equity. The amount of cash, if any,<br />
received from participants is also credited to<br />
shareholders’ equity.<br />
Where the terms of an equity-settled transaction<br />
award are modified, the minimum expense<br />
recognized is the expense as if the terms had not<br />
been modified, if the original terms of the award<br />
are met. An additional expense is recognized<br />
for any modification that increases the total fair<br />
value of the share-based payment transaction,<br />
or is otherwise beneficial to the employee as<br />
measured at the date of modification.<br />
Where an equity-settled award is cancelled, it is<br />
treated as if it vested on the date of cancellation<br />
and any expense not yet recognized for the<br />
award [being the total expense as calculated at<br />
the grant date] is recognized immediately. This<br />
includes any award where vesting conditions<br />
within the control of either the Company or the<br />
employee are not met. However, if a new award<br />
is substituted for the cancelled award, and<br />
designated as a replacement award on the date<br />
that it is granted, the cancelled and new awards<br />
are treated as if they were a modification of the<br />
original award.<br />
The dilutive effect of outstanding options is<br />
reflected as additional share dilution in the<br />
computation of diluted earnings per share.<br />
Cash-settled transactions<br />
The cost of cash-settled transactions is<br />
measured initially at fair value at the grant date<br />
using the Black-Scholes model. This fair value is<br />
expensed over the period until the vesting date,<br />
with recognition of a corresponding liability.<br />
The liability is remeasured to fair value at each<br />
reporting date up to and including the settlement<br />
date, with changes in fair value recognized in<br />
the consolidated statement of income in the<br />
line of the function the respective employee is<br />
engaged in.<br />
Post-retirement benefit plans<br />
Ag Growth contributes to retirement savings<br />
plans subject to maximum limits per employee.<br />
Ag Growth accounts for such defined<br />
contributions as an expense in the period in<br />
which the contributions are required to be<br />
made. Certain of Ag Growth’s plans classify<br />
as multi-employer plans and would ultimately<br />
provide the employee a defined benefit pension.<br />
However, based upon the evaluation of the<br />
available information, Ag Growth is not required<br />
to account for the plans in accordance with<br />
the defined benefit accounting rules, and<br />
accounts for such plans as it does defined<br />
contribution plans.<br />
Research and development expenses<br />
Research expenses, net of related tax credits,<br />
are charged to the consolidated statement<br />
of income in the period they are incurred.<br />
Development costs are charged to operations in<br />
the period of the expenditure unless they satisfy<br />
the condition for recognition as an internally<br />
generated intangible asset.<br />
Government grants<br />
Government grants are recognized at fair value<br />
where there is reasonable assurance that<br />
the grant will be received and all attaching<br />
conditions will be complied with. Where the<br />
grants relate to an asset, the fair value is<br />
credited to the cost of the asset and is released
07 08 09 10 11<br />
55<br />
<strong>2012</strong> ANNUAL REPORT<br />
to the consolidated statement of income over the<br />
expected useful life in a consistent manner with<br />
the depreciation method for the relevant assets.<br />
Investment tax credits<br />
Federal and provincial investment tax credits<br />
are accounted for as a reduction of the cost of<br />
the related assets or expenditures in the year in<br />
which the credits are earned and when there is<br />
reasonable assurance that the credits can be<br />
used to recover taxes.<br />
4. SIGNIFICANT ACCOUNTING<br />
JUDGMENTS, ESTIMATES AND<br />
ASSUMPTIONS<br />
The preparation of the consolidated financial<br />
statements requires management to make<br />
judgments, estimates and assumptions that<br />
affect the reported amounts of assets, liabilities,<br />
income, expenses and the disclosure of<br />
contingent liabilities. The estimates and related<br />
assumptions are based on previous experience<br />
and other factors considered reasonable under<br />
the circumstances, the results of which form the<br />
basis of making the assumptions about carrying<br />
values of assets and liabilities that are not<br />
readily apparent from other sources. However,<br />
uncertainty about these assumptions and<br />
estimates could result in outcomes that require<br />
a material adjustment to the carrying amount of<br />
the asset or liability affected in future periods.<br />
The estimates and underlying assumptions<br />
are reviewed on an ongoing basis. Revisions<br />
to accounting estimates are recognized in the<br />
period in which the estimate is revised if the<br />
revision affects only that period, or in the period<br />
of the revision and future periods if the revision<br />
affects both current and future periods. The<br />
key assumptions concerning the future and<br />
other key sources of estimation uncertainty at<br />
the reporting date that have a significant risk of<br />
causing a material adjustment to the carrying<br />
amounts of assets and liabilities within the next<br />
financial year are described below.<br />
Impairment of non-financial assets<br />
Ag Growth’s impairment test is based on value<br />
in use or fair value less cost to sell calculations<br />
that use a discounted cash flow model. The<br />
cash flows are derived from the forecast for the<br />
next five years and do not include restructuring<br />
activities to which Ag Growth has not yet<br />
committed or significant future investments that<br />
will enhance the asset’s performance of the CGU<br />
being tested. These calculations require the use<br />
of estimates and forecasts of future cash flows.<br />
Qualitative factors, including market presence<br />
and trends, strength of customer relationships,<br />
strength of local management, strength of debt<br />
and capital markets, and degree of variability<br />
in cash flows, as well as other factors, are<br />
considered when making assumptions with<br />
regard to future cash flows and the appropriate<br />
discount rate. The recoverable amount is most<br />
sensitive to the discount rate, as well as the<br />
forecasted margins and growth rate used for<br />
extrapolation purposes. A change in any of<br />
the significant assumptions or estimates used<br />
to evaluate goodwill and other non-financial<br />
assets could result in a material change to the<br />
results of operations. The key assumptions used<br />
to determine the recoverable amount for the<br />
different CGUs are further explained in note 12.<br />
Development costs<br />
Development costs are capitalized in<br />
accordance with the accounting policy<br />
described in note 3. Initial capitalization of<br />
costs is based on management’s judgment<br />
that technical and economical feasibility is<br />
confirmed, usually when a project has reached<br />
a defined milestone according to an established<br />
project management model.<br />
Useful lives of key property, plant and<br />
equipment and intangible assets<br />
The depreciation method and useful lives reflect<br />
the pattern in which management expects the<br />
asset’s future economic benefits to be consumed<br />
by Ag Growth. Refer to note 3 for the estimated<br />
useful lives.<br />
Fair value of financial instruments<br />
Where the fair value of financial assets and<br />
financial liabilities recorded in the consolidated
56<br />
01 02 03 04 05<br />
financial statements<br />
statement of financial position cannot be derived<br />
from active markets, it is determined using<br />
valuation techniques including the discounted<br />
cash flow models. The inputs to these models<br />
are taken from observable markets where<br />
possible, but where this is not feasible, a degree<br />
of judgment is required in establishing fair<br />
values. The judgments include considerations<br />
of inputs such as liquidity risk, credit risk and<br />
volatility. Changes in assumptions about these<br />
factors could affect the reported fair value of<br />
financial instruments.<br />
Share-based payments<br />
Ag Growth measures the cost of equity-settled<br />
share-based payment transactions with<br />
employees by reference to the fair value of<br />
equity instruments at the grant date, whereas<br />
the fair value of cash-settled share-based<br />
payments is remeasured at every reporting date.<br />
Estimating fair value for share-based payments<br />
requires determining the most appropriate<br />
valuation model for a grant of these instruments,<br />
which is dependent on the terms and conditions<br />
of the grant. This also requires determining the<br />
most appropriate inputs to the valuation model<br />
including the expected life of the option, volatility<br />
and dividend yield.<br />
Income taxes<br />
Uncertainties exist with respect to the<br />
interpretation of complex tax regulations,<br />
changes in tax laws and the amount and<br />
timing of future taxable income. Given the wide<br />
range of international business relationships<br />
and the long-term nature and complexity of<br />
existing contractual agreements, differences<br />
arising between the actual results and the<br />
assumptions made, or future changes to<br />
such assumptions, could necessitate future<br />
adjustments to taxable income and expenses<br />
already recorded. Ag Growth establishes<br />
provisions, based on reasonable estimates,<br />
for possible consequences of audits by the tax<br />
authorities of the respective countries in which<br />
it operates. The amount of such provisions is<br />
based on various factors, such as experience of<br />
previous tax audits and differing interpretations<br />
of tax regulations by the taxable entity and the<br />
responsible tax authority.<br />
Such differences of interpretation may arise<br />
on a wide variety of issues, depending on<br />
the conditions prevailing in the respective<br />
company’s domicile. As Ag Growth assesses<br />
the probability for litigation and subsequent<br />
cash outflow with respect to taxes as remote,<br />
no contingent liability has been recognized.<br />
Deferred tax assets are recognized for all<br />
unused tax losses to the extent that it is probable<br />
that taxable profit will be available against<br />
which the losses can be utilized. Significant<br />
management judgment is required to determine<br />
the amount of deferred tax assets that can be<br />
recognized, based upon the likely timing and<br />
the level of future taxable profits together with<br />
future tax planning strategies.<br />
Acquisition accounting<br />
For acquisition accounting purposes, all<br />
identifiable assets, liabilities and contingent<br />
liabilities acquired in a business combination<br />
are recognized at fair value at the date of<br />
acquisition. Estimates are used to calculate the<br />
fair value of these assets and liabilities as of the<br />
date of acquisition. Contingent consideration<br />
resulting from business combinations is valued<br />
at fair value at the acquisition date as part of the<br />
business combination. Where the contingent<br />
consideration meets the definition of a derivative<br />
and, thus, a financial liability, it is subsequently<br />
remeasured to fair value at each reporting date.<br />
The determination of the fair value is based on<br />
discounted cash flows. The key assumptions<br />
take into consideration the probability of<br />
meeting each performance target and the<br />
discount factor.<br />
5. STANDARDS ISSUED BUT NOT<br />
YET EFFECTIVE<br />
Standards issued but not yet effective up to<br />
the date of issuance of the Company’s financial<br />
statements are listed below. This listing is of<br />
standards and interpretations issued, which the<br />
Company reasonably expects to be applicable<br />
at a future date. The Company intends to adopt<br />
those standards when they become effective.
07 08 09 10 11<br />
57<br />
<strong>2012</strong> ANNUAL REPORT<br />
Financial instruments: classification<br />
and measurement [“IFRS 9”]<br />
IFRS 9 as issued reflects the first phase of the<br />
IASB’s work on the replacement of the existing<br />
standard for financial instruments [“IAS 39”]<br />
and applies to classification and measurement<br />
of financial assets and liabilities as defined in<br />
IAS 39. The standard is effective for annual<br />
periods beginning on or after January 1, 2015.<br />
In subsequent phases, the IASB will address<br />
classification and measurement of hedge<br />
accounting. The adoption of the first phase of<br />
IFRS 9 will have an effect on the classification<br />
and measurement of Ag Growth’s financial<br />
assets. The Company will quantify the effect in<br />
conjunction with the other phases, when issued,<br />
to present a comprehensive picture.<br />
Employee benefits [“IAS 19”]<br />
On June 16, 2011, the IASB revised IAS 19,<br />
Employee Benefits. The revisions include the<br />
elimination of the option to defer the recognition<br />
of gains and losses, enhancing the guidance<br />
around measurement of plan assets and defined<br />
benefit obligations, streamlining the presentation<br />
of changes in assets and liabilities arising<br />
from defined benefit plans and introduction<br />
of enhanced disclosures for defined benefit<br />
plans. The amendments are effective for annual<br />
periods beginning on or after January 1, 2013.<br />
The Company is in the process of finalizing the<br />
impact of the amendments on its consolidated<br />
financial statements.<br />
Offsetting Financial Assets<br />
and Liabilities<br />
In December 2011, the IASB issued amendments<br />
to IAS 32, Financial Instruments: Presentation.<br />
The amendments are intended to clarify certain<br />
aspects of the existing guidance on offsetting<br />
financial assets and financial liabilities due to<br />
the diversity in application of the requirements<br />
on offsetting. The IASB also amended IFRS<br />
7 to require information about all recognized<br />
financial instruments that are set off in<br />
accordance with IAS 32. The amendments<br />
also require disclosure of information about<br />
recognized financial instruments subject to<br />
enforceable master netting arrangements and<br />
similar agreements even if they are not set off<br />
under IAS 32.<br />
The new offsetting disclosure requirements are<br />
effective for annual periods beginning on or<br />
after January 1, 2013 and interim periods within<br />
those annual periods. The amendments need to<br />
be provided retrospectively to all comparative<br />
periods. The Corporation is currently assessing<br />
the impact of adopting these amendments on the<br />
consolidated financial statements.<br />
IFRS 10 Consolidated<br />
Financial Statements<br />
IFRS 10 replaces the portion of IAS 27,<br />
Consolidated and Separate Financial Statements<br />
that addresses the accounting for consolidated<br />
financial statements. It also includes the<br />
issues raised in SIC-12, Consolidation - Special<br />
Purpose Entities. What remains in IAS 27 is<br />
limited to accounting for subsidiaries, jointly<br />
controlled entities, and associates in separate<br />
financial statements. IFRS 10 establishes a<br />
single control model that applies to all entities<br />
[including “special purpose entities” or<br />
“structured entity” as they are now referred<br />
to in the new standards, or “variable interest<br />
entities” as they are referred to in US GAAP].<br />
The changes introduced by IFRS 10 will require<br />
management to exercise significant judgment<br />
to determine which entities are controlled,<br />
and therefore are required to be consolidated<br />
by a parent, compared with the requirements<br />
of IAS 27. Under IFRS 10, an investor controls<br />
an investee when it is exposed, or has rights,<br />
to variable returns from its involvement with<br />
the investee and has the ability to affect those<br />
returns through its power over the investee.<br />
This principle applies to all investees, including<br />
structured entities.<br />
IFRS 10 is effective for annual periods<br />
commencing on or after January 1, 2013. The<br />
Company is in the process of finalizing the<br />
impact of this new standard, if any.<br />
IFRS 11 Joint Arrangements<br />
IFRS 11 replaces IAS 3l, Interests in Joint<br />
Ventures and SIC-13, Jointly-controlled Entities -<br />
Non-monetary Contributions by Venturers. IFRS<br />
11 uses some of the terms that were used by IAS<br />
31, but with different meanings. Whereas IAS
58<br />
01 02 03 04 05<br />
financial statements<br />
31 identified three forms of joint ventures [i.e.,<br />
jointly controlled operations, jointly controlled<br />
assets and jointly controlled entities], IFRS 11<br />
addresses only two forms of joint arrangements<br />
[joint operations and joint ventures] where<br />
there is joint control. IFRS 11 defines joint<br />
control as the contractually agreed sharing<br />
of control of an arrangement that exists only<br />
when the decisions about the relevant activities<br />
require the unanimous consent of the parties<br />
sharing control.<br />
Because IFRS 11 uses the principle of control in<br />
IFRS 10 to define joint control, the determination<br />
of whether joint control exists may change. In<br />
addition, IFRS 11 removes the option to account<br />
for jointly controlled entities [“JCEs”] using<br />
proportionate consolidation. Instead, JCEs<br />
that meet the definition of a joint venture must<br />
be accounted for using the equity method. For<br />
joint operations [which includes former jointly<br />
controlled operations, jointly controlled assets,<br />
and potentially some former JCEs], an entity<br />
recognizes its assets, liabilities, revenues and<br />
expenses, and/or its relative share of those<br />
items, if any. In addition, when specifying the<br />
appropriate accounting, IAS 31 focused on the<br />
legal form of the entity, whereas IFRS 11 focuses<br />
on the nature of the rights and obligations<br />
arising from the arrangement.<br />
IFRS 11 is effective for annual periods<br />
commencing on or after January 1, 2013. The<br />
Company is in the process of finalizing the<br />
impact of this new standard, if any.<br />
IFRS 12 Disclosure of Interests in<br />
Other Entities<br />
IFRS 12 includes all of the disclosures that were<br />
previously in IAS 27 related to consolidated<br />
financial statements, as well as all of the<br />
disclosures that were previously included in IAS<br />
31 and IAS 28, Investment in Associates. These<br />
disclosures relate to an entity’s interests in<br />
subsidiaries, joint arrangements, associates and<br />
structured entities. A number of new disclosures<br />
are also required. One of the most significant<br />
changes introduced by IFRS 12 is that an entity is<br />
now required to disclose the judgments made to<br />
determine whether it controls another entity.<br />
IFRS 12 is effective for annual periods<br />
commencing on or after January 1, 2013. The<br />
Company is in the process of finalizing the impact<br />
of this new standard, which will be limited to<br />
disclosure requirements for the consolidated<br />
financial statements.<br />
IFRS 13 Fair Value Measurement<br />
IFRS 13 does not change when an entity is<br />
required to use fair value, but rather, provides<br />
guidance on how to measure the fair value of<br />
financial and non-financial assets and liabilities<br />
when required or permitted by IFRS. While many<br />
of the concepts in IFRS 13 are consistent with<br />
current practice, certain principles, such as the<br />
prohibition on blockage discounts for all fair value<br />
measurements, could have a significant effect.<br />
The disclosure requirements are substantial and<br />
could present additional challenges.<br />
IFRS 13 is effective for annual periods<br />
commencing on or after January 1, 2013 and will<br />
be applied prospectively. The Company is in the<br />
process of finalizing the impact of this<br />
new standard.<br />
6. BUSINESS<br />
COMBINATIONS 2011<br />
[a] Airlanco Inc. [“Airlanco”]<br />
Effective October 4, 2011, the Company acquired<br />
substantially all of the operating assets of<br />
Airlanco, a manufacturer of grain drying systems.<br />
The Company acquired Airlanco to expand its<br />
catalogue of aeration and dust collection products.<br />
The purchase has been accounted for by the<br />
acquisition method with the results of Airlanco’s<br />
operations included in the Company’s net earnings<br />
from the date of acquisition. The assets and<br />
liabilities of Airlanco on the date of acquisition<br />
have been recorded in the consolidated financial<br />
statements at their estimated fair values as follows:
07 08 09 10 11<br />
59<br />
<strong>2012</strong> ANNUAL REPORT<br />
Accounts receivable 1,549<br />
Inventory 2,134<br />
Prepaid expenses and other 126<br />
Property, plant and equipment 1,747<br />
Intangible assets<br />
Distribution network 3,090<br />
Brand name 1,608<br />
Order backlog 21<br />
Patents 4<br />
Goodwill 3,087<br />
Accounts payable and accrued<br />
liabilities (1,192)<br />
Customer deposits (204)<br />
$<br />
11,970<br />
The goodwill of $3,087 comprises the value of<br />
expected synergies arising from the acquisition<br />
and the values included in the workforce of<br />
the new subsidiary. The goodwill balance was<br />
allocated to the Airlanco CGU and is expected to<br />
be deductible for tax purposes.<br />
From the date of acquisition, Airlanco<br />
contributed $2,701 of revenue and a net loss<br />
before tax of $92 to the 2011 results of the<br />
Company. If the acquisition had taken place<br />
as at January 1, 2011, revenue and profit from<br />
continuing operations would have increased by<br />
$9,766 and $2,088, respectively.<br />
The consideration transferred of $11,970 was<br />
paid in cash. The impacts on the cash flow on<br />
the acquisition of Airlanco are as follows:<br />
$<br />
Transaction costs of the acquisition 160<br />
Purchase consideration<br />
transferred 11,970<br />
Net cash flow on acquisition 12,130<br />
In the three-month period ended December 31,<br />
<strong>2012</strong>, the conditions related to the cash holdback<br />
were met and the Company transferred $508 of<br />
restricted cash to the vendors [note 16].<br />
As at December 31, <strong>2012</strong>, there are no restricted<br />
funds remaining.<br />
7. BUSINESS<br />
COMBINATIONS 2010<br />
[a] Mepu<br />
Effective April 29, 2010, the Company acquired<br />
100% of the outstanding shares of Mepu,<br />
a manufacturer of grain drying systems.<br />
The acquisition of Mepu provides the Company<br />
with a complementary product line, distribution<br />
in a region where the Company previously had<br />
only limited representation and a corporate<br />
footprint near the growth markets of Russia and<br />
Eastern Europe.<br />
The purchase consideration in the amount of<br />
$11,274 was paid in cash, net of a one-year<br />
holdback of $572.<br />
In the year ended December 31, 2011, the<br />
conditions related to the cash holdback were<br />
met and the Company transferred $572 from cash<br />
held in trust to the vendors. As at December 31,<br />
<strong>2012</strong> and 2011, there are no remaining funds held<br />
in trust.<br />
[b] Franklin Enterprises Ltd. [“Franklin”]<br />
Effective October 1, 2010, the Company acquired<br />
substantially all of the operating assets of<br />
Franklin, a custom manufacturer. The Company<br />
acquired Franklin to enhance its manufacturing<br />
capabilities and to increase production capacity<br />
in periods of high in-season demand.<br />
The purchase consideration in the amount<br />
of $8,856 was paid in cash, net of a one-year<br />
holdback of $250.<br />
In the year ended December 31, 2011, the<br />
conditions related to the cash holdback were<br />
met and the Company transferred $250 cash<br />
held in trust to the vendors. As at December 31,<br />
<strong>2012</strong> and 2011 there are no remaining funds held<br />
in trust.<br />
[c] Tramco, Inc. [“Tramco”]<br />
Effective December 20, 2010, the Company<br />
acquired 100% of the outstanding shares of
60<br />
01 02 03 04 05<br />
financial statements<br />
Tramco, a manufacturer of chain conveyors. Tramco is an industry leader<br />
and provides the Company with an entry point into the grain processing<br />
sector of the food supply chain.<br />
The impacts on the cash flow on acquisition of Tramco are as follows:<br />
$<br />
Purchase consideration paid in 2010 9,168<br />
Purchase consideration paid in 2011 9,930<br />
Transferred to cash held in trust 995<br />
Transaction costs of the acquisition paid in 2010 339<br />
Transaction costs of the acquisition paid in 2011 164<br />
Net cash flow on acquisition 20,596<br />
Transaction costs of the acquisition are included in cash flows from<br />
investing activities. At the request of the vendor, the purchase price<br />
was paid in two installments. In the year ended December 31, <strong>2012</strong>, the<br />
conditions related to the cash holdback were met and the Company<br />
transferred $1,017 restricted cash to the vendors. As at December 31, <strong>2012</strong>,<br />
there are no restricted funds remaining.<br />
8. OTHER EXPENSES (INCOME)<br />
<strong>2012</strong> 2011<br />
$ $<br />
[a] Other operating expense (income)<br />
Cash flow hedge accounting — 126<br />
Net loss on disposal of property, plant<br />
and equipment 32 76<br />
Other (154) (302)<br />
(122) (100)<br />
[b] Finance expense (income)<br />
Interest expense (income) from banks 12 (117)<br />
Loss (gain) on foreign exchange (785) 276<br />
(773) 159<br />
[c] Finance costs<br />
Interest on overdrafts and other<br />
finance costs 125 51<br />
Interest, including non-cash interest,<br />
on debts and borrowings 2,533 2,377<br />
Interest, including non-cash interest,<br />
on convertible debentures [note 23] 10,397 10,220<br />
Finance charges payable under<br />
finance lease contracts 3 20<br />
13,058 12,668
07 08 09 10 11<br />
61<br />
<strong>2012</strong> ANNUAL REPORT<br />
[d] Cost of goods sold<br />
<strong>2012</strong> 2011<br />
$ $<br />
Depreciation 5,596 4,933<br />
Amortization of intangible assets 243 503<br />
Warranty provision 198 280<br />
Cost of inventories recognized as an expense 213,162 198,487<br />
[e] Selling, general and administrative expenses<br />
219,199 204,203<br />
Depreciation 565 485<br />
Amortization of intangible assets 3,606 3,273<br />
Minimum lease payments recognized for<br />
operating leases<br />
1,048 943<br />
Transaction costs — 1,676<br />
Selling, general and administrative 50,858 48,449<br />
[f] Employee benefits expense<br />
56,077 54,826<br />
Wages and salaries 81,889 67,085<br />
Share-based payment expense [note 21] 1,174 2,038<br />
Pension costs 1,950 1,925<br />
85,013 71,048<br />
Included in cost of goods sold 52,301 48,013<br />
Included in general and administrative expense 32,712 23,035<br />
85,013 71,048
62<br />
01 02 03 04 05<br />
financial statements<br />
9. PROPERTY, PLANT AND EQUIPMENT<br />
Land Grounds Buildings<br />
Leasehold<br />
improvements<br />
Furniture<br />
and fixtures<br />
Vehicles<br />
Computer<br />
hardware<br />
Manufacturing<br />
equipment<br />
Construction<br />
in progress<br />
Total<br />
$ $ $ $ $ $ $ $<br />
COST<br />
Balance, January 1, <strong>2012</strong> 4,751 597 37,180 466 1,148 6,375 2,501 46,800 277 100,095<br />
Additions — 58 673 1,566 229 167 205 2,045 (233) 4,710<br />
Disposals — — — — (9) (370) (41) (162) — (582)<br />
Exchange differences (44) (6) (263) (9) (5) (17) (16) (705) (5) (1,070)<br />
Balance, December 31, <strong>2012</strong> 4,707 649 37,590 2,023 1,363 6,155 2,649 47,978 39 103,153<br />
DEPRECIATION<br />
Balance, January 1, <strong>2012</strong> — 190 2,446 270 406 2,502 1,418 9,429 — 16,661<br />
Depreciation charge for the year — 74 1,108 108 137 689 363 3,682 — 6,161<br />
Disposals — — — — (5) (268) (33) (86) — (392)<br />
Exchange differences — — (14) (5) (1) (5) (7) (99) — (131)<br />
Balance, December 31, <strong>2012</strong> — 264 3,540 373 537 2,918 1,741 12,926 — 22,299<br />
Net book value, January 1, <strong>2012</strong> 4,751 407 34,734 196 742 3,873 1,083 37,371 277 83,434<br />
Net book value, December 31, <strong>2012</strong> 4,707 385 34,050 1,650 826 3,237 908 35,052 39 80,854
07 08 09 10 11<br />
63<br />
<strong>2012</strong> ANNUAL REPORT<br />
Land Grounds Buildings<br />
Leasehold<br />
improvements<br />
Furniture<br />
and fixtures<br />
Vehicles<br />
Computer<br />
hardware<br />
Manufacturing<br />
equipment<br />
Construction<br />
in progress<br />
$ $ $ $ $ $ $ $<br />
COST<br />
Balance, January 1, 2011 4,777 488 27,599 431 982 5,283 1,948 31,548 17,589 90,645<br />
Additions 61 35 9,730 35 80 1,043 525 15,039 (17,294) 9,254<br />
Acquisitions of a subsidiary 52 71 764 — 65 101 25 668 — 1,746<br />
Classification as assets held for sale (146) — (1,089) — — — — — — (1,235)<br />
Disposals — — — — — (164) (24) (724) — (912)<br />
Exchange differences 7 3 176 — 21 112 27 269 (18) 597<br />
Balance, December 31, 2011 4,751 597 37,180 466 1,148 6,375 2,501 46,800 277 100,095<br />
DEPRECIATION<br />
Balance, January 1, 2011 — 124 1,492 196 295 1,889 1,115 6,512 — 11,623<br />
Depreciation charge for the year — 65 1,055 71 105 673 308 3,141 — 5,418<br />
Classification as assets held for sale — — (134) — — — — — — (134)<br />
Disposals — — — — — (68) (16) (262) — (346)<br />
Exchange differences — 1 33 3 6 8 11 38 — 100<br />
Balance, December 31, 2011 — 190 2,446 270 406 2,502 1,418 9,429 — 16,661<br />
Net book value, January 1, 2011 4,777 364 26,107 235 687 3,394 833 25,036 17,589 79,022<br />
Net book value, December 31, 2011 4,751 407 34,734 196 742 3,873 1,083 37,371 277 83,434<br />
Construction in progress is comprised primarily of building and equipment.<br />
Ag Growth regularly assesses its long-lived assets for impairment. As at December 31, <strong>2012</strong> and 2011, the recoverable amount of each CGU exceeded the<br />
carrying amounts of the assets allocated to the respective units.<br />
Total
64<br />
01 02 03 04 05<br />
financial statements<br />
Capitalized borrowing costs<br />
No borrowing costs were capitalized in 2011 or <strong>2012</strong>.<br />
Finance leases<br />
Included in manufacturing equipment is equipment held under finance leases, the carrying value of which at December 31, <strong>2012</strong> was nil [2011 - $131].<br />
Leased assets are pledged as security for the related finance lease liabilities.<br />
10. INTANGIBLE ASSETS<br />
Distribution<br />
networks Brand names Patents Software Order backlog<br />
Development<br />
projects<br />
Total<br />
$ $ $ $ $ $ $<br />
COST<br />
Balance, January 1, <strong>2012</strong> 55,633 34,314 1,162 1,117 666 2,010 94,902<br />
Internal development — — — — — 1,426 1,426<br />
Acquisition — — — 190 — — 190<br />
Exchange differences (364) (209) (21) (24) — (39) (657)<br />
Balance, December 31, <strong>2012</strong> 55,269 34,105 1,141 1,283 666 3,397 95,861<br />
AMORTIZATION<br />
Balance, January 1, <strong>2012</strong> 17,874 — 665 140 666 47 19,392<br />
Amortization charge for the year 3,459 — 89 154 — 147 3,849<br />
Exchange differences (143) — (10) (4) — — (157)<br />
Balance, December 31, <strong>2012</strong> 21,190 — 744 290 666 194 23,084<br />
Net book value, December 31, <strong>2012</strong> 34,079 34,105 397 993 — 3,203 72,777
07 08 09 10 11<br />
65<br />
<strong>2012</strong> ANNUAL REPORT<br />
Distribution<br />
networks<br />
Brand<br />
names Patents Software<br />
Order<br />
backlog<br />
Development<br />
projects<br />
$ $ $ $ $ $ $<br />
COST<br />
Balance, January 1, 2011 52,346 32,582 1,138 1,092 628 — 87,786<br />
Internal development — — — — — 2,011 2,011<br />
Acquisition 3,090 1,608 4 — 21 — 4,723<br />
Exchange differences 197 124 20 25 17 (1) 382<br />
Balance, December 31, 2011 55,633 34,314 1,162 1,117 666 2,010 94,902<br />
AMORTIZATION<br />
Balance, January 1, 2011 14,509 — 568 — 364 — 15,441<br />
Amortization charge for the year 3,226 — 87 135 281 47 3,776<br />
Exchange differences 139 — 10 5 21 — 175<br />
Balance, December 31, 2011 17,874 — 665 140 666 47 19,392<br />
Net book value, December 31, 2011 37,759 34,314 497 977 — 1,963 75,510<br />
Total<br />
The Company is continuously working on research and development<br />
projects. Development costs capitalized include the development of new<br />
products and the development of new applications of already existing<br />
products and prototypes. Research costs and development costs that are<br />
not eligible for capitalization have been expensed and are recognized in<br />
selling, general and administrative expenses.<br />
Intangible assets include patents acquired through business combinations,<br />
which have a remaining life of five years. All brand names with a carrying<br />
amount of $34,105 [2011 – $34,314] have been qualified as indefinite useful<br />
life intangible assets, as the Company expects to maintain these brand<br />
names and currently no end point of the useful lives of these brand names<br />
can be determined. The Company assesses the assumption of an indefinite<br />
useful life at least annually. For definite life intangibles, the Company<br />
assesses whether there are indicators of impairment at subsequent<br />
reporting dates as a triggering event for performing an impairment test.<br />
Other significant intangible assets are goodwill [note 11] and the<br />
distribution network of the Company. The distribution network was acquired<br />
in past business combinations and reflects the Company’s dealer network in<br />
North America and the dealer network of the Mepu operating division. The<br />
remaining amortization period for the distribution network ranges from 3 to<br />
18 years.<br />
As of the reporting date, the Company had no contractual commitments for<br />
the acquisition of intangible assets.
66<br />
01 02 03 04 05<br />
financial statements<br />
11. GOODWILL<br />
<strong>2012</strong> 2011<br />
$ $<br />
Balance, beginning of year 65,876 62,355<br />
Additions - acquisition of subsidiary — 3,087<br />
Exchange differences (587) 434<br />
Impairment of goodwill [note 12] (1,890) —<br />
Balance, end of year 63,399 65,876<br />
12. IMPAIRMENT TESTING<br />
The Company performs its annual goodwill impairment test as at<br />
December 31 on all CGUs. The recoverable amount of the CGUs has been<br />
determined based on value in use for the year ended December 31, <strong>2012</strong>,<br />
using cash flow projections covering a five-year period. The various pre-tax<br />
discount rates applied to the cash flow projections are between 12.0%<br />
and 16.3% [2011 – 11.8% and 17.1%] and cash flows beyond the five-year<br />
period are extrapolated using a 3% growth rate [2011 – 3%], which is<br />
management’s estimate of long-term inflation and productivity growth in<br />
the industry and geographies in which it operates.<br />
On December 31, <strong>2012</strong>, the Company performed its annual goodwill<br />
impairment test. Mepu’s results in 2011 were negatively impacted by<br />
regional weather conditions and in <strong>2012</strong> the division experienced margin<br />
compression due largely to the impact of new product development.<br />
Considering these factors and their impact on the annual goodwill<br />
impairment test, the Company concluded that goodwill was impaired and,<br />
in the fourth quarter, recorded a $1.9 million non-cash goodwill impairment<br />
charge to income.<br />
The Company’s CGUs and goodwill and indefinite life intangible assets<br />
allocated thereto are as follows:<br />
<strong>2012</strong> 2011<br />
$ $<br />
Westfield<br />
Goodwill 30,435 30,435<br />
Intangible assets with indefinite lives 19,000 19,000<br />
Edwards<br />
Goodwill 6,438 6,438<br />
Intangible assets with indefinite lives 5,163 5,163<br />
Hi Roller<br />
Goodwill 5,467 5,588<br />
Intangible assets with indefinite lives 3,224 3,296<br />
Union Iron<br />
Goodwill 8,021 8,199<br />
Intangible assets with indefinite lives 2,145 2,193<br />
Tramco<br />
Goodwill 7,288 7,450<br />
Intangible assets with indefinite lives 2,308 2,360<br />
Other<br />
Goodwill 5,750 7,766<br />
Intangible assets with indefinite lives 2,265 2,302<br />
Total<br />
Goodwill 63,399 65,876<br />
Intangible assets with indefinite lives 34,105 34,314
07 08 09 10 11<br />
67<br />
<strong>2012</strong> ANNUAL REPORT<br />
Key assumptions used in valuation calculations<br />
The calculation of value in use or fair value less cost to sell for all the CGUs<br />
is most sensitive to the following assumptions:<br />
• Gross margins;<br />
• Discount rates;<br />
• Market share during the budget period; and<br />
• Growth rate used to extrapolate cash flows beyond the budget period.<br />
Gross margins<br />
Forecasted gross margins are based on actual gross margins achieved in<br />
the years preceding the forecast period. Margins are kept constant over the<br />
forecast period and the terminal period, unless management has started an<br />
efficiency improvement process.<br />
Discount rates<br />
Discount rates reflect the current market assessment of the risks specific to<br />
each CGU. The discount rate was estimated based on the weighted average<br />
cost of capital for the industry. This rate was further adjusted to reflect<br />
the market assessment of any risk specific to the CGU for which future<br />
estimates of cash flows have not been adjusted.<br />
Market share assumptions<br />
These assumptions are important because, as well as using industry data<br />
for growth rates [as noted below], management assesses how the CGU’s<br />
position, relative to its competitors, might change over the forecast period.<br />
Growth rate estimates<br />
Rates are based on published research and are primarily derived from the<br />
long-term Consumer Price Index expectations for the markets in which<br />
Ag Growth operates. Management considers Consumer Price Index to<br />
be a conservative indicator of the long-term growth expectations for the<br />
agricultural industry.<br />
13. ASSETS HELD FOR SALE<br />
In 2010, Ag Growth transferred all production activities from its Lethbridge,<br />
Alberta facility to Nobleford, Alberta. Ag Growth concluded that the land<br />
and building in Lethbridge, Alberta, Canada met the definition of an asset<br />
held for sale. The carrying amounts of the assets as presented in the<br />
consolidated statement of financial position solely consist of the land<br />
and building. The land carrying value is $146 as at December 31, <strong>2012</strong><br />
[2011 – $146]. The building carrying value is $955 as at December 31,<br />
<strong>2012</strong> [2011 – $955].<br />
14. AVAILABLE-FOR-SALE INVESTMENT<br />
On December 22, 2009, the Company purchased two million common shares<br />
at $1.00 per share in a private Canadian corporate farming organization<br />
[“Investco”]. The Company’s investment represents approximately 2.0%<br />
of the outstanding shares of Investco. At this point in time, management<br />
intends to hold the investment for an indefinite period of time.<br />
During the year ended December 31, 2011, Investco completed a private<br />
placement of 22,193,921 common shares at $1.40 per common share.<br />
The private placement included a large number of unrelated parties and<br />
increased Investco’s outstanding common shares by approximately 40%.<br />
The private placement was determined to represent a quoted market<br />
price as at December 31, 2011, and as a result the Company assessed<br />
the fair value of its 2,000,000 common shares at $1.40 per common share.<br />
Accordingly, the Company increased the value of its investment by $800<br />
with the offsetting amount recorded in other comprehensive income.
68<br />
01 02 03 04 05<br />
financial statements<br />
Subsequent to December 31, <strong>2012</strong>, Investco issued common shares at $1.00<br />
per common share as partial consideration for an acquisition of a business.<br />
The acquiree was an unrelated third party and the share issuance was<br />
considered to represent a quoted market price and as a result the Company<br />
assessed the fair value of its 2,000,000 common shares at $1.00 per common<br />
share. Accordingly, the Company decreased the value of its investment by<br />
$800 with the offsetting amount recorded in other comprehensive income.<br />
15. CASH AND CASH EQUIVALENTS/CHANGES IN<br />
NON-CASH WORKING CAPITAL<br />
Cash and cash equivalents as at the date of the consolidated statement of<br />
financial position and for the purpose of the consolidated statement of cash<br />
flows relate to cash at banks and cash on hand.<br />
Cash at banks earns interest at floating rates based on daily bank<br />
deposit rates.<br />
The change in the non-cash working capital balances related to operations<br />
is calculated as follows:<br />
<strong>2012</strong> 2011<br />
$ $<br />
Accounts receivable (2,165) (9,607)<br />
Inventory 6,045 (9,850)<br />
Prepaid expenses and other assets 1,075 5,034<br />
Accounts payable and accrued liabilities (4,913) (1,755)<br />
Customer deposits (3,035) 1,445<br />
Provisions 198 280<br />
(2,795) (14,453)<br />
16. RESTRICTED CASH<br />
Restricted cash of $34 relates to the long-term incentive plan [note 21].<br />
Restricted cash of $2,439 in 2011 consisted of holdbacks related to the<br />
acquisitions of Tramco and Airlanco, $885 of funds advanced to Ag Growth<br />
as collateral for a receivable from an end user of Ag Growth products, and<br />
$29 related to the long-term incentive plan.<br />
17. ACCOUNTS RECEIVABLE<br />
As is typical in the agriculture sector, Ag Growth may offer extended terms<br />
on its accounts receivable to match the cash flow cycle of its customer.<br />
The following table sets forth details of the age of trade accounts<br />
receivable that are not overdue, as well as an analysis of overdue amounts<br />
and the related allowance for doubtful accounts:<br />
<strong>2012</strong> 2011<br />
$ $<br />
Total accounts receivable 52,449 50,188<br />
Less allowance for doubtful accounts (593) (497)<br />
Total accounts receivable, net 51,856 49,691<br />
Of which<br />
Neither impaired nor past due 33,672 33,412<br />
Not impaired and past the due date as follows:<br />
Within 30 days 9,709 9,356<br />
31 to 60 days 4,095 2,761<br />
61 to 90 days 1,932 957<br />
Over 90 days 3,041 3,702<br />
Less allowance for doubtful accounts (593) (497)<br />
Total accounts receivable, net 51,856 49,691
07 08 09 10 11<br />
69<br />
<strong>2012</strong> ANNUAL REPORT<br />
Trade receivables assessed to be impaired are included as an allowance<br />
in selling, general and administrative expenses in the period of the<br />
assessment. The movement in the Company’s allowance for doubtful<br />
accounts for the years ended December 31, <strong>2012</strong> and December 31, 2011<br />
was as follows:<br />
<strong>2012</strong> 2011<br />
$ $<br />
Balance, beginning of year 497 484<br />
Additional provision recognized 100 10<br />
Amounts written off during the period<br />
as uncollectible 25 34<br />
Amounts recovered during the period (3) (1)<br />
Unused provision reversed (22) (33)<br />
Exchange differences (4) 3<br />
Balance, end of year 593 497<br />
18. INVENTORY<br />
<strong>2012</strong> 2011<br />
$ $<br />
Raw materials 33,518 37,159<br />
Finished goods 24,995 27,399<br />
58,513 64,558<br />
19. PROVISIONS<br />
Provisions consist of the Company’s warranty provision. A provision is<br />
recognized for expected claims on products sold based on past experience<br />
of the level of repairs and returns. It is expected that most of these costs<br />
will be incurred in the next financial year. Assumptions used to calculate<br />
the provision for warranties were based on current sales levels and current<br />
information available about returns.<br />
<strong>2012</strong> 2011<br />
$ $<br />
Balance, beginning of year 2,222 1,942<br />
Costs recognized 3,419 3,032<br />
Amounts charged against provision (3,221) (2,752)<br />
Balance, end of year 2,420 2,222<br />
20. EQUITY<br />
[a] Common shares<br />
Authorized<br />
Unlimited number of voting common shares without par value<br />
Issued<br />
12,473,755 common shares<br />
Inventory is recorded at the lower of cost and net realizable value.<br />
During the year ended December 31, <strong>2012</strong>, no provisions [2011 – nil] were<br />
expensed through cost of goods sold. There were no write-downs of<br />
finished goods and no reversals of write-downs included in cost of goods<br />
sold during the year.
70<br />
01 02 03 04 05<br />
financial statements<br />
Number<br />
Amount<br />
# $<br />
Balance, January 1, 2011 12,399,550 151,376<br />
Purchase of common shares under LTIP (67,996) (3,346)<br />
Conversion of subordinated debentures 2,556 115<br />
Settlement of LTIP - vested shares 77,510 2,894<br />
Balance, December 31, 2011 12,411,620 151,039<br />
Exercise of grants under DDCP [note 21[c]] 2,107 53<br />
Settlement of LTIP - vested shares [note 21[e]] 60,028 2,355<br />
Balance, December 31, <strong>2012</strong> 12,473,755 153,447<br />
The 12,473,755 common shares at December 31, <strong>2012</strong> are net of 74,348<br />
common shares with a stated value of $3,072 that are being held by the<br />
Company under the terms of the LTIP until vesting conditions are met.<br />
The 12,411,620 common shares at December 31, 2011 are net of 134,376<br />
common shares with a stated value of $5,428 that were being held by the<br />
Company under the terms of the LTIP until vesting conditions are met.<br />
[b] Normal course issuer bid<br />
On November 17, 2011, Ag Growth commenced a normal course issuer bid<br />
for up to 994,508 common shares, representing 10% of the Company’s public<br />
float at the time. The normal course issuer bid terminated on November 20,<br />
<strong>2012</strong>. During the year ended December 31, <strong>2012</strong>, no common shares were<br />
purchased under the normal course issuer bid [2011 – nil].<br />
[c] Contributed surplus<br />
<strong>2012</strong> 2011<br />
$ $<br />
Balance, beginning of year 5,341 6,121<br />
Equity-settled director compensation 324 345<br />
Obligation under LTIP 850 1,769<br />
Exercise of grants under DDCP (53) —<br />
Settlement of LTIP - vested shares (2,354) (2,894)<br />
Balance, end of year 4,108 5,341<br />
[d] Accumulated other comprehensive income<br />
Accumulated other comprehensive income is comprised of the following:<br />
Cash flow hedge reserve<br />
The cash flow hedge reserve contains the effective portion of the cash flow<br />
hedge relationships incurred as at the reporting date.<br />
Foreign currency translation reserve<br />
The foreign currency translation reserve is used to record exchange<br />
differences arising from the translation of the financial statements of<br />
foreign subsidiaries. It is also used to record the effect of hedging net<br />
investments in foreign operations.<br />
Available-for-sale reserve<br />
The available-for-sale reserve contains the cumulative change in the fair<br />
value of available-for-sale investment. Gains and losses are reclassified<br />
to the consolidated statement of income when the available-for-sale<br />
investment is impaired or derecognized.
07 08 09 10 11<br />
71<br />
<strong>2012</strong> ANNUAL REPORT<br />
[e] Dividends paid and proposed<br />
In the year ended December 31, <strong>2012</strong>, the Company declared dividends of<br />
$30,111 or $2.40 per common share [2011 – $30,109 or $2.40 per common<br />
share]. Ag Growth’s dividend policy is to pay cash dividends on or about the<br />
30th of each month to shareholders of record on the last business day of the<br />
previous month. The Company’s current monthly dividend rate is $0.20 per<br />
common share. Subsequent to December 31, <strong>2012</strong>, the Company declared<br />
dividends of $0.20 per common share to shareholders of record on each of<br />
January 31, 2013 and February 28, 2013.<br />
[f] Shareholder protection rights plan<br />
On December 20, 2010, the Company’s Board of Directors adopted a<br />
Shareholders’ Protection Rights Plan [the “Rights Plan”]. Specifically, the<br />
Board of Directors has implemented the Rights Plan by authorizing the<br />
issuance of one right [a “Right”] in respect of each common share [the<br />
“Common Shares”] of the Company. If a person or a Company, acting jointly<br />
or in concert, acquires [other than pursuant to an exemption available<br />
under the Rights Plan] beneficial ownership of 20 percent or more of the<br />
Common Shares, Rights [other than those held by such acquiring person<br />
which will become void] will separate from the Common Shares and permit<br />
the holder thereof to purchase that number of Common Shares having an<br />
aggregate market price [as determined in accordance with the Rights Plan]<br />
on the date of consummation or occurrence of such acquisition of Common<br />
Shares equal to four times the exercise price of the Rights for an amount in<br />
cash equal to the exercise price. The exercise price of the Rights pursuant<br />
to the Rights Plan is $150 per Right.<br />
21. SHARE-BASED COMPENSATION PLANS<br />
[a] Long-term incentive plan [“LTIP”]<br />
The LTIP is a compensation plan that awards common shares to key<br />
management based on the Company’s operating performance. Pursuant<br />
to the LTIP, the Company establishes the amount to be allocated to<br />
management based upon the amount by which distributable cash, as<br />
defined in the LTIP, exceeds a predetermined threshold. The service period<br />
commences on January 1 of the year the award is generated and ends<br />
at the end of the fiscal year. The award vests on a graded scale over an<br />
additional three-year period from the end of the respective performance<br />
year. The LTIP provides for immediate vesting in the event of retirement,<br />
death, termination without cause or in the event the participant becomes<br />
disabled. The cash awarded under the plan formula is used to purchase Ag<br />
Growth common shares at market prices. All vested awards are settled with<br />
participants in common shares purchased by the administrator of the plan<br />
and there is no cash settlement alternative.<br />
The amount owing to participants is recorded as an equity award in<br />
contributed surplus as the award is settled with participants with treasury<br />
shares purchased in the open market. The expense is recorded in the<br />
different consolidated statement of income lines by function depending<br />
on the role of the respective management member. For the year ended<br />
December 31, <strong>2012</strong>, Ag Growth expensed $850 [2011 – $1,769] for the LTIP.<br />
Additionally, there is $34 in restricted cash related to the LTIP [2011 – $29].<br />
The administrator is not required to purchase common shares in <strong>2012</strong> as there<br />
was no LTIP award related to fiscal 2011. During the year ended December 31,<br />
2011, the administrator purchased 67,996 common shares in the market for<br />
$3,346. The fair value of this share-based payment equals the share price as<br />
of the respective measurement date as dividends related to the shares in the<br />
administrated fund are paid annually to the LTIP participants. Further awards<br />
under the LTIP ceased effective for the fiscal <strong>2012</strong> year.<br />
[b] Share award incentive plan [“SAIP”]<br />
The <strong>2012</strong> SAlP<br />
On May 11, <strong>2012</strong> the shareholders of Ag Growth approved a Share Award<br />
Incentive Plan [the “<strong>2012</strong> SAIP”] which authorizes the Board to grant
72<br />
01 02 03 04 05<br />
financial statements<br />
restricted Share Awards [“Restricted Awards”] and Performance Share<br />
Awards [“Performance Awards”] to persons who are officers, employees<br />
or consultants of the Company and its affiliates. Share Awards may not be<br />
granted to Non-Management Directors.<br />
A total of 465,000 common shares are available for issuance under the <strong>2012</strong><br />
SAIP. At the discretion of the Board, the <strong>2012</strong> SAIP provides for cumulative<br />
adjustments to the number of common shares to be issued pursuant to<br />
Share Awards on each date that dividends are paid on the common shares.<br />
The Company shall have the option of settling any amount payable in<br />
respect of a Share Award by common shares issued from the treasury of<br />
the Company or, with the consent of the grantee, cash in an amount equal<br />
to the fair market value of such common shares.<br />
Each Restricted Award will entitle the holder to be issued the number of<br />
the common shares designated in the Restricted Award with such common<br />
shares to be issued as to one-third on each of the third, fourth and fifth<br />
anniversary dates of the date of grant, or such earlier or later dates as<br />
determined by the Board of Directors in accordance with the <strong>2012</strong> SAIP.<br />
Each Performance Award will entitle the holder to be issued as to one-third<br />
on each of the first, second and third anniversary dates of the date of grant,<br />
or such earlier or later dates, the number of common shares designated<br />
in the Performance Award multiplied by a Payout Multiplier. The Payout<br />
Multiplier is determined based on an assessment of the achievement of<br />
pre-defined measures in respect of the applicable period. The Payout<br />
Multiplier may not be less than 0% or more than 200%.<br />
Subsequent to December 31, <strong>2012</strong>, 150,000 Restricted Awards and 110,000<br />
Performance Awards have been granted under the <strong>2012</strong> SAIP.<br />
The 2007 SAlP<br />
On May 10, 2007, the shareholders of Ag Growth reserved for issuance<br />
220,000 Share Awards under a Share Award Incentive Plan [the “2007<br />
SAIP”]. All of the 220,000 common shares reserved for issue under the<br />
2007 SAIP were issued and they vested as to one-third on each of January<br />
1, 2010, 2011, and <strong>2012</strong>. No further Share Awards may be granted, and no<br />
further common shares may be issued under the 2007 SAIP. There are no<br />
Share Awards outstanding as at December 31, <strong>2012</strong> [2011 – 40,000]. For the<br />
year ended December 31, <strong>2012</strong>, Ag Growth recorded an expense related to<br />
the 2007 SAIP of nil [2011 – income of $76].<br />
[c] Directors’ deferred compensation plan [“DDCP”]<br />
Under the DDCP, every Director receives a fixed base retainer fee, an<br />
attendance fee for meetings and a committee chair fee, if applicable, and<br />
a minimum of 20% of the total compensation must be taken in common<br />
shares. A Director will not be entitled to receive the common shares he or<br />
she has been granted until a period of three years has passed since the<br />
date of grant or until the Director ceases to be a Director, whichever is<br />
earlier. The Directors’ common shares are fixed based on the fees eligible<br />
to him for the respective period and his decision to elect for cash payments<br />
for dividends related to the common shares; therefore, the Director’s<br />
remuneration under the DDCP vests directly in the respective service<br />
period. The three-year period [or any shorter period until a Director ceases<br />
to be a Director] qualifies only as a waiting period to receive the vested<br />
common shares.<br />
For the years ended December 31, <strong>2012</strong> and 2011, the Directors elected to<br />
receive the majority of their remuneration in common shares. For the year<br />
ended December 31, <strong>2012</strong>, an expense of $324 [2011 – $345] was recorded<br />
for the share grants, and a corresponding amount has been recorded to<br />
contributed surplus. The share grants were measured with the contractual<br />
agreed amount of service fees for the respective period.<br />
The total number of common shares issuable pursuant to the DDCP shall<br />
not exceed 70,000, subject to adjustment in lieu of dividends, if applicable.<br />
During the year ended December 31, <strong>2012</strong>, 9,260 common shares were
07 08 09 10 11<br />
73<br />
<strong>2012</strong> ANNUAL REPORT<br />
granted under the DDCP [2011 – 9,161] and as at December 31, <strong>2012</strong>, a total<br />
of 32,404 common shares had been granted under the DDCP and 2,107<br />
common shares had been issued.<br />
[d] Stock option plan<br />
On June 3, 2009, the shareholders of Ag Growth approved a stock<br />
option plan [the “Option Plan”] under which options may be granted to<br />
officers, employees and other eligible service providers in order to allow<br />
these individuals an opportunity to increase their proprietary interest in<br />
Ag Growth’s long-term success. On May 11, <strong>2012</strong>, the shareholders of Ag<br />
Growth approved an amended management compensation structure which<br />
included the termination of the Option Plan. Accordingly, as at December<br />
31, <strong>2012</strong>, no options were available for grant [2011 – 935,325].<br />
[e] Summary of expenses recognized under share-based<br />
payment plans<br />
For the year ended December 31, <strong>2012</strong>, an expense of $1,174 [2011 – $2,038]<br />
was recognized for employee and Director services rendered.<br />
The total carrying amount of the liability for the SAIP as of December 31,<br />
<strong>2012</strong> was nil [2011 – $1,495]. The exercise price on all SAIP awards was<br />
$0.10 per common share.<br />
A summary of the status of the options under the SAIP is presented below:<br />
<strong>2012</strong> Shares<br />
2011 Shares<br />
#<br />
#<br />
Outstanding, beginning of year 40,000 80,000<br />
Exercised (40,000) (40,000)<br />
Outstanding, end of year — 40,000<br />
A summary of the status of the shares under the LTIP is presented below:<br />
<strong>2012</strong> Shares 2011 Shares<br />
# #<br />
Outstanding, beginning of year 134,376 143,890<br />
Vested (60,028) (77,510)<br />
Granted — 67,996<br />
Outstanding, end of year 74,348 134,376<br />
There were no outstanding SAIP awards as at December 31, <strong>2012</strong>. The<br />
following table lists the inputs to the models used for the 2007 SAIP for the<br />
year ended December 31, 2011:<br />
2011<br />
$<br />
Dividend yield [%] —<br />
Expected volatility [%] 26.88<br />
Risk-free interest rate [%] 1<br />
Expected life of share options [years] 1<br />
Weighted average share price [$] 37.48<br />
Model used<br />
Black-Scholes<br />
The dividend yield was set to 0% for the calculation of the option value,<br />
as the Share Award holders already receive during the period between<br />
grant date and vesting date of the Share Award the same dividend as all<br />
actual shareholders. The expected life of the Share Awards is the period<br />
between the reporting date and the vesting date, as the Share Awards can<br />
be exercised by the holders only at the vesting date. The expected volatility<br />
reflects the assumption that the historical volatility over a period similar<br />
to the Share Awards is indicative of future trends, which may also not<br />
necessarily be the actual outcome.
74<br />
01 02 03 04 05<br />
financial statements<br />
22. LONG-TERM DEBT AND OBLIGATIONS UNDER FINANCE LEASES<br />
Interest rate Maturity <strong>2012</strong> 2011<br />
% $ $<br />
Current portion of interest-bearing loans and borrowings<br />
Obligations under finance leases 6.5 <strong>2012</strong> — 131<br />
GMAC loans 0.0 2014 7 16<br />
Total current portion of interest-bearing loans and borrowings 7 147<br />
Non-current interest-bearing loans and borrowings<br />
Series A secured notes [U.S. dollar denominated] 6.8 2016 24,872 25,425<br />
Term debt [U.S. dollar denominated] 3.8 2014 10,475 10,709<br />
GMAC loans 0.0 2014 7 3<br />
Total non-current interest-bearing loans and borrowings 35,354 36,137<br />
35,361 36,284<br />
Less deferred financing costs 438 313<br />
Total interest-bearing loans and borrowings 34,923 35,971<br />
[a] Bank indebtedness<br />
Ag Growth has operating facilities of $10.0 million and U.S. $2.0 million and<br />
may also draw on its term loan facility for general operating purposes. The<br />
operative and term loan facilities bear interest at prime to prime plus 1.0%<br />
per annum based on performance calculations. The effective interest rate<br />
during the year ended December 31, <strong>2012</strong> on Ag Growth’s Canadian dollar<br />
operating facility was 3.1% [2011 – 3.5%] and on its U.S. dollar operating<br />
facility was 3.4% [2011 – 3.8%]. As at December 31, <strong>2012</strong>, there was nil<br />
[2011 – nil] outstanding under these facilities. The facilities mature March 8,<br />
2016 or three months prior to the maturity date of the convertible unsecured<br />
debentures, unless refinanced on terms acceptable to the lenders<br />
Collateral for the operating facilities rank pari passu with the Series A<br />
secured notes and include a general security agreement over all assets,<br />
first position collateral mortgages on land and buildings, assignments of<br />
rents and leases and security agreements for patents and trademarks.<br />
[b] Long-term debt<br />
The Series A secured notes were issued on October 29, 2009. The nonamortizing<br />
notes bear interest at 6.8% payable quarterly and mature on<br />
October 29, 2016. The Series A secured notes are denominated in U.S.<br />
dollars. Collateral for the Series A secured notes and term loans rank<br />
pari passu and include a general security agreement over all assets, first<br />
position collateral mortgages on land and buildings, assignments of rents<br />
and leases and security agreements for patents and trademarks.
07 08 09 10 11<br />
75<br />
<strong>2012</strong> ANNUAL REPORT<br />
Term loans bear interest at rates of prime to prime plus 1.0% based on<br />
performance calculations. As at December 31, <strong>2012</strong>, term loans of U.S.<br />
$10,530 were outstanding [2011 – U.S. $10,530]. Ag Growth’s credit facility<br />
provides for term loans of up to $38,000 and U.S. $20,500 and includes lender<br />
approval to increase the size of the facility by $25 million.<br />
The facilities mature on the earlier of March 8, 2016 or three months prior<br />
to maturity date of convertible unsecured subordinated debentures, unless<br />
refinanced on terms acceptable to the lenders.<br />
GMAC loans bear interest at 0% and mature in 2014. The vehicles financed<br />
are pledged as collateral.<br />
[c] Covenants<br />
Ag Growth is subject to certain financial covenants in its credit facility<br />
agreements which must be maintained to avoid acceleration of the<br />
termination of the agreement. The financial covenants require Ag Growth<br />
to maintain a debt to earnings before interest, taxes, depreciation and<br />
amortization [“EBITDA”] ratio of less than 2.5 and to provide debt service<br />
coverage of a minimum of 1.0. The covenant calculations exclude the<br />
convertible unsecured subordinated debentures from the definition of<br />
debt. As at December 31, <strong>2012</strong> and December 31, 2011, Ag Growth was in<br />
compliance with all financial covenants.<br />
23. CONVERTIBLE UNSECURED<br />
SUBORDINATED DEBENTURES<br />
<strong>2012</strong> 2011<br />
$ $<br />
Principal amount 114,885 114,885<br />
Equity component (7,475) (7,475)<br />
Accretion 4,211 2,770<br />
Financing fees, net of amortization (2,063) (2,978)<br />
Convertible unsecured subordinated debentures 109,558 107,202<br />
On October 27, 2009, the Company issued convertible unsecured<br />
subordinated debentures in the aggregate principal amount of $100<br />
million, and on November 6, 2009, the underwriters exercised in full their<br />
over-allotment option and the Company issued an additional $15 million<br />
of debentures [the “Debentures”]. The net proceeds of the offering, after<br />
payment of the underwriters’ fee of $4.6 million and expenses of the offering<br />
of $0.5 million, were approximately $109.9 million. The Debentures were<br />
issued at a price of $1,000 per Debenture and bear interest at an annual<br />
rate of 7.0% payable semi-annually on June 30 and December 31 in each<br />
year commencing June 30, 2010. The maturity date of the Debentures is<br />
December 31, 2014.<br />
Each Debenture is convertible into common shares of the Company at the<br />
option of the holder at any time on the earlier of the maturity date and the<br />
date of redemption of the Debenture, at a conversion price of $44.98 per<br />
common share being a conversion rate of approximately 22.2321 common<br />
shares per $1,000 principal amount of Debentures. No conversion options<br />
were exercised during the year ended December 31, <strong>2012</strong>. During the<br />
year ended December 31, 2011, holders of 115 Debentures exercised
76<br />
01 02 03 04 05<br />
financial statements<br />
the conversion option and were issued 2,556 common shares. As at<br />
December 31, <strong>2012</strong>, Ag Growth has reserved 2,554,136 common shares for<br />
issuance upon conversion of the Debentures.<br />
The Debentures are not redeemable before December 31, <strong>2012</strong>. On and after<br />
December 31, <strong>2012</strong> and prior to December 31, 2013, the Debentures may be<br />
redeemed, in whole or in part, at the option of the Company at a price equal<br />
to their principal amount plus accrued and unpaid interest, provided that<br />
the volume weighted average trading price of the common shares during<br />
the 20 consecutive trading days ending on the fifth trading day preceding<br />
the date on which the notice of redemption is given is not less than 125% of<br />
the conversion price. On and after December 31, 2013, the Debentures may<br />
be redeemed, in whole or in part, at the option of the Company at a price<br />
equal to their principal amount plus accrued and unpaid interest.<br />
On redemption or at maturity, the Company may, at its option, elect to satisfy<br />
its obligation to pay the principal amount of the Debentures by issuing<br />
and delivering common shares. The Company may also elect to satisfy<br />
its obligations to pay interest on the Debentures by delivering common<br />
shares. The Company does not expect to exercise the option to satisfy its<br />
obligations to pay interest by delivering common shares and as a result the<br />
potentially dilutive impact has been excluded from the calculation of fully<br />
diluted earnings per share [note 30]. The number of any shares issued will<br />
be determined based on market prices at the time of issuance.<br />
Debentures to common shares in the amount of $7,475 has been separated<br />
from the fair value of the liability and is included in shareholders’ equity, net<br />
of income tax of $2,041, and its pro rata share of financing costs of $329.<br />
24. ACCOUNTS PAYABLE AND<br />
ACCRUED LIABILITIES<br />
<strong>2012</strong> 2011<br />
$ $<br />
Trade payables 4,613 8,212<br />
Other payables 5,430 6,126<br />
Personnel-related accrued liabilities 6,583 7,176<br />
Accrued outstanding service invoices 725 750<br />
17,351 22,264<br />
Trade payables and other payables are non-interest bearing and are<br />
normally settled on 30- or 60-day terms. Personnel-related accrued<br />
liabilities include primarily vacation accruals, bonus accruals and overtime<br />
benefits. For explanations on the Company’s credit risk management<br />
processes, refer to note 27.<br />
The Company presents and discloses its financial instruments in<br />
accordance with the substance of its contractual arrangement.<br />
Accordingly, upon issuance of the Debentures, the Company recorded<br />
a liability of $107,525, less related offering costs of $4,735. The liability<br />
component has been accreted using the effective interest rate method, and<br />
during the year ended December 31, <strong>2012</strong>, the Company recorded accretion<br />
of $1,441 [2011 – $1,332], non-cash interest expense related to financing<br />
costs of $915 [2011 – $845] and interest expense on the 7% coupon of $8,042<br />
[2011 – $8,043]. The estimated fair value of the holder’s option to convert
07 08 09 10 11<br />
77<br />
<strong>2012</strong> ANNUAL REPORT<br />
25. INCOME TAXES<br />
The major components of income tax expense for the years ended<br />
December 31, <strong>2012</strong> and 2011 are as follows:<br />
Consolidated statement of income<br />
<strong>2012</strong> 2011<br />
$ $<br />
Current tax expense<br />
Current income tax charge 3,771 3,910<br />
Deferred tax expense<br />
Origination and reversal of temporary<br />
differences 4,054 5,743<br />
Income tax expense reported in the<br />
consolidated statement of income 7,825 9,653<br />
Consolidated statement of comprehensive income<br />
<strong>2012</strong> 2011<br />
$ $<br />
Deferred tax related to items charged or<br />
credited directly to other comprehensive<br />
income during the period<br />
Unrealized gain (loss) on derivatives and<br />
available-for-sale investment 698 (1,490)<br />
Exchange differences on translation of<br />
foreign operations (200) 214<br />
Income tax charged directly to other<br />
comprehensive income 498 (1,276)<br />
The reconciliation between tax expense and the product of accounting<br />
profit multiplied by the Company’s domestic tax rate for the years ended<br />
December 31, <strong>2012</strong> and 2011 is as follows:<br />
<strong>2012</strong> 2011<br />
$ $<br />
Accounting profit before income tax 25,013 34,176<br />
At the Company’s statutory income tax rate<br />
of 26.59% [2011 – 28.05%] 6,651 9,586<br />
Tax rate changes (14) 265<br />
Recognition of deferred tax assets (58) (91)<br />
Additional deductions allowed in a<br />
foreign jurisdiction (386) (401)<br />
Unused tax losses not recognized as a deferred<br />
tax asset 224 —<br />
Foreign rate differential 1,080 901<br />
Impairment of goodwill 503 —<br />
Permanent differences and others (175) (607)<br />
At the effective income tax rate 31.28%<br />
[2011 – 28.24%] 7,825 9,653
78<br />
01 02 03 04 05<br />
financial statements<br />
The tax effects of temporary differences that give rise to significant portions of the deferred tax assets and deferred tax liabilities are presented below:<br />
Consolidated statement of<br />
financial position<br />
Consolidated statement<br />
of income<br />
<strong>2012</strong> 2011 <strong>2012</strong> 2011<br />
$ $ $ $<br />
Inventories (88) (200) (112) 8<br />
Property, plant and equipment and other assets (11,549) (10,145) 1,404 1,033<br />
Intangible assets (12,909) (12,900) 9 (144)<br />
Deferred financing costs (117) (63) 54 84<br />
Accruals and long-term provisions 1,453 1,642 189 (894)<br />
Tax loss carryforwards expiring between 2020 to 2029 14,831 16,809 1,978 5,062<br />
Investment tax credit carryforward expiring between 2025 and 2030 4,880 4,627 (253) 136<br />
Canadian exploration expenses 29,198 29,157 (41) —<br />
Capitalized development expenditures (707) (465) 242 465<br />
Convertible debentures (868) (1,279) (411) (349)<br />
SAIP liability — 397 397 580<br />
Equity impact LTIP 885 1,283 398 (30)<br />
Foreign exchange gains — — — 6<br />
Other comprehensive income (429) 269 — —<br />
Exchange difference on translation of foreign operations — — 200 (214)<br />
Deferred tax expense 4,054 5,743<br />
Net deferred tax assets 24,580 29,132<br />
Reflected in the statement of financial position as follows<br />
Deferred tax assets 33,621 38,092<br />
Deferred tax liabilities (9,041) (8,960)<br />
Deferred tax assets, net 24,580 29,132
07 08 09 10 11<br />
79<br />
<strong>2012</strong> ANNUAL REPORT<br />
Reconciliation of deferred tax assets, net<br />
<strong>2012</strong> 2011<br />
$ $<br />
Balance, January 1, <strong>2012</strong> 29,132 33,599<br />
Deferred tax expense during the period<br />
recognized in profit or loss (4,054) (5,743)<br />
Deferred tax income during the period<br />
recognized in other comprehensive income (498) 1,276<br />
Balance, December 31, <strong>2012</strong> 24,580 29,132<br />
The ultimate realization of deferred tax assets is dependent upon the<br />
generation of future taxable income during the periods in which these<br />
temporary differences, loss carryforwards and investment tax credits<br />
become deductible. Based on the analysis of taxable temporary differences<br />
and future taxable income, the management of the Company is of the<br />
opinion that there is convincing evidence available for the probable<br />
realization of all deductible temporary differences of the Company’s tax<br />
entities incurred in its Finnish operations other than losses [655 Euros].<br />
Accordingly, the Company has recorded a deferred tax asset for all<br />
deductible temporary differences as of the reporting date and as at<br />
December 31, 2011.<br />
At December 31, <strong>2012</strong>, there was no recognized deferred tax liability<br />
[2011 – nil] for taxes that would be payable on the unremitted earnings<br />
of certain of the Company’s subsidiaries. The Company has determined<br />
that undistributed profits of its subsidiaries will not be distributed in the<br />
foreseeable future. The temporary differences associated with investments<br />
in subsidiaries, for which a deferred tax asset has not been recognized,<br />
aggregate to $622 [2011 – $622].<br />
Income tax provisions, including current and deferred income tax assets<br />
and liabilities, and income tax filing positions require estimates and<br />
interpretations of federal and provincial income tax rules and regulations,<br />
and judgments as to their interpretation and application to Ag Growth’s<br />
specific situation. The amount and timing of reversals of temporary<br />
differences will also depend on Ag Growth’s future operating results,<br />
acquisitions and dispositions of assets and liabilities. The business and<br />
operations of Ag Growth are complex and Ag Growth has executed a<br />
number of significant financings, acquisitions, reorganizations and business<br />
combinations over the course of its history including the conversion<br />
to a corporate entity. The computation of income taxes payable as a<br />
result of these transactions involves many complex factors, as well as<br />
Ag Growth’s interpretation of and compliance with relevant tax legislation<br />
and regulations. While Ag Growth believes that its tax filing positions<br />
are probable to be sustained, there are a number of tax filing positions<br />
including in respect of the conversion to a corporate entity that may be<br />
the subject of review by taxation authorities. Therefore, it is possible that<br />
additional taxes could be payable by Ag Growth and the ultimate value of<br />
Ag Growth’s income tax assets and liabilities could change in the future<br />
and that changes to these amounts could have a material effect on these<br />
consolidated financial statements.<br />
There are no income tax consequences to the Company attached to<br />
the payment of dividends in either <strong>2012</strong> or 2011 by the Company to<br />
its shareholders.<br />
26. POST-RETIREMENT BENEFIT PLANS<br />
Ag Growth contributes to group retirement savings plans subject to<br />
maximum limits per employee. The expense recorded during the year<br />
ended December 31, <strong>2012</strong> was $1,950 [2011 – $1,925]. Ag Growth expects to<br />
contribute $2,000 for the year ending December 31, 2013.<br />
Ag Growth accounts for one plan covering substantially all of its employees<br />
of the Mepu division as a defined contribution plan, although it does provide
80<br />
01 02 03 04 05<br />
financial statements<br />
the employees with a defined benefit [average pay] pension. The plan<br />
qualifies as a multi-employer plan and is administered by the Government of<br />
Finland. Ag Growth is not able to obtain sufficient information to account for<br />
the plan as a defined benefit plan.<br />
27. FINANCIAL INSTRUMENTS AND FINANCIAL<br />
RISK MANAGEMENT<br />
[a] Management of risks arising from financial instruments<br />
Ag Growth’s principal financial liabilities, other than derivatives, comprise<br />
loans and borrowings and trade and other payables. The main purpose<br />
of these financial liabilities is to finance the Company’s operations and to<br />
provide guarantees to support its operations. The Company has deposits,<br />
trade and other receivables and cash and short-term deposits that are<br />
derived directly from its operations. The Company also holds an availablefor-sale<br />
investment and enters into derivative transactions.<br />
The Company’s activities expose it to a variety of financial risks: market<br />
risk [including foreign exchange and interest rate], credit risk and liquidity<br />
risk. The Company’s overall risk management program focuses on the<br />
unpredictability of financial markets and seeks to minimize potential<br />
adverse effects on the Company’s financial performance. The Company<br />
uses derivative financial instruments to mitigate certain risk exposures.<br />
The Company does not purchase any derivative financial instruments<br />
for speculative purposes. Risk management is the responsibility of the<br />
corporate finance function, which has the appropriate skills, experience<br />
and supervision. The Company’s domestic and foreign operations<br />
along with the corporate finance function identify, evaluate and, where<br />
appropriate, mitigate financial risks. Material risks are monitored and are<br />
regularly discussed with the Audit Committee of the Board of Directors. The<br />
Audit Committee reviews and monitors the Company’s financial risk-taking<br />
activities and the policies and procedures that were implemented to ensure<br />
that financial risks are identified, measured and managed in accordance<br />
with Company policies.<br />
The risks associated with the Company’s financial instruments are<br />
as follows:<br />
Market risk<br />
Market risk is the risk that the fair value of future cash flows of a financial<br />
instrument will fluctuate because of changes in market prices. Components<br />
of market risk to which Ag Growth is exposed are discussed below.<br />
Financial instruments affected by market risk include trade accounts<br />
receivable and payable, available-for-sale investments and derivative<br />
financial instruments.<br />
The sensitivity analyses in the following sections relate to the position as at<br />
December 31, <strong>2012</strong> and December 31, 2011.<br />
The sensitivity analyses have been prepared on the basis that the amount<br />
of net debt, the ratio of fixed to floating interest rates of the debt and<br />
derivatives and the proportion of financial instruments in foreign currencies<br />
are all constant. The analyses exclude the impact of movements in market<br />
variables on the carrying value of provisions and on the nonfinancial assets<br />
and liabilities of foreign operations.<br />
The following assumptions have been made in calculating the<br />
sensitivity analyses:<br />
• The consolidated statement of financial position sensitivity relates<br />
to derivatives.<br />
• The sensitivity of the relevant consolidated statement of income<br />
item is the effect of the assumed changes in respective market risks.<br />
This is based on the financial assets and financial liabilities held at<br />
December 31, <strong>2012</strong> and December 31, 2011, including the effect of<br />
hedge accounting.
07 08 09 10 11<br />
81<br />
<strong>2012</strong> ANNUAL REPORT<br />
• The sensitivity of equity is calculated by considering the effect of any<br />
associated cash flow hedges at December 31, <strong>2012</strong> for the effects of the<br />
assumed underlying changes.<br />
Foreign currency risk<br />
The objective of the Company’s foreign exchange risk management<br />
activities is to minimize transaction exposures and the resulting volatility<br />
of the Company’s earnings, subject to liquidity restrictions, by entering into<br />
foreign exchange forward contracts. Foreign currency risk is created by<br />
fluctuations in the fair value or cash flows of financial instruments due to<br />
changes in foreign exchange rates and exposure.<br />
A significant part of the Company’s sales are transacted in U.S. dollars<br />
and Euros and as a result fluctuations in the rate of exchange between the<br />
U.S. dollar, the Euro and Canadian dollar can have a significant effect on<br />
the Company’s cash flows and reported results. To mitigate exposure to<br />
the fluctuating rate of exchange, Ag Growth enters into foreign exchange<br />
forward contracts and denominates a portion of its debt in U.S. dollars. As<br />
at December 31, <strong>2012</strong>, Ag Growth’s U.S. dollar denominated debt totalled<br />
U.S. $35.5 million [2011 U.S. $35.5 million] and the Company has entered into<br />
the following foreign exchange forward contracts to sell U.S. dollars and<br />
Euros in order to hedge its foreign exchange risk on revenue:<br />
Face value Average rate<br />
Settlement dates U.S. $ Cdn $<br />
January - December 2013 53,000 1.03<br />
January - December 2014 41,000 1.02<br />
The Company enters into foreign exchange forward contracts to mitigate<br />
foreign currency risk relating to certain cash flow exposures. The<br />
hedged transactions are expected to occur within a maximum 24month<br />
period. The Company’s foreign exchange forward contracts reduce the<br />
Company’s risk from exchange movements because gains and losses on<br />
such contracts offset gains and losses on transactions being hedged.<br />
The Company’s exposure to foreign currency changes for all other<br />
currencies is not material.<br />
Ag Growth’s sales denominated in U.S. dollars for the year ended<br />
December 31, <strong>2012</strong> were U.S. $185 million, and the total of its cost of goods<br />
sold and its selling, general and administrative expenses denominated<br />
in that currency were U.S. $126 million. Accordingly, a 10% increase or<br />
decrease in the value of the U.S. dollar relative to its Canadian counterpart<br />
would result in a $18.5 million increase or decrease in sales and a total<br />
increase or decrease of $12.6 million in its cost of goods sold and its selling,<br />
general and administrative expenses. In relation to Ag Growth’s foreign<br />
exchange hedging contracts, a 10% increase or decrease in the value of<br />
the U.S. dollar relative to its Canadian counterpart would result in a $6.6<br />
million increase or decrease in the foreign exchange gain and a $6.6 million<br />
increase or decrease to other comprehensive income.<br />
The counterparties to the contracts are three multinational commercial<br />
banks and therefore credit risk of counterparty non-performance is remote.<br />
Realized gains or losses are included in net earnings and for the year ended<br />
December 31, <strong>2012</strong> the Company realized a gain on its foreign exchange<br />
contracts of $0.6 million [2011 – $5.0 million].<br />
Face value Average rate<br />
Settlement dates Euro Cdn $<br />
August - December 2013 500 1.33<br />
August - December 2014 500 1.33
82<br />
01 02 03 04 05<br />
financial statements<br />
The open foreign exchange forward contracts as at December 31, <strong>2012</strong> are as follows:<br />
Notional amount of<br />
currency sold<br />
Notional Canadian dollar equivalent<br />
Contract<br />
amount<br />
Cdn $<br />
equivalent<br />
Unrealized<br />
gain (loss)<br />
$ $ $ $<br />
U.S. dollar contracts 94,000 1.02 96,086 1,625<br />
Euro contracts 1,000 1.32 1,322 (14)<br />
The open foreign exchange forward contracts as at December 31, 2011 are as follows:<br />
Notional amount of<br />
currency sold<br />
Notional Canadian dollar equivalent<br />
Contract<br />
amount<br />
Cdn $<br />
equivalent<br />
Unrealized<br />
loss<br />
U.S. $ $ $ $<br />
60,000 0.9905 59,430 (1,828)<br />
The terms of the foreign exchange forward contracts have been negotiated to match the terms of the commitments. There were no highly probable<br />
transactions for which hedge accounting has been claimed that have not occurred and no significant element of hedge ineffectiveness requiring recognition<br />
in the consolidated statement of income.<br />
The cash flow hedges of the expected future sales were assessed to be highly effective and a net unrealized gain of $1,611, with a deferred tax liability of<br />
$429 relating to the hedging instruments, is included in accumulated other comprehensive income.<br />
Subsequent to December 31, <strong>2012</strong>, the Company entered a number of foreign exchange contracts for the period June 2014 to December 2014 totalling U.S.<br />
$13 million at an average rate of $1.0148, and for January 2015 and February 2015 totalling U.S. $5 million at an average rate of $1.0417.
07 08 09 10 11<br />
83<br />
<strong>2012</strong> ANNUAL REPORT<br />
Interest rate risk<br />
Interest rate risk is the risk that the fair value or future cash flows of a<br />
financial instrument will fluctuate because of changes in market interest<br />
rates. Furthermore, as Ag Growth regularly reviews the denomination of its<br />
borrowings, the Company is subject to changes in interest rates that are<br />
linked to the currency of denomination of the debt. Ag Growth’s Series A<br />
secured notes and convertible unsecured subordinated debentures<br />
outstanding at December 31, <strong>2012</strong> and December 31, 2011 are at a fixed<br />
rate of interest. As at December 31, <strong>2012</strong>, the Company had outstanding<br />
$10,530 of U.S. dollar term debt at a floating rate of interest. A 10% increase<br />
or decrease in the Company’s interest rate would result in an increase or<br />
decrease of $35 to long-term interest expense.<br />
Credit risk<br />
Credit risk is the risk that a customer will fail to perform an obligation or fail<br />
to pay amounts due, causing a financial loss. A substantial portion of Ag<br />
Growth’s accounts receivable are with customers in the agriculture industry<br />
and are subject to normal industry credit risks. This credit exposure<br />
is mitigated through the use of credit practices that limit transactions<br />
according to the customer’s credit quality and due to the accounts<br />
receivable being spread over a large number of customers. Ag Growth<br />
establishes a reasonable allowance for non-collectible amounts with this<br />
allowance netted against the accounts receivable on the consolidated<br />
statement of financial position.<br />
At December 31, <strong>2012</strong>, the Company had two customers [2011 – two customers]<br />
that accounted for approximately 17% [2011 – 14%] of all receivables owing.<br />
The requirement for an impairment is analyzed at each reporting date on<br />
an individual basis for major customers. Additionally, a large number of<br />
minor receivables are grouped into homogeneous groups and assessed<br />
for impairment collectively. The calculation is based on actual incurred<br />
historical data. The Company does not hold collateral as security.<br />
The Company does not believe that any single customer group represents<br />
a significant concentration of credit risk.<br />
Liquidity risk<br />
Liquidity risk is the risk that Ag Growth will encounter difficulties in meeting<br />
its financial liability obligations. Ag Growth manages its liquidity risk<br />
through cash and debt management. In managing liquidity risk, Ag Growth<br />
has access to committed short- and long-term debt facilities as well as to<br />
equity markets, the availability of which is dependent on market conditions.<br />
Ag Growth believes it has sufficient funding through the use of these<br />
facilities to meet foreseeable borrowing requirements.<br />
Accounts receivable is subject to credit risk exposure and the carrying<br />
values reflect management’s assessment of the associated maximum<br />
exposure to such credit risk. The Company regularly monitors customers<br />
for changes in credit risk. Trade receivables from international customers<br />
are often insured for events of non-payment through third-party export<br />
insurance. In cases where the credit quality of a customer does not meet<br />
the Company’s requirements, a cash deposit or letter of credit is received<br />
before goods are shipped.
84<br />
01 02 03 04 05<br />
financial statements<br />
The tables below summarize the undiscounted contractual payments of the Company’s financial liabilities as at December 31, <strong>2012</strong> and 2011:<br />
December 31, <strong>2012</strong> Total 0 - 6 months 6 - 12 months 12 - 24 months 2 - 4 years After 4 years<br />
$ $ $ $ $ $<br />
Bank debt [includes interest] 42,442 1,016 1,016 14,128 26,282 —<br />
Trade payables and provisions 19,771 19,771 — — — —<br />
Dividends payable 2,510 2,510 — — —<br />
Convertible unsecured subordinated debentures<br />
[include interest] 130,969 4,021 4,021 122,927 — —<br />
Total financial liability payments 195,692 27,318 5,037 137,055 26,282 —<br />
December 31, 2011 Total 0 - 6 months 6 - 12 months 12 - 24 months 2 - 4 years After 4 years<br />
$ $ $ $ $ $<br />
Bank debt [includes interest] 45,497 1,073 1,073 2,133 14,351 26,867<br />
Trade payables and provisions 24,486 24,486 — — — —<br />
Finance lease obligations 131 66 65 — — —<br />
Dividends payable 2,509 2,509 — — — —<br />
Convertible unsecured subordinated debentures<br />
[include interest] 139,011 4,021 4,021 8,042 122,927 —<br />
Acquisition price, transaction and financing costs<br />
payable 1,938 1,429 509 — — —<br />
Total financial liability payments 213,572 33,584 5,668 10,175 137,278 26,867
07 08 09 10 11<br />
85<br />
<strong>2012</strong> ANNUAL REPORT<br />
[b] Fair value<br />
Set out below is a comparison by class of the carrying amounts and fair value of the Company’s financial instruments that are carried in the consolidated<br />
financial statements:<br />
<strong>2012</strong> 2011<br />
Carrying amount Fair value Carrying amount Fair value<br />
$ $ $ $<br />
Financial assets<br />
Loans and receivables<br />
Cash and cash equivalents 2,171 2,171 6,839 6,839<br />
Restricted cash 34 34 2,439 2,439<br />
Accounts receivable 51,856 51,856 49,691 49,691<br />
Available-for-sale investment 2,000 2,000 2,800 2,800<br />
Derivative instruments 1,611 1,611 — —<br />
Financial liabilities<br />
Other financial liabilities<br />
Interest-bearing loans and borrowings 34,923 38,082 36,153 39,593<br />
Trade payables and provisions 19,771 19,771 24,486 24,486<br />
Finance lease obligations — — 131 131<br />
Dividends payable 2,510 2,510 2,509 2,509<br />
Acquisition price, transaction and financing costs payable — — 1,938 1,938<br />
Derivative instruments — — 1,828 1,828<br />
Convertible unsecured subordinated debentures 109,558 113,501 107,202 107,671
86<br />
01 02 03 04 05<br />
financial statements<br />
The fair value of the financial assets and liabilities are included at the amount at which the instrument could be exchanged in a current transaction between<br />
willing parties, other than in a forced or liquidation sale.<br />
The following methods and assumptions were used to estimate the fair values:<br />
• Cash and cash equivalents, restricted cash, accounts receivable, dividends payable, finance lease obligations, acquisition price, transaction and financing<br />
costs payable, accounts payable and provisions approximate their carrying amounts largely due to the short-term maturities of these instruments.<br />
• Fair value of quoted notes and bonds is based on price quotations at the reporting date. The fair value of unquoted instruments, loans from banks and<br />
other financial liabilities, as well as other non-current financial liabilities is estimated by discounting future cash flows using rates currently available for<br />
debt on similar terms, credit risk and remaining maturities.<br />
• The Company enters into derivative financial instruments with financial institutions with investment grade credit ratings. Derivatives valued using valuation<br />
techniques with market observable inputs are mainly foreign exchange forward contracts and one option embedded in a convertible debt agreement. The<br />
most frequently applied valuation techniques include forward pricing, using present value calculations. The models incorporate various inputs including<br />
the credit quality of counterparties and foreign exchange spot and forward rates.<br />
[c] Fair value [“FV”] hierarchy<br />
Ag Growth uses the following hierarchy for determining and disclosing the fair value of financial instruments by valuation technique:<br />
Level 1<br />
The fair value measurements are classified as Level 1 in the FV hierarchy if the fair value is determined using quoted, unadjusted market prices for identical<br />
assets or liabilities.<br />
Level 2<br />
Fair value measurements that require inputs other than quoted prices in Level 1, and for which all inputs that have a significant effect on the recorded fair<br />
value are observable, either directly or indirectly, are classified as Level 2 in the FV hierarchy.<br />
Level 3<br />
Fair value measurements that require unobservable market data or use statistical techniques to derive forward curves from observable market data and<br />
unobservable inputs are classified as Level 3 in the FV hierarchy.
07 08 09 10 11<br />
87<br />
<strong>2012</strong> ANNUAL REPORT<br />
The FV hierarchy of financial instruments measured at fair value on the consolidated statement of financial position is as follows:<br />
<strong>2012</strong> 2011<br />
Level 1 Level 2 Level 3 Level 1 Level 2 Level 3<br />
$ $ $ $ $ $<br />
Financial assets<br />
Cash and cash equivalents 2,171 — — 6,839 — —<br />
Available-for-sale investment — 2,000 — — 2,800 —<br />
Derivative instruments — 1,611 — — — —<br />
Restricted cash 34 — — 2,439 — —<br />
During the reporting periods ended December 31, <strong>2012</strong> and December 31, 2011, there were no transfers between Level 1 and Level 2 fair<br />
value measurements.<br />
At December 31, <strong>2012</strong>, Ag Growth has $34 of restricted cash, which is classified as a current asset [note 16].<br />
Interest from financial instruments is recognized in finance costs and finance income. Foreign currency and impairment reversal impacts for loans<br />
and receivables are reflected in other income (expense).<br />
28. CAPITAL DISCLOSURE AND MANAGEMENT<br />
The Company’s capital structure is comprised of shareholders’ equity and<br />
long-term debt. Ag Growth’s objectives when managing its capital structure<br />
are to maintain and preserve its access to capital markets, continue its<br />
ability to meet its financial obligations, including the payment of dividends,<br />
and finance future organic growth and acquisitions.<br />
Ag Growth manages its capital structure and makes adjustments to it in<br />
light of changes in economic conditions and the risk characteristics of the<br />
underlying assets. The Company is not subject to any externally imposed<br />
capital requirements other than financial covenants in its credit facilities<br />
and as at December 31, <strong>2012</strong> and December 31, 2011, all of these covenants<br />
were complied with [note 22].<br />
The Board of Directors does not establish quantitative capital structure<br />
targets for management, but rather promotes sustainable and profitable<br />
growth. Quantitative capital structure targets were disclosed in reporting<br />
periods prior to December 31, <strong>2012</strong>. Management monitors capital using<br />
non-GAAP financial metrics, primarily total debt to the trailing twelve<br />
months earnings before interest, taxes, depreciation and amortization<br />
[“EBITDA”] and net debt to total shareholders’ equity. There may be<br />
instances where it would be acceptable for total debt to trailing EBITDA<br />
to temporarily fall outside of the normal targets set by management such<br />
as in financing an acquisition to take advantage of growth opportunities or<br />
industry cyclicality. This would be a strategic decision recommended by<br />
management and approved by the Board of Directors with steps taken in<br />
the subsequent period to restore the Company’s capital structure based on<br />
its capital management objectives.
88<br />
01 02 03 04 05<br />
financial statements<br />
29. RELATED PARTY DISCLOSURES<br />
Relationship between parent and subsidiaries<br />
The main transactions between the corporate entity of the Company and its<br />
subsidiaries is the providing of cash fundings based on the equity and convertible<br />
debt funds of Ag Growth International Inc. Furthermore, the corporate entity of<br />
the Company is responsible for the billing and supervision of major construction<br />
contracts with external customers and the allocation of sub-projects to the<br />
different subsidiaries of the Company. Finally, the parent company is providing<br />
management services to the Company entities. Between the subsidiaries<br />
there are limited inter-company sales of inventories and services. Because all<br />
subsidiaries are currently 100% owned by Ag Growth International Inc., these<br />
inter-company transactions are 100% eliminated on consolidation.<br />
Compensation of key management personnel of Ag Growth<br />
Ag Growth’s key management consists of 25 individuals including its CEO,<br />
CFO, its Officers and other senior management, divisional general managers<br />
and its Directors.<br />
<strong>2012</strong> 2011<br />
$ $<br />
Short-term employee benefits 110 85<br />
Contributions to defined contribution plans 168 165<br />
Salaries 4,576 4,526<br />
Share-based payments 1,174 2,038<br />
Total compensation paid to key management personnel 6,028 6,814<br />
Key management interests in an employee incentive plan<br />
Share Awards held by key management personnel under the 2007 SAIP have the following expiry dates and exercise prices:<br />
<strong>2012</strong> 2011<br />
Issue date Expiry date Exercise price Number outstanding Number outstanding<br />
$ # #<br />
2007 January 1, 2010, 2011 and <strong>2012</strong> 0.10 — 40,000<br />
Key management employees have been granted the following LTIP awards for the different vesting dates without any exercise price:<br />
Shares outstanding<br />
<strong>2012</strong> 2011<br />
Issue date Expiry date # #<br />
2008 2010 - <strong>2012</strong> — 2,675<br />
2009 2011 - 2013 40,352 80,704<br />
2010 <strong>2012</strong> - 2014 33,996 50,997<br />
74,348 134,376
07 08 09 10 11<br />
89<br />
<strong>2012</strong> ANNUAL REPORT<br />
30. PROFIT PER SHARE<br />
Profit per share is based on the consolidated profit for the year divided by the weighted average number of shares outstanding during the year. Diluted profit<br />
per share is computed in accordance with the treasury stock method and based on the weighted average number of shares and dilutive share equivalents.<br />
The following reflects the income and share data used in the basic and diluted profit per share computations:<br />
<strong>2012</strong> 2011<br />
$ $<br />
Profit attributable to shareholders for basic and diluted profit per share 17,188 24,523<br />
Basic weighted average number of shares 12,471,757 12,423,173<br />
Dilutive effect of DDCP 26,269 16,719<br />
Dilutive effect of LTIP 74,348 122,463<br />
Diluted weighted average number of shares 12,572,374 12,562,355<br />
Basic profit per share 1.38 1.97<br />
Diluted profit per share 1.37 1.95<br />
There have been no other transactions involving ordinary shares or potential ordinary shares between the reporting date and the date of completion of<br />
these consolidated financial statements.<br />
The convertible unsecured subordinated debentures were excluded from the calculation of the above diluted net earnings per share because their<br />
effect is anti-dilutive.<br />
31. REPORTABLE BUSINESS SEGMENT<br />
The Company is managed as a single business segment that manufactures and distributes grain handling, storage and conditioning equipment. The Company<br />
determines and presents business segments based on the information provided internally to the CEO, who is Ag Growth’s Chief Operating Decision Maker<br />
[“CODM”]. When making resource allocation decisions, the CODM evaluates the operating results of the consolidated entity.<br />
All segment revenue is derived wholly from external customers and as the Company has a single reportable segment, inter-segment revenue is zero.
90 01 02 03 04 05<br />
financial statements<br />
Revenues<br />
Property, plant and equipment, goodwill, intangible<br />
assets and available-for-sale investment<br />
<strong>2012</strong> 2011 <strong>2012</strong> 2011<br />
$ $ $ $<br />
Canada 76,223 63,746 148,781 152,411<br />
United States 166,183 187,645 61,954 64,787<br />
International 71,936 54,541 8,295 10,422<br />
313,342 305,932 219,030 227,620<br />
The revenue information above is based on the location of the customer. The Company has no single customer that represents 10% or more of the<br />
Company’s revenues.<br />
32. COMMITMENTS AND CONTINGENCIES<br />
[a] Contractual commitment for the purchase of property, plant and equipment<br />
As of the reporting date, the Company has entered into commitments to purchase property, plant and equipment of $4.3 million.<br />
[b] Letters of credit<br />
As at December 31, <strong>2012</strong>, the Company has outstanding letters of credit in the amount of $1,354 [2011 – $1,987].<br />
[c] Operating leases<br />
The Company leases office and manufacturing equipment, warehouse facilities and vehicles under operating leases with minimum aggregate rent payable<br />
in the future as follows:<br />
$<br />
Within one year 959<br />
After one year but not more than five years 2,667<br />
3,626<br />
These leases have a life of between one and five years, with no renewal options included in the contracts.
07 08 09 10 11<br />
91<br />
<strong>2012</strong> ANNUAL REPORT<br />
During the year ended December 31, <strong>2012</strong>, the Company recognized an<br />
expense of $1,048 [2011 – $943] for leasing contracts. This amount relates<br />
only to minimum lease payments.<br />
[d] Finance leases<br />
The Company has finance leases for various items of manufacturing<br />
equipment. Future minimum lease payments under finance leases, together<br />
with the present value of the net minimum lease payments, are as follows:<br />
Minimum lease<br />
payments<br />
<strong>2012</strong> 2011<br />
$ $<br />
Minimum lease<br />
payments<br />
Within one year — 131<br />
After one year but not more<br />
than five years — —<br />
Total minimum lease<br />
payments — 131<br />
Less amount representing<br />
finance charges — 4<br />
Present value of minimum<br />
lease payments — 127<br />
[e] Legal actions<br />
The Company is involved in various legal matters arising in the ordinary<br />
course of business. The resolution of these matters is not expected to have<br />
a material adverse effect on the Company’s financial position, results of<br />
operations or cash flows.<br />
33. SUBSEQUENT EVENTS<br />
Subsequent to December 31, <strong>2012</strong>, the Company entered into an agreement<br />
to sell redundant property for estimated net proceeds of $5.8 million. The<br />
transaction is expected to be finalized on March 31, 2013.<br />
34. COMPARATIVE FIGURES<br />
Certain of comparative figures have been reclassified to conform to the<br />
current year’s presentation.<br />
The leased equipment is pledged as collateral. Interest expense related to<br />
obligations under capital leases was $3 for the year ended<br />
December 31, <strong>2012</strong> [2011 – $20].
92 01 02 03 04 05<br />
Effective March 14, 2013<br />
Directors<br />
Gary Anderson<br />
Janet Giesselman<br />
Bill Lambert, Board of Directors Chairman<br />
Bill Maslechko, Governance Committee Chairman<br />
Mac Moore<br />
David White, CA, ICD.D, Audit Committee Chairman<br />
Officers<br />
Gary Anderson, President, Chief Executive Officer and Director<br />
Steve Sommerfeld, CA, Executive Vice President and Chief Financial Officer<br />
Dan Donner, Senior Vice President, Sales and Marketing<br />
Paul Franzmann, CA, Senior Vice President, Operations<br />
Ron Braun, Vice President, Portable Grain Handling<br />
Paul Brisebois, Vice President, Marketing<br />
Tim Close, Vice President, Strategic Planning and Development<br />
Gurcan Kocdag, Vice President, Storage and Conditioning<br />
Craig Nimegeers, Vice President, Engineering<br />
Nicolle Parker, Vice President, Finance and Integration<br />
Tom Zant, Vice President, Commercial<br />
Eric Lister, Q.C., Counsel<br />
Additional information relating to the Company, including all public filings,<br />
is available on SEDAR (www.sedar.com).
07 08 09 10 11<br />
93<br />
<strong>2012</strong> ANNUAL REPORT
94 01 02 03 04 05
07 08 09 10 11<br />
95<br />
<strong>2012</strong> ANNUAL REPORT<br />
Ag Growth International<br />
198 Commerce Drive<br />
Winnipeg, MB R3P 0Z6<br />
Telephone: 204.489.1855<br />
Fax: 204.488.6929<br />
www.aggrowth.com<br />
Ag Growth IPO: May 18, 2004 (Founded 1996)<br />
Batco Manufacturing, Acquired: 1997 (Founded 1992)<br />
Wheatheart Manufacturing, Acquired: 1998 (Founded 1973)<br />
Westfield Industries, Acquired: 2000 (Founded 1950)<br />
Edwards Group, Acquired: 2005 (Founded 1964)<br />
Hi Roller Conveyors, Acquired: 2006 (Founded 1982)<br />
Twister Pipe Ltd., Acquired: 2007 (Founded 1976)<br />
Union Iron, Inc., Acquired: 2007 (Founded 1852)<br />
Applegate Steel Inc., Acquired: 2008 (Founded 1955)<br />
Mepu Oy, Acquired: 2010 (Founded 1952)<br />
Franklin Enterprises, Acquired: 2010 (Founded 1979)<br />
Tramco Inc., Acquired: 2010 (Founded 1967)<br />
Airlanco Inc., Acquired: 2011 (Founded 2000)