Getting Started with Chaos Cobweb Graphs ... - Texas Instruments
Getting Started with Chaos Cobweb Graphs ... - Texas Instruments
Getting Started with Chaos Cobweb Graphs ... - Texas Instruments

You also want an ePaper? Increase the reach of your titles
YUMPU automatically turns print PDFs into web optimized ePapers that Google loves.
<strong>Cobweb</strong> <strong>Graphs</strong>: Investigating <strong>Chaos</strong><br />
ID: 9974<br />
<strong>Getting</strong> <strong>Started</strong> <strong>with</strong> <strong>Chaos</strong><br />
Activity Overview<br />
In this activity, students investigate population growth using a variety of representations, leading<br />
to some observations about stable and unstable populations as an introduction to chaos theory.<br />
Concepts<br />
• Iterative processes, sequences, graphical representations of discrete data.<br />
____________________________________________________________________________<br />
Teacher Preparation<br />
This investigation offers opportunities for students to explore new branches of mathematics<br />
using multiple representations and a variety of mathematical tools. As such, care should be<br />
taken to provide ample time for ALL students to engage actively <strong>with</strong> the requirements of the<br />
task.<br />
• This activity can serve to introduce work on sequences and iteration.<br />
• Begin by discussing how mathematics is a growing branch of human knowledge and that<br />
much remains yet to be explored.<br />
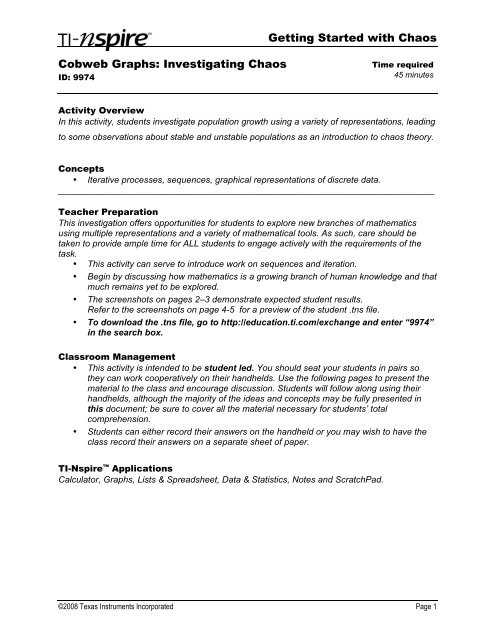
• The screenshots on pages 2–3 demonstrate expected student results.<br />
Refer to the screenshots on page 4-5 for a preview of the student .tns file.<br />
• To download the .tns file, go to http://education.ti.com/exchange and enter “9974”<br />
in the search box.<br />
Classroom Management<br />
• This activity is intended to be student led. You should seat your students in pairs so<br />
they can work cooperatively on their handhelds. Use the following pages to present the<br />
material to the class and encourage discussion. Students will follow along using their<br />
handhelds, although the majority of the ideas and concepts may be fully presented in<br />
this document; be sure to cover all the material necessary for students’ total<br />
comprehension.<br />
• Students can either record their answers on the handheld or you may wish to have the<br />
class record their answers on a separate sheet of paper.<br />
TI-Nspire Applications<br />
Calculator, <strong>Graphs</strong>, Lists & Spreadsheet, Data & Statistics, Notes and ScratchPad.<br />
Time required<br />
45 minutes<br />
©2008 <strong>Texas</strong> <strong>Instruments</strong> Incorporated Page 1
Step 1: Begin <strong>with</strong> discussion concerning<br />
applications of mathematics to such<br />
important areas as ecology and population<br />
growth, <strong>with</strong> mention of the new field of<br />
chaos theory as helping us to understand<br />
stable and unstable growth in complex<br />
systems.<br />
Step 2: Students should understand the way in<br />
which the simple quadratic relationship<br />
shown describes a model of growth for many<br />
naturally occurring populations.<br />
Step 3: In particular, students should be led to an<br />
appreciation of the role of equilibrium points<br />
as describing population values which may<br />
be expected to lead to stability: if x is the<br />
initial population, and the function F(x)<br />
describes the growth pattern, then the<br />
population after one year will be F(x), and<br />
after two years, will be F(F(x)), and so on.<br />
Now if F(x) = x, then, F(F(x)) = x, and so on<br />
for subsequent years.<br />
<strong>Getting</strong> <strong>Started</strong> <strong>with</strong> <strong>Chaos</strong><br />
©2008 <strong>Texas</strong> <strong>Instruments</strong> Incorporated Page 2
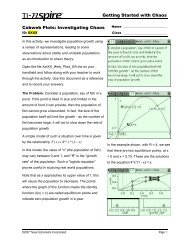
Step 4: More interesting still is to consider the<br />
behavior (or “orbit”) of a point which is NOT<br />
an equilibrium point, and how this changes<br />
over several years. A CobWeb Graph or<br />
webplot as shown offers a useful<br />
representation by which students may<br />
explore the impact of changes to both the<br />
starting value and the growth rate upon the<br />
long-term population growth.<br />
Step 5: Students will quickly observe that the actual<br />
starting value has far less impact upon<br />
population than the variable, R, which<br />
describes the population growth. Some<br />
values of R lead to regular, predictable<br />
cycles of growth, others to chaotic unstable<br />
behavior. Students should use the tools<br />
available to explore and attempt to locate the<br />
critical values of R for such occurrences.<br />
Introduction to the ideas of period doubling is<br />
important here.<br />
Step 6 (CAS EXTENSION): The availability of a<br />
CAS-based program for quickly and easily<br />
varying conditions and even the functions<br />
involved opens the doors for further<br />
exploration: what sort of functions lead to<br />
predictable growth patterns, and what sort<br />
lead to chaos?<br />
<strong>Getting</strong> <strong>Started</strong> <strong>with</strong> <strong>Chaos</strong><br />
Students should begin to appreciate that this part of mathematics is new and growing – unlike<br />
so much of the mathematics studied in schools. There are opportunities for discoveries and<br />
surprising new knowledge to be gained by those willing to be both patient and systematic in<br />
their explorations!<br />
©2008 <strong>Texas</strong> <strong>Instruments</strong> Incorporated Page 3
CobWeb <strong>Graphs</strong>: Investigating <strong>Chaos</strong> – ID: 9974<br />
(Student)TI-Nspire File: ActXX_Web_Plot2_EN.tns<br />
<strong>Getting</strong> <strong>Started</strong> <strong>with</strong> <strong>Chaos</strong><br />
©2008 <strong>Texas</strong> <strong>Instruments</strong> Incorporated Page 4
<strong>Getting</strong> <strong>Started</strong> <strong>with</strong> <strong>Chaos</strong><br />
©2008 <strong>Texas</strong> <strong>Instruments</strong> Incorporated Page 5