

spec

You also want an ePaper? Increase the reach of your titles
YUMPU automatically turns print PDFs into web optimized ePapers that Google loves.
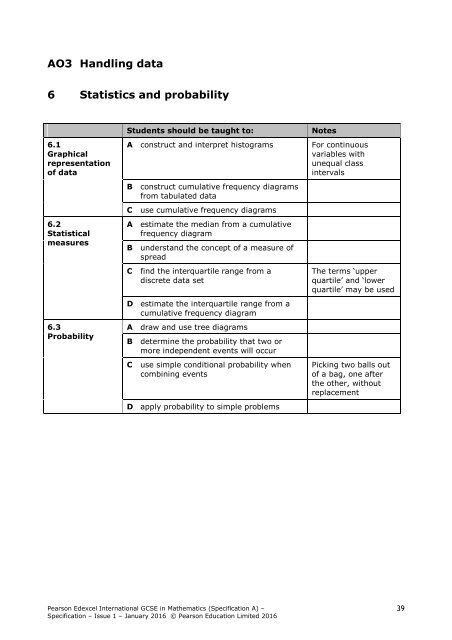
AO3 Handling data<br />
6 Statistics and probability<br />
6.1<br />
Graphical<br />
representation<br />
of data<br />
6.2<br />
Statistical<br />
measures<br />
6.3<br />
Probability<br />
Students should be taught to:<br />
A construct and interpret histograms<br />
B construct cumulative frequency diagrams<br />
from tabulated data<br />
C use cumulative frequency diagrams<br />
A estimate the median from a cumulative<br />
frequency diagram<br />
B understand the concept of a measure of<br />
spread<br />
C find the interquartile range from a<br />
discrete data set<br />
D estimate the interquartile range from a<br />
cumulative frequency diagram<br />
A draw and use tree diagrams<br />
B determine the probability that two or<br />
more independent events will occur<br />
C use simple conditional probability when<br />
combining events<br />
D apply probability to simple problems<br />
Notes<br />
For continuous<br />
variables with<br />
unequal class<br />
intervals<br />
The terms ‘upper<br />
quartile’ and ‘lower<br />
quartile’ may be used<br />
Picking two balls out<br />
of a bag, one after<br />
the other, without<br />
replacement<br />
Pearson Edexcel International GCSE in Mathematics (Specification A) –<br />
Specification – Issue 1 – January 2016 © Pearson Education Limited 2016<br />
39