Indian Gold Book:Indian Gold Book - Gold Bars Worldwide
Indian Gold Book:Indian Gold Book - Gold Bars Worldwide
Indian Gold Book:Indian Gold Book - Gold Bars Worldwide

You also want an ePaper? Increase the reach of your titles
YUMPU automatically turns print PDFs into web optimized ePapers that Google loves.
AN INTRODUCTION TO THE<br />
INDIAN GOLD MARKET<br />
MAJOR SPONSOR<br />
WORLD GOLD COUNCIL<br />
CORPORATE SPONSOR<br />
RAND REFINERY LIMITED<br />
Published by Virtual Metals Research & Consulting Ltd and Grendon International Research Pty Ltd
AN INTRODUCTION TO THE INDIAN GOLD MARKET<br />
INDUSTRY COMMENTS<br />
Comments in letters, faxes and emails include: Reserve Bank of India (“an excellent work”),<br />
State Bank of India (“excellent coverage”) and The Gem & Jewellery Export Promotion<br />
Council (“a wonderful, educative, informative book”).<br />
“This volume is an absolute boon … The resulting accumulation of facts and data is of fantastic<br />
value to anyone who wants to understand the history and nature of the world’s most important<br />
market for gold.”<br />
London Bullion Market Association<br />
“It has provided an excellent basis for the Council and its members to learn about the complex<br />
dynamics of the market, and also is a strong foundation for us to review our operational<br />
business plans and strategies for the <strong>Indian</strong> market … it has added significant value to our<br />
operations there.”<br />
World <strong>Gold</strong> Council<br />
“It is necessary to understand the intricacy of market structures and the historical sequence of<br />
events (of the <strong>Indian</strong> gold market). The book by Nigel Desebrock … provides a veritable gold<br />
mine of authentic information”.<br />
S.S. Tarapore (former Deputy Governor, Reserve Bank of India), Financial Express<br />
(India)<br />
PHONE AND FAX NUMBERS IN INDIA<br />
In October 2002, Mumbai telephone exchanges either<br />
prefixed a “2” to the local number, or replaced the first<br />
digit with “56”. Since then, exchanges in other cities have<br />
also made changes. In this publication, while the listed<br />
Mumbai numbers take the changes into account,<br />
numbers for other parts of the country do not.
AN INTRODUCTION TO THE<br />
INDIAN GOLD MARKET<br />
By<br />
NIGEL DESEBROCK<br />
Grendon International Research Pty Ltd<br />
GRENDON<br />
INTERNATIONAL<br />
RESEARCH<br />
GOLD<br />
MARKETING<br />
CONSULTANT<br />
Published in association with
Published in December 2002 by Virtual Metals Research & Consulting Ltd and<br />
Grendon International Research Pty Ltd.<br />
Virtual Metals Research & Consulting Ltd<br />
100 Ashmill Street, London NW1 6RA, United Kingdom<br />
Tel: 44-20-7487 3600<br />
Fax: 44-20-7224 4527<br />
Email: jessicacross@compuserve.com<br />
Grendon International Research Pty Ltd<br />
33 Alexandra Road, East Fremantle, WA 6158, Australia<br />
Tel: 61-8-9319 2171<br />
Fax: 61-8-9319 2154<br />
Email: grendon@global.net.au<br />
Grendon International Research Pty Ltd for Grendon International Research Trust<br />
Incorporated in Western Australia<br />
Australian Business Number (ABN): 79 486 548 064<br />
Australian Company Number (ACN): 009 424 686<br />
The publication is the outcome of a joint project by Virtual Metals Research & Consulting Ltd (“Virtual Metals”) and<br />
Grendon International Research Pty Ltd (“GIR”).<br />
© Grendon International Research Pty Ltd<br />
ISBN 0-9750147-0-6<br />
The publication is protected by international copyright law. All rights are reserved. Apart from fair dealing for the<br />
purposes of private study, criticism or review, no part may be reproduced, stored in a retrieval system, or transmitted in any<br />
form by any means electronic, mechanical, photocopying, recording or otherwise without the prior written permission of the<br />
copyright owners. However, brief extracts may be reproduced by gold industry entities without formal permission but only<br />
with the full and appropriate citing of the original source and a specific reference to the publishers as follows:<br />
Source: Grendon International Research/Virtual Metals<br />
Although GIR, as the author and copyright owner, has made all reasonable efforts to ensure that the information was<br />
accurate at the time of publication, there may be inadvertent errors and omissions and a lack of accuracy or correctness. It<br />
makes no representation or warranty, express or explicit, as to the accuracy or completeness of the information. The<br />
publication is not and cannot be construed as an offer to sell, buy or trade any securities, equities, commodities or related<br />
derivative products, and the publication in no way offers investment advice.<br />
Virtual Metals, GIR and their employees accept no liability for any direct, special, indirect or consequential losses or<br />
damages, or any other losses or damages of whatever kind, resulting from whatever action or cause through the use of any<br />
information obtained directly or indirectly from the information in the publication. Virtual Metals and GIR also have no<br />
obligation to inform recipients or readers if, in the future, the information contained in the publication is modified or<br />
corrected.<br />
Circulation of this publication is limited to leading gold industry entities. Copies are subject to availability.<br />
Requests should be directed as follows:<br />
Within India: Contact WGC India (Mumbai and Chennai).<br />
Rest of world: Contact Virtual Metals (London).<br />
2<br />
AN INTRODUCTION TO THE INDIAN GOLD MARKET<br />
Designed by Grendon International Research Pty Ltd.<br />
Cover photograph by Harmony <strong>Gold</strong> Mining Company Ltd, South Africa.<br />
Typesetting and layout by Groupacumen Pty Ltd, Perth, Australia.<br />
Printed by Scott Print Ltd, Perth, Australia.<br />
AN INTRODUCTION TO THE INDIAN GOLD MARKET
INDUSTRY SUPPORT<br />
MAJOR SPONSOR<br />
CORPORATE SPONSOR<br />
TRADE SUPPORT<br />
An Introduction to the <strong>Indian</strong> <strong>Gold</strong> Market has relied greatly on the support of<br />
gold-related organisations and businesses that kindly provided information and advice.<br />
16 government-related organisations and departments<br />
14 banks and other official bullion importers<br />
31 bullion dealers, refiners and coin fabricators<br />
114 jewellery fabricators, wholesalers and retailers<br />
16 other gold-related entities<br />
Consultant in India<br />
Madhusudan Daga<br />
AN INTRODUCTION TO THE INDIAN GOLD MARKET 3
4<br />
FOREWORD<br />
AN INTRODUCTION TO THE INDIAN GOLD MARKET<br />
This publication, together with the comprehensive analytical study, India’s <strong>Gold</strong>en Era,<br />
The Age of Kaliyug, from which it has been extracted, came about when the gold<br />
mining companies that underwrite and sponsor Virtual Metals Research & Consulting Ltd<br />
asked a seemingly simple question. Would they still be able to sell their ten-tola bars<br />
into India in ten years time? It seemed bizarre that, despite India being the world’s<br />
largest consumer of gold and thus of vital importance to the global gold business, the<br />
world’s understanding of the domestic gold industry proved superficial. At the same<br />
time, conventional wisdom seemed to insist that India was a bottomless pit into which<br />
vast quantities of gold would continue to disappear, never to be seen by the global gold<br />
market again. Was this true?<br />
Having thus been commissioned Virtual Metals, in partnership with Grendon International<br />
Research, set off for India to find out at first hand what actually happens there, how,<br />
where and why it happens and if it will continue to happen in the future. The fruits of<br />
these months of labour are, firstly, the analytical report The Age of Kaliyug which<br />
contains not only a wealth of trade-related information and analysis by Grendon<br />
International Research but also an extensive macro analysis by Virtual Metals of the<br />
economic, social and political factors driving the <strong>Indian</strong> gold market, as well as<br />
recommendations; secondly, the publication in your hand, An Introduction to the <strong>Indian</strong><br />
<strong>Gold</strong> Market.<br />
It is Virtual Metals stated philosophy to support the precious metals markets wherever<br />
possible and to actively seek ways of giving something back to the industry that we all<br />
rely upon. Through sponsorship, Virtual Metals and Grendon International Research are<br />
delighted to be able to share freely a sizeable proportion of the project’s basic market<br />
intelligence.<br />
Without the World <strong>Gold</strong> Council as the major sponsor and Rand Refinery Limited as the<br />
corporate sponsor, the publication of An Introduction to the <strong>Indian</strong> <strong>Gold</strong> Market could not<br />
have been funded, so our thanks go to them for their support and generosity. The<br />
overall project is indebted to the foresight and vision of the underwriters and sponsors<br />
of Virtual Metals: <strong>Gold</strong> Fields Ltd, Harmony <strong>Gold</strong> Mining Company Ltd, Western Areas Ltd<br />
and Barrick Mining Ltd.<br />
To acquire a copy of the comprehensive analytical report India’s <strong>Gold</strong>en Era – The<br />
Age of Kaliyug please contact Virtual Metals in London. The price is US$ 9,000.<br />
Jessica Cross<br />
Chief Executive Officer<br />
Virtual Metals Research & Consulting Ltd November 2002<br />
AN INTRODUCTION TO THE INDIAN GOLD MARKET
PREFACE<br />
An Introduction to the <strong>Indian</strong> <strong>Gold</strong> Market is based on the outcome of four GIR fieldtrips (totalling 14 weeks)<br />
between November 2001 and September 2002, and extensive communication by phone, fax and email with relevant trade<br />
entities.<br />
It also relies on information gathered by GIR over many visits to India since 1990. In 1993, GIR compiled an unpublished<br />
report on the <strong>Indian</strong> gold market for the World <strong>Gold</strong> Council. This earlier marketing consultancy project, in particular, has<br />
assisted GIR to view the current market from an historical perspective.<br />
The publication has been compiled according to three objectives:<br />
• Consolidate accessible statistical and other information on the <strong>Indian</strong> gold market into a single source of reference.<br />
• Focus on the gold bullion and jewellery markets, the nature of consumer demand from the trade perspective, and the<br />
role of the <strong>Indian</strong> Government.<br />
• Support the promotion of gold in India.<br />
EXTERNAL STATISTICS<br />
The official import and rupee gold price statistics rely largely on Madhusudan Daga, who collates them on behalf of most<br />
international analysts. The estimates of unofficial imports, and the breakdown of industrial gold demand, also rely on<br />
Mr Daga. Imports of gold for re-export as jewellery are derived from statistics provided by The Gem & Jewellery Export<br />
Promotion Council. Where external published statistics are recorded, the source is noted below the table.<br />
GIR STATISTICS AND MARKET INFORMATION<br />
Estimates of gross and net demand for jewellery, coins and bars, other tabulated market statistics and general market<br />
information are necessarily based on anecdotal evidence provided by the trade, a constraint that applies to all analysts both<br />
inside and outside India.<br />
Leading trade entities repeatedly advise that the <strong>Indian</strong> gold market is so fragmented and complex, and so variable by State,<br />
by rural and urban area, and by retailer even in the same locality, that no one can produce a definitive report. It means,<br />
for example, that statistical estimates of the breakdown of demand and the level of recycling can only be indicative.<br />
Although GIR has tried to represent the broad view of most trade entities visited, the report should be seen<br />
for what it is: a consolidated reference work that others can build upon or modify according to their own<br />
understanding of the market, or as new or revised information becomes available.<br />
It can also be recognised that there is not yet a broad consensus among analysts inside and outside India on several aspects<br />
of the market. For example, findings in the report suggest that the level of recycling and coin fabrication is higher, and the<br />
level of net bar hoarding is lower, than normally reported outside India. In recent years, the nature of <strong>Indian</strong> gold demand<br />
appears to have changed greatly, influenced not least by a largely static rupee gold price between 1998 and 2001.<br />
This publication, designed and compiled by GIR, is one part of a much broader joint research and consultancy project on<br />
India and its gold market undertaken by Virtual Metals and GIR. I would like to thank the indefatigable Jessica Cross,<br />
CEO of Virtual Metals, and her team, Gary Mead, Tom Butler, Matthew Turner and Sarah Marsden for all their support<br />
throughout the overall project.<br />
Nigel Desebrock<br />
Director<br />
Grendon International Research Pty Ltd (GIR) November 2002<br />
AN INTRODUCTION TO THE INDIAN GOLD MARKET 5
STATISTICAL TABLES AND APPENDICES ..............................................................................................................8<br />
ACKNOWLEDGEMENTS ........................................................................................................................................11<br />
CHAPTERS<br />
AN INTRODUCTION TO THE INDIAN GOLD MARKET<br />
TABLE OF CONTENTS<br />
1. SUMMARY AND POSITIVE FINDINGS ..........................................................................................................14<br />
2. ROLE OF INDIAN GOVERNMENT ..................................................................................................................24<br />
3. ORIENTATION ................................................................................................................................................36<br />
4. GOLD BULLION<br />
Imported gold bars ............................................................................................................................................51<br />
Bullion importers ..............................................................................................................................................58<br />
Banks ..............................................................................................................................................................60<br />
<strong>Gold</strong> Deposit Scheme ........................................................................................................................................68<br />
Public Sector Undertakings ................................................................................................................................72<br />
Non-Resident <strong>Indian</strong> (NRI) <strong>Gold</strong> Import Scheme ..................................................................................................76<br />
Bullion dealers ..................................................................................................................................................78<br />
<strong>Gold</strong> refiners ......................................................................................................................................................80<br />
Coin fabricators ..................................................................................................................................................82<br />
Bar hoarding ....................................................................................................................................................86<br />
Bulk delivery of official gold imports ....................................................................................................................88<br />
5. GOLD JEWELLERY<br />
Perspective ........................................................................................................................................................93<br />
<strong>Gold</strong> jewellery products ......................................................................................................................................94<br />
Jewellery fabricators ........................................................................................................................................102<br />
Traditional jewellery retailers ............................................................................................................................106<br />
<strong>Gold</strong> jewellery consumers ................................................................................................................................114<br />
Branded jewellery retail chains ..........................................................................................................................128<br />
Hallmarking ....................................................................................................................................................132<br />
<strong>Gold</strong> jewellery exports ......................................................................................................................................136<br />
6. INDUSTRIAL GOLD USAGE ..........................................................................................................................142<br />
7. MUMBAI GOLD PRICES ................................................................................................................................146<br />
8. PRICING AND PROFITABILITY ....................................................................................................................152<br />
9. GOLD MINING AND EXPLORATION ............................................................................................................162<br />
10. GOLD SUPPLY AND DEMAND ......................................................................................................................166<br />
SUPPLEMENTARY SECTIONS<br />
World <strong>Gold</strong> Council ................................................................................................................................................177<br />
Communication ......................................................................................................................................................184<br />
Bibliography............................................................................................................................................................189<br />
About Virtual Metals Research & Consulting Ltd ........................................................................................................190<br />
About Grendon International Research Pty Ltd ..........................................................................................................191<br />
6<br />
AN INTRODUCTION TO THE INDIAN GOLD MARKET
AN INTRODUCTION TO THE INDIAN GOLD MARKET<br />
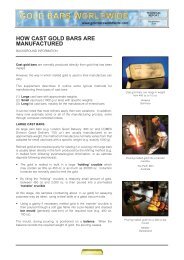
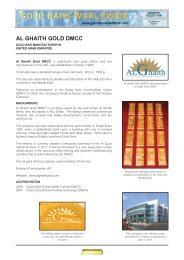
Photograph: Alukkas<br />
India is the cornerstone of the world’s physical gold market.<br />
It fabricates annually more than 1,000 tonnes of gold jewellery - approximately 30% of the<br />
gross amount of gold jewellery fabricated worldwide.<br />
AN INTRODUCTION TO THE INDIAN GOLD MARKET 7
AN INTRODUCTION TO THE INDIAN GOLD MARKET<br />
STATISTICAL TABLES AND APPENDICES<br />
ROLE OF INDIAN GOVERNMENT<br />
Official gold reserves 1950 – 2001 ..........................................................................................................................29<br />
Customs duties, State sales and other taxes ............................................................................................................30<br />
Indicative cost of gold imports 1990 – 2001 ............................................................................................................31<br />
Chronology of <strong>Indian</strong> Government initiatives 1947 – 1990 ........................................................................................32<br />
<strong>Gold</strong> Control Rules 1963 and the <strong>Gold</strong> (Control) Act 1968 ........................................................................................33<br />
Licensed gold dealers and certified goldsmiths in 1989 ..............................................................................................35<br />
ORIENTATION<br />
Map of India ..........................................................................................................................................................37<br />
Population<br />
States ....................................................................................................................................................................38<br />
Urban and rural ......................................................................................................................................................39<br />
Major cities ............................................................................................................................................................40<br />
Households – split by social class ............................................................................................................................41<br />
Economic indices<br />
Agricultural and Industrial Production and GDP ........................................................................................................42<br />
Exchange rates, share prices, interest rates and inflation ..........................................................................................42<br />
States – indicative per capita income ......................................................................................................................43<br />
Agriculture<br />
Number of agricultural holdings ..............................................................................................................................46<br />
Major crops – normal area, production and indicative value ......................................................................................47<br />
Monsoons<br />
Map of South West monsoon ..................................................................................................................................48<br />
Performance of South West monsoon ......................................................................................................................49<br />
Extent of irrigation ..................................................................................................................................................49<br />
GOLD BULLION<br />
Imported gold bars<br />
International bar manufacturers ..............................................................................................................................52<br />
Technical dimensions ..............................................................................................................................................52<br />
Illustrations of TT bars ............................................................................................................................................53<br />
International gold dealers ........................................................................................................................................54<br />
<strong>Gold</strong> weight conversion table ..................................................................................................................................55<br />
LBMA and London <strong>Gold</strong> Fixings ................................................................................................................................56<br />
Bullion importers<br />
<strong>Gold</strong> imports for domestic consumption 1990 – 2001 ................................................................................................59<br />
Banks<br />
Banks authorised to import gold ..............................................................................................................................60<br />
Summary of <strong>Gold</strong> Cell services ................................................................................................................................64<br />
<strong>Gold</strong> Cell branches ....................................................................................................................................................66<br />
<strong>Gold</strong> Deposit Scheme<br />
Historical Government gold bond schemes 1962 – 1993 ..............................................................................................69<br />
Participating bank branches ....................................................................................................................................70<br />
Public Sector Undertakings<br />
Summary of <strong>Gold</strong> Cell services ................................................................................................................................73<br />
<strong>Gold</strong> Cell branches ..................................................................................................................................................75<br />
Non-Resident <strong>Indian</strong> (NRI) <strong>Gold</strong> Import Scheme<br />
NRI gold imports 1992 – 2001 ................................................................................................................................76<br />
Refiners and coin fabricators<br />
Large and organised gold refiners ............................................................................................................................80<br />
Standard minted coin weights ..................................................................................................................................84<br />
8<br />
AN INTRODUCTION TO THE INDIAN GOLD MARKET
AN INTRODUCTION TO THE INDIAN GOLD MARKET<br />
Bulk delivery of official gold imports<br />
Sources of bulk delivery ............................................................................................................................................89<br />
Shipping agent offices ............................................................................................................................................89<br />
International airports and Customs clearance cities ..................................................................................................90<br />
GOLD JEWELLERY<br />
Jewellery products<br />
Important categories ..............................................................................................................................................94<br />
Handmade jewellery weights ..................................................................................................................................95<br />
Machine-made jewellery weights ..............................................................................................................................95<br />
Illustrations of regional gold jewellery styles ............................................................................................................96<br />
Traditional jewellery retailers<br />
Number ................................................................................................................................................................106<br />
Methods of payment ............................................................................................................................................107<br />
<strong>Gold</strong> jewellery consumers<br />
Rural versus urban demand ..................................................................................................................................121<br />
Regional demand ..................................................................................................................................................121<br />
Importance of cities as retail centres ......................................................................................................................122<br />
Indicative bridal amounts by social class ................................................................................................................124<br />
Indicative wedding sets ........................................................................................................................................125<br />
Indicative seasonality ............................................................................................................................................126<br />
Auspicious days for Hindu weddings ......................................................................................................................127<br />
Branded jewellery retail chains<br />
Location of outlets ................................................................................................................................................131<br />
Hallmarking<br />
Location of Hallmarking Centres ............................................................................................................................134<br />
<strong>Gold</strong> jewellery exports<br />
<strong>Gold</strong> bullion supplied to jewellery exporters ............................................................................................................137<br />
Exports to major markets ......................................................................................................................................138<br />
Value addition ......................................................................................................................................................138<br />
Location of export fabrication ................................................................................................................................139<br />
GJEPC membership and registration ......................................................................................................................140<br />
INDUSTRIAL GOLD USAGE<br />
Industrial gold usage 1990 – 2001 ........................................................................................................................144<br />
MUMBAI GOLD PRICES<br />
Annual 1925 – 1969 ..............................................................................................................................................148<br />
Annual 1970 – 2001 ..............................................................................................................................................149<br />
Monthly 1997 – 2001 ............................................................................................................................................150<br />
PRICING AND PROFITABILITY<br />
<strong>Gold</strong> bullion ..........................................................................................................................................................154<br />
<strong>Gold</strong> jewellery ......................................................................................................................................................156<br />
<strong>Gold</strong> refining ........................................................................................................................................................160<br />
Minted coins and bars ............................................................................................................................................161<br />
GOLD MINING AND EXPLORATION<br />
<strong>Gold</strong> production by State and District ....................................................................................................................164<br />
<strong>Gold</strong> production 1970 – 2001 ................................................................................................................................165<br />
GOLD SUPPLY AND DEMAND<br />
Net new gold supply ............................................................................................................................................170<br />
Indicative usage of net new gold supply ................................................................................................................171<br />
Indicative gross jewellery fabrication ......................................................................................................................172<br />
Indicative gross fabrication and demand ................................................................................................................173<br />
Total gold imports including gold for jewellery exporters ..........................................................................................174<br />
Indicative above ground gold stocks ......................................................................................................................175<br />
AN INTRODUCTION TO THE INDIAN GOLD MARKET 9
10<br />
AN INTRODUCTION TO THE INDIAN GOLD MARKET<br />
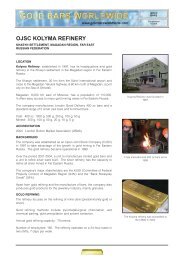
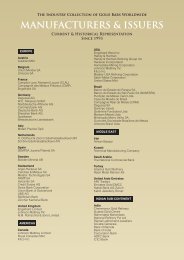
The domestic gold bullion market relies on a small cast bar weighing 10 tolas (3.75 oz).<br />
AN INTRODUCTION TO THE INDIAN GOLD MARKET
ACKNOWLEDGEMENTS<br />
GIR FIELDTRIPS<br />
GIR visited New Delhi and 11 States: Punjab, Haryana, Uttar Pradesh and Rajasthan (north), West Bengal<br />
(east), Gujarat and Maharashtra (west) and Andhra Pradesh, Karnataka, Tamil Nadu and Kerala (south).<br />
There was a focus on the south as it is the most important gold consuming region.<br />
GIR conducted interviews in 38 cities, towns and villages. Apart from New Delhi, the cities were Ludhiana, Panipat, Agra,<br />
Meerut, Mathura and Jaipur (north), Kolkata (east), Mumbai, Thane, Ahmedabad and Nagpur (west), and Hyderabad,<br />
Bangalore, Chennai, Coimbatore, Cochin/Ernakulam and Trichur (south).<br />
Meetings were held with representatives of 16 government-related departments and organisations, 14 banks and other<br />
official gold importers, 31 bullion dealers, refiners and coin fabricators, 114 jewellery fabricators, wholesalers and retailers,<br />
and 16 other gold-related entities.<br />
In total, GIR interviewed more than 200 people at 191 gold-related businesses and institutions. Several were visited two<br />
and more times to try to clarify the outcome of earlier discussions. GIR is indebted to everyone for their patience and<br />
support, and especially to WGC India and Mr Daga.<br />
INDUSTRY SUPPORT<br />
The encouragement, advice and trade introductions of the dedicated WGC India team were greatly<br />
appreciated: G.S. Pillai, Hiroo Mirchandani, Kumar Shivram, Madhumita Manna Kulkarni, Manos Mukherjee<br />
and Sharmili Rajput.<br />
Madhusudan Daga, India’s leading authority on the <strong>Indian</strong> gold market since the early 1950s (50 years), acted as a<br />
consultant on many aspects of the market. His knowledge of the market and his views communicated over several days,<br />
including a fieldtrip to the remarkable rural town of Jalgaon (Maharashtra), were invaluable and enormously stimulating.<br />
GIR is particularly grateful to several leading jewellery retailers who continued to provide information after the meetings.<br />
Notably, R.K. Nagarkar and P.C. Gupte (Tribhovandas Bhimji Zaveri, Zaveri Bazaar, Mumbai) who also kindly sent photographs<br />
to illustrate regional gold jewellery styles, Rakesh Saraf (Girdhari Lal Saraf, New Delhi), Mukesh Kohli (Raj Jewellers, New<br />
Delhi), Dr Nawal Agrawal (Birdichand Ghanshyamdas, Jaipur), Subir Kumar Sen (B.C. Sen, Kolkata) and Biplabankur<br />
and Shibankur Roychowdhury (M.P. Jewellers, Kolkata), G.B. Umesh (Ganjam, Bangalore), and Ashwin Vummidi (Vummidi<br />
Bangaru Chetty, Chennai).<br />
D.C. Karel (D.C. Karel, Kolkata), Dinesh Zaveri (Harjivandas Juthabhai Zaveri, Ahmedabad), S. Santosh Kumar (National<br />
Institute of Jewellery Design, Ahmedabad), Senthil Kota (Kota, Coimbatore), Vr. Gunashekar (Kirtilals, Hyderabad) and S.<br />
Sanathana Pai (A. Geeri Pai, Cochin) also kindly assisted GIR to visit local towns and villages in their States. When visiting<br />
rural areas in the Punjab, Haryana, Uttar Pradesh and Rajasthan, GIR was accompanied by an interpreter, Pawan Bhardwaj.<br />
Many others also went out of their way to support the project. Professor T. Haque (Ministry of Agriculture, New Delhi)<br />
contributed greatly to GIR’s basic understanding of the rural economy. S.P. Batra (National Council of Applied Economic<br />
Research, New Delhi) and Mita Roychowdury and A. Basu (DGCIS) provided much written information on request. Jose<br />
Alukka (Alukkas, Trichur) and Fahim Kahn (Hutti <strong>Gold</strong> Mines, Bangalore) provided supplementary photographs. V.S.A. Sury<br />
and V. Sreedhar (GJEPC, Mumbai), Dr K.K. Chatterjee (<strong>Indian</strong> Bureau of Mines, Nagpur), Dr Sneh Bhatla (Bureau of <strong>Indian</strong><br />
Standards, New Delhi), Anand Trivedi (MMTC, New Delhi), Rajan Venkatesh (ScotiaMocatta, Mumbai) and Raghav Kamath<br />
(Corporation Bank, Mumbai) kindly reviewed relevant draft texts.<br />
The observations of Bhargava Vaidya (gold market consultant, Mumbai) were also much appreciated.<br />
AN INTRODUCTION TO THE INDIAN GOLD MARKET 11
GIR is greatly indebted to the<br />
following for providing information<br />
and sharing their knowledge of the<br />
<strong>Indian</strong> gold market.<br />
Consultant in India<br />
Madhusudan Daga<br />
World <strong>Gold</strong> Council - India<br />
G S Pillai<br />
Hiroo Mirchandani<br />
Kumar Shivram<br />
Manos Mukherjee<br />
Sharmili Rajput<br />
Deepti Handa<br />
Indhumathi N Kumar<br />
Jayanti Roy<br />
Leena Saldahna<br />
Sunita Ramachandran<br />
Government-related<br />
departments and organisations<br />
A Basu<br />
Anup K Pujari<br />
Balwant Rai<br />
Dr K K Chatterjee<br />
Dr Pradip Sarkar<br />
Dr Sneh Bhatla<br />
K S Saha<br />
M Brahmanandan<br />
M Mishra<br />
M P Kothari<br />
Mita Roychowdury<br />
Ms Savitri Devi<br />
P K Mohanty<br />
P R Ravi Mohan<br />
Pranab K Das<br />
Prasanna K Dash<br />
Professor T Haque<br />
R K Maggo<br />
R N Kar<br />
S K Ghosh<br />
S R Das<br />
Satish Chander<br />
Sunil K Bhargava<br />
Banks and official importers<br />
Anand Trivedi<br />
Anjana Singh<br />
Atul Goel<br />
Biswajyoti Upadhay<br />
C M Yadav<br />
D K Seth<br />
D M Chinnappan<br />
Darryl Netto<br />
Dinesh Saxena<br />
Gautam P Puntambekar<br />
Hitesh Jagota<br />
I M Sarin<br />
K A Krishnamurthy<br />
M K Shah<br />
Marasimha Moger<br />
Muthanna Badiger<br />
Pradeep Das<br />
R Choudhary<br />
Raghav Kamath<br />
Rajesh Raheja<br />
Rajan Venkatesh<br />
12<br />
ACKNOWLEDGEMENTS<br />
Rajesh Saigal<br />
S N Gupta<br />
Samir Kaul<br />
T I Bhattacharya<br />
V K Anand<br />
V K Khanna<br />
V K Sud<br />
Bullion dealers, refiners and coin<br />
fabricators<br />
A K Chamaria<br />
B J Jain<br />
Bhawar Kothari<br />
D Anantkumar Deokar<br />
Daman Prakash<br />
Davendra Doneria<br />
Dinesh Parekh<br />
Harmesh Aurora<br />
Harshad Ajmera<br />
James Joseph<br />
Ketan Shroff<br />
Kuldip Soni<br />
Kumar Paljain<br />
M M Dey<br />
Manoj Kapur<br />
Mukul Sonawala<br />
Radhika Dattani<br />
Rajeev Mohandas Naik<br />
Rajesh Parekh<br />
Ramesh Agarwal<br />
S P Sonawala<br />
S Thiyagarajan<br />
Sanjay Gupta<br />
Shanker Agarwal<br />
Shantilal Pincha<br />
Suresh Hundia<br />
Suresh Kansara<br />
V L Koppar<br />
Vasanal Mehta<br />
Vinay Jalan<br />
Vivek Prabhakar<br />
Jewellery fabricators,<br />
wholesalers and retailers<br />
A Abraham<br />
A N Bharati<br />
A Saravanan<br />
Abhay K Jain<br />
Alok Prakash<br />
Amit Agarwal<br />
Anthony Thottan<br />
Arihant Jain<br />
Arun Soni<br />
Arvind Jain (Dhakad)<br />
Ashok Vastani<br />
Ashwin Vummidi<br />
B Bindu Madhav<br />
B Nemichand Marlecha<br />
B Parekh<br />
Babu Alapatt<br />
Bharat Zaveri<br />
Bhushan S Surpur<br />
Bijoy Kumar Chandra<br />
Biplabankur Roychowdury<br />
D C Karel<br />
Chandresh Zaveri<br />
D D Karel<br />
D R Ragunath<br />
AN INTRODUCTION TO THE INDIAN GOLD MARKET<br />
D Vimal Solankar<br />
Deepak Mehra<br />
Dinesh Kumar Bansal<br />
Dinesh Zaveri<br />
Dr Nawal Agrawal<br />
G B Umesh<br />
G Chandra Shekar<br />
G Nemichand Jain<br />
G Sureshkumar<br />
Ganesh Namah<br />
Goutham Chand<br />
Haleema Sayed<br />
Haru Zaveri<br />
Hasmukh Parekh<br />
Hasmuth Thaker<br />
Hiren Soni<br />
Ishwarlal Jain<br />
J Ashok Kumar Mundhada<br />
Japan Kumar Pantoo<br />
Jiten Parekh<br />
Johnson Verghese<br />
Jose Alukka<br />
Joseph Sebastian<br />
K C Peter<br />
K Ramasany<br />
K V Kishore<br />
Kamlesh Kumar<br />
Kanchan Lal Agrawal<br />
Kishor Seth<br />
Krishna B Goyal<br />
Lalit Kumar<br />
Ln S Venkateshan<br />
M Chainraj<br />
Mahesh Jain<br />
Mahesh Rao<br />
Manish Jain<br />
Manoj Kumar Karel<br />
Mr Balachandar<br />
Mr Sajjanraj<br />
Mr Sreeramalu<br />
Mukesh Kohli<br />
Mukesh Jain<br />
N A Kumar<br />
Naresh Chetan<br />
Nathella Prapanna Kumar<br />
Nathubhai Soni<br />
Navin Mehta<br />
Niranjan Prasad<br />
P C Gupte<br />
P J Jenson<br />
P Purusothamman<br />
Padam Goel<br />
Pankaj Gupta<br />
Pankaj Jain<br />
Prakash Chandra Pincha<br />
Prakash Jain<br />
Pramesh Choksi<br />
Princeson Jose<br />
R K Nagarkar<br />
R Suresh Babu<br />
R T R Varma<br />
Raj Kumar<br />
Rajinder Jain<br />
Rakesh Jain<br />
Rakesh Saraf<br />
Rakesh Soni<br />
Rajesh Hemdev
Raman Jethi<br />
Ramchand Popley<br />
Ramesh Pahlajani<br />
Ratanlal C Bafna<br />
S Cardoz<br />
S Dilli<br />
S G Shah<br />
S Sanathana Pai<br />
Sangeeta Chetan<br />
Sanjay Sareen<br />
Sanjiv Verma<br />
Satish Bansal<br />
Senthil Kota<br />
Shekhar Pratap<br />
Shibankur Roychowdury<br />
Subir Kumar Sen<br />
Subodh Pethe<br />
Sucheta Khandwala<br />
Sumit Verma<br />
Suresh Dhruv<br />
Suresh Kohli<br />
Surinder Gupta<br />
Surinder Verma<br />
T P Gopalakrishnan<br />
Thomas Antony<br />
Tushar Mehta<br />
Umesh Jhatwani<br />
V Govind Raj<br />
V Jagdish<br />
ACKNOWLEDGEMENTS<br />
V S A Sury<br />
V Sreedhar<br />
Vasantraj U Birawat<br />
Vinayak Gore<br />
Vijay Soni<br />
Vinod Chopra<br />
Vinodrai B Kurani<br />
Vr Gunashekar<br />
Vummidi S Balaji<br />
W Manoj<br />
Yash Verma<br />
Other gold-related entities<br />
Anil Puri<br />
Bhargava N Vaidya<br />
Chhatrapalsinh Jadeja<br />
Derrick Machado<br />
Dr K R Kohli<br />
Fahim Kahn<br />
Group Capt Ken Tremenheere<br />
Jagruti Gandhi<br />
K L Negi<br />
Kartik Sharma<br />
Mahesh Chatuverdi<br />
Pawan Bhardwaj<br />
S P Batra<br />
Sunanda Sanganeria<br />
Suresh Shah<br />
S Santosh Kumar<br />
INDIAN CURRENCY AND NUMBERS<br />
1 <strong>Indian</strong> rupee = 100 paise<br />
1 lakh rupees = 100,000 rupees<br />
1 crore rupees = 10 million rupees<br />
Large numbers are expressed in lakhs and crores (not thousands, millions and billions).<br />
1 lakh = 100,000<br />
1 crore = 10 million (100 lakhs)<br />
In India, the number “100,000” is normally written as “1,00,000” (i.e. 1 lakh).<br />
International bullion dealers,<br />
refiners and the LBMA<br />
The following kindly provided<br />
background information on their<br />
companies, bar photographs and<br />
technical dimensions when<br />
applicable, or general information<br />
relevant to the <strong>Indian</strong> gold market.<br />
Amit Juneja<br />
Andy Smith<br />
Boris Santosi<br />
Brian Bath<br />
Chris Kenny<br />
Claudio Berger<br />
Denzil Young<br />
Jeremy Charles<br />
Johan Botha<br />
Kamal Naqvi<br />
Marwan Shakarchi<br />
Paul Streng<br />
Peter Fava<br />
Peter Ryan<br />
Philip Clewes-Garner<br />
Richard Hayes<br />
Roland Mueller<br />
Sean Russo<br />
Stewart Murray<br />
Susanne Capano<br />
AN INTRODUCTION TO THE INDIAN GOLD MARKET 13
14<br />
Background<br />
Role of <strong>Indian</strong> Government<br />
Orientation<br />
<strong>Gold</strong> bullion<br />
<strong>Gold</strong> jewellery<br />
Industrial gold usage<br />
Mumbai gold prices<br />
Pricing and profitability<br />
<strong>Gold</strong> mining and exploration<br />
<strong>Gold</strong> supply and demand<br />
1990 – 1997 (growth period)<br />
1998 – 2001 (static period)<br />
Above ground stocks of gold<br />
CHAPTER 1<br />
SUMMARY AND POSITIVE FINDINGS<br />
CONTENTS<br />
<strong>Gold</strong> jewellery demand over the next 10 years<br />
Market features<br />
Positive findings<br />
<strong>Gold</strong> coins and net bar hoarding over the next 10 years<br />
Market features<br />
Positive findings<br />
Industrial gold usage over the next 10 years<br />
Importance of the <strong>Indian</strong> gold market<br />
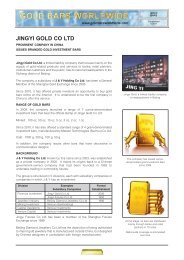
Photograph: Tribhovandas Bhimji Zaveri<br />
<strong>Gold</strong> jewellery is owned as an “adornment” for cultural, status and decorative reasons.<br />
It is also owned as an “investment” for store of value, savings and money purposes.<br />
For most consumers, the motivations are intertwined.<br />
AN INTRODUCTION TO THE INDIAN GOLD MARKET
SUMMARY AND POSITIVE FINDINGS<br />
BACKGROUND<br />
ROLE OF INDIAN GOVERNMENT<br />
The <strong>Indian</strong> Government closely monitors the import, export, distribution, fabrication, retailing and private<br />
ownership of gold – as it has done since 1947.<br />
For 27 years (1963 – 1990), <strong>Gold</strong> Control Rules and the <strong>Gold</strong> (Control) Act regulated the domestic market. Private gold<br />
ownership was restricted to jewellery (and coins already in circulation). Owning bars became illegal. Jewellery fabricators<br />
and retailers required licences to operate. Almost all bullion dealers stopped trading – at least officially. To fabricate new<br />
jewellery, the gold industry was obliged – theoretically – to rely entirely on the recycling of old gold scrap.<br />
Since the repeal of the <strong>Gold</strong> (Control) Act in 1990, the Government has adopted pragmatic policies designed to increase the<br />
share of official (as opposed to unofficial) gold imports, optimise its revenue from Customs duty, stimulate the export of gold<br />
jewellery, improve the overall quality of gold jewellery fabricated in India, and encourage the recycling of gold jewellery in<br />
private hands, notably through the <strong>Gold</strong> Deposit Scheme.<br />
Important initiatives include the introduction of official gold import schemes, notably the Non-Resident <strong>Indian</strong> (NRI) Scheme<br />
in 1992 and the authorisation of banks in 1997, the <strong>Gold</strong> Deposit Scheme in 1999, the hallmarking initiative in 2000, and<br />
on-going support for gold jewellery exporters.<br />
Customs duty on imported gold is currently Rs 250 per 10 g (US$ 16 per oz). Since 1992, it has generated approximately<br />
Rs 106 billion (US$ 2.6 billion). Official gold reserves have increased from 216 tonnes (1970) to 358 tonnes (2001).<br />
ORIENTATION<br />
India comprises 28 States, 6 Union Territories (UT’s) and Delhi as the National Capital Territory (NCT). It is<br />
bordered by 6 countries: Pakistan, Nepal, China, Bangladesh, Bhutan and Myanmar.<br />
The population has grown by 20% since 1991 to 1,012 million. The report groups the States into 4 regions. The north<br />
accounts for 30% of the population. The west, east and south each account for approximately 22 - 25%.<br />
There are more than 700 languages and dialects. 12 languages are important. Hindi is spoken as a primary and<br />
secondary language by 65%, English by 20%. The split by religion is Hindu (82%), Muslim (12%), Christian (2.3%) and<br />
others (3.7%).<br />
The rural population (742 million) accounts for 71% of the population. Urbanisation is gradual. The urban proportion grew<br />
from 26% in 1991 to 29% in 2001. There are more than 30 cities with populations exceeding 1 million.<br />
<strong>Gold</strong> demand relies heavily on the agricultural sector. Most of the 107 million farms are small. The average size is<br />
1.6 hectares. Only 1.7 million farms (1.6%) are 10 hectares or more. 60% of agricultural workers are employed fulltime or<br />
part-time as hired labourers. Their daily wages range from Rs 50 (US$ 1.00) to Rs 200 (US$ 4.00)<br />
For all States, good rainfall during the monsoon is important. Only 38% of the gross cropped agricultural land is irrigated.<br />
The South West monsoon occurs over a 3 month period (June to early October). Excess rain can cause severe flooding, and<br />
too little rain can cause droughts, in vulnerable States.<br />
GOLD BULLION<br />
Imported gold bars<br />
More than 95% of gold imported for the domestic market is in the form of small cast bars weighing 10 tolas (3.75 oz),<br />
widely known as TT bars or biscuits. Most imported TT bars are produced by 8 major gold refiners in Switzerland, South<br />
Africa, United Kingdom and Australia. In recent years, India has imported 5 - 6 million TT bars annually.<br />
Importers<br />
The official import of gold bullion for the domestic market occurs through two authorised Government schemes: Open<br />
General Licence (OGL) scheme since 1997, and the Non-Resident <strong>Indian</strong> (NRI) scheme since 1992.<br />
The OGL scheme (20 banks and 4 Public Sector Undertakings are authorised) accounted for 99% of official imports in 2001.<br />
<strong>Gold</strong> is also imported unofficially. Bullion re-export centres for the <strong>Indian</strong> market include Dubai, Singapore and Hong Kong.<br />
Since 1990, an estimated 5,246 tonnes have been imported officially and unofficially. In 2001, the OGL share of total imports<br />
was about 90%. 10 international gold dealers, members of the LBMA, supply the bulk of imported gold.<br />
Duty-free gold is also imported officially for re-export as jewellery. An additional 363 tonnes have been imported since 1990<br />
for this purpose. 54 tonnes were imported in 2001.<br />
Imported gold is distributed nationwide through secondary and lower tier bullion dealers that fall below the primary tier of<br />
bank and PSU importers. The most important dealers are located in cities where the State sales tax is low. Notably,<br />
Ahmedabad, Jaipur, Mumbai and Gurgaon, near New Delhi.<br />
AN INTRODUCTION TO THE INDIAN GOLD MARKET 15
SUMMARY AND POSITIVE FINDINGS<br />
Banks indicate that the bulk of their business is done through less than 50 secondary tier dealers around the country. They<br />
feed the distribution chain that involves thousands of tertiary and lower tier dealers nationwide.<br />
Banks<br />
The Reserve Bank of India (RBI) has authorised 20 banks to import gold bullion: 12 Public Sector Banks, 3 Private Sector<br />
Banks and 5 Foreign Banks. The report focuses on the 6 <strong>Indian</strong> and 4 foreign banks that were active importers in 2001.<br />
Banks may not export gold, or hedge its value. All rely on consignment stocks from international dealers. Banks can sell<br />
gold on an “unfixed” basis for up to 5 calendar days. The minimum quantity is normally 50 – 100 TT bars. None offer a<br />
buy-back service. There are now 111 <strong>Gold</strong> Cell branches servicing customers in 34 cities in 16 States. Branches in cities,<br />
where State sales taxes are low, tend to attract the bulk of imported gold.<br />
Public Sector Undertakings (PSU’s)<br />
Public Sector Undertakings (PSU’s) are <strong>Indian</strong> Government enterprises. 4 are authorised to import gold: MMTC, PEC, HHEC<br />
and STC.<br />
The gold-related activities of PSU’s are supervised by the Ministry of Commerce and Industry (not the RBI). Like banks, they<br />
wholesale imported bullion to secondary tier dealers. Unlike banks, they can loan imported gold to domestic fabricators and<br />
retailers. They can also sell “unfixed” gold for a longer period, normally 11 calendar days.<br />
The PSU’s operate through 38 <strong>Gold</strong> Cell branches in 18 cities in 13 States. In 2001, they imported more than 100 tonnes.<br />
Non-Resident <strong>Indian</strong> (NRI) <strong>Gold</strong> Import Scheme<br />
The NRI scheme, an initiative of the Ministry of Commerce and Industry, was launched in March 1992. It enabled large<br />
quantities of gold bullion, for the first time in decades, to be imported officially for the domestic market.<br />
Under the scheme, NRI’s are permitted to import up to 10 kg of gold bars and other approved gold items as long as they<br />
have been away for not less than 6 months. Prior to January 1997, the amount was 5 kg.<br />
Over a period of 6 years, the scheme accounted for 56% of gold bullion imported for domestic use. Its role as a major<br />
conduit for official gold imports fell away when authorised banks started importing gold bullion in November 1997. Since<br />
1992, NRI’s - on their own account or on behalf of syndicates – have imported 1,352 tonnes.<br />
Although recorded NRI imports have been nominal since 1999, less than 5 tonnes annually in recent years, the scheme<br />
remains in operation.<br />
<strong>Gold</strong> refiners<br />
The refining of old gold jewellery and other scrap relies on more than 10,000 small refiners in cities, towns and some<br />
villages. There are also 2 large refiners and 7 known organised refiners.<br />
Coin fabricators<br />
There are more than 1,000 coin fabrication units. Some fabricate more than 500 kg, most less than 5 kg, annually. Many<br />
jewellery fabricators also have a capacity to mint coins. Few standard bars (minted and cast) are fabricated. In India, the<br />
word “coin” is commonly used to describe a round medallion bought for savings or gift purposes. The category also includes<br />
crude “duplicate” sovereigns (8 g and less and known as “guineas”) and minted quasi-coins in rectangular, oval and other<br />
shapes. Most coins are retailed by jewellery retailers.<br />
<strong>Gold</strong> Deposit Scheme<br />
The scheme was launched in 1999. It is supervised by the RBI. Its declared objectives are to reduce the import of gold,<br />
bring privately-held gold into circulation, and provide the public with an opportunity to earn income on their gold holdings.<br />
The minimum deposit is normally 200 g. Deposits are lodged over 3 – 7 years. Annual interest payments are around<br />
3 – 4%. Depositors are also offered other incentives. Interest earned from the deposit is exempt from income tax. Any<br />
increase in the value of the deposit is exempt from capital gains tax. Its value is also not taken into account when<br />
calculating the annual wealth tax.<br />
The scheme is offered by 4 banks through 134 branches in 55 cities. In its first two years, around 8 tonnes of old jewellery,<br />
bars and coins were deposited. The State Bank of India accounted for 90%.<br />
GOLD JEWELLERY<br />
The gold jewellery market is different from that in Western countries.<br />
In India, gold jewellery is sold at fluctuating and low prices related to the prevailing value of its fine gold content. The<br />
declared mark-up ranges from 5 – 25%. It acts as a tradable investment in that it is easy for consumers to sell or exchange<br />
their jewellery at a reasonable price. While cultural, adornment and other factors influence the purchase of gold jewellery,<br />
its parallel role as an investment for store of value, savings and money purposes is also relevant.<br />
In Western countries, gold jewellery is sold at fixed and high prices ranging from 100% to 300% and more above the<br />
value of its fine gold content. It is bought primarily for adornment purposes. While the intrinsic value of gold jewellery is<br />
important, the investment dimension is not blatant. It is difficult for consumers to exchange or sell their jewellery. Only a<br />
fraction of the original purchase price can normally be redeemed.<br />
16<br />
AN INTRODUCTION TO THE INDIAN GOLD MARKET
SUMMARY AND POSITIVE FINDINGS<br />
To mark the difference between <strong>Indian</strong> and Western markets, the term “investment jewellery” is widely used by Western<br />
analysts to describe gold jewellery sold in India.<br />
<strong>Gold</strong> jewellery products<br />
K22 is the dominant caratage.<br />
The bangle is the most important product for most large retailers. It accounts, on average, for around 30% of their gold<br />
jewellery sales. A pair typically weighs between 12 g and 24 g.<br />
<strong>Gold</strong> jewellery is fabricated in a diverse range of regional styles. Kolkata, for example, is renowned for its intricate filigree<br />
jewellery.<br />
Jewellery fabricators<br />
Around 85% of gold jewellery is handmade or mainly handmade. Around 15% is mainly machine-made, but its proportion<br />
is increasing.<br />
There are probably about 3 million active goldsmiths and ancillary workers. Many work in units with less than 5 workers.<br />
A goldsmith typically has a capacity to fabricate 10 g of carat jewellery each day. Mumbai is now regarded by many as the<br />
largest fabrication centre due to its high output of machine-made jewellery. Other major centres include Kolkata,<br />
Ahmedabad/Rajkot, New Dehli and Coimbatore.<br />
Units are under pressure from retailers and consumers to produce innovative and higher quality jewellery.<br />
Traditional jewellery retailers<br />
There are approximately 300,000 “traditional” gold jewellery outlets. They are family-owned businesses. Less than 15,000<br />
family retailers may account for 30% or more of gold jewellery sales nationwide. Large showrooms are expected to increase<br />
their share of the jewellery market. The distribution network is expected to contract gradually. Many large retailers mount<br />
extensive advertising and promotional programmes.<br />
Branded jewellery retail chains<br />
Large national chains of branded jewellery retail outlets have emerged since the mid-1990s. The report covers 5 leading<br />
national chains: Tanishq, Gili, Carbon, Inter <strong>Gold</strong> and Oyzterbay. Combined, they retail through 188 outlets in 49 cities. All<br />
have plans to expand.<br />
The retail chains focus on selling fashionable, lighter weight, studded jewellery as a “fashion accessory” at fixed prices.<br />
Although they account for less than 1% of the jewellery market, they anticipate significant growth as the economy<br />
develops.<br />
Hallmarking<br />
The Bureau of <strong>Indian</strong> Standards (BIS), the national standards body of India, launched its long-term scheme to encourage<br />
the voluntary hallmarking of gold jewellery in April 2000.<br />
Known as the BIS Certification Scheme for Hallmarking of <strong>Gold</strong> Jewellery, the scheme is supported by the Reserve Bank of<br />
India.<br />
It has 4 declared objectives: protect the consumer against irregular gold quality; support the export of gold jewellery;<br />
develop gold-based financial products to assist in mobilising dormant gold reserves in private hands; develop India as a<br />
reliable gold market centre commensurate with its status as the world’s largest national gold market.<br />
By early 2002, 12 Assaying and Hallmarking Centres had been authorised to service 275 Certified Jewellers.<br />
<strong>Gold</strong> jewellery exports<br />
According to The Gem & Jewellery Export Promotion Council (GJEPC), around 800 enterprises fabricate plain or studded gold<br />
jewellery for export.<br />
Since 1990, the import of gold for re-export as jewellery has increased from 11 tonnes to 54 tonnes.<br />
The jewellery export industry receives much government support through the GJEPC, which falls under the administrative<br />
control of the Ministry of Commerce and Industry.<br />
INDUSTRIAL GOLD USAGE<br />
Since 1990, industrial gold usage has grown to an indicative 43 tonnes, due mainly to a surge in the use of<br />
gold for plating purposes.<br />
<strong>Gold</strong> plating (70%), Zari thread (14%) and ayurvedic medicines (12%) are the most important categories.<br />
MUMBAI GOLD PRICES<br />
<strong>Indian</strong> gold prices are normally expressed in rupees per 10 g at 995 purity, or per 10 tola at 999 purity.<br />
For decades until 1996, the rupee gold price increased each year. For 4 years (1998 – 2001), after a decline of 12% in 1997,<br />
it remained largely static.<br />
AN INTRODUCTION TO THE INDIAN GOLD MARKET 17
SUMMARY AND POSITIVE FINDINGS<br />
Over the past 10 years, the difference between the Mumbai and London gold price has steadily narrowed. In 1990, the<br />
Mumbai premium averaged 56%. In 2001, it averaged 9%.<br />
PRICING AND PROFITABILITY<br />
Bank importers normally mark-up imported TT bars by around 0.1%. Bullion dealers rely mainly on<br />
movements in the gold price for their profitability.<br />
<strong>Gold</strong> jewellery is typically retailed at a declared price ranging between 5 - 25% above the prevailing value of the gold<br />
content. Retailers that sell gold jewellery with the correct caratage tend to have a gross profit (after fabrication costs)<br />
of less than 10%. Wholesalers generate a gross profit of 2 - 3%. Most goldsmiths earn between Rs 4,000 – 15,000<br />
(US$ 80 – 300) per month.<br />
Small refiners can charge as little as Rs 10 (US$ 0.20) per 10 g to refine old gold jewellery. Coin fabricators charge<br />
between Rs 20 – 60 (US$ 0.40 – 1.20) to make a 10 g coin. Retailers usually sell a 10 g coin at a mark-up of less than<br />
Rs 50 (US$ 1.00).<br />
GOLD MINING AND EXPLORATION<br />
For 36 years (1957 - 1993), the mining of gold was nationalised under the Mines & Minerals (Regulation & Development)<br />
Act 1957. A new National Mineral Policy was announced in March 1993. Alongside 12 other minerals, the mining of gold<br />
was liberalised to include private initiatives.<br />
Although annual gold mine output is only around 2 tonnes, there are many gold exploration projects. More than 20 million<br />
tonnes of proven, probable and possible gold ore reserves have now been identified.<br />
GOLD SUPPLY AND DEMAND<br />
Movements in net supply and demand since 1990 fall into 2 broad periods.<br />
• 1990 – 1997: High growth over 8 years. From 178 tonnes to 645 tonnes<br />
• 1998 – 2001: Largely static market over 4 years. Ranging between 650 - 690 tonnes.<br />
Why was growth so rapid between 1990 and 1997?<br />
The restrictions on gold ownership during the <strong>Gold</strong> (Control) Act generated pent-up demand. Jewellery became more<br />
accessible when the number of retailers increased from 16,000 to more than 200,000. GDP grew by 37% in real terms over<br />
the period. Industrial production increased by 52%. Agricultural output was high over 1992-94 and again in 1996. Rural,<br />
and especially urban, wealth increased. <strong>Gold</strong> could be officially imported. The rupee gold price rose slowly and steadily<br />
each year (as it had done for decades) until 1996. In 1997, when the annual average price fell for the first time in decades<br />
(by 12%), gold was viewed as inexpensive in a booming economy. The population also increased by 14% over the period.<br />
Why did net demand remain static between 1998 and 2001 when there were so many positive factors?<br />
For example, there was population growth of 6%, GDP increased by 26% and gold was less expensive because the gold<br />
price, static in nominal terms, fell in real terms.<br />
Jewellery retailers attribute static demand to several inhibiting factors. For example, the static rupee gold price weakened<br />
gold’s investment dimension. Expenditure on lifestyle products increased at the expense of gold jewellery. Among large<br />
retailers in major cities, the sale of diamond jewellery increased. More old gold jewellery was recycled. The rural economy<br />
was relatively depressed.<br />
To understand movements in net demand (i.e. imports) in the <strong>Indian</strong> gold market, it is necessary to have a<br />
broad understanding of the size, nature and movement of gross supply and demand.<br />
In summary, the research findings suggest the following:<br />
• The recycling of old jewellery, coins and bars, the gross fabrication of gold jewellery, and the fabrication of coins is<br />
higher than normally reported outside India.<br />
• Net bar hoarding is less than normally reported outside India.<br />
Recycling of old jewellery, bars and coins<br />
The market is so complex and so variable by State, by rural and urban area, and by retailer, that any national estimate of<br />
recycling can only be indicative. To try to obtain a precise estimate is just not possible.<br />
Anecdotal evidence suggests that 40% or more of new jewellery sold nationally in 2001 may have been fabricated from old<br />
jewellery exchanged for new jewellery or bought back for cash, or from old coins/bars. This means that for every 1,200 kg<br />
imported, 800 kg of old gold was recycled.<br />
18<br />
AN INTRODUCTION TO THE INDIAN GOLD MARKET
SUMMARY AND POSITIVE FINDINGS<br />
The amount of recycling is sensitive to gold price movements, the economic environment and personal stocks. In 1998, it<br />
appears to have been closer to 35%. In the first 6 months of 2002, due to the rise in the gold price, recycling is reported<br />
to have been 50% and more at times.<br />
Important points: Recycling is much higher than normally reported. A small increase in recycling will impact a lot more on<br />
net demand than on gross demand.<br />
Gross fabrication of jewellery<br />
When recycling is taken into account, the gross fabrication of gold jewellery increases dramatically. In 2001, when net<br />
fabrication was 583 tonnes, an indicative (and conservative) estimate of gross fabrication is 955 tonnes.<br />
Important points: Gross fabrication is much higher than normally reported. A fall in net fabrication (excluding scrap) does<br />
not necessarily imply a fall in gross fabrication (including scrap).<br />
Coin fabrication<br />
Anecdotal evidence suggests that coin fabrication may have been as high as 35 tonnes. Some <strong>Indian</strong> analysts believe it may<br />
have been more. The amount is an unresolved issue because there is no broad consensus among analysts.<br />
Important points: Coins are widely viewed as intermediate products. More than 50% is expected to be converted into<br />
jewellery over time.<br />
Net bar hoarding<br />
Anecdotal evidence suggests that the annual increase in net bar hoarding may have been small in recent years. In 2001, it<br />
may have been as low as 20 tonnes (i.e. 3% of imports). There are several reasons. Owning TT bars is widely associated<br />
with the underground economy. Jewellery is generally viewed as the best way to own gold.<br />
There is speculative trading in TT bars, but residual net bar hoarding is regarded as low. Its extent is also reported to have<br />
fallen since 1998. Significant quantities of TT bars may be bought to “park” black money, but retailers observe that the bars<br />
would probably be held for a short period and would enter the jewellery market.<br />
Important point: The amount of net bar hoarding is an unresolved issue because there is no broad consensus among<br />
analysts.<br />
Total market<br />
The total market does not make structural sense, and trade comments also do not make sense, unless the extent of gross<br />
demand is taken into account.<br />
The indicative estimate of gross demand in 2001 is 1,053 tonnes. This is about 50% higher than normally reported.<br />
It puts the high tonnages of industrial fabrication (4%) and coin fabrication (3%), as well as net bar hoarding (2%) into<br />
perspective. Jewellery accounts for around 90% of the market.<br />
It explains why there are around 300,000 gold jewellery outlets, 3 million active goldsmiths and ancillary workers, and 10,000<br />
refiners.<br />
It explains why net demand (i.e. imports) was able to fall so much more than gross demand in the first 6 months of 2002.<br />
It also explains why so many <strong>Indian</strong> trade entities observe that the jewellery market is so much larger than normally<br />
reported in the West.<br />
Above ground stocks<br />
Stocks at the end of 2001 are recorded at approximately 12,000 tonnes. 45% of the stock (5,300 tonnes) has been acquired<br />
since 1990.<br />
The 181 million families in India hold an average of 64 grammes of fine gold (around 85 grammes of carat gold). As 26%<br />
of the population is below the poverty line, the top 50% would obviously hold substantially more than the average. At least<br />
90% is held as gold jewellery.<br />
Anecdotal evidence (at this time) suggests that around 5% may be held in the form of coins and bars. The net<br />
accumulation of coins and bars is considered low as much appears to have been converted into jewellery. In addition, it<br />
was illegal to fabricate coins or own bars during the <strong>Gold</strong> (Control) Act period.<br />
AN INTRODUCTION TO THE INDIAN GOLD MARKET 19
SUMMARY AND POSITIVE FINDINGS<br />
GOLD JEWELLERY DEMAND OVER THE NEXT 10 YEARS<br />
MARKET FEATURES<br />
Motivation<br />
<strong>Gold</strong> jewellery is owned as an “adornment” for cultural, status and decorative reasons. It is also owned as an “investment”<br />
for store of value, savings and money purposes. For most consumers, the motivations are intertwined.<br />
Many consumer markets<br />
Consumer attitudes to gold jewellery vary among the rural/urban, rich/poor and young/old, and by region and State.<br />
Although “everyone buys gold”, the market relies mainly on the top 60% (109 million households). Retailers observe that<br />
the primary target market is not the very rich or the very poor, but the emerging middle class (upper middle, middle and<br />
lower middle).<br />
Urban and rural<br />
Both categories are important. Urban consumer demand may account for as much as 40% of total demand, but the<br />
rural/urban split is not a static proportion because rural demand is more sensitive to fluctuations in the rural economy. The<br />
markets are also different. For example, in rural areas there is more recycling of jewellery as buy-backs for cash because<br />
jewellery is more widely used for savings and as “money”. In major cities, there is now more exchange of old for<br />
“fashionable” new jewellery.<br />
Marriage-related purchases<br />
As much as 50% of annual sales appears to rely on new purchases associated with around 8 million weddings each year.<br />
Most weddings are held on 40 – 60 days declared auspicious each year according to Hindu lunar and solar calendars.<br />
In total, more than 70% of all purchases is broadly regarded as marriage-related because jewellery tends to be<br />
accumulated over many years. Amounts given at the time of marriage range from less than 50 g to several kilogrammes.<br />
Gifts<br />
The jewellery market relies on gift-giving. Most jewellery is given to brides (and bridegrooms), women and young girls by<br />
their parents, husbands and relatives.<br />
The attitudes of givers and recipients are both important. The purchase of jewellery is also normally the outcome of a<br />
family decision.<br />
Fashion is stimulating a higher proportion of personal purchases in large urban showrooms. Although described as<br />
personal, many are the outcome of family decisions and would fall within the gift-giving category.<br />
Self-purchases<br />
Retailers observe that the self-purchase of jewellery for adornment purposes will be extremely important in the future, but<br />
that it is likely to take many years before this new market rivals the marriage-related market on which most retailers<br />
currently depend.<br />
“Wearable” jewellery<br />
Economic and social changes during the 1990s have encouraged many women to acquire items that are suited to a variety<br />
of social and work-related occasions. This has led to increasing purchases of lighter weight and smaller items. Most<br />
retailers view “wearable” jewellery as an important new market segment.<br />
“Fashionable” jewellery<br />
For both wedding and “wearable” jewellery, many women are now insisting on jewellery with innovative designs. Machinemade<br />
chains and other items are becoming more important. They tend to be lighter, sleek, modern, precisely made and<br />
available in many stylish designs.<br />
South region<br />
The south is the most important region, accounting for around 40% of retail sales nationwide.<br />
Major cities<br />
They are extremely important retail centres. When there is a need to purchase large quantities of jewellery, many<br />
consumers travel to cities with large showrooms. For example, Greater Mumbai (Maharashtra) may account for 35% of retail<br />
sales in the State, Chennai (Tamil Nadu) for 30%.<br />
Large showrooms<br />
They are extremely important. The finding that 15,000 retailers may account for 30% of retail sales nationwide may be<br />
conservative.<br />
20<br />
AN INTRODUCTION TO THE INDIAN GOLD MARKET
SUMMARY AND POSITIVE FINDINGS<br />
POSITIVE FINDINGS<br />
Retailers draw attention to many factors that will support demand for gold jewellery over the next decade.<br />
Population. Forecast to increase by 17%.<br />
Economy. Annual GDP growth of 3 - 5% in real terms would grow the economy by 50% or more.<br />
Underground economy. For many families, gold jewellery will continue to act as a discreet, tradable asset.<br />
Exchange control. If it continues, as expected, gold jewellery will remain an important hedge in the event of a rupee<br />
devaluation against the US dollar.<br />
Insecurity. India is not a welfare State. Most people will retain a sense of financial insecurity. <strong>Gold</strong> jewellery’s role as a<br />
tangible asset will continue to be important.<br />
Cultural tradition. All classes, although the commitment by class may vary, will continue to purchase plain (or studded)<br />
gold jewellery.<br />
Middle class. According to NCAER, the middle class is expected to increase by around 40%. Individual families may buy<br />
less, but the number of middle class families will increase.<br />
Women. For most married women, gold jewellery will remain an important personal asset.<br />
Adornment. The dimension is strengthening. Lighter weight “wearable” gold jewellery is viewed as a new market<br />
opportunity with much potential.<br />
Self-purchases and small family gifts. Both categories are expected to become more important as the economy grows.<br />
Sentimentality. The bulk of marriage-related jewellery is regarded as “sticky” and unlikely to be dishoarded. Although<br />
some is dishoarded, sometimes within months of the wedding, retailers frequently refer to “sentimentality” as a strong<br />
restraining factor.<br />
Rural. An enduring rural commitment to owning gold jewellery is expected to underpin the market. Its proportion of the<br />
population is forecast to change only from 71% to 68% by 2011.<br />
PERSPECTIVE<br />
• India is in a period of transition as it gradually emerges from its Third World status.<br />
Attitudes to owning gold jewellery for “adornment” and “investment” purposes are no longer homogeneous across the<br />
population. Among the urban/rural, rich/poor and young/old, they have started to diverge.<br />
The divergence is the outcome of varying rates of economic and social change among the different population groups.<br />
As a broad generalisation, among the urban, rich and younger populations, the motivation to purchase large quantities<br />
of gold jewellery has weakened.<br />
Among the rural, middle and lower classes and older populations, the motivation to purchase large quantities remains<br />
strong.<br />
• Although cultural and social change is regarded as irreversible, the pace of change will vary greatly among<br />
the many population groups.<br />
For most groups, it is likely to be gradual. It should not be assumed that the attitudes of the urban top end reflect those<br />
of the bulk of the population.<br />
As retailers stress, the primary market for gold jewellery is not the very rich or the very poor, but the emerging “middle<br />
class” (upper middle, middle and lower middle) not only in major cities but also (and especially) in the rural areas.<br />
AN INTRODUCTION TO THE INDIAN GOLD MARKET 21
SUMMARY AND POSITIVE FINDINGS<br />
GOLD COINS AND NET BAR HOARDING OVER THE NEXT 10 YEARS<br />
MARKET FEATURES<br />
Intermediate role<br />
The trade considers generally that most coins and most personal purchases of TT bars are intermediate products. In their<br />
view, more than 50% of coins would be converted into jewellery and most personal TT bars would enter the jewellery<br />
market over time.<br />
Coins<br />
Products: Thousands of different coins are fabricated. Most are K22. Many are crude “duplicate” sovereigns. 999 and 995<br />
purity coins are also available.<br />
Distribution: Jewellery retailers are the primary conduits. Most stock or obtain coins on request, and will exchange them<br />
for jewellery or buy them back. Banks are not active due to low profitability. An Internet company, Fabmart (Bangalore) is<br />
pioneering the sale of coins through its website.<br />
Motivation. Most coins are bought for 3 purposes: family gifts, corporate gifts or personal savings. Demand tends to be<br />
seasonal during the marriage seasons and at festivals. Most coins are accumulated for marriage-related purposes. In urban<br />
areas, such as Mumbai, retailers advise that some consumers, who would previously have hoarded jewellery for marriagerelated<br />
purposes, are now buying more coins. Corporate companies are buying large quantities as gifts and for use as prizes<br />
for competitions and lotteries.<br />
<strong>Bars</strong><br />
Products: As few standard cast and minted bars are fabricated, the TT bar (sometimes converted into a rod in some rural<br />
areas) is the primary bar investment product.<br />
Distribution: TT bars can be bought and sold through jewellery retailers and smaller bullion dealers.<br />
Motivation: Private TT bar hoarding in rural and urban areas is widely reported as low. According to the trade, TT bars are<br />
bought mainly by a relatively small number of speculators in major cities, and those who wish to “park” their funds<br />
temporarily.<br />
POSITIVE FINDINGS<br />
Overall demand<br />
Some retailers, notably in Mumbai and Ahmedabad, observe that more consumers are starting to buy coins and TT bars,<br />
rather than jewellery, for marriage-related gold accumulation and savings purposes. Demand is likely to increase in the<br />
larger cities.<br />
Many consumers, especially in rural areas, still view ownership of TT bars as illegal, or indicative of an association with the<br />
underground economy. If the trade should choose to correct the current image of TT bars, after taking other factors into<br />
account, demand could be stimulated.<br />
Legal tender <strong>Indian</strong> gold coin<br />
Reported to be under consideration.<br />
Forward Market Commission<br />
The proposal to establish a gold dealing exchange similar to the Istanbul <strong>Gold</strong> Exchange could encourage much more<br />
speculative trading.<br />
PERSPECTIVE<br />
• Demand for coins as gifts, and for coins/bars for marriage-related gold accumulation purposes is<br />
expected to grow over the decade.<br />
• The issue of a legal tender <strong>Indian</strong> gold bullion coin might be successful over time.<br />
Predicting the sales of an <strong>Indian</strong> coin, if issued, is difficult because it would face competition from the plethora of existing<br />
“coins” available. However, some banks and large jewellery retailers would feel obliged to stock them, and over the decade<br />
its sales would be likely to increase.<br />
22<br />
AN INTRODUCTION TO THE INDIAN GOLD MARKET
SUMMARY AND POSITIVE FINDINGS<br />
INDUSTRIAL GOLD USAGE OVER THE NEXT 10 YEARS<br />
Monitoring gold usage for industrial purposes in a fragmented market in a country the size of India is no easy task. The<br />
statistics in the report rely on Madhusudan Daga, whose indicative estimates are normally the basis for most Western<br />
analysts.<br />
The report does not cover the potential of industrial demand, apart from reporting that demand for plating purposes is<br />
expected to increase, and that gold use in Zari thread could decline further due to competition from artificial golden threads.<br />
IMPORTANCE OF THE INDIAN GOLD MARKET<br />
Since the repeal of the <strong>Gold</strong> (Control) Act in 1990, India has emerged as the cornerstone of the world’s<br />
physical gold market.<br />
As the purchase of gold jewellery in India is much influenced by its parallel role as an “investment” for store of value,<br />
savings and money purposes, demand tends to be sensitive to movements in the gold price.<br />
The <strong>Indian</strong> gold market is important to the gold industry worldwide not only because it is so large, but also because its<br />
sensitivity to lower gold prices leading to increased demand has often underpinned the international market when the<br />
international gold price has weakened.<br />
<strong>Gold</strong> jewellery is retailed through approximately 300,000 outlets.<br />
<strong>Gold</strong> jewellery is fabricated by approximately 3 million goldsmiths and ancillary workers.<br />
AN INTRODUCTION TO THE INDIAN GOLD MARKET 23
24<br />
Background<br />
ROLE OF INDIAN GOVERNMENT<br />
CONTENTS<br />
Government initiatives since 1990<br />
<strong>Gold</strong> import schemes for the domestic market<br />
Mobilising gold in private hands<br />
Improving the quality of gold<br />
Stimulating the export of gold jewellery<br />
Official gold reserves<br />
Government institutions<br />
Ministry of Finance<br />
Reserve Bank of India<br />
Ministry of Commerce and Industry<br />
Ministry of Consumer Affairs, Food and Distribution<br />
Ministry of Coal and Mines<br />
Government perspective<br />
CHAPTER 2<br />
Appendices<br />
Official gold reserves 1950 - 2001<br />
Customs duties, State sales and other taxes<br />
Indicative cost of gold imports 1990 - 2001<br />
Chronology of <strong>Indian</strong> Government initiatives 1947 - 1990<br />
<strong>Gold</strong> Control Rules and the <strong>Gold</strong> (Control) Act 1968<br />
The Ministry of Finance has its headquarters in North Block, New Delhi.<br />
AN INTRODUCTION TO THE INDIAN GOLD MARKET
ROLE OF INDIAN GOVERNMENT<br />
The <strong>Indian</strong> Government closely monitors the import, export, distribution, fabrication, retailing and<br />
private ownership of gold, as it has done since 1947.<br />
As described by the Deputy Governor of the Reserve Bank of India (RBI) in 1997, the evolution of the Government’s<br />
gold control policy since 1947 centred around 5 main objectives:<br />
“To wean people away from gold, to regulate supply of gold, to reduce smuggling, to reduce the demand<br />
for gold, and to reduce the domestic price for gold.”<br />
Since 1990, the Government has adopted pragmatic policies designed to increase the share of official (as opposed to<br />
unofficial) gold imports, optimise its revenue from Customs duty, stimulate the export of gold jewellery, improve the<br />
overall quality of gold jewellery fabricated in India, and encourage the recycling of gold jewellery in private hands,<br />
notably through the <strong>Gold</strong> Deposit Scheme.<br />
Important initiatives include the introduction of official import schemes, notably the Non-Resident <strong>Indian</strong> (NRI) Scheme<br />
in 1992 and the authorisation of banks in 1997, the <strong>Gold</strong> Deposit Scheme in 1999, the hallmarking initiative in 2000,<br />
and on-going support for gold jewellery exporters.<br />
In a recent speech in March 2002, the Deputy Governor of the RBI reiterated the RBI’s pragmatic policy:<br />
“A positive approach to gold appears to be demonstrably less disruptive and more consistent with socioeconomic<br />
conditions in the country than a negative approach to gold, as amply demonstrated by the<br />
ineffectiveness as well as the disruptive nature of the control framework in the past.”<br />
Since 1992, Customs duty on imported gold has generated approximately Rs 106 billion (US$ 2.6 billion).<br />
BACKGROUND<br />
The extent of government regulation of the gold industry has varied greatly, reflecting different policies adopted over 3 broad<br />
periods.<br />
1947 - 1963 (16 years)<br />
Although the import and export of gold was banned under the Foreign Exchange Regulation Act in March 1947, the private<br />
ownership of gold and the way that the domestic gold industry operated were subject to few restrictions.<br />
1963 - 1990 (27 years)<br />
In January 1963, <strong>Gold</strong> Control Rules were promulgated, the final provisions enacted under the <strong>Gold</strong> (Control) Act 1968 in<br />
September 1968. During this period of 27 years, the domestic gold market was rigorously controlled. Private gold<br />
ownership was restricted to gold jewellery, and gold coins already in circulation. Owning gold bars became illegal. <strong>Gold</strong><br />
jewellery fabricators and retailers required licences in order to operate, and were strictly regulated. The manufacture of<br />
minted bars and medallions was prohibited. The forward sale of gold was banned. Most refiners, unless authorised to refine<br />
old gold scrap, closed down. Almost all bullion dealers stopped trading - at least officially. In order to manufacture new<br />
jewellery, the gold industry was obliged - theoretically - to rely entirely on the recycling of old gold scrap.<br />
Since 1990<br />
In June 1990, the <strong>Gold</strong> (Control) Act was repealed. There were many reasons. The gold industry had gone underground.<br />
The unofficial import of gold for sale, sometimes 50% and more above the international gold price, had not been stopped.<br />
The Government accepted that the Act had, at great expense, impeded but had not controlled the gold industry. Its repeal<br />
also fell within the new national policy of economic deregulation.<br />
Accordingly, restrictions on the private ownership of gold fell away, and trade participants no longer required licences to<br />
operate domestically. However, it was not until March 1992 that it became possible for gold - for the first time in decades<br />
- to be imported officially for the domestic market, when NRI’s (Non-Resident <strong>Indian</strong>s) were allowed to import up to 5 kg<br />
every 6 months.<br />
GOVERNMENT INITIATIVES - SINCE 1990<br />
<strong>Gold</strong> import schemes for the domestic market<br />
1992 NRI (Non-Resident <strong>Indian</strong>) Scheme. From March, NRI’s were permitted to import up to 5 kg every six<br />
months. Increased to 10 kg in January 1997. Customs duty on imported gold bullion was applied at the initial<br />
level of Rs 450 per 10 g, but reduced to Rs 220 in April. The scheme was the main conduit for official gold<br />
imports until late 1997. Over this period, recorded NRI imports totalled 1,249 tonnes. Although the scheme is<br />
still in operation, its share of gold imports is now nominal, only 2 - 3 tonnes annually in recent years.<br />
1994 Special Import Licence (SIL). From April, an existing scheme, whereby authorised exporters could use part<br />
of their overseas earnings to import specified goods, was expanded to include the import of gold. The licences<br />
were tradable. They could be sold to domestic entities for their own import purposes. SIL’s were important until<br />
the introduction of the OGL scheme in November 1997. 150 tonnes of gold bars, jewellery and medallions were<br />
imported over this period. In April 2001, the scheme came to an end.<br />
AN INTRODUCTION TO THE INDIAN GOLD MARKET 25
ROLE OF INDIAN GOVERNMENT<br />
1997 Open General Licence (OGL). On 30 August, 7 banks were authorised to import gold, subsequently increased<br />
to 20. The first bank imports occurred in November 1997. 10 banks, reported as active importers, now<br />
dominate the official import of gold. 3 banks, appointed in 2002, are in the process of becoming active.<br />
Mobilising gold in private hands<br />
1993 5 year <strong>Gold</strong> Bond 1998. Issued over a 3 month period, March - June, against the supply of dishoarded gold.<br />
Redemption in 1998 was in the form of gold bars at 995 purity plus a lump sum payment of Rs 40 per gramme.<br />
41 tonnes were subscribed.<br />
1999 <strong>Gold</strong> Deposit Scheme (GDS). In October, the State Bank of India was authorised to accept gold from the<br />
public to enable depositors to earn interest on their gold holdings (3 - 4%) and the banks to use the gold, after<br />
refining, for domestic market purposes, mainly for gold loans to the jewellery fabricators. Subsequently, 5 other<br />
banks were authorised. In the first two years, approximately 8 tonnes were deposited.<br />
The GDS is the latest in several schemes designed to attract gold deposits from the public. An important feature<br />
is that the scheme is on-going, while previous <strong>Gold</strong> Bond schemes in 1962, 1965 and 1993 restricted the<br />
opportunity to deposit gold to a limited period.<br />
Improving the quality of gold jewellery<br />
2000 Certification Scheme for Hallmarking of <strong>Gold</strong> Jewellery. Initiated by the Bureau of <strong>Indian</strong> Standards<br />
(BIS), the voluntary scheme involves the authorisation of independent entities to act as Assaying and Hallmarking<br />
Centres, and Certified Jewellers to use the centres for hallmarking purposes. The first centre was authorised in<br />
April. In the first two years, 12 Hallmarking Centres, serving 275 Certified Jewellers, were established in 9 cities.<br />
Stimulating the export of gold jewellery<br />
Access to imported duty-free gold for the fabrication of jewellery for export has been available since at least 1978 when the<br />
State Bank of India was permitted to import gold for this purpose. Subsequently, Public Sector Undertakings (PSU’s) were<br />
also authorised: HHEC (1982), MMTC (1989) and STC (1997). Several duty-free import schemes are defined in<br />
the Government’s EXIM (Export/Import) Policy. To facilitate the fabrication of export products (including jewellery) for<br />
international markets, “export zones” have been established, notably in Special Economic Zones (SEZ), and Export<br />
Processing Zones (EPZ) since the late 1980s. The most important is SEEPZ (in Mumbai), converted to SEZ status in 2000,<br />
where almost 50% of the value of gold jewellery exports is fabricated.<br />
Official gold reserves<br />
Official gold reserves are 358 tonnes, having grown from 216 tonnes in 1976. The increase has been due mainly to the<br />
absorption of gold confiscated from smugglers, gold derived from nationalised gold mining companies, and adjustments to<br />
the amount of gold acquired and held by various Government departments. In 1978, 14 <strong>Gold</strong> Auctions were held, 13 tonnes<br />
sold on a tender basis to licensed dealers and certified goldsmiths.<br />
GOVERNMENT INSTITUTIONS<br />
The gold industry is subject to the regulations, notifications and public notices of many government institutions, notably the<br />
following:<br />
• Ministry of Finance<br />
• Reserve Bank of India<br />
• Ministry of Commerce and Industry<br />
• Ministry of Consumer Affairs, Food and Distribution<br />
• Ministry of Coal and Mines<br />
The Government is also associated with commercial gold-related activities through several institutions that are wholly or<br />
partly government-owned:<br />
• Public Sector Banks (PSB’s)<br />
• Public Sector Undertakings (PSU’s)<br />
• Bureau of <strong>Indian</strong> Standards (BIS)<br />
• Nationalised gold mining companies<br />
• India Government Mint, Mumbai<br />
MINISTRY OF FINANCE<br />
The Ministry of Finance is concerned with economic and financial matters affecting the country. It comprises the Department<br />
of Economic Affairs, Department of Expenditure and Department of Revenue.<br />
The Central Board of Excise and Customs (CBEC) falls under the Department of Revenue. It formulates policy relating<br />
to the levy and collection of Customs & Central Excise duties. It is the administrative authority of subordinate organisations,<br />
including Customs Houses and Central Excise Commissionerates. It monitors the import of gold and collects the Customs<br />
duties. It ensures that no gold is officially imported in contravention of the EXIM (Export/Import) Policy.<br />
26<br />
AN INTRODUCTION TO THE INDIAN GOLD MARKET
ROLE OF INDIAN GOVERNMENT<br />
The Department of Economic Affairs formulates and monitors many of the country’s economic policies and programmes<br />
at the macro level. The Banking Division, concerned with the functioning of the <strong>Indian</strong> banking system, has an interest in<br />
the gold-related activities of banks.<br />
The India Government Mint, Mumbai falls under the administrative control of the Ministry of Finance. The Mint refines<br />
gold and fabricates gold bars and medallions.<br />
RESERVE BANK OF INDIA<br />
The Reserve Bank of India (RBI), established as a private institution in 1935 under the RBI Act of 1934, was nationalised in<br />
1949 under the Banking Regulation Act 1949. It acts as India’s monetary authority, regulator and supervisor of the<br />
financial system, manager of exchange control and the issuer of currency. It has 22 regional offices, most in State capitals.<br />
Three Departments have a specific interest in gold.<br />
Department of External Investments and Operations. Monitors official gold reserves, and co-ordinates the twiceyearly<br />
meetings of the Standing Committee on <strong>Gold</strong>.<br />
Exchange Control Department. Involved in all matters relating to foreign exchange.<br />
Department of Banking Operations and Development (DBOD). Authorises and monitors those banks (Public Sector,<br />
Private Sector and Foreign Banks) that import gold bullion and participate in the <strong>Gold</strong> Deposit Scheme.<br />
Public Sector Banks - the Government has a major shareholding - that are active in gold include Allahabad Bank, Bank of<br />
India, Corporation Bank, <strong>Indian</strong> Overseas Bank, Punjab National Bank and State Bank of India.<br />
The Standing Committee on <strong>Gold</strong> and Precious Metals in the RBI advises the RBI and the Government on national<br />
gold policy. The committee, established in 1992, includes representatives of the Ministry of Finance and the Ministry of<br />
Commerce and Industry.<br />
Historically, the RBI was directly responsible for licensing and regulating all official gold imports. Since 1992, however, when<br />
the Foreign Exchange Regulation Act 1973 was amended, gold import and export policies now fall under the purview of the<br />
national EXIM (Export/Import) Policy.<br />
MINISTRY OF COMMERCE AND INDUSTRY<br />
The Ministry of Commerce and Industry comprises the Department of Commerce, Department of Supply and Department of<br />
Industrial Policy and Promotion.<br />
The Department of Commerce, which includes the Directorate General of Foreign Trade, is responsible for policy and<br />
regulations relating to the import and export of gold under the overall EXIM (Export/Import) Policy. It controls the Special<br />
Economic Zones (SEZ) and Export Processing Zones (EPZ) where much gold jewellery for export is fabricated. It also<br />
supervises the Gem & Jewellery Export Promotion Council (GJEPC).<br />
Public Sector Undertakings (PSU’s), autonomous bodies that engage in gold-related activities and fall under the<br />
administrative control of the Department of Commerce, are MMTC Limited, The State Trading Corporation of India Ltd (STC)<br />
and PEC Limited. The Handlooms and Handicrafts Exports Corporation of India Ltd (HHEC) is another PSU active in gold,<br />
but falls under the Ministry of Textiles.<br />
The Ministry’s Directorate of Commercial Intelligence and Statistics in Kolkata co-ordinates the collection of import<br />
statistics, including gold.<br />
MINISTRY OF CONSUMER AFFAIRS, FOOD AND DISTRIBUTION<br />
The Bureau of <strong>Indian</strong> Standards (BIS) falls under the administrative control of the Department of Consumer Affairs. It<br />
launched the BIS Certification Scheme for Hallmarking of <strong>Gold</strong> Jewellery in April 2000. It authorises independent<br />
entities to act as Assaying and Hallmarking Centres, and jewellers to use these centres as Certified Jewellers.<br />
MINISTRY OF COAL AND MINES<br />
The <strong>Indian</strong> Bureau of Mines (IBM) falls under the administrative control of the Department of Mines. The liberalised<br />
National Mineral Policy, initiated in 1993, encourages exploration and the mining of gold by private enterprises.<br />
AN INTRODUCTION TO THE INDIAN GOLD MARKET 27
ROLE OF INDIAN GOVERNMENT<br />
GOVERNMENT PERSPECTIVE<br />
The former Deputy Governor of the Reserve Bank of India, Dr Y.V. Reddy, delivered 3 significant speeches on India’s<br />
national gold policy at conferences in New Delhi organised by the World <strong>Gold</strong> Council. They are available on the RBI’s<br />
website (www.rbi.org.in).<br />
<strong>Gold</strong> in the Economic System. 28 November 1996. Traces the development of India’s gold policy since 1947.<br />
<strong>Gold</strong> Banking in India. 2 August 1997. Reviews India’s gold policy options.<br />
Evolving Role of <strong>Gold</strong> - Recent Trends and Future Direction. 21 March 2002.<br />
In the most recent speech, Dr Reddy identified 5 broad gold policy areas that are under review.<br />
Import of gold<br />
Further rationalisation may result in large institutions such as banks becoming the sole official importers of gold bullion. The<br />
NRI scheme that allows individuals to import gold may be withdrawn.<br />
<strong>Gold</strong> jewellery exports<br />
Some restrictions on gold jewellery export-oriented units may be removed. For example, customs bonding may no longer<br />
be necessary.<br />
Market development<br />
The establishment of a <strong>Gold</strong> Exchange in due course has merit. The feasibility of introducing Futures Trading in <strong>Gold</strong> is being<br />
examined by the Forward Markets Commission.<br />
Hallmarking<br />
The hallmarking initiative needs support. Banks, for example, should consider giving preferential treatment to Certified<br />
Jewellers by prescribing different margins for loans extended against the pledge of gold with hallmarking and that without.<br />
Research and policy studies<br />
The RBI is in favour of further studies covering 3 broad areas: “<strong>Gold</strong> reserves and their role in the forex market; the<br />
development of gold markets in conjunction with financial markets; and the macro economic implications of gold policy and<br />
gold markets, especially in the context of financial savings”.<br />
OBSERVATIONS<br />
India’s pragmatic policy since the repeal of the <strong>Gold</strong> (Control) Act in 1990 appears to have served the country well.<br />
Customs duty has generated substantial revenue.<br />
Since the NRI scheme was initiated in 1992, customs duty has generated around Rs 106 billion (US$ 2.6 billion).<br />
India is now paying a lot less for imported gold.<br />
The domestic cost of gold imported officially (excluding Customs duty) now matches the international price. This benefits<br />
all gold consumers. During the 1980s, unofficially imported gold was traded at an average premium of 47%.<br />
The quality of gold jewellery has improved significantly.<br />
Although the fabrication of undercaratage jewellery remains widespread, notably in suburban and rural areas, most urban<br />
retailers at the top end have already raised their caratages whether acting as a Certified Jeweller or not. The hallmarking<br />
scheme is likely to see most leading retailers hallmarking much of their jewellery over the next 5 - 10 years.<br />
<strong>Gold</strong> jewellery exports have surged.<br />
The value of gold jewellery exports has surged from around US$ 300 million in 1991 - 1992 to around US$ 1.1 billion in 2000<br />
- 2001. Over the same period, value addition above the cost of gold used has grown from 24% to around 60%, rising from<br />
US$ 73 million to US$ 653 million.<br />
Unofficial imports have been curbed.<br />
Unofficial imports now represent a small proportion of total gold imports. Since the introduction of the OGL scheme in 1997,<br />
unofficial imports have accounted for around 13% of total imports. Smuggling is barely profitable, and fraught with risk,<br />
when officially imported gold (after Customs duty and State sales taxes have been paid) is traded at only 7% above the<br />
international gold price.<br />
The only failure to date has been the <strong>Gold</strong> Deposit Scheme, the reasons for which are clearly understood by the RBI.<br />
Potential depositors are aware that gold jewellery is worth a lot more than the value of its gold content when melted down,<br />
that the rate of return on deposited gold is relatively low, and that there is little financial incentive for banks to promote the<br />
scheme.<br />
28<br />
AN INTRODUCTION TO THE INDIAN GOLD MARKET
ROLE OF INDIAN GOVERNMENT<br />
OFFICIAL GOLD RESERVES 1950 - 2001<br />
Year Tonnes Year Tonnes<br />
1950 219.8 1976 216.3<br />
1951 219.8 1977 228.8<br />
1952 219.8 1978 260.1<br />
1953 219.8 1979 266.2<br />
1954 219.8 1980 267.3<br />
1955 219.8 1981 267.3<br />
1956 219.8 1982 267.3<br />
1957 219.8 1983 267.3<br />
1958 219.8 1984 271.7<br />
1959 219.8 1985 292.3<br />
1960 219.8 1986 325.0<br />
1961 219.8 1987 325.0<br />
1962 219.8 1988 325.0<br />
1963 219.8 1989 325.0<br />
1964 219.8 1990 332.6<br />
1965 249.6 1991 350.6<br />
1966 216.3 1992 353.0<br />
1967 216.3 1993 356.3<br />
1968 216.3 1994 367.0<br />
1969 216.3 1995 397.5<br />
1970 216.3 1996 397.5<br />
1971 216.3 1997 397.5<br />
1972 216.3 1998 357.3<br />
1973 216.3 1999 357.7<br />
1974 216.3 2000 357.7<br />
1975 216.3 2001 357.8<br />
Sources. 1950-91: Reserve Bank of India. 1992-2001: Derived from<br />
IMF International Financial Statistics.<br />
Official gold holdings have grown from 216 tonnes (1976) to 358 tonnes (2001) - an increase of 142 tonnes<br />
over the past 25 years.<br />
1956. The RBI revalued official holdings from Rs 21.24 to Rs 62.50 per tola (Rs 58.58 per 10 g).<br />
October 1990. The RBI changed its valuation policy, revaluing official holdings each month at the prevailing international<br />
market price for gold.<br />
May 1991. The government pledged 47 tonnes of official holdings to back loans from international banks for development<br />
purposes. After a national outcry, the pledge was withdrawn.<br />
The India Government Mint, Mumbai has refined gold since 1919.<br />
AN INTRODUCTION TO THE INDIAN GOLD MARKET 29
<strong>Gold</strong> bullion and gold jewellery are subject to taxes at national, State and municipal levels.<br />
As there are 28 States and many municipalities, this section can provide only a broad overview.<br />
Customs duty is payable at the time the gold is cleared. State sales taxes are normally paid on a monthly basis, after the<br />
gold has been sold.<br />
BULLION<br />
Customs duty<br />
Since 1992, when gold bullion could be imported officially for the first time (under the NRI Scheme), the level of Customs<br />
duty per 10 g (gross weight) has changed four times.<br />
1992 March Rs 450<br />
1992 April Rs 220<br />
1998 June Rs 250<br />
1999 January Rs 400<br />
2001 March Rs 250<br />
Source: Central Board of Excise and Customs<br />
Customs duty, payable in foreign currency (normally US dollars), has generated substantial revenues. The approximate<br />
amounts below are recorded under the standard financial year (April - March).<br />
Financial Approx. * Approx.<br />
year Rupees US dollars<br />
Millions Millions<br />
1992 2,000 80<br />
1993 2,500 80<br />
1994 2,600 80<br />
1995 5,500 170<br />
1996 6,500 180<br />
1997 11,600 320<br />
1998 15,100 360<br />
1999 22,400 520<br />
2000 21,300 480<br />
2001 16,800 360<br />
Total 106,300 2,630<br />
* Official statistics are not available. Derived from monthly imports,<br />
Mumbai gold prices, exchange rates and the prevailing level of<br />
Customs duty.<br />
The Government has had difficulty raising Customs duty above Rs 250 per 10 g. During the period January 1999 - February<br />
2001, the higher level stimulated the unofficial import of gold to the detriment of official imports.<br />
Assuming an international gold price of US$ 300 and a US$/Rupee exchange rate of Rs 48, the import of Customs duty on<br />
a 10 tola bar (3.75 oz) at the Rs 250 and Rs 400 levels can be expressed as follows:<br />
30<br />
ROLE OF INDIAN GOVERNMENT<br />
CUSTOMS DUTIES, STATE SALES AND OTHER TAXES<br />
Mark-up on Customs duty<br />
10 tola bar per 10 g<br />
Rs 250 Rs 400<br />
In rupees 2,902 4,653<br />
In US $ 60.46 96.93<br />
Mark-up per oz Customs duty per oz<br />
In rupees 776 1,244<br />
In US $ 16.19 25.92<br />
% 5.4 8.6<br />
AN INTRODUCTION TO THE INDIAN GOLD MARKET
ROLE OF INDIAN GOVERNMENT<br />
In summary, when Customs duty has been around US$ 25 per oz, unofficial imports have tended to surge. At the US$ 16<br />
per oz level, the incentive to import gold unofficially has been undermined.<br />
State sales tax<br />
Most State sales taxes are now 1%. In recent years, however, some States have sometimes reduced the sales tax on gold<br />
bullion to levels below 1% in order to attract more gold imports. For this reason, Ahmedabad (Gujarat) and Jaipur<br />
(Rajasthan) have acted as important regional and national distribution centres for gold bullion. In 2002, Maharashtra<br />
(Mumbai) and Haryana (Gurgaon) have also reduced their State sales taxes on bullion to less than 1%.<br />
In Ahmedabad, the current level is 0.5%. In Jaipur, dealers authorised between 14 January and 30 September 2001, were<br />
allowed to pay a lump sum of Rs 1 crore (around US$ 200,000) and Rs 10 lakhs (around US$ 20,000) per annum in order<br />
to sell an unlimited quantity of gold without paying any additional State sales taxes. The scheme has been extended until<br />
March 2003.<br />
The Government has expressed an intention to standardise sales taxes across India through the introduction of a standard<br />
minimum Value-Added Tax (VAT). The current target date is April 2003.<br />
Municipal taxes<br />
Some cities also apply local taxes in addition to the State sales tax. For example, Mumbai currently levies on gold bullion a<br />
small octroi (entrance into the city) tax.<br />
GOLD JEWELLERY<br />
State sales taxes<br />
The State sales tax varies by State, and is subject to change. It normally ranges between 1% and 4%.<br />
Sales taxes on studded jewellery in some States can be higher.<br />
Municipal taxes<br />
As in the case of gold bullion, gold jewellery can also be subject to one or more local taxes.<br />
INDICATIVE COST OF GOLD IMPORTS 1990 - 2001<br />
Year Imports for Mumbai gold Approx. Cost in real terms at 1990 prices<br />
domestic use prices * value<br />
Tonnes Rupees Billion Rs Billion Rs % +/- Index<br />
per 10 g 1990 = 100<br />
1990 176 3,399 59.822 59.822 - 100<br />
1991 155 4,044 62.682 55.080 - 8 92<br />
1992 262 4,255 111.481 87.642 + 59 147<br />
1993 239 4,384 104.778 77.499 - 12 130<br />
1994 296 4,652 137.699 92.415 + 19 154<br />
1995 384 4,798 184.243 112.070 + 21 187<br />
1996 408 5,191 211.793 118.188 + 5 198<br />
1997 642 4,556 292.495 152.421 + 29 255<br />
1998 688 4,182 287.722 132.469 - 13 221<br />
1999 651 4,333 282.078 124.045 - 6 207<br />
2000 673 4,520 304.196 128.461 + 4 215<br />
2001 672 4,462 299.846 122.136 - 5 204<br />
Source: Imports for domestic use: see section on “<strong>Gold</strong> Supply and Demand”; includes official and unofficial imports. * Mumbai gold prices include<br />
import duty and local taxes.<br />
The cost of annual gold imports for domestic use increased in real terms by 204% between 1990 and 2001.<br />
After a decline of 13% in 1998, the cost in real terms has remained largely static.<br />
Its actual cost in 2001 (672 tonnes) was approximately Rs 299 billion (US$ 6.2 billion).<br />
In 1990 (176 tonnes), the actual cost was Rs 60 billion (US$ 3.5 billion).<br />
AN INTRODUCTION TO THE INDIAN GOLD MARKET 31
1947 March Foreign Exchange Regulation Act. Bullion imports and exports banned.<br />
1956 November Kolar <strong>Gold</strong> Mining Undertakings (Acquisition) Act. <strong>Gold</strong> mining nationalised.<br />
1958 Government decides to retain domestic gold mine output as part of unofficial reserves.<br />
1962 November 15 year 6.5% <strong>Gold</strong> Bond issued in exchange for gold bars, coins and jewellery. Redeemable in rupees<br />
at par on 5 November 1977. 16.3 tonnes subscribed.<br />
Government urges the public to refrain from buying gold, and to surrender their holdings. Advised<br />
commercial banks to consider recalling loans backed by gold. Forward trading in gold was banned.<br />
1963 January <strong>Gold</strong> Control Rules. Promulgated, imposing severe restrictions on the gold industry. Prohibited the<br />
manufacture of gold jewellery above 14 carat.<br />
1963 December <strong>Gold</strong> Control Rules. Control over the domestic trade and distribution of gold was firmly established.<br />
1965 March 15 year 7% <strong>Gold</strong> Bonds issued in exchange for gold bars, coins and jewellery. Redeemable in rupees<br />
from 2 March 1980. 6.1 tonnes subscribed.<br />
October 15 year 6.5% National Defence <strong>Gold</strong> Bonds 1980. Issued in exchange for gold bars, coins and<br />
jewellery. Interest fixed at 2% per 10 g at 995 purity. Redeemable in gold bars from 27 October<br />
1980. 13.7 tonnes subscribed.<br />
1966 November Defence of India (Fourth Amendment) Rules. Permitted fabrication of gold jewellery above<br />
K14. Banned private possession of primary gold (e.g. bars). <strong>Gold</strong> jewellery above specified limits had<br />
to be declared. Stricter control over gold refineries applied with the ultimate objective of<br />
bringing gold refining under State ownership.<br />
1966 Gem & Jewellery Export Council established.<br />
1968 September <strong>Gold</strong> (Control) Act 1968 established controls on a permanent basis, with only minor changes in<br />
subsequent years.<br />
1975 Voluntary disclosure of Income and Wealth (Amendment) Ordinance 1965. Granted<br />
immunity from prosecution for disclosures of wealth and gold within a defined period.<br />
1978 April <strong>Gold</strong> Auctions. Between April - October, the Government held 14 auctions for sale to licensed<br />
dealers and certified goldsmiths. 13 tonnes sold.<br />
1986 Review of <strong>Gold</strong> (Control) Act initiated. Government sets up “Working Group to Review <strong>Gold</strong><br />
Policy”.<br />
1988 SEEPZ. Jewellery exporters were allowed to establish fabrication units in Mumbai’s EPZ (Export<br />
Processing Zone).<br />
1990 June Repeal of <strong>Gold</strong> (Control) Act. Domestic trade deregulated. Dealers, fabricators, retailers and<br />
refiners could operate without need for licences. Restrictions on the private ownership of gold were<br />
removed. However, at this stage, there was no policy to facilitate the official import of gold.<br />
Source: Various sources, including Madhusudan Daga<br />
32<br />
ROLE OF INDIAN GOVERNMENT<br />
CHRONOLOGY OF INDIAN GOVERNMENT INITIATIVES 1947 - 1990<br />
AN INTRODUCTION TO THE INDIAN GOLD MARKET
ROLE OF INDIAN GOVERNMENT<br />
GOLD CONTROL RULES 1963 AND THE GOLD (CONTROL) ACT 1968<br />
HISTORICAL PERSPECTIVE<br />
To explain the growth in the <strong>Indian</strong> gold market since the repeal of the <strong>Gold</strong> (Control) Act in June 1990, it is<br />
important to understand how the market had been constrained over the previous 27 years.<br />
The story begins on 10 January 1963 when a comprehensive range of <strong>Gold</strong> Control Rules were promulgated as part of the<br />
Defence of India Rules 1963. The Government’s objective was to inhibit unofficial gold imports and the consumption of gold<br />
by imposing severe bureaucratic constraints not only on the trade but also on private owners. By December 1963, control<br />
over the domestic trade and distribution of gold was firmly established.<br />
In 1965, Parliament endorsed the Government’s policy underlying the <strong>Gold</strong> Control Rules through the <strong>Gold</strong> (Control) Act<br />
1965, but before the Act could be brought into force, the Government recognised the need to modify some aspects.<br />
Modifications - including the withdrawal of a 14 carat purity restriction on gold jewellery applied since 1963 - were then<br />
included in the Defence of India (Fourth Amendment) Rules 1966. Rather than amend the <strong>Gold</strong> (Control) Act 1965, a new<br />
<strong>Gold</strong> (Control) Act 1968 was enacted in September 1968.<br />
TRADE STRUCTURE<br />
The Act grouped gold market participants into 5 categories:<br />
• General public<br />
• Licensed refiners<br />
• Certified goldsmiths<br />
• Licensed dealers<br />
• Registered artisans<br />
All categories were controlled by <strong>Gold</strong> Control Officers based in 30 “Collectorates” around India.<br />
In summary, the role of each category was prescribed as follows:<br />
General public: Permitted to buy gold “ornaments” only, i.e. gold jewellery for the purpose of adornment. They were no<br />
longer allowed to own or buy gold bars or any non-jewellery articles. Individuals had to declare the extent of their gold<br />
ownership if it exceeded 2000 g, and families if it exceeded 4000 g. Any change in the amount owned over these limits had<br />
to be notified.<br />
Licensed refiners: Restricted to melting, refining, assaying and making of bars for the trade only. They could buy and sell<br />
primary gold but detailed records of all transactions had to be submitted to the authorities. They were not permitted to<br />
make, repair or polish any gold article or “ornament” (i.e. jewellery) or sell bars to the public. As a result, all major<br />
refiners closed down and the 49 licensed refiners (at 1989) were small operations mainly involved in melting and assaying.<br />
Certified goldsmiths: Only self-employed individuals were certified. They could buy gold bars from a licensed refiner or<br />
dealer, could receive gold for manufacturing purposes from a licensed dealer or the general public, but could not buy or sell<br />
any jewellery, article or primary gold. They could not engage more than one hired labourer, and the labourer was not<br />
permitted to make, repair or polish any jewellery. Officially, most goldsmiths became contract workers to dealers or<br />
merely refashioned old gold jewellery provided by the public. The constraints also ensured that almost all <strong>Indian</strong> jewellery<br />
remained handmade. At 1989, 379,883 individuals were certified.<br />
Licensed dealers: The term “dealer” covered all entities involved in buying or selling gold or gold jewellery among trade<br />
counterparties or gold jewellery with the public, although most were jewellery retailers. However, other entities were<br />
included in this category: wholesalers and manufacturers (dealing in gold in some way or employing artisans) had to be<br />
licensed as dealers. There were many constraints: they could deal only on the premises specified in the licence, they could<br />
not sell bars to the public, they could have in their possession only gold bars made by licensed refiners - the quantity<br />
restricted to a maximum of 400 g if they employed one artisan, rising to a maximum of 2000 g if more than 20 artisans were<br />
employed. All movements of gold, down to the last gramme, had to be officially recorded. Even carrying samples was<br />
extremely difficult. For all dealers, the bureaucracy and restrictions were oppressive. In 1989, there were 16,662 licensed<br />
dealers.<br />
Registered artisans: Defined as a person who was employed or used by a licensed dealer (i.e. not a certified goldsmith)<br />
in order to manufacture gold jewellery, having been supplied with the necessary gold to undertake the task. No figures on<br />
the number of registered (and unregistered) artisans are available. According to the trade, few artisans were registered.<br />
AN INTRODUCTION TO THE INDIAN GOLD MARKET 33
CONSEQUENCES OF THE GOLD (CONTROL) ACT<br />
• Instead of controlling the gold industry the Act drove the industry underground.<br />
The constraints were considered so excessive that both the trade and the public dealt only in cash, and most<br />
transactions were not officially recorded.<br />
• Growth in the number of gold jewellery retail outlets was inhibited over 27 years.<br />
Obtaining a licence to open a new retail jewellery outlet was difficult. The small number of retail outlets (around 16,000<br />
in 1989) was extremely low in the context of India’s 3,800 cities and towns.<br />
• The trade remained fragmented. No large gold-related business could emerge.<br />
As gold jewellery retailers were licensed to operate from a single location, it was not feasible to establish a chain of retail<br />
outlets, unless managed by a family member who still had to obtain a licence in his own right. Establishing a large<br />
jewellery fabrication factory or a nationwide wholesaling company was also impractical. Throughout the period, the<br />
businesses were small and family-owned.<br />
• As gold could be owned only in the form of jewellery (not bars), gold jewellery became the vehicle for<br />
investment.<br />
Apart from well-crafted jewellery, much crude jewellery (e.g. simple rings and bangles) was fabricated (for sale at a very<br />
low mark-up) so that it could be used more easily as “money”.<br />
• As the gold industry relied entirely on unofficial gold imports, the domestic gold price was highly inflated.<br />
Throughout the period, the domestic gold price was usually 50% or more above the prevailing international gold price.<br />
• The public’s passion for owning gold was reinforced.<br />
34<br />
ROLE OF INDIAN GOVERNMENT<br />
Owning gold and gold jewellery in large quantities became the aspiration of most people as the only way to protect their<br />
savings during a period of high inflation and rupee devaluation.<br />
The Reserve Bank of India has its headquarters in Mint Road, Mumbai.<br />
AN INTRODUCTION TO THE INDIAN GOLD MARKET
ROLE OF INDIAN GOVERNMENT<br />
LICENSED GOLD DEALERS AND CERTIFIED GOLDSMITHS IN 1989<br />
State/UT Collectorate Licensed Dealers Certified <strong>Gold</strong>smiths Population in 1991<br />
Number % split Number % split Millions % split<br />
NORTH<br />
Uttar Pradesh Allahabad 267 6,603<br />
Kanpur 263 9,189<br />
Meerut 260 5,870<br />
790 21,662<br />
Rajasthan Jaipur 236 20,611<br />
Chandigarh Chandigarh 956 17,002<br />
Delhi New Delhi 895 13,881<br />
Jammu & Kashmir - - -<br />
Sub-total 2,877 17 73,156 19 241 28<br />
WEST<br />
Maharastra Aurangabad 519 5,822<br />
Bombay 1,885 15,881<br />
Nagpur 320 4,535<br />
Pune 532 7,530<br />
3,256 33,768<br />
Madhya Pradesh Indore 305 10,331<br />
Gujarat Ahmedabad 562 10,225<br />
Baroda 342 5,548<br />
Rajkot 668 19,137<br />
1,572 34,910<br />
Goa Goa 163 1,650<br />
Sub-total<br />
EAST<br />
5,296 32 80,659 21 187 22<br />
Bihar Patna 343 8,597<br />
West Bengal Bolpur 317 12,960<br />
Kolkata I 722 33,370<br />
Kolkata 2 184 10,196<br />
1,223 56,526<br />
Orissa Bhubaneshwar 115 13,757<br />
Assam Shillong 44 6,793<br />
Sub-total 1,725 10 85,673 23 208 25<br />
SOUTH<br />
Andhra Pradesh Guntur 560 15,233<br />
Hyderabad 611 18,802<br />
1,171 34,035<br />
Tamil Nadu Coimbatore 744 15,357<br />
Madras 736 10,044<br />
Madurai 967 21,845<br />
Trichy 591 10,201<br />
3,038 57,447<br />
Karnataka Bangalore 436 5,799<br />
Belgaum 565 16,059<br />
1,001 21,858<br />
Kerala Cochin 1,554 27,055<br />
Sub-total 6,764 41 140,395 37 200 24<br />
TOTAL INDIA 16,662 100 379,883 100 846 100<br />
Sources: <strong>Gold</strong> Control Statements No I and II (Numbers at 31 December 1989).<br />
The last <strong>Gold</strong> Control Statements, published in 1990, record that there were only 16,622 licensed dealers<br />
(mainly jewellery retailers) and 379,883 certified goldsmiths.<br />
The south accounted for 41% of licensed dealers and 37% of certified goldsmiths.<br />
AN INTRODUCTION TO THE INDIAN GOLD MARKET 35
36<br />
Map of India<br />
Population<br />
States<br />
Urban and rural<br />
Major cities<br />
Households - split by social class<br />
CONTENTS<br />
Economic indices<br />
Agricultural and Industrial Production and GDP<br />
Exchange rates, share prices, interest rates and inflation<br />
States – indicative per capita income<br />
Agriculture<br />
Number of agricultural holdings<br />
Major crops<br />
CHAPTER 3<br />
ORIENTATION<br />
Monsoons<br />
Performance of South West monsoon<br />
Extent of irrigation<br />
India’s population of 1,012 million live in 5,100 towns and cities and 640,000 villages.<br />
AN INTRODUCTION TO THE INDIAN GOLD MARKET
MAP OF INDIA<br />
There are 28 States, 6 Union Territories (UT’s) and Delhi as the National Capital Territory (NCT).<br />
In the 1991 Census, there were 25 States. Uttaranchal (north), Jharkhand (east) and Chhattisgarh (west) were previously<br />
part of Uttar Pradesh, Bihar and Madhya Pradesh respectively.<br />
India borders 6 countries: Pakistan, Nepal, China, Bangladesh, Bhutan and Burma. The island of Sri Lanka is offshore.<br />
Languages<br />
There are more than 700 languages and dialects. There are 12 languages that are spoken by at least 1% of the<br />
population. Hindi is spoken as a primary or secondary language by 65%, English by around 20%.<br />
Religions<br />
According to the 1991 Census, the split is recorded as Hindus (82%), Muslims (12%), Christians (2.3%) and others (3.7%).<br />
This report groups <strong>Indian</strong> States into 4 regions for marketing purposes.<br />
The regional breakdown of the 1,012 million population: north (30%), east (25%), west (22%) and south (22%).<br />
AN INTRODUCTION TO THE INDIAN GOLD MARKET 37
POPULATION<br />
STATES<br />
State Millions Capital city<br />
1991 2001 2011<br />
NORTH<br />
Uttar Pradesh 139 174 217 Lucknow<br />
Uttaranchal Dehradun<br />
Rajasthan 44 55 65 Jaipur<br />
Punjab 20 24 27 Chandigarh (UT)<br />
Haryana 16 20 23 Chandigarh (UT)<br />
Jammu & Kashmir 8 10 12 Srinagar<br />
Himachal Pradesh 5 7 8 Shimla<br />
Delhi (NCT) 9 14 20 New Delhi<br />
Sub-total<br />
WEST<br />
241 304 372<br />
Maharashtra 79 92 103 Mumbai<br />
Madhya Pradesh 66 81 97 Bhopal<br />
Chhattisgarh Raipur<br />
Gujarat 41 49 56 Gandhinagar<br />
Goa 1 2 2 Panaji<br />
Sub-total<br />
EAST<br />
187 224 258<br />
Bihar 86 102 121 Patna<br />
Jharkand Ranchi<br />
West Bengal 68 80 91 Kolkata<br />
Orissa 32 36 40 Bhubaneshwar<br />
Assam 22 27 31 Dispur<br />
Arunachal Pradesh 1 1 na Itanagar<br />
Sub-total<br />
SOUTH<br />
186 246 284<br />
Andhra Pradesh 67 76 85 Hyderabad<br />
Tamil Nadu 59 62 68 Chennai<br />
Karnataka 45 53 60 Bangalore<br />
Kerala 29 33 36 Thiruvanantpuram<br />
Sub-total 200 224 249<br />
ALL INDIA * 846 1,012 1,179<br />
Source: Statistical Outline of India 1999-2000, 2001-2002, Tata Services Limited.<br />
* Includes “Other”. Comprises 6 smaller States: Manipur, Meghalaya, Mizoram, Nagaland, Sikkim, Tripura. And 6 Union<br />
Territories: Andaman & Nicobar Islands, Chandigarh, Dadra & Nagar Haveli, Daman & Diu, Lakshadweep, Pondicherry.<br />
Notes: Since 1991, Uttaranchal, Chhattisgarh and Jharkand have been established as new States. Tata tables do not always<br />
include these States as separate States. Chandigarah (UT) is the capital of both the Punjab and Haryana.<br />
The population has grown by 20% since 1991. It is expected to increase by a further 17% by 2011.<br />
38<br />
[<br />
[<br />
[<br />
AN INTRODUCTION TO THE INDIAN GOLD MARKET
POPULATION<br />
URBAN AND RURAL<br />
State Millions in 2001 % split in 2001 Major city<br />
Urban Rural Urban Rural<br />
NORTH<br />
Uttar Pradesh 35 132 23 77 Kanpur<br />
Rajasthan 13 43 25 75 Jaipur<br />
Punjab 8 16 32 68 Ludhiana<br />
Haryana 6 15 28 72 Chandigarh (UT)<br />
Jammu & Kashmir 3 8 25 75 Srinagar<br />
Himachal Pradesh 1 5 10 90 Shimla<br />
Uttaranchal 2 6 26 74 Dehradun<br />
Delhi (NCT) 13 1 93 7 New Delhi<br />
Sub-total 81 226 26 74<br />
WEST<br />
Maharashtra 41 56 43 57 Mumbai<br />
Madhya Pradesh 16 44 27 73 Bhopal<br />
Gujarat 19 32 38 62 Ahmedabad<br />
Chhattisgarh 4 17 20 80 Raipur<br />
Goa 1 1 50 50 Goa<br />
Sub-total 81 150 35 65<br />
EAST<br />
Bihar 9 74 15 85 Patna<br />
West Bengal 23 58 29 71 Kolkata<br />
Orissa 6 31 17 83 Bhubaneshwar<br />
Jharkand 6 21 22 78 Ranchi<br />
Assam 3 23 12 88 Guwahati<br />
Arunachal Pradesh 1
POPULATION<br />
MAJOR CITIES<br />
State City Population<br />
in 1991<br />
000’s<br />
NORTH<br />
Uttar Pradesh Kanpur 2,030<br />
Lucknow 1,669<br />
Varanasi 1,031<br />
Agra 948<br />
Allahabad 845<br />
Rajasthan Jaipur 1,518<br />
Punjab Ludhiana 1,043<br />
Delhi (NCT) New Delhi 8,419<br />
WEST<br />
Maharashtra Greater Mumbai 12,596<br />
Pune 2,494<br />
Nagpur 1,664<br />
Kalyan 1,015<br />
Thane 803<br />
Madhya Pradesh Bhopal 1,063<br />
Chhattisgarh Indore 1,109<br />
Gujarat Ahmedabad 3,312<br />
Surat 1,519<br />
Baroda 1,127<br />
EAST<br />
Bihar Patna 1,100<br />
West Bengal Kolkata 11,022<br />
Jamshedpur 829<br />
SOUTH<br />
Andhra Pradesh Hyderabad 4,344<br />
Vishakhapatnam 1,057<br />
Vijayawada 846<br />
Tamil Nadu Chennai 5,422<br />
Coimbatore 1,101<br />
Madurai 1,086<br />
Karnataka Bangalore 4,130<br />
Kerala Cochin 1,141<br />
Thiruvananthapuram 826<br />
TOTAL 30<br />
Source: Statistical Outline of India 2000-200, Tata Services Limited.<br />
2001 Census figures are not yet available.<br />
There are at least 30 cities whose populations now exceed 1 million. 6 now exceed 5 million.<br />
Estimates by leading retailers suggest that Greater Mumbai may account for 35% of jewellery sales in its State, Kolkata,<br />
Ahmedabad, Hyderabad and Chennai for 30% and Bangalore and Cochin for 25% in their respective States. New Delhi<br />
attracts customers from all States in the north.<br />
Although the estimates may be exaggerated, major cities are regarded as extremely important retail centres.<br />
40<br />
AN INTRODUCTION TO THE INDIAN GOLD MARKET
POPULATION<br />
HOUSEHOLDS - SPLIT BY SOCIAL CLASS<br />
Social Class Millions of households % Split of households<br />
TOTAL 1994-95 2001-02 2006-07 1994-95 2001-02 2006-07<br />
High 4.6 12.1 22.7 2.9 6.7 11.4<br />
Upper Middle 7.0 13.6 21.4 4.4 7.5 10.7<br />
Middle 18.0 23.6 36.6 11.2 13.0 18.4<br />
Sub-total 29.6 49.3 80.7 18.5 27.2 40.5<br />
Lower Middle 44.9 72.2 78.5 28.0 40.0 39.4<br />
Low 86.1 59.4 39.9 53.6 32.8 20.0<br />
Total 160.6 180.7 199.2 100.0 100.0 100.0<br />
URBAN<br />
High 2.7 7.8 15.8 6.0 14.8 26.2<br />
Upper Middle 3.9 7.7 13.7 8.7 14.6 22.7<br />
Middle 8.4 12.9 15.3 18.8 24.6 25.4<br />
Sub-total 15.0 28.4 44.8 33.5 54.0 74.3<br />
Lower Middle 14.8 17.2 13.6 33.1 32.8 22.6<br />
Low 14.9 6.7 1.7 33.3 12.7 2.8<br />
Total 44.7 52.4 60.1 100.0 100.0 100.0<br />
RURAL<br />
High 1.9 4.3 7.0 1.6 3.3 5.0<br />
Upper Middle 3.1 5.8 7.6 2.7 4.5 5.4<br />
Middle 9.6 10.6 21.3 8.2 8.2 15.3<br />
Sub-total 14.6 20.7 35.9 12.5 16.0 25.7<br />
Lower Middle 30.1 55.0 65.0 26.0 42.8 46.7<br />
Low 71.1 52.6 38.2 61.3 40.9 27.4<br />
Total 115.9 128.3 139.1 100.0 100.0 100.0<br />
Source: National Council of Applied Economic Research (NCAER), New Delhi. Social classes are expressed in terms of annual income in rupees at<br />
1994-95 prices. Low (up to 22,500), Lower Middle (22,551-45,000), Middle (45,001-70,000), Upper Middle (70,001-96,000) and High (above 96,000).<br />
Income levels and grouping are approximate and indicative only as figures do not take into account the underground economy. Large retailers<br />
generally describe the “Middle Class”, in their view, as starting at the Rs 15,000 (US$ 300) per month level.<br />
There are 181 million households in India.<br />
The household category is important as jewellery purchases are normally the outcome of a family decision.<br />
Retailers stress the importance of the emerging “middle class” to jewellery consumption.<br />
Although NCAER estimates are indicative only, urban households account for 58% of the 49 million Middle Class and above<br />
households, rural for 42%.<br />
Since 1994-95, the number of urban households in this category has grown by 90%, the number of rural households by<br />
40%.<br />
Retailers also stress that many households cannot afford to buy much gold. 26% of the population is recorded<br />
at below the poverty line.<br />
AN INTRODUCTION TO THE INDIAN GOLD MARKET 41
ECONOMIC INDICES<br />
AGRICULTURAL AND INDUSTRIAL PRODUCTION AND GDP<br />
Year Agricultural Production Industrial Production Gross Domestic Product<br />
Index % Change Index % Change Index % Change<br />
1990-91 100.0 3.8 100.0 8.2 100.0 5.6<br />
1991-92 98.0 - 2.0 100.6 0.6 101.3 1.3<br />
1992-93 102.0 4.1 102.9 2.3 106.5 5.1<br />
1993-94 105.9 3.8 109.0 6.0 112.7 5.9<br />
1994-95 111.1 4.9 119.0 9.1 121.0 7.3<br />
1995-96 108.1 - 2.7 134.5 13.0 129.8 7.3<br />
1996-97 117.9 9.1 142.7 6.1 139.9 7.8<br />
1997-98 111.6 -5.4 152.2 6.7 146.7 4.8<br />
1998-99 119.9 7.5 158.5 4.1 156.3 6.6<br />
1999-00 119.1 - 0.7 169.1 6.7 166.3 6.4<br />
2000-01 121.4 2.0 177.6 5.0 175.0 5.2<br />
2001-02 est. 126.3 4.0 182.0 2.5 184.3 5.3<br />
Source: Statistical Outline of India 2001-2002, Tata Services Limited. Indexes are derived from the percentage changes.<br />
Industrial Production has increased by 82%, Agricultural Production by 26%, since 1990.<br />
This table confirms retailer observations in many States that growth in urban demand has been more consistent than rural<br />
demand over the past 10 years.<br />
EXCHANGE RATES, SHARE PRICES, INTEREST RATES AND INFLATION<br />
Year Exchange rate Share prices Interest deposit rate Consumer prices<br />
Rs per US$ Index % +/- % Index % +/-<br />
1990 17.50 100.0 + 38.8 9-10 100.0 + 9.0<br />
1991 22.74 134.9 + 34.9 12 113.8 + 13.8<br />
1992 25.92 247.6 + 83.5 11 127.2 + 11.8<br />
1993 30.49 203.0 - 18.0 10 135.2 + 6.3<br />
1994 31.37 322.4 + 58.8 11 149.0 + 10.2<br />
1995 32.43 270.3 - 16.2 12 164.4 + 10.3<br />
1996 35.43 246.8 - 8.7 11-12 179.2 + 9.0<br />
1997 36.31 228.4 - 7.5 10.5-11 191.9 + 7.1<br />
1998 41.26 207.6 - 9.1 9-11 217.2 + 13.2<br />
1999 43.06 257.6 + 24.1 8.5-9.5 227.4 + 4.7<br />
2000 44.94 286.5 + 11.2 8.5-9 236.8 + 3.7<br />
2001 46.98 217.0 - 24.3 8-8.5 245.5 + 4.0<br />
Source: IMF International Financial Statistics. RBI Handbook on <strong>Indian</strong> Statistics (Interest deposit rate).<br />
The rupee has declined in value against the US dollar by more than 200% since 1990. The volatile share<br />
market has also not always kept pace with inflation.<br />
Jewellery retailers observe that it is now opportune to emphasise, in an appropriate way, the long-term advantages of<br />
owning gold for store of value and savings purposes.<br />
42<br />
AN INTRODUCTION TO THE INDIAN GOLD MARKET
ECONOMIC INDICES<br />
STATES – INDICATIVE PER CAPITA INCOME<br />
State Population Per capita Gross industrial output Agriculture’s share of<br />
2001 income per capita State GDP*<br />
1998-99 1998-99 1998-99<br />
Millions Rupees Rupees %<br />
NORTH<br />
Delhi (NCT) 14 29,623# n.a. 1<br />
Punjab 24 20,834 13,232 40<br />
Haryana 20 19,773 17,368 35<br />
Himachal Pradesh 7 12,692 6,568 20<br />
Rajasthan 55 11,045 4,561 35<br />
Jammu & Kashmir 10 10,272 1,480 n.a.<br />
Uttar Pradesh<br />
Uttaranchal 174 9,261 3,533 33<br />
Sub-total 304<br />
WEST<br />
Goa 2 24,309 n.a. n.a.<br />
Maharashtra 92 20,644 17,954 16<br />
Gujarat 49 18,752 23,969 19<br />
Madhya Pradesh<br />
Chhattisgarh 81 10,147 3,619 30<br />
Sub-total 224<br />
EAST<br />
West Bengal 80 12,961 4,375 26<br />
Arunachal Pradesh 1 12,929 n.a. 28<br />
Orissa 36 8,719 3,063 26<br />
Assam 27 8,700 3,172 34<br />
Bihar<br />
Jharkand 102 5,923 1,111 28<br />
Sub-total 246<br />
SOUTH<br />
Kerala 33 17,756 6,563 22<br />
Tamil Nadu 62 17,525 12,565 18<br />
Karnataka 53 15,889 9,117 26<br />
Andhra Pradesh 76 13,853 6,574 26<br />
Sub-total 224<br />
ALL INDIA ** 1,012 14,712 8,037 26##<br />
Sources: Statistical Outline of India 2001-2002, Tata Services Limited. * Agricultural Statistics at a Glance, Ministry of Agriculture. ** Includes other<br />
States and UT’s. # Relates to 1999-2000. ##Total relates to agriculture’s share of Net Domestic Product.<br />
Income per capita, and its source, varies greatly among the 28 States.<br />
In 1998-99 (the latest States-wise statistics available):<br />
• Income per capita. Ranged from Rs 5,923 (Bihar, in the east) to Rs 22,834 (Punjab, in the north).<br />
• Gross industrial output per capita. Ranged from Rs 1,111 (Bihar) to Rs 23,969 (Gujurat, in the west).<br />
• Agriculture’s share of State GDP. Ranged from 16% (Maharashtra, in the west) to 40% (Punjab).<br />
The 9 States, alongside New Delhi (NCT) and the small State of Goa, with the highest per capita income are:<br />
North Punjab, Haryana<br />
East West Bengal<br />
West Maharashtra, Gujarat<br />
South Kerala, Tamil Nadu, Karnataka, Andhra Pradesh<br />
The All India average per capita income in 1998-99 was Rs 14,712 (US$ 350).<br />
AN INTRODUCTION TO THE INDIAN GOLD MARKET 43
AGRICULTURE<br />
As the agricultural sector is so important to the <strong>Indian</strong> economy, this section includes information<br />
relevant to gold demand and the marketing of gold.<br />
The rural population of 742 million accounts for 71% of India’s population.<br />
There are about 107 million farms. Most are small. 78% are 2 hectares or less.<br />
Food grains (mainly rice and wheat) account for about 44% of the value of major agricultural crop output, fruit and<br />
vegetables for about 23%.<br />
Agricultural GDP per rural capita is generally higher in the south.<br />
Only 38% of agricultural land is irrigated. All States rely on the monsoon.<br />
FARMS<br />
The average size of the 107 million farms is 1.6 hectares.<br />
63 million farms (59%) are less than 1 hectare. 1.7 million (1.6%) are 10 hectares or more.<br />
In the 1991 Census, 60% of the agricultural population were described as cultivators, 40% as agricultural labourers. The<br />
Ministry of Agriculture observes that many family members categorised as cultivators on small farms would also work as<br />
agricultural labourers on larger farms. It estimates that around 60% of agricultural workers in total are agricultural<br />
labourers.<br />
Daily wages for agricultural labourers in different States range from around Rs 50 (US$ 1.00) to Rs 200 (US$ 4.00).<br />
MAJOR CROPS<br />
94% of the 154 million hectares under major crop cultivation are used to produce 3 crop categories: food<br />
grains (80%), oilseeds (11%) and sugarcane (3%).<br />
Food grains<br />
Includes rice, wheat and pulses. 43% is produced by Uttar Pradesh (22%) and Punjab (12%) in the north, and Madhya<br />
Pradesh (10%) in the west.<br />
Oilseeds<br />
Includes soyabean, mustard and groundnuts. 57% is produced by Madhya Pradesh (27%) and Maharashtra (13%) in the<br />
west, and Rajasthan (17%) in the north.<br />
Sugarcane<br />
69% is produced by Uttar Pradesh (39%) in the north, Maharashtra (18%) in the west, and Karnataka (12%) in the south.<br />
The important food grains of rice and wheat are harvested at different times.<br />
Rice<br />
Accounts for 43% of food grains. Typically, 86% is harvested in the Kharif (October/November) period. 14% in the Rabi<br />
(March/April) period.<br />
68% of rice is produced by 6 States: West Bengal (16%) and Bihar (9%) in the east, Uttar Pradesh (10%) and Punjab<br />
(14%) in the north, Andhra Pradesh (12%) and Tamil Nadu (8%) in the south.<br />
Wheat<br />
Accounts for 35% of food grains. The crop is harvested in the Rabi (March/April) period.<br />
79% of wheat is produced by 4 States. Uttar Pradesh (34%), Punjab (21%) and Haryana (13%) in the north and Madhya<br />
Pradesh (11%) in the west.<br />
44<br />
AN INTRODUCTION TO THE INDIAN GOLD MARKET
AGRICULTURE<br />
VALUE OF AGRICULTURAL OUTPUT<br />
The annual gross value of agricultural output is around Rs 4,000 (US$ 83) billion.<br />
The south has the highest indicative GDP from agriculture per rural capita. The east has the lowest. Indicative figures in<br />
rupees in 1999 - 2000:<br />
South 6,300<br />
West 5,600<br />
North 5,400<br />
East 3,500<br />
Outside the 4 States in the south, there are also 5 other States with high figures:<br />
Region State GDP per rural capita % GDP from Industrial input per capita*<br />
Rupees Agriculture Rupees<br />
North Punjab 13,800 40 13,232<br />
Haryana 10,000 35 17,368<br />
West Maharashtra 6,600 16 17,954<br />
Gujarat 6,100 19 23,969<br />
East West Bengal 6,200 26 4,375<br />
South Karnataka 7,100 26 9,117<br />
Kerala 6,100 22 6,563<br />
Andhra Pradesh 6,100 26 6,574<br />
Tamil Nadu 6,100 18 12,565<br />
Source: Derived from 1998-99 statistics in Agricultural Statistics at a Glance, Ministry of Agriculture. * Statistical outline of India 2001-2002, Tata<br />
Services Limited.<br />
When wholesalers are asked to list the most active gold consuming States per capita, almost invariably they refer to these<br />
States, alongside New Delhi.<br />
Rice – India’s largest crop – accounts for 43% of food grain production.<br />
AN INTRODUCTION TO THE INDIAN GOLD MARKET 45
AGRICULTURE<br />
NUMBER OF AGRICULTURAL HOLDINGS<br />
State Rural Marginal Small Semi- Medium Large Total Total<br />
population Medium (M) (L) holdings M+L<br />
Millions < 1 h 1-2 h 2-4 h 4-10 h >10 h<br />
NORTH<br />
Uttar Pradesh 137.8 14,819 3,116 1,543 548 45 20,074 593<br />
Rajasthan 43.3 1,517 1,019 1,061 1,017 493 5,107 1,510<br />
Punjab 16.0 296 204 289 261 67 1,117 328<br />
Haryana 15.0 622 304 336 222 46 1,530 268<br />
Jammu & Kashmir 7.6 902 197 98 20 1 1,217 1,218<br />
Himachal Pradesh 5.5 532 166 94 36 6 834 840<br />
Delhi (NCT) 1.0 n.a n.a. n.a. n.a. n.a. n.a. n.a.<br />
Sub-total 226.2 18,688 5,006 3,421 2,104 658 29,879 2,762<br />
WEST<br />
Maharashtra 55.7 3,275 2728 2,126 1,171 171 9,470 1,342<br />
Madhya Pradesh 60.9 3,136 1917 1,738 1,287 323 8,401 1,610<br />
Gujarat 31.7 924 915 890 669 118 3,517 787<br />
Goa 0.7 58 7 4 2 1 72 3<br />
Sub-total 149.0 7,393 5,567 4,758 3,129 613 21,460 3,742<br />
EAST<br />
Bihar 95.1 10,193 1,438 945 351 39 12,966 390<br />
West Bengal 57.7 4,639 1,107 457 79 1 6,284 80<br />
Orissa 31.2 2,118 1,035 594 186 15 3,948 201<br />
Assam 23.2 1,521 560 343 95 5 2,523 100<br />
Arunachal Pradesh 0.9 16 17 30 26 5 94 31<br />
Sub-total 208.1 18,487 4,157 2,369 737 65 25,815 802<br />
SOUTH<br />
Andhra Pradesh 55.2 5,211 1,972 1,349 644 118 9,290 762<br />
Tamil Nadu 34.9 5,848 1,275 618 228 31 7,999 259<br />
Karnataka 34.4 2,262 1,586 1,163 636 129 5,776 765<br />
Kerala 23.6 5,016 280 98 21 3 5,418 24<br />
Sub-total 148.1 18,337 5,113 3,228 1,529 281 28,483 1,810<br />
OTHER* 10.3 483 243 152 80 36 996 116<br />
GRAND TOTAL 741.7 63,389 20,092 13,923 7,580 1,654 106,637 9,234<br />
(% Split) - (59) (19) (13) (7) (2) (100) (9)<br />
Area in 000’s hectares 24,894 28,827 38,327 44,752 28,659 165,507 73,411<br />
(% Split) - (15) (17) (23) (27) (17) (100) (44)<br />
Av. size in hectares - 0.39 1.43 2.76 5.90 17.33 1.55 7.9<br />
Source: Agricultural Statistics at a Glance, Ministry of Agriculture. Figures are taken from the 1991 Census. * Small States and UT’s.<br />
83 million (78%) of the 107 million farms are 2 hectares or less.<br />
46<br />
AN INTRODUCTION TO THE INDIAN GOLD MARKET
AGRICULTURE<br />
MAJOR CROPS - NORMAL AREA, PRODUCTION AND INDICATIVE VALUE<br />
Crops Area Production Gross value* Important States<br />
Million Million Rs. crores State % share of<br />
hectares tonnes 1999-00 production in<br />
(% split) (% split) 1999-00<br />
MAJOR CROPS<br />
Food grains 124.0 201.6 179,519 Uttar Pradesh 22<br />
Punjab 12<br />
Madhya Pradesh 10<br />
(80) (44) 44<br />
Oilseeds 25.6 22.3 29,177 Madhya Pradesh 27<br />
Rajasthan 17<br />
Maharashtra 13<br />
(17) (7) 57<br />
Sugarcane 4.1 289.2 30,986 Uttar Pradesh 39<br />
Maharashtra 18<br />
Karnataka 12<br />
(3) (8) 69<br />
Sub-total 153.7 513.1 239,682 - -<br />
(100) (59)<br />
OTHER CROPS<br />
Fruits & vegetables n.a. n.a. 94,731 - -<br />
(23)<br />
Condiments & spices n.a. n.a. 15,937 - -<br />
(4)<br />
Other** n.a. n.a. 55,227 - -<br />
(14)<br />
Total - - 405,577 - -<br />
(100)<br />
Sources: Agricultural Statistics at a Glance, Ministry of Agriculture. * Statistical Outline of India 2001-2002, Tata Services Limited.<br />
** Gross value of “Other” in crore rupees includes kapas (10,510), tea (2,565), tobacco (2,170), coffee (1,773), timber (1,586) and jute (1,331).<br />
Food grains account for 44%, fruit and vegetables for 23% of the annual gross value of the production of<br />
major agricultural crops.<br />
Wheat accounts for 35% of food grain production.<br />
AN INTRODUCTION TO THE INDIAN GOLD MARKET 47
SOUTH WEST MONSOON (JUNE TO EARLY OCTOBER)<br />
The monsoon carries moisture-laden air from the <strong>Indian</strong> ocean in the south west. Heavy rainfall starts in the<br />
extreme south around 1 June and rapidly covers most of India by 30 June.<br />
It starts retreating progressively from around 1 September in the extreme north, withdrawing from most of the country by<br />
early October.<br />
NORTH EAST MONSOON (MID-OCTOBER TO END DECEMBER)<br />
When the retreating South West monsoon blows from the north east across the Bay of Bengal, it absorbs moisture that is<br />
subsequently released in States in the south west, notably Tamil Nadu. This extension of the rainy season is called the North<br />
East monsoon.<br />
MONITORING THE MONSOON<br />
As India’s economy is so dependent on good rains, everyone (including jewellery retailers) monitors the monsoon closely.<br />
Its impact on different States varies considerably.<br />
Excess rain can cause severe flooding. Too little rain, or rain that is not well distributed, can cause droughts.<br />
According to the Ministry of Agriculture, the States most vulnerable to drought, in the event of deficient rainfall during the<br />
monsoon, are normally:<br />
North Rajasthan<br />
West Maharashtra, Gujarat and Madhya Pradesh<br />
South Parts of Karnataka<br />
The States most vulnerable to flooding are normally:<br />
East Assam, Bihar, West Bengal and Orissa.<br />
MONSOONS<br />
For 14 years, between 1988 and 2001, the monsoon was generally considered “good” from a national perspective.<br />
However, the Ministry of Agriculture reports that the monsoon in 2002 is the worst since 1987. Agricultural output is<br />
expected to fall significantly.<br />
The volume and distribution of rainfall during the monsoons can affect annual demand for gold jewellery.<br />
48<br />
AN INTRODUCTION TO THE INDIAN GOLD MARKET
MONSOONS<br />
PERFORMANCE OF SOUTH WEST MONSOON<br />
(1 JUNE - 30 SEPTEMBER)<br />
Year Agricultural Percentage (%) of Districts Actual rainfall as a<br />
Production Index % of Normal<br />
% change Normal/Excess Deficient/Scanty rainfall<br />
in Financial Year rainfall rainfall<br />
1990 3.8 88 12 119<br />
1991 - 2.0 68 32 91<br />
1992 4.1 65 35 93<br />
1993 3.8 78 22 100<br />
1994 4.9 77 23 110<br />
1995 - 2.7 79 21 100<br />
1996 9.1 82 18 103<br />
1997 - 5.4 81 19 102<br />
1998 7.5 81 19 106<br />
1999 - 0.7 67 33 96<br />
2000 2.0 66 34 92<br />
2001 n.a. 68 32 93<br />
Source: Agriculture Statistics at a Glance, Ministry of Agriculture. Definitions are related to the “Long Period Average Rainfall”: Excess (+ 20% or<br />
more), Normal (between + 19% and - 19%), Deficient (between - 20% and - 59%) and Scanty (between - 60% and - 99%).<br />
The table indicates that there has not always been a correlation between national rainfall and the national<br />
Agricultural Production index over the past 10 years.<br />
However, over 1999 - 2001, deficient or scanty rainfall annually in 32 - 34% of Districts, and lower than Normal rainfall<br />
overall, alongside lower agricultural prices, depressed the agricultural economy.<br />
EXTENT OF IRRIGATION<br />
Percentage (%) coverage of irrigated area under principal crops in 1997 - 98<br />
State % State %<br />
NORTH EAST<br />
Punjab 92 Bihar 47<br />
Haryana 79 West Bengal 27<br />
Uttar Pradesh 66 Orissa 27<br />
Jammu & Kashmir 41<br />
Rajasthan 30 SOUTH<br />
Himachal Pradesh 18 Tamil Nadu 54<br />
Andhra Pradesh 43<br />
WEST Karnataka 25<br />
Gujarat 34 Kerala 14<br />
Madhya Pradesh 25<br />
Goa 21<br />
Maharashtra 15 AVERAGE 38<br />
Source: Agricultural Statistics at a Glance, Ministry of Agriculture.<br />
Around 38% of agricultural land for major crops is irrigated.<br />
The extent to which agricultural land in each State is irrigated varies considerably. It ranges from 14% in Kerala in the south<br />
to 92% in Punjab in the north.<br />
AN INTRODUCTION TO THE INDIAN GOLD MARKET 49
50<br />
Imported gold bars<br />
International bar manufacturers<br />
International gold dealers<br />
<strong>Gold</strong> weight conversion table<br />
LBMA and London <strong>Gold</strong> Fixings<br />
CONTENTS<br />
Bullion importers<br />
<strong>Gold</strong> imports for domestic consumption 1990 - 2001<br />
Banks<br />
<strong>Gold</strong> Cell services<br />
<strong>Gold</strong> Cell branches<br />
<strong>Gold</strong> Deposit Scheme<br />
Bank programmes<br />
Participating bank branches<br />
Historical Government gold bond schemes 1962 - 1993<br />
Public Sector Undertakings<br />
<strong>Gold</strong> Cell services<br />
<strong>Gold</strong> Cell branches<br />
Non-Resident <strong>Indian</strong> (NRI) <strong>Gold</strong> Import Scheme<br />
Other Sections<br />
Bullion dealers<br />
<strong>Gold</strong> refiners<br />
Coin fabricators<br />
Bar hoarding<br />
Bulk delivery of official gold imports<br />
CHAPTER 4<br />
GOLD BULLION<br />
AN INTRODUCTION TO THE INDIAN GOLD MARKET
IMPORTED GOLD BARS<br />
The 10 tola bar (3.75 oz) dominates the <strong>Indian</strong> gold bullion market.<br />
More than 95% of gold imported for the domestic market is in the form of these small cast bars, widely known as TT<br />
bars or biscuits.<br />
Most imported TT bars are produced by 8 major gold refiners in Switzerland, South Africa, Australia and the United<br />
Kingdom.<br />
In recent years, India has imported 5 – 6 million TT bars annually.<br />
10 TOLA BARS<br />
Domestic fabricators and retailers rely on TT bars.<br />
The bars enable the trade to buy and sell gold in small quantities, often on a daily basis, in a market where the gold price<br />
cannot be hedged.<br />
A TT bar has a gross weight of 10 tolas, equivalent to 3.75 oz or 116.638 g.<br />
At the standard millesimal gold purity of 999, its fine gold content is 3.746 oz.<br />
The fine gold content at other purities is defined by the London Bullion Market Association (LBMA): 3.731 oz (995) and<br />
3.750 oz (999.9).<br />
As an <strong>Indian</strong> unit of weight, the tola has been used since 1836, when England’s East India Company administered much of<br />
India. Tola is a Hindi word, derived from the Sanskrit word tula, defined as a balance, scale or weight.<br />
KILOBARS<br />
Kilobars are popular among jewellery exporters.<br />
Jewellery exporters tend to be large fabricators. They are also able to loan gold at an unfixed price from banks and other<br />
importers such as MMTC Limited. Unlike fabricators for the domestic market, their stock of gold is not exposed to<br />
movements in the gold price during the process of fabrication and sale to overseas customers.<br />
The fine gold content of a kilobar (1000 g) in troy ounces at different purities is defined by the LBMA: 31.990 oz (995),<br />
32.119 oz (999) and 32.148 oz (999.9). Most imported kilobars have a purity of 995.<br />
In recent years, India has imported around 30 – 40,000 kilobars annually.<br />
The standard millesimal purity of TT bars is 999.<br />
AN INTRODUCTION TO THE INDIAN GOLD MARKET 51
<strong>Gold</strong> refiners in Australia, South Africa, Switzerland and the UK dominate the supply of TT bar imports.<br />
Australia<br />
Australian <strong>Gold</strong> Refineries (AGR)<br />
A joint venture between Western Australian Mint (subsidiary of <strong>Gold</strong> Corporation) and Australian <strong>Gold</strong> Alliance Pty Ltd (major<br />
shareholder Newmont Australia). Located in Perth, Western Australia. TT and 1000 g bars normally feature the brand name<br />
and logo of the Perth Mint. LBMA accreditation (1928).<br />
South Africa<br />
Harmony <strong>Gold</strong> Mining Company Ltd<br />
A leading South African gold mining company. The refinery, established in 1997, is located in Virginia, 300 km south of<br />
Johannesburg.<br />
Rand Refinery Limited<br />
Owned by leading South African gold mining companies. Located in Germiston, near Johannesburg. LBMA accreditation<br />
(1921). The refinery also produces 5 tola cast bars.<br />
Switzerland<br />
Argor-Heraeus SA<br />
Commerzbank International SA (Luxembourg) and Heraeus GmbH (Germany) are major shareholders. <strong>Bars</strong> feature the<br />
brand name and logo of Commerzbank or Argor-Heraeus. Located in Mendrisio, near Chiasso. LBMA accreditation (1961).<br />
Metalor Technologies International SA<br />
Subsidiary of UBS Warburg. <strong>Bars</strong> normally feature the brand name and logo of UBS. Located in Neuchatel. LBMA<br />
accreditation (before 1934).<br />
Pamp SA<br />
Associated with MKS Finance SA. Located in San Pietro, near Chiasso. LBMA accreditation (1987).<br />
Valcambi SA<br />
A subsidiary of Credit Suisse First Boston (CSFB). <strong>Bars</strong> normally feature the brand name of Credit Suisse. Located in Balerna,<br />
near Chiasso. LBMA accreditation (1968).<br />
United Kingdom<br />
Johnson Matthey Plc<br />
Public listed company. TT bars are made not only at its refinery in Royston (UK), but also in Melbourne (Australia). LBMA<br />
accreditation (1919).<br />
Other<br />
Banks and bullion dealers report that brands from other countries are also in circulation, normally in small quantities: Hong<br />
Kong (Lee Cheong and RNA) and United Arab Emirates (ARY Traders and Emirates <strong>Gold</strong>).<br />
Country Refinery company Brand name Approximate dimensions in mm<br />
Length x width x depth<br />
10 tola bar Kilobar<br />
Australia AGR Perth Mint 45 x 24 x 6 110 x 48 x 10<br />
South Africa Harmony Harmony 45 x 28 x 5.5 117 x 53 x 9<br />
South Africa Rand Refinery Rand Refinery 45 x 27 x 7 117 x 52 x 7<br />
Switzerland Argor-Heraeus Commerzbank<br />
Argor-Heraeus 45.6 x 26.8 x 6 116.8 x 51.2 x 8.3<br />
Switzerland Metalor UBS 45 x 27 x 6 117 x 52 x 9<br />
Switzerland Pamp Pamp 47 x 27 x 5.01 116 x 51 x 8.67<br />
Switzerland Valcambi Credit Suisse 45 x 28 x 5.5 116 x 52 x 9<br />
UK Johnson Matthey Johnson Matthey 44 x 27 x 5 118.5 x 53 x 8<br />
Source: <strong>Gold</strong> refiners or their agents.<br />
52<br />
IMPORTED GOLD BARS<br />
INTERNATIONAL BAR MANUFACTURERS<br />
TECHNICAL DIMENSIONS<br />
AN INTRODUCTION TO THE INDIAN GOLD MARKET
IMPORTED GOLD BARS<br />
10 TOLA BARS<br />
AGR Harmony Rand Refinery<br />
Australia South Africa South Africa<br />
Argor-Heraeus Metalor Pamp<br />
Switzerland Switzerland Switzerland<br />
Valcambi Johnson Matthey<br />
Switzerland United Kingdom<br />
The 10 tola bar (3.75 oz) is the world’s most important small cast bar.<br />
AN INTRODUCTION TO THE INDIAN GOLD MARKET 53
Important bullion suppliers to India<br />
Company Major location* Other locations<br />
HSBC London New York, Hong Kong<br />
Mitsui & Co London Tokyo, London, Sydney<br />
N M Rothschild & Sons London Singapore, Sydney<br />
Standard Bank London London New York, Hong Kong, Dubai, Singapore<br />
The Bank of Nova Scotia<br />
- ScotiaMocatta London Toronto, New York, Hong Kong, Sydney<br />
Credit Suisse First Boston Zurich Singapore<br />
UBS Warburg Zurich Singapore, Zurich/Geneva/Lugano, London, Stamford (USA)<br />
MKS Finance Geneva Sydney<br />
Commerzbank International Singapore Luxembourg, New York<br />
Societe Generale Paris New York, Sydney<br />
* Major location for ordering TT bars.<br />
IMPORTED GOLD BARS<br />
INTERNATIONAL GOLD DEALERS<br />
While HSBC and ScotiaMocatta have branches that are authorised importers, two other international dealers have active<br />
liaison offices in Mumbai.<br />
Mitsui & Co<br />
The liaison office of Mitsui & Co (Japan), an international trading house. Member of the LBMA.<br />
Societe Generale<br />
Foreign bank. A licensed bank in India since 1985. 4 branches: Mumbai, New Delhi, Pune and Bangalore. Member of the<br />
LBMA.<br />
54<br />
Imported TT bars are normally packed in cardboard or polystyrene boxes containing 100 or 200 bars.<br />
AN INTRODUCTION TO THE INDIAN GOLD MARKET
IMPORTED GOLD BARS<br />
GOLD WEIGHT CONVERSION TABLE<br />
The London Bullion Market Association (LBMA) defines the fine gold content of specified bar weights in troy<br />
ounces - at 3 levels of millesimal purity - as follows:<br />
Gross weight Fine gold content in TROY OUNCES<br />
995.0 999.0 999.9<br />
10 tola 3.731 3.746 3.750<br />
1 Kilo 31.990 32.119 32.148<br />
1/2 Kilo 15.995 16.059 16.074<br />
1/4 Kilo 7.998 8.030 8.037<br />
200 g 6.398 6.424 6.430<br />
100 g 3.199 3.212 3.215<br />
50 g 1.600 1.607 1.608<br />
20 g 0.640 0.643 0.643<br />
10 g 0.321 0.322 0.322<br />
5 g 0.161 0.161 0.161<br />
100 oz 99.500 99.900 99.990<br />
50 oz 49.750 49.950 49.995<br />
25 oz 24.875 24.975 24.998<br />
10 oz 9.950 9.990 9.999<br />
5 oz 4.975 4.995 5.000<br />
1 oz 0.995 0.999 1.000<br />
5 taels 5.987 6.011 6.017<br />
Source: A Guide to the London <strong>Gold</strong> Market, LBMA, 2001. LBMA copyright. Reprinted with LBMA permission.<br />
At a gold price of US$ 300 per oz, an exchange rate of US$ 1.00 = Rs 48, and Customs duty of<br />
Rs 250 per 10 g, the cost of an imported TT bar would be approximately Rs 57,700 (US$ 1,200).<br />
AN INTRODUCTION TO THE INDIAN GOLD MARKET 55
IMPORTED GOLD BARS<br />
LONDON BULLION MARKET ASSOCIATION<br />
Most international gold dealers that supply India with TT bars are members of the London Bullion Market<br />
Association (LBMA).<br />
The LBMA, incorporated in 1987, brought together two former bodies: the London Silver Market (which dates its origins to<br />
1897 when the first Silver Fixing meeting was held) and the London <strong>Gold</strong> Market. The functions of both bodies were<br />
absorbed with the exception of the Fixing meetings, which are held and controlled independently by two groups of Market<br />
Maker members within the LBMA.<br />
The LBMA has 3 categories of membership. There are 10 Market Maker Members that quote prices for buying and<br />
selling gold throughout each working day; 44 Members that are actively engaged in trading, refining, melting, assaying,<br />
transporting or storing gold in the United Kingdom; and 31 Associate Members.<br />
The Bank of England has formal responsibility for the supervision of the wholesale bullion market following the Financial<br />
Services Act 1986.<br />
Acceptable refiners<br />
The LBMA currently lists 59 “Acceptable Refiners” in 28 countries, whose “400 oz” (“12.5 kg”) cast gold bars are accepted<br />
as good delivery for the settlement of physical gold transactions on the London bullion market.<br />
LONDON GOLD FIXINGS<br />
The first <strong>Gold</strong> Fixing meeting was held on 12 September 1919 at the offices of N M Rothschild & Sons Limited at New Court,<br />
St Swithin’s Lane, London EC4.<br />
At the <strong>Gold</strong> Fixing meetings, which are still held at New Court, gold is traded internationally through the 5 member firms<br />
listed below in order to balance prevailing supply with demand at a single price at the same time.<br />
• Deutsche Bank AG<br />
• HSBC Bank USA London Branch<br />
• N M Rothschild & Sons Limited<br />
• Societe Generale<br />
• The Bank of Nova Scotia – ScotiaMocatta<br />
The <strong>Gold</strong> Fixing price is expressed in US dollars per troy ounce, and derived twice daily at meetings starting at 10.30 a.m.<br />
and 3.00 p.m.<br />
56<br />
The London <strong>Gold</strong> Fixing meetings are held twice daily in the offices of N M Rothschild & Sons Limited.<br />
AN INTRODUCTION TO THE INDIAN GOLD MARKET
The fine gold content of a London Good Delivery bar must fall within a range of 350 oz and 430 oz.<br />
<strong>Bars</strong> are weighed in multiples of 0.025 oz rounded down to the nearest multiple.<br />
Bar purity must not be less than 995 parts gold in 1,000 parts.<br />
The dimensions of Rand Refinery’s London Good Delivery bar, in millimetres (mm), have been the same since first cast in<br />
1921.<br />
Top 260 x 80 mm<br />
Base 240 x 60 mm<br />
Depth 40 mm<br />
IMPORTED GOLD BARS<br />
LONDON GOOD DELIVERY GOLD BAR<br />
The weight of a London Good Delivery bar is not recorded on the bar because its weight would change in the event of assay<br />
samples being taken.<br />
Photograph: Bank of England<br />
London Good Delivery bars in the vaults of the Bank of England.<br />
AN INTRODUCTION TO THE INDIAN GOLD MARKET 57
BULLION IMPORTERS<br />
The official import of gold bullion for the domestic market occurs through two authorised Government<br />
schemes:<br />
• Open General Licence (OGL) scheme – imports from November 1997.<br />
• Non-Resident <strong>Indian</strong> (NRI) scheme – imports from March 1992.<br />
Since 1990, an estimated 5,246 tonnes have been imported officially and unofficially.<br />
OGL 2,274 tonnes<br />
NRI 1,352 tonnes<br />
SIL 157 tonnes (no longer in operation)<br />
Unofficial 1,463 tonnes<br />
The OGL scheme accounted for 99% of official imports in 2001. Its share of total imports was about 90%.<br />
OPEN GENERAL LICENCE (OGL)<br />
Since 30 August 1997, 24 banks and public sector undertakings have been authorised to import gold.<br />
Although commonly referred to as the “Open General Licence” scheme, it is restricted to authorised entities only.<br />
There are 4 categories of authorised importers.<br />
Category Number Active in 2001<br />
Public Sector Banks 12 6<br />
Public Sector Undertakings 4 4<br />
Private Sector Banks 3 -<br />
Foreign Banks 5 4<br />
Total 24 14<br />
The number of banks recorded above includes 3 banks authorised by the Reserve Bank in 2002: Union Bank of India (Public<br />
Sector Bank), and ICICI Bank Ltd and The HDFC Bank Ltd (Private Sector Banks). They are not covered in this report as<br />
they are in the process of becoming active.<br />
NON-RESIDENT INDIAN (NRI) SCHEME<br />
In March 1992, NRI’s were allowed to import up to 5 kg of gold bullion every 6 months. The amount was increased to<br />
10 kg in January 1997.<br />
The NRI scheme accounted for 1,249 tonnes, 85% of official imports and 61% of total imports, between 1992 and 1997.<br />
NRI imports are now reported as negligible, due to the dominance of bank importers.<br />
SPECIAL IMPORT LICENCE (SIL)<br />
Between April 1994 and March 2001, authorised exporters could use part of their foreign earnings to import gold. The<br />
licences were tradable.<br />
Over the period of 7 years, the SIL scheme accounted for 4% (157 tonnes) of total imports.<br />
IMPORT SCHEMES FOR JEWELLERY EXPORTERS<br />
Jewellery exporters have been able to import or obtain imported bars for re-export as jewellery since the late 1970s.<br />
The main schemes are recorded in the chapter on “<strong>Gold</strong> Jewellery”.<br />
58<br />
AN INTRODUCTION TO THE INDIAN GOLD MARKET
BULLION IMPORTERS<br />
UNOFFICIAL IMPORTS<br />
Government gold import schemes have dramatically reduced the proportion of unofficial imports.<br />
Its share in 2001 was 10%. However, when import duty was temporarily increased from Rs 250 to Rs 400 per 10 g between<br />
January 1999 and February 2001, its share increased to 21% in 2000.<br />
The main bullion re-export centres for India include Dubai, Singapore and Hong Kong.<br />
Unofficial imports can arrive directly from these centres, and via other countries that border India: Pakistan, Nepal,<br />
Bangladesh and Myanmar, and the nearby island of Sri Lanka.<br />
GOLD IMPORTS FOR DOMESTIC CONSUMPTION 1990 – 2001<br />
Year Official Unofficial Grand %<br />
NRI SIL OGL Total Total * Total Official<br />
1990 - - - - 176 176 -<br />
1991 - - - - 155 155 -<br />
1992 93 - - 93 169 262 35<br />
1993 116 - - 116 123 239 49<br />
1994 158 19 - 177 119 296 60<br />
1995 228 21 - 249 135 384 65<br />
1996 256 42 - 298 110 408 73<br />
1997 398 68 62 528 114 642 82<br />
1998 93 2 533 628 60 688 91<br />
1999 4 2 554 560 91 651 86<br />
2000 4 2 526 532 141 673 79<br />
2001 2 1 599 602 70 672 90<br />
Total 1,352 157 2,274 3,783 1,463 5,246 72<br />
Source: Madhusudan Daga and other sources. * Includes Customs seizures.<br />
Over the past 5 years, total imports for domestic consumption have ranged between 640 and 690 tonnes.<br />
Imports surged in 1997 when the annual rupee gold price fell for the first time in decades.<br />
The price averaged 12% less than in 1996.<br />
In January 1997, the NRI import limit was also raised from 5 kg to 10 kg.<br />
AN INTRODUCTION TO THE INDIAN GOLD MARKET 59
BANKS<br />
The Reserve Bank of India (RBI) - on 30 August 1997 - authorised the first banks to import gold bullion<br />
for the domestic market. The first imports occurred in November.<br />
Although the RBI has authorised 20 banks, this section focuses on the 6 <strong>Indian</strong> and 4 foreign banks that were active<br />
importers in 2001.<br />
Banks may not export gold, or hedge its value. All rely on consignment stocks from international dealers. They sell the<br />
bulk of imported bars to less than 50 large secondary tier bullion dealers.<br />
Banks can sell gold on an “unfixed” basis for up to 5 calendar days. The minimum quantity is normally 50 – 100 TT’s.<br />
None offers a buy-back service. There are now 111 <strong>Gold</strong> Cell branches servicing customers in 34 cities in 16 States.<br />
Branches in cities, when State sales taxes are low, tend to attract the bulk of imported gold.<br />
AUTHORISED BANKS<br />
The Reserve Bank of India (RBI) has authorised 20 banks in 3 bank categories to import gold under the OGL<br />
scheme: 12 Public Sector Banks, 3 Private Sector Banks and 5 Foreign Banks.<br />
Public Sector Banks Authorisation date Date of first import<br />
Allahabad Bank * 1997 August 1998 January<br />
Bank of India * 1997 August 1997 November<br />
Canara Bank 1997 August n.a.<br />
<strong>Indian</strong> Overseas Bank * 1997 August 1997 November<br />
State Bank of India * 1997 November 1997 November<br />
Corporation Bank * 1997 November 1998 January<br />
Oriental Bank of Commerce 1998 March n.a.<br />
Bank of Baroda 1998 April n.a.<br />
Syndicate Bank 1998 December n.a.<br />
Dena Bank 1999 January n.a<br />
Punjab National Bank * 2000 January 2000 September<br />
Union Bank of India 2002 May (approx) n.a.<br />
Private Sector Banks Authorisation date Date of first import<br />
Global Trust Bank 2001 January n.a.<br />
ICICI Bank 2002 May (approx) n.a.<br />
HDFC Bank 2002 May (approx) n.a.<br />
Foreign Banks Authorisation date Date of first import<br />
ABN-AMRO Bank * 1997 August 1997 November<br />
Bank of Nova Scotia * 1997 August 1997 December<br />
Standard Chartered Bank * 1997 August<br />
2000 January (reissued) 1997 December<br />
2000 June<br />
Commerzbank 2000 January n.a.<br />
HSBC * 2000 July 2000 October<br />
Sources: Reserve Bank of India and banks. * These banks were reported as active importers in 2001.<br />
The <strong>Indian</strong> Government has a shareholding in 11 of the 12 Public Sector Banks. The RBI is a major shareholder of the State<br />
Bank of India.<br />
The RBI authorised 3 of the listed banks around May 2002: Union Bank of India, ICICI Bank Ltd and The HDFC Bank Ltd.<br />
This section does not cover them as they are in the process of becoming active.<br />
ELIGIBILITY<br />
The RBI authorises only scheduled commercial banks.<br />
The bank should have a minimum capital base of Rs 300 crore (US$ 650 million) for its business in India. The ratio of total<br />
capital to risk-weighted assets should be 9% or more. It should have an advanced risk management system in place, as<br />
well as an excellent business reputation and history. In the absence of previous gold-related business experience, it should<br />
provide evidence of its ability and intention to forge links with international banks to develop in-house gold market<br />
capabilities.<br />
60<br />
AN INTRODUCTION TO THE INDIAN GOLD MARKET
BANKS<br />
IMPORTED BULLION PRODUCTS<br />
Banks are permitted to import gold bullion cast or minted bars and medallions with a millesimal purity of not<br />
less than 995.<br />
The import of legal tender gold coins is prohibited. Almost all imports for the domestic market are in the form of 10 tola<br />
(TT) bars. Kilobars are also imported, mainly for export jewellery fabricators.<br />
Most imported gold bars are produced by 8 refining companies located in Australia, South Africa, Switzerland and the United<br />
Kingdom.<br />
INTERNATIONAL SUPPLIERS<br />
Banks rely generally on 10 international gold dealers – members of the LBMA – as their suppliers of gold<br />
bullion.<br />
2 of the international dealers supply their bank branches in India directly, notably Bank of Nova Scotia and HSBC. 2 other<br />
suppliers have active liaison offices in India, Mitsui & Co and Societe Generale.<br />
4 of them own, part-own or are directly associated with refiners that manufacture large quantities of TT bars, notably<br />
Commerzbank, Credit Suisse First Boston, MKS Finance and UBS Warburg.<br />
Most banks are obliged to deal with several international dealers due to credit risk constraints. Some are also obliged to<br />
import only TT bars whose refineries are accredited to the LBMA. A minimum order is usually 1,000 – 2,000 TT bars.<br />
DEALING CONSTRAINTS<br />
Due to exchange control regulations, banks are not able to export gold bullion, apart from some leeway<br />
afforded to gold accumulated under the <strong>Gold</strong> Deposit Scheme.<br />
Nor are they able to hedge their bullion imports.<br />
As no bank is prepared to assume the risk of a fluctuating gold price in the absence of a hedging facility, all banks rely on<br />
consignment stocks provided by international dealers. For the same reason, no bank is prepared to buy back bullion from<br />
its customers.<br />
In some States (e.g. Rajasthan), banks without a branch that is registered to receive and pay State sales taxes may not be<br />
permitted to operate in that State.<br />
CONSIGNMENT STOCKS<br />
Most banks rely on consignment stocks located in cities around India.<br />
Some banks will stock 5,000 – 10,000 TT bars or more in different locations. In major import centres, they will often have<br />
consignment stocks from several dealers. As consignment stocks normally incur insurance costs and interest charges if not<br />
sold within 14 days, and the replenishment of stocks can be done within 3 – 5 days, banks monitor their stocks closely.<br />
Consignment stocks, held by the banks combined, can exceed 10 tonnes when high demand is anticipated.<br />
10 banks were active importers in 2001.<br />
AN INTRODUCTION TO THE INDIAN GOLD MARKET 61
IMPORT CENTRES<br />
Bullion imports can be cleared through 8 international airports.<br />
North New Delhi<br />
West Mumbai, Ahmedabad, Goa<br />
East Kolkata<br />
South Chennai, Bangalore, Hyderabad<br />
They can also be cleared at 6 domestic airports having been trans-shipped directly from the international airports.<br />
Customs duty is paid at the time the bank clears the imported bars at an international airport.<br />
While Customs duty applies nationally, some States and cities have sometimes levied lower rates of Sales and other taxes<br />
than others. When this has occurred, notably in Ahmedabad, and Jaipur, and recently (in 2002) in Mumbai and Gurgaon, a<br />
disproportionate level of bullion imports can gravitate to these cities – for distribution regionally, and sometimes nationally.<br />
BANK BRANCHES<br />
The 10 active banks have <strong>Gold</strong> Cells in 34 cities in 16 States and UT’s.<br />
The distribution network of bank <strong>Gold</strong> Cell branches has increased progressively from 7 in 1997 to 111 in early 2002.<br />
Region No of cities Total <strong>Gold</strong><br />
covered Cell branches<br />
South 13 39<br />
North 9 30<br />
West 9 31<br />
East 3 11<br />
Total 34 111<br />
While the number of active branches does not necessarily equate to the quantity of bullion imported, the number of cities<br />
served by each bank is as follows:<br />
62<br />
BANKS<br />
Public Sector Banks No of <strong>Gold</strong> Cell branches<br />
State Bank of India 31<br />
Corporation Bank 17<br />
Punjab National Bank 13<br />
<strong>Indian</strong> Overseas Bank 8<br />
Allahabad Bank 7<br />
Bank of India 6<br />
Total 82<br />
Foreign Banks<br />
Standard Chartered Bank 9<br />
ABN-AMRO Bank 8<br />
Bank of Nova Scotia 6<br />
HSBC 6<br />
Total 29<br />
AN INTRODUCTION TO THE INDIAN GOLD MARKET
WHOLESALING TO DOMESTIC BULLION DEALERS<br />
Although the banks (combined) wholesale bullion to more than 200 secondary tier dealers around India, the<br />
bulk of their business is transacted through less than 50 major customers.<br />
Large orders can exceed 1000 TT’s. The minimum order quantity ranges between 50 - 100 TT’s.<br />
All banks require cleared payment in full prior to delivery. While Public Sector Banks will normally accept cash in very large<br />
quantities, Foreign Banks generally insist on cheques. Typically, bank customers retain or lodge funds in their bank account<br />
prior to placing an order.<br />
Bank prices are normally based on the prevailing US dollar gold price (converted by the bank to rupees) quoted by the<br />
international dealer that has provided the consignment stock used to supply the customer.<br />
Timing as regards fixing the price can vary.<br />
BANKS<br />
Some banks will sell small quantities at a price fixed each morning by the <strong>Gold</strong> Cell HQ and communicated to its <strong>Gold</strong> Cell<br />
branches. In a volatile market, however, the price would be changed during the day.<br />
For larger quantities, all banks fix the price immediately in consultation with the international supplier of the relevant<br />
consignment stock, provided that the customer has sufficient funds in a bank account to act as a deposit, and full payment<br />
is received within 2 days.<br />
Alternatively, the bank agrees to allow the price on an order to remain “unfixed” for up to 5 calendar days. The customer<br />
pays a deposit of 105 - 110 %. Within 5 days, the customer can then fix the price at the prevailing gold price.<br />
In some cases, for very large quantities, the bank will also act as a “postman” on behalf of a major customer. The customer<br />
deals directly with the international dealer, the bank acting as the conduit through which the order is placed, delivery<br />
arranged, and payment made.<br />
JEWELLERY FABRICATORS<br />
Although banks do sell bullion to major domestic fabricators, they focus on export fabricators - whose gold<br />
usage has grown to around 50 tonnes annually.<br />
Kilobars are popular among export fabricators, as their fabrication units are large relative to those servicing the domestic<br />
market, and they are able to loan these larger bars at “unfixed” prices during the period of jewellery fabrication.<br />
4 banks offer a gold loan service to export fabricators (with 3 more planning to do so), while 4 banks provide a small<br />
service for domestic fabricators. The minimum loan quantity is generally 1 kg. The current maximum loan period can be<br />
360 days (180 days plus another 180 days after export), while the minimum can be as low as 15 days.<br />
RETAILING TO THE PUBLIC<br />
Only 2 banks retail TT’s to the public, and then through only a few of their <strong>Gold</strong> Cell branches.<br />
Corporation Bank. TT’s only. Limited to 4 branches in South India: Cochin and Kozhikode (Kerala), Mangalore and Udipi<br />
(Karnataka).<br />
State Bank of India. Apart from TT’s, it is the only bank to retail small minted bars: 5 g, 10 g and 20 g. Retailing is<br />
limited to a small number of branches.<br />
The activity of banks is inhibited by the time and paperwork required to complete a retail transaction, and the legal<br />
requirement that - for transactions above Rs 50,000 - the customer is required to provide personal identity documents and/or<br />
make payment through a bank account.<br />
GOLD DEPOSIT SCHEME<br />
The Reserve Bank of India has authorised 6 banks to accept gold deposits from the public. 4 were active in<br />
2001.<br />
This scheme is covered in a separate section. In summary, the minimum deposit is typically 200 g. Deposits are lodged<br />
over 3 - 7 years. Annual interest payments are around 3 - 4 %. Although the service is available through 134 bank branches<br />
in 55 cities, few branches have received significant deposits.<br />
FORWARDS MARKET COMMISSION<br />
In May 2002, the Forwards Market Commission (FMC) announced that it would be recommending the removal of gold from<br />
the list of commodities banned under the Forward Contracts Regulation Act, 1952.<br />
AN INTRODUCTION TO THE INDIAN GOLD MARKET 63
BANKS<br />
SUMMARY OF GOLD CELL SERVICES<br />
7 of the 10 active banks have their <strong>Gold</strong> Cell headquarters in Mumbai.<br />
Bank <strong>Gold</strong> Cell <strong>Gold</strong> Cell Wholesaling <strong>Gold</strong> loans to fabricators <strong>Gold</strong><br />
HQ branches Minimum TT Deposit<br />
order Domestic Exporters Scheme<br />
Public Sector Banks<br />
State Bank of India Mumbai 31 50 1 kg plus 1 kg plus Yes<br />
Allahabad Bank Kolkata 7 100 1 kg plus In planning Yes<br />
Bank of India Mumbai 6 50 - 1 kg plus -<br />
Corporation Bank Mumbai 17 50 1 kg plus - Yes<br />
<strong>Indian</strong> Overseas Bank Chennai 7 100 1 kg plus 1 kg plus Yes<br />
Punjab National Bank New Delhi 12 100 - - -<br />
Foreign Banks<br />
ABN-AMRO Mumbai 8 100 - - -<br />
Bank of Nova Scotia Mumbai 5 100 - 3 kg plus Yes<br />
Standard Chartered Mumbai 9 100 - In planning -<br />
HSBC Mumbai 8 50 - In planning -<br />
64<br />
A secondary tier bullion dealer.<br />
Banks normally require a minimum order of 100 TT bars.<br />
AN INTRODUCTION TO THE INDIAN GOLD MARKET
BANKS<br />
BACKGROUND INFORMATION ON BANKS<br />
PUBLIC SECTOR BANKS<br />
State Bank of India (SBI)<br />
The SBI traces its origins to the Bank of Calcutta, founded in 1806. In 1955, when the Reserve Bank of India acquired a<br />
major shareholding of the Imperial Bank of India, the State Bank of India was created by an Act of Parliament. The State<br />
Bank Group comprises the SBI, 7 associated banks, and other subsidiaries. Branches: 9,000. Employees: 220,000.<br />
Allahabad Bank<br />
Allahabad Bank, established in Allahabad (Uttar Pradesh) in 1865, relocated its headquarters to Kolkata in 1923. It was<br />
nationalised in 1969. Branches: 1,900. Employees: 21,000.<br />
Bank of India<br />
The Bank of India was established in Mumbai in 1906. It was nationalised in 1969. Branches: 2,500. Employees: 52,000.<br />
Corporation Bank<br />
Corporation Bank, established in Udipi in 1906, has its headquarters in Mangalore (Karnataka). It was nationalised in 1980.<br />
Branches: 650. Employees: 10,800.<br />
<strong>Indian</strong> Overseas Bank (IOB)<br />
The IOB was established in Chennai in 1937. It was nationalised in 1969. Branches: 1,800. Employees: 23,000.<br />
Punjab National Bank<br />
The Punjab National Bank, the first bank to be owned and managed by <strong>Indian</strong>s, was established in Lahore in 1895.<br />
It relocated its headquarters to New Delhi in 1947. It was nationalised in 1969. Branches: 4,200. Employees: 58,000.<br />
FOREIGN BANKS<br />
All have their headquarters in Mumbai.<br />
ABN-AMRO Bank<br />
Established in the Netherlands in 1824, the bank opened its first branch in Kolkata in 1920. Branches in India: 8.<br />
Employees: 850.<br />
The Bank of Nova Scotia (ScotiaMocatta)<br />
ScotiaMocatta, part of The Bank of Nova Scotia, has been active in India under this name since December 1998. It is an<br />
international bullion dealer with gold dealing offices in Toronto, London, New York, Hong Kong and Sydney. It is a Market<br />
Maker member of the LBMA, and member of the daily London gold fixing meetings. The company traces its gold dealing<br />
operations to the establishment of Mocatta (London) in 1674. Bank of Nova Scotia branches in India: 5. Employees: 300.<br />
Standard Chartered Bank (SCB)<br />
SCB, known by this name since a merger between Standard Bank and Chartered Bank in London in 1969, has operated in<br />
India since 1854. In December 1998, the bank sold Mocatta Metals Corporation (its bullion dealing division) to the Bank of<br />
Nova Scotia. This meant that the bank had to re-establish a bullion division and apply for a new licence to import gold,<br />
granted by the Reserve Bank of India in January 2000. Branches in India: 57. Employees: 2,600.<br />
The Hongkong and Shanghai Banking Corporation Limited (HSBC)<br />
HSBC, a subsidiary of HSBC (Hong Kong), has operated in India since 1853. It is an international bullion dealer with offices<br />
in New York, London and Hong Kong. It is a Market Maker member of the LBMA and member of the daily London gold<br />
fixing meetings. Branches in India: 26. Employees: 3,000.<br />
NEWLY-AUTHORISED BANKS *<br />
All have their headquarters in Mumbai.<br />
Union Bank of India. Established in 1919 as a public sector bank. Nationalised in 1969. Branches: 2,100.<br />
Employees: 30,000.<br />
ICICI Bank Ltd. Known by this name in 1999. Established in 1994 as a private sector bank. Branches: 81.<br />
Employees: 2,000.<br />
The HDFC Bank Ltd. Established in 1994 as a private sector bank. Branches: 111.<br />
Employees: 2,000.<br />
* Source of information: <strong>Indian</strong> Banking Year <strong>Book</strong> 2000. Performance Highlights of Banks 1999-2000.<br />
AN INTRODUCTION TO THE INDIAN GOLD MARKET 65
Region/State City SBI Allahabad BOI Corporation IOB<br />
NORTH<br />
Uttar Pradesh Agra 2000 - - 2002 1998<br />
Kanpur 1999 - - - -<br />
Lucknow 1999 - - - -<br />
Rajasthan Jaipur 1998 1998 - 1999 -<br />
Punjab Amritsar 1998 - - - -<br />
Jalandhar 1998 - - - -<br />
Ludhiana 1999 - - - -<br />
Haryana * - - - - - -<br />
Jammu & Kashmir Jammu 1999 - - - -<br />
Himachal Pradesh - - - - - -<br />
Uttaranchal - - - - - -<br />
Delhi (NCT) New Delhi 1998 1998 1999 1998 -<br />
Chandigarh (UT) Chandigarh 1998 - - - -<br />
WEST<br />
Maharashtra Mumbai 1998 (3) 1998 1997(4) 1998 -<br />
Pune - - - - -<br />
Madhya Pradesh Bhopal 1999 - - - -<br />
Gwalior 1998 - - - -<br />
Indore 1999 - - - -<br />
Gujarat Ahmedabad 1998 (2) 1998 - 1998 1997<br />
Baroda - - - - -<br />
Rajkot 1998 - - 1999 -<br />
Surat 1999 - - 2001 -<br />
Chhattisgarh - - - - - -<br />
Goa - - - - - -<br />
EAST<br />
Bihar Patna 1999 - - - -<br />
West Bengal Kolkata 1999 1998 - 1998 1998<br />
Orissa Bhubaneshwar 1999 - - - -<br />
Jharkand - - - - - -<br />
Assam - - - - - -<br />
Arunachal Pradesh - - - - - -<br />
SOUTH -<br />
Andhra Pradesh Hyderabad 1998 - - 1998 1998<br />
Visakhapatnam 1998 - - - -<br />
Tamil Nadu Chennai 1999 1998 - 1999 1997<br />
Coimbatore 1999 - - 1999 1998<br />
Vellore - - - 2001 -<br />
Tiruchirapalli 1999 - - - 1999<br />
Salem - - - - -<br />
Karnataka Bangalore 1998 1998 - 1998 -<br />
Mangalore - - - 1998 -<br />
Udipi - - - 1998 -<br />
Kerala Cochin 1998 - - 1998 -<br />
Kozhikode - - - 1999 -<br />
Pondicherry (UT) Pondicherry 1998 - - - 1998<br />
GRAND TOTAL 31 7 6 17 8<br />
Note: Year dates refer to the year the branch offered <strong>Gold</strong> Cell services.<br />
BANKS<br />
GOLD CELL BRANCHES<br />
The number of branches has grown progressively from 10 (1997) to 50 (1998), 72 (1999), 88 (2000) and 111<br />
(early 2002).<br />
66<br />
AN INTRODUCTION TO THE INDIAN GOLD MARKET
BANKS<br />
GOLD CELL BRANCHES<br />
Region/State City Punjab ABN/AMRO Scotia SCB HSBC<br />
NORTH<br />
Uttar Pradesh Agra 2001 - - - -<br />
Kanpur 2001 - - 2002 -<br />
Lucknow 2001 - - - -<br />
Rajasthan Jaipur 2000 - - - -<br />
Punjab Amritsar 2000 - - - -<br />
Jalandhar - - - - -<br />
Ludhiana 2000 - - - -<br />
Haryana * - - - - - -<br />
Jammu & Kashmir Jammu - - - - -<br />
Himachal Pradesh - - - - - -<br />
Uttaranchal - - - - - -<br />
Delhi (NCT) New Delhi 2000 (2) 2001 1998 1997 2000<br />
Chandigarh (UT) Chandigarh - - - - -<br />
WEST<br />
Maharashtra Mumbai 2000 1997 1997 2000 -<br />
Pune - 2001 - - -<br />
Madhya Pradesh Bhopal - - - - -<br />
Gwalior - - - - -<br />
Indore - - - - -<br />
Gujarat Ahmedabad 2000 - DC 2001 2000 2001<br />
Baroda - 2001 - - -<br />
Rajkot - - - - -<br />
Surat - - - - -<br />
Chhattisgarh - - - - - -<br />
Goa Goa - - - - -<br />
EAST<br />
Bihar Patna - - - - -<br />
West Bengal Kolkata 2001 2001 DC 2000 2000 2001<br />
Orissa Bhubaneshwar - - - - -<br />
Jharkand - - - - - -<br />
Assam - - - - - -<br />
Arunachal Pradesh - - - - - -<br />
SOUTH<br />
Andhra Pradesh Hyderabad - 2001 2001 - 2001<br />
Visakhapatnam - - DC 2001 - -<br />
Tamil Nadu Chennai 2000 2001 1999 2000 2001<br />
Coimbatore 2001 - 1999 2000 DC<br />
Vellore - - - - -<br />
Tiruchinapalli - - - - -<br />
Salem - - DC 1999 - DC<br />
Karnataka Bangalore - 2001 1998 2002 2000<br />
Mangalore - - - - -<br />
Udipi - - - - -<br />
Kerala Cochin - - - 2002 -<br />
Kozhikode - - - -<br />
Pondicherry (UT) Pondicherry - - - -<br />
GRAND TOTAL 13 8 6 9 6<br />
* Branches established in Haryana in 2002 are not included. DC = Delivery Centre.<br />
The list of <strong>Gold</strong> Cell branches, recorded in early 2002, is indicative only.<br />
Banks tend to open new Cells and mothball others according to the extent of local demand and the level of State sales taxes.<br />
AN INTRODUCTION TO THE INDIAN GOLD MARKET 67
GOLD DEPOSIT SCHEME<br />
The <strong>Gold</strong> Deposit Scheme was launched in 1999. It is supervised by the Reserve Bank of India (RBI).<br />
The scheme’s declared objectives are to reduce the import of gold, bring privately-held gold into circulation, and<br />
provide the public with an opportunity to earn income on their gold holdings.<br />
The scheme is available to Resident <strong>Indian</strong>s: individuals, Hindu Undivided Families (HUF), trusts and companies.<br />
The minimum deposit is normally 200 g. Deposits are lodged over 3 - 7 years. Annual interest payments are around<br />
3 - 4%.<br />
Apart from earning interest on deposited gold, depositors are offered other incentives. Interest earned from the deposit<br />
is exempt from income tax. Any increase in the value of the deposit is exempt from capital gains tax. Its value is also<br />
not taken into account when calculating the annual wealth tax.<br />
The scheme is offered by 4 banks through 134 branches in 55 cities. In its first two years, around 8 tonnes of old<br />
jewellery, bars and coins were deposited. The State Bank of India accounted for 90%.<br />
BANK PROGRAMMES<br />
The RBI has authorised 6 scheduled commercial banks to offer the scheme. The 4 marked with an asterisk<br />
were active in 2001.<br />
Bank Authorisation date<br />
State Bank of India * 1999 August<br />
<strong>Indian</strong> Overseas Bank * 1999 November<br />
Corporation Bank * 1999 December<br />
Allahabad Bank * 2000 January<br />
Canara Bank 2000 March<br />
Bank of Nova Scotia 2000 August<br />
Source: Reserve Bank of India<br />
Although authorised banks are responsible for their own individual programmes, RBI guidelines have established common<br />
features.<br />
The term of a deposit ranges between 3 - 7 years, although a premature withdrawal after the lock-in period is permitted.<br />
<strong>Bars</strong>, coins and jewellery are accepted as scrap for assaying and refining. After the preliminary assay, but before the final<br />
assay, the depositor has a right to withdraw.<br />
Within 90 days of the receipt of the deposit, the bank is obliged to issue a passbook or certificate/bond that records the<br />
name of the depositor, the amount of gold deposited in grammes, the date of deposit, the date of maturity, and the<br />
interest payable.<br />
Interest on the value of the deposited gold can be paid at fixed intervals or at maturity. At redemption, payment can be<br />
made in gold bars (995 purity) or in rupees.<br />
4 banks have launched their programmes, with The Bank of Nova Scotia planning to do so.<br />
Annual interest payments are dependent on the term of the deposit. For example, one bank offers progressively higher<br />
rates, from 3% (3 years) up to 4% (7 years).<br />
To cover costs and fund the interest payment, banks loan the deposited gold (after refining) to jewellery fabricators. They<br />
are also permitted to enter into forward contracts with overseas exchanges and international bullion dealers, but limited to<br />
the amount of gold received under the scheme. They are also allowed to sell the deposited gold domestically, as well as<br />
give rupee loans against the deposited gold as collateral.<br />
68<br />
AN INTRODUCTION TO THE INDIAN GOLD MARKET
GOLD DEPOSIT SCHEME<br />
DISTRIBUTION<br />
The public are able to participate in the scheme through 134 bank branches in 55 cities, split regionally as follows: south<br />
(20), north (14), west (13) and east (8).<br />
The State Bank of India (50 branches accept deposits) has the widest reach and the largest number of depositors, followed<br />
by <strong>Indian</strong> Overseas Bank (37), Allahabad Bank (26) and Corporation Bank (21).<br />
OBSERVATIONS<br />
Only a small proportion of the 134 branches have taken significant deposits. The State Bank of India is the most active,<br />
having announced that it accounts for more than 90% of all gold deposited.<br />
Temples<br />
Participating banks observe that temples are important customers. Several have deposited large amounts of old jewellery<br />
received as donations.<br />
General public<br />
The public are reported as loath to deposit their K22 jewellery when, after the preliminary assay, it is often recorded as<br />
having a lower than expected caratage. Their jewellery has a higher value when sold back or exchanged at the retailer from<br />
which they bought it. In addition, the preliminary assay often damages their jewellery.<br />
In the previous <strong>Gold</strong> Bond Scheme, available over a short period in 1993, there was an amnesty whereby depositors were<br />
not liable for having to explain the original source of funds to purchase the gold being deposited. An amnesty does not<br />
apply to the current scheme.<br />
HISTORICAL GOVERNMENT GOLD BOND SCHEMES 1962 - 1993<br />
The <strong>Gold</strong> Deposit Scheme should be viewed in the context of 4 previous gold bond schemes, issued in 1962, 1965 (2) and<br />
1993.<br />
15 year 6.5% <strong>Gold</strong> Bonds 1977. Issued 12 November 1962. Redeemable at par in rupees on 12 November 1977.<br />
Annual interest increased to 7.5% on 1 April 1965. 16.3 tonnes subscribed.<br />
15 year 7% <strong>Gold</strong> Bonds 1980. Issued 2 March - 31 May 1965. Value of gold calculated at Rs 53.58 per 10 g at 995<br />
purity. Redeemable at par in rupees from 2 March 1980. 6.1 tonnes subscribed.<br />
National Defence <strong>Gold</strong> Bonds 1980. Issued 27 October 1965 - 31 January 1966. Interest fixed at Rs 2.00 per annum<br />
per 10 g at 995 purity. Redeemable in gold bars at 995 purity from 27 October 1980. 13.7 tonnes subscribed.<br />
5 year <strong>Gold</strong> Bond 1998. Issued 15 March - 14 June 1993. Payment in gold bars at 995 purity plus a lump sum interest<br />
payment of Rs 40 per gramme at 995 purity. 41 tonnes subscribed.<br />
Photograph: Allahabad Bank<br />
A minimum deposit is normally 200 g of old gold jewellery, coins or bars.<br />
AN INTRODUCTION TO THE INDIAN GOLD MARKET 69
Region/State City SBI Allahabad Corporation IOB<br />
NORTH<br />
Uttar Pradesh Agra 1999 - -<br />
Kanpur 1999 - -<br />
Lucknow 1999 2000 - 2000<br />
Meerut 1999 2000 - -<br />
Ramanreti - 2000 - -<br />
Varanasi 1999 2000 - -<br />
Rajasthan Jaipur 1999 2000 2000 -<br />
Punjab Amritsar 1999 2000 - -<br />
Jalandhar 1999 - - -<br />
Ludhiana 1999 2000 2000 -<br />
Haryana - - - - -<br />
Jammu & Kashmir Jammu 1999 - - -<br />
Himachal Pradesh - - - - -<br />
Uttaranchal Haridwar - 2000 - -<br />
Delhi (UT) New Delhi 1999 (2) 2000 (2) 2000 2000 (5)<br />
Chandigarh (UT) Chandigarh 1999 - - -<br />
WEST<br />
Maharashtra Mumbai 1999 (2) 2000 (2) 2000 (3) 2000 (4)<br />
Nagpur 1999 - - -<br />
Pune 1999 - 2000 -<br />
Madhya Pradesh Bhopal 1999 2000 - -<br />
Gwalior 1999 - - -<br />
Indore 1999 2000 - -<br />
Gujarat Ahmedabad 1999 2000 2000 2000 (2)<br />
Baroda 1999 - - 2000<br />
Jamnagar - - 2001 -<br />
Rajkot 1999 - 2000 -<br />
Surat 1999 - - -<br />
Chhattisgarh - - - - -<br />
Goa Goa - - 2000 -<br />
Punaji 1999 - - -<br />
EAST<br />
Bihar Patna 1999 2000 - -<br />
Ranchi 1999 - - -<br />
West Bengal Kolkata 1999 2000 2000 2000 (3)<br />
Burdwan 1999 - - -<br />
Howrah 1999 - - -<br />
Orissa Bhubaneshwar 1999 2000 - -<br />
Cuttack 1999 - - -<br />
Jharkand - - - - -<br />
Assam Guwahati 1999 2000 - -<br />
Arunachal Pradesh - - - - -<br />
SOUTH<br />
Andhra Pradesh Hyderabad 1999 - 2000 2000 (2)<br />
Guntur - - - 2000<br />
Secundarabad 1999 2000 - -<br />
Tirupati 1999 - 2000 2000<br />
Vijayawada 1999 2000 - -<br />
Visakhapatnam 1999 - - -<br />
Tamil Nadu Chennai 1999 2000 2000 2000 (7)<br />
Coimbatore 1999 - 2000 2000 (2)<br />
Madurai 1999 2000 2000 2000<br />
Mayiladuthurai - - - 2000<br />
Tiruchirapalli - - - 2000<br />
Karnataka Bangalore 1999 2000 2000 2000 (2)<br />
Belgaum 1999 - - -<br />
Mangalore 1999 - 2001 (2) -<br />
Kerala Cochin - 2000 - -<br />
Ernakulam 1999 - 2000<br />
Calicut 1999 - - -<br />
Trichur 1999 - - -<br />
Trivandrum 1999 2000 - 2000<br />
Pondicherry (UT) Pondicherry - - - 2000<br />
GRAND TOTAL 50 26 21 37<br />
Note: Year date refers to the year the branch first offered the scheme.<br />
GOLD DEPOSIT SCHEME<br />
PARTICIPATING BANK BRANCHES<br />
The number of branches offering the scheme increased from 50 (1999) to 134 (2001).<br />
70<br />
AN INTRODUCTION TO THE INDIAN GOLD MARKET
GOLD DEPOSIT SCHEME<br />
The State Bank of India has received around 90% of deposits nationwide.<br />
AN INTRODUCTION TO THE INDIAN GOLD MARKET 71
72<br />
PUBLIC SECTOR UNDERTAKINGS<br />
Public Sector Undertakings (PSU’s) are <strong>Indian</strong> Government enterprises. 4 are authorised to import gold<br />
bullion.<br />
• MMTC Limited<br />
• PEC Ltd<br />
• The HHEC of India Ltd<br />
• The State Trading Corporation of India Limited (STC)<br />
The gold-related activities of PSU’s are supervised by the Ministry of Commerce and Industry (not the Reserve Bank of<br />
India). Like banks, they import and wholesale bullion to large domestic dealers. Unlike banks, they can loan imported<br />
gold to domestic fabricators and retailers. They can also sell “unfixed” gold for a longer period, normally 11 calendar<br />
days.<br />
The PSU’s operate through 38 <strong>Gold</strong> Cell branches in 18 cities in 13 States. In 2001, they imported more than 100<br />
tonnes.<br />
BACKGROUND<br />
Prior to the introduction of the OGL scheme in August 1997, nominated PSU’s had been allowed to import<br />
gold for specified purposes.<br />
HHEC has imported gold since 1982, MMTC (1989), STC (1997) and PEC (1998).<br />
Initially, HHEC and MMTC (alongside the State Bank of India) were permitted to import gold bars, but only for re-export as<br />
jewellery.<br />
In 1994, however, the role of MMTC was expanded. In April, when the Special Import Licence (SIL) scheme enabled<br />
authorised exporters to import part of their earnings in gold, MMTC was allowed to trade SIL’s and import bars to meet<br />
requirements. In November, when an amendment to the NRI scheme allowed NRI’s to purchase up to 5 kg of gold<br />
(subsequently raised to 10 kg in January 1997) within 15 days of their return to India, MMTC (and the State Bank of India)<br />
established bonded warehouses in Mumbai and New Delhi to service requirements. The warehouses were subsequently<br />
closed down in 1998 when NRI imports declined.<br />
In 1997, when authorised banks were allowed to import gold for sale in the domestic market, PSU’s were also permitted to<br />
do so.<br />
ADVANTAGES OF PSU’S<br />
As PSU’s are supervised by the Ministry of Commerce and Industry, they are able to offer gold-related<br />
services that banks do not.<br />
These services enable them to compete with banks that have the advantage of in-house access to favourable exchange rates,<br />
interest rates and bank charges.<br />
Notable PSU services include the following:<br />
Imported gold can be loaned in the domestic market.<br />
For the domestic market, banks can only loan gold accumulated through the <strong>Gold</strong> Deposit Scheme. PSU’s, however, have<br />
been able to use imported gold for this purpose since 1998. For example, MMTC loans substantial quantities, mainly to<br />
dealers for short periods (typically 30 days), against a bank guarantee of 110% of the value of gold loan. Annualised<br />
interest is around 6%. Currently, the annual cumulative total of loans exceeds 70 tonnes.<br />
<strong>Gold</strong> can be sold to domestic dealers on an “unfixed” price basis for a longer period.<br />
While banks are restricted to offering their customers a maximum unfixed period of 5 calendar days, PSU’s are able to offer<br />
an unfixed period of 11 calendar days, and sometimes more.<br />
USANCE letters of credit are available.<br />
Unlike banks, PSU’s are able to offer domestic dealers an opportunity to purchase gold on an unfixed price basis for up to<br />
180 days through a deferred letter of credit. HHEC, PEC and STC offer this service.<br />
AN INTRODUCTION TO THE INDIAN GOLD MARKET
PUBLIC SECTOR UNDERTAKINGS<br />
BRANCHES<br />
The 4 PSU’s combined offer gold-related services through 38 branches in 18 cities.<br />
MMTC has 17 <strong>Gold</strong> Cells. STC, HHEC and PEC have 7 each. 40% of the branches are located in the South region.<br />
Region <strong>Gold</strong> Cells * Cities covered<br />
South 15 7<br />
West 10 3<br />
North 8 5<br />
East 5 3<br />
Total 38 18<br />
* Excludes <strong>Gold</strong> Cells established in Haryana in 2002.<br />
SUMMARY OF GOLD CELL SERVICES<br />
Some PSU’s are more active than others. MMTC is the only PSU to loan gold to domestic market entities and jewellery<br />
exporters.<br />
Public Sector <strong>Gold</strong> Cell <strong>Gold</strong> Cell Bullion Letters <strong>Gold</strong> loans <strong>Gold</strong> loans<br />
Undertakings HQ branches wholesaling of Credit Domestic Exporters<br />
MMTC New Delhi 17 100 TT’s No Yes Yes<br />
HHEC New Delhi 7 200 TT’s 200 TT’s No No<br />
PEC New Delhi 7 100 TT’s 400 TT’s No No<br />
STC New Delhi 7 200 TT’s 200 TT’s No In planning<br />
MMTC, the largest PSU importer of gold bullion, has its headquarters in New Delhi.<br />
AN INTRODUCTION TO THE INDIAN GOLD MARKET 73
PUBLIC SECTOR UNDERTAKINGS<br />
BACKGROUND INFORMATION ON PSU’S<br />
The headquarters of the 4 PSU’s are in New Delhi.<br />
MMTC Limited<br />
Established in 1963, MMTC is India’s largest general trading company covering minerals, metals, agricultural products,<br />
precious metals, gems and jewellery. It falls under the administrative control of the Ministry of Commerce and Industry.<br />
It was known formerly as The Minerals and Metals Trading Corporation of India Limited. Employees: 2,865. <strong>Gold</strong> Cell<br />
branches: 17.<br />
Apart from importing gold bullion since 1989, MMTC has opened 4 retail jewellery outlets: at Mumbai’s international airport<br />
(1996), in metropolitan Mumbai and Chennai (2001), and in Trivandrum (2002). A minting unit has manufactured MMTC<br />
minted bars and medallions since 1995, as well as customised medallions for government and corporate entities. MMTC has<br />
offered assaying and hallmarking services since 1987, registered by the Bureau of <strong>Indian</strong> Standards as an authorised<br />
Hallmarking Centre in June 2000. MMTC plays an important role in the promotion of jewellery through exhibitions and<br />
attendance of jewellery fairs worldwide.<br />
PEC Ltd<br />
Established in 1971, PEC operates as a trading house under the administrative control of the Ministry of Commerce and<br />
Industry. Apart from exporting engineering, electrical, textile and mechanical equipment and tools, it also trades a diverse<br />
range of other products from telecommunication and computer hardware to coal, timber, building materials, agricultural<br />
products, cotton fabrics and processed foods. It was known formerly as The Projects and Equipment Corporation.<br />
Employees: 210. <strong>Gold</strong> Cell branches: 7 (plus 1 in planning).<br />
PEC has been an active gold bullion importer since February 1998. It was the first PSU to offer the USANCE Letter of Credit<br />
facility to import gold.<br />
The HHEC of India Ltd<br />
Established in 1962, The Handicrafts and Handlooms Exports Corporation of India Limited (HHEC) focuses on the export promotion<br />
and trade development of handicrafts, handlooms and village industry products, ranging from woodcraft,<br />
furniture and glassware to garments, rugs, carpets and jewellery. It falls under the administrative control of the Ministry of<br />
Textiles. Employees: 240. <strong>Gold</strong> Cell branches: 7.<br />
The State Trading Corporation of India Ltd (STC)<br />
Established in 1956, STC’s trading activities range from the export of agricultural products, engineering materials,<br />
pharmaceuticals, processed foods and tobacco to the import of acids, fertilizers, sugar and precious metals. It falls under<br />
the administrative control of the Ministry of Commerce and Industry. Employees: 1,200. <strong>Gold</strong> Cell branches: 7.<br />
STC has been expanding its gold-related services since establishing its first <strong>Gold</strong> Cell office in March 1997.<br />
74<br />
MMTC and STC also support India’s gold jewellery export programme.<br />
AN INTRODUCTION TO THE INDIAN GOLD MARKET
Region/State City MMTC HHEC STC PEC<br />
NORTH<br />
Uttar Pradesh Noida 1989 - - -<br />
Bhadowi - 1997 - -<br />
Rajasthan Jaipur 1989 - - -<br />
Punjab Ludhiana 1998 - - -<br />
Haryana - - - - -<br />
Jammu & Kashmir - - - - -<br />
Himachal Pradesh - - - - -<br />
Uttaranchal - - - - -<br />
Delhi (NCT) New Delhi 1987 1982 1997 1998<br />
Chandigarh (UT) - - - - -<br />
WEST<br />
Maharashtra Mumbai 1988 (2) 1982 1997 2002<br />
Madhya Pradesh - - - - -<br />
Gujarat Ahmedabad 1989 1999 1997 1998<br />
Goa Goa 1998 - - -<br />
EAST<br />
Bihar - - - - -<br />
West Bengal Kolkata 1989 1982 2001 -<br />
Orissa Bhubaneshwar 1998 - - -<br />
Chhattisgarh Raipur 1999 - - -<br />
Jharkand - - - - -<br />
Assam - - - - -<br />
Arunachal Pradesh - - - - -<br />
SOUTH<br />
Andhra Pradesh Hyderabad 1989 - 1998 2001<br />
Visakhapatnam 1998 - - -<br />
Vijaywara - - - 2002<br />
Tamil Nadu Chennai 1998 1997 2001 1999<br />
Coimbatore 1998 - - In planning<br />
Karnataka Bangalore 1991 1998 1998 1998<br />
Kerala Cochin 1997 - - -<br />
Pondicherry (UT) - - - - -<br />
GRAND TOTAL 17 7 7 7<br />
NB. Excludes branches established in Haryana in 2002.<br />
PUBLIC SECTOR UNDERTAKINGS<br />
GOLD CELL BRANCHES<br />
The number of PSU branches has increased from 18 (1997) to 38 (early 2002).<br />
AN INTRODUCTION TO THE INDIAN GOLD MARKET 75
NON-RESIDENT INDIAN (NRI) GOLD IMPORT SCHEME<br />
The Non-Resident <strong>Indian</strong> (NRI) gold import scheme, an initiative of the Ministry of Commerce and<br />
Industry, was launched in March 1992.<br />
It enabled large quantities of gold bullion - for the first time in decades - to be imported officially for the domestic<br />
market.<br />
Under the scheme, NRI’s - when they visit India - are permitted to import up to 10 kg of gold bars and other approved<br />
gold items as long as they have been away for not less than 6 months. Prior to January 1997, the amount was 5 kg.<br />
Over a period of 6 years, the scheme accounted for 56% of gold bullion imported for domestic use. Its role as a<br />
conduit for official gold imports fell away when authorised banks started importing gold bullion in November 1997 under<br />
the Open General Licence (OGL) scheme.<br />
Since 1992, NRI’s - on their own account or on behalf of syndicates - have imported 1,352 tonnes.<br />
Although recorded NRI imports been nominal since 1999, less than 5 tonnes annually in recent years, the scheme<br />
remains in operation.<br />
DEFINITIONS<br />
A Non-Resident <strong>Indian</strong> is defined as a passenger of <strong>Indian</strong> origin, or a passenger holding a valid <strong>Indian</strong> passport, who is<br />
coming to India after a period of not less than 6 months of stay abroad. In the event that the passenger has visited India<br />
during the 6 months period, short visits are ignored as long as they do not exceed a total of 30 days during the 6 month<br />
period.<br />
Permitted gold includes bars, medallions and jewellery, but excludes legal tender coins and gold items studded with stones<br />
or pearls. The maximum amount refers to the gross weight of the items, not to the weight of the fine gold content.<br />
TRANSPORTATION<br />
NRI’s can import the gold as part of their personal luggage. Customs duty is payable by the NRI in foreign currency.<br />
NRI GOLD IMPORTS 1992 - 2001<br />
Year Tonnes NRI % of<br />
gold imports *<br />
1992 93 35<br />
1993 116 49<br />
1994 158 60<br />
1995 228 59<br />
1996 256 63<br />
1997 398 62<br />
Sub-total 1,249 56<br />
1998 93 14<br />
1999 4 < 1<br />
2000 4 < 1<br />
2001 2 < 1<br />
Total 1,352 28<br />
Source: Madhusudan Daga and other sources. * NRI % of total gold<br />
imports for domestic use.<br />
NRI imports accounted for 56% of gold imports between 1992 and 1997.<br />
76<br />
AN INTRODUCTION TO THE INDIAN GOLD MARKET
NON-RESIDENT INDIAN (NRI) GOLD IMPORT SCHEME<br />
A 5 kg “parcel” contains 42 TT bars, a 10 kg “parcel” 85 TT bars.<br />
AN INTRODUCTION TO THE INDIAN GOLD MARKET 77
78<br />
BULLION DEALERS<br />
Imported TT bars are distributed nationwide through secondary and lower tier bullion dealers that fall<br />
below the primary tier of bank and PSU importers.<br />
Bank importers indicate that there are less than 50 significant secondary tier dealers around the country. Some deal<br />
with only one bank, others with several banks.<br />
Some, acting on behalf of large tertiary tier dealers, can order 1,000 TT bars or more at a time.<br />
The banks combined are reported to deal directly with more than 200 secondary tier dealers.<br />
SECONDARY TIER DEALERS<br />
The most active dealers tend to be located in or near, or have strong links with, cities where the State sales<br />
tax is low, notably the following:<br />
State City<br />
Maharashtra Mumbai<br />
Rajasthan Jaipur<br />
Haryana Gurgaon *<br />
Gujarat Ahmedabad<br />
* Adjacent to New Delhi<br />
When dealing with banks and PSU’s, the minimum wholesale order quantity ranges between 50 – 200 TT bars.<br />
Although secondary tier dealers tend to deal only with tertiary tier dealers, some also sell TT bars directly to large jewellery<br />
retailers for fabrication purposes.<br />
While some focus solely on selling TT bars, many are involved in other precious metal-related businesses.<br />
The way secondary tier dealers purchase TT bars is covered in the sections on “Banks” and “Public Sector Undertakings” and<br />
in the chapter on “Pricing and Profitability”.<br />
OTHER DEALERS<br />
The number of tertiary and lower tier dealers involved in the distribution of TT bars runs to thousands<br />
nationwide.<br />
The bullion dealing network is complex because most trade entities act as dealers to varying extents.<br />
For example, all jewellery retailers are “bullion dealers” in that they sell and buy back coins and small bars (and buy back<br />
old gold jewellery) at prices related to the prevailing gold price. Most would sell TT bars, if requested, to retail customers.<br />
Some also act as secondary and lower tier dealers.<br />
DELIVERY<br />
Some secondary and lower tier dealers in cities will deliver TT bars (or arrange delivery) to other dealers or jewellery<br />
retailers in smaller cities, towns and even some villages.<br />
Deliveries are often hand-carried informally by couriers known as “angadias”, travelling by air, train or car.<br />
TRUST<br />
The distribution of TT bars throughout India relies on trust.<br />
The reputation of the dealer is more important than the TT bar brand offered. The distribution chain will normally accept<br />
any well-known brand from a trusted dealer.<br />
AN INTRODUCTION TO THE INDIAN GOLD MARKET
BULLION DEALERS<br />
A secondary tier bullion dealer with stocks of Rand Refinery TT bars.<br />
AN INTRODUCTION TO THE INDIAN GOLD MARKET 79
80<br />
GOLD REFINERS<br />
The refining of old gold jewellery and other scrap relies on two large refiners, 7 known organised<br />
refiners and more than 10,000 small refiners in cities, towns and some villages.<br />
Refiners are grouped under 3 broad categories:<br />
• Large refiners. India Government Mint, Mumbai. Shirpur <strong>Gold</strong> Refinery Ltd.<br />
• Organised refiners. Capacity to refine 5 or more tonnes annually.<br />
• Small refiners. Most refine less than 1 kg per day.<br />
LARGE REFINERS<br />
India Government Mint, Mumbai<br />
Formally established in 1829, the Mint has refined gold since 1919. It falls under the administrative control of the Ministry<br />
of Finance. In recent years, it has focused on the refining of old gold scrap and the manufacture of small bars associated<br />
with the 5 year <strong>Gold</strong> Bond (1993 - 1998) and the on-going <strong>Gold</strong> Deposit Scheme, launched in 1999. The Mint produces<br />
400 oz, 1000 g, 500 g, 100 g and 50 g cast bars, as well as a 10 g minted bar. It also mints tailormade products. Apart<br />
from gold refining, the Mint produces <strong>Indian</strong> currency coins.<br />
Shirpur <strong>Gold</strong> Refinery Ltd<br />
Established in 1999 as India’s first large modern gold refinery, it is located on a 52-acre site in Shirpur (Maharashtra), about<br />
400 km north east of Mumbai. Annual gold refining capacity: 217 tonnes. It is permitted by the Ministry of Commerce and<br />
Industry to import gold dore for refining within India. It manufactures 10 tola bars, 5 tola bars and kilobars at 999.9<br />
purity. Within Maharashtra, the company has “Pioneer Unit” status affording some tax exemption benefits. It has its own<br />
aircrafts and a landing strip at the Shirpur refinery to facilitate precious metal transportation. The company, until 2002, was<br />
previously known as Agee <strong>Gold</strong> Refiners Ltd. Headquarters: Mumbai. Employees: 120.<br />
ORGANISED REFINERS<br />
There are at least 7 other significant refiners with a capacity to refine 5 tonnes or more annually.<br />
Several are substantial companies. Most are involved in jewellery fabrication, jewellery retailing, bullion dealing or other<br />
businesses.<br />
City <strong>Gold</strong> refiner Approximate<br />
refining date<br />
WEST<br />
Mumbai India Government Mint 1919<br />
Mumbai National India Bullion Refinery Unit No 1 1964<br />
Mumbai National Refining Private Ltd 1942<br />
Mumbai Narrondass Manordass 1788<br />
Mumbai Parekh Platinum Ltd * 1993<br />
Shirpur Shirpur <strong>Gold</strong> Refinery Ltd 1999<br />
Ahmedabad Gujarat <strong>Gold</strong> Centre 1991<br />
SOUTH<br />
Bangalore Bangalore Refinery (P) Ltd 1976<br />
Cochin Chemmanur <strong>Gold</strong> Refinery Pvt Ltd 1995<br />
* Parekh Platinum is planning to establish a large refinery in Ahmedabad.<br />
Apart from refining and the manufacture of coins and small bars, some also produce an extensive range of industrial gold<br />
products. For example, gold anodes for industrial plating, gold alloys in various colours, fine gold wire, gold powders and<br />
pastes, and gold chemicals.<br />
AN INTRODUCTION TO THE INDIAN GOLD MARKET
GOLD REFINERS<br />
SMALL REFINERS<br />
There are more than 10,000 small refining units in cities, towns and villages throughout India.<br />
Most are extremely small, refining less than 1 kg (many less than 50 g) daily. Many units comprise only 2 workers. Most<br />
would also refine silver.<br />
Many small units in towns and villages service less than 5 jewellery retailers.<br />
In major cities, where there are larger units, the ratio of retailers to small refiners appears to be less. Informal trade<br />
estimates suggest that there are more than 50 units in Greater Mumbai, New Delhi, Kolkata and Bangalore. An estimate for<br />
the State of Kerala was 500, and for Tamil Nadu 1,000.<br />
Many jewellery fabricators and retailers also undertake their own refining in-house.<br />
An organised refiner in Mumbai – receiving old gold scrap.<br />
Most refining is undertaken by thousands of small refiners located in cities, towns and villages.<br />
AN INTRODUCTION TO THE INDIAN GOLD MARKET 81
COIN FABRICATORS<br />
Coins are minted by organised refiners and more than 1,000 other coin fabricators. Many jewellery<br />
fabricators also have a capacity to mint coins.<br />
Although the fabrication of coins and minted bars was prohibited for 27 years (1963 - 1990), existing stocks within India<br />
of legal tender gold coins, dated 1962 and earlier (mainly British sovereigns), could be owned over this period.<br />
In India, the word “coin” is commonly used to describe a round medallion bought for savings or gift purposes. It does<br />
not imply legal tender status. The category includes minted medallions and quasi-coins in rectangular, oval and other<br />
shapes. It also includes crude “duplicate” sovereigns in a variety of weights (from 8 g to 1 g), also known as “guineas”.<br />
Coins are bought for 3 main purposes: family gifts, corporate gifts and personal savings. More than 50% of coins are<br />
expected to be exchanged for jewellery over time.<br />
Most coins are sold by jewellery retailers. Demand tends to be seasonal, sold mainly during the marriage seasons and<br />
at festivals, especially around the time of Diwali (October – November).<br />
More than 35 tonnes of fine gold may have been used to fabricate coins in 2001.<br />
NUMBER AND SIZE<br />
Anecdotal evidence indicates that there are more than 1,000 coin fabrication units. A few mint more than<br />
500 kg, but most mint less than 5 kg, and some less than 1 kg of coins, annually.<br />
In the south, for example, trade estimates indicate that there are more than 50 units in the cities of Chennai, Coimbatore,<br />
Bangalore and Hyderabad. For the State of Kerala, the estimate was 100.<br />
Mumbai is the most important fabrication centre. Its units dominate the minting of coins for corporate companies<br />
nationwide.<br />
Few units rely on gold coin fabrication as their sole source of income. Many also mint large quantities of silver coins. Most<br />
mint coins sporadically according to seasonal demand.<br />
TECHNICAL FEATURES<br />
Purities<br />
Although organised refiners adopt standard purities of 995 or 999, most coins are 916.6 (K22). The purity can also be<br />
specified by the retailer or corporate entity ordering the coins (e.g. K23, K21, K20 and K18).<br />
Weights<br />
Most organised refiners produce coins ranging from 0.5 g to 100 g. The most popular weights are 10 g and less.<br />
In the south especially, many fabricators produce a standard range of small coins: 1 g, 2 g, 4 g and 8 g.<br />
Many NRI’s are also reported to import foreign coins and minted bars from the Middle East and elsewhere, usually for<br />
conversion into jewellery.<br />
Decoration<br />
Coins are available in a plethora of different designs. Corporate companies and jewellery retailers often request that their<br />
corporate logo be featured on the obverse with a standard or tailormade design on the reverse.<br />
Many coins depict a Hindu God or Goddess or religious motif on the reverse. Some units report that 50% and more of their<br />
coins would be of this kind.<br />
Crude “duplicate” sovereigns normally depict Queen Victoria, Edward VII or George V. They sometimes also incorporate the<br />
initials of the fabrication unit.<br />
CONSUMER MOTIVATION<br />
Coins are bought for 3 main purposes: family gifts, corporate gifts and personal savings.<br />
All retailers stress that most coins tend to be exchanged over time for jewellery.<br />
Family gifts<br />
Popular during the marriage season, for other family events, and at the time of festivals. Many large urban retailers observe<br />
an increase in demand in recent years.<br />
82<br />
AN INTRODUCTION TO THE INDIAN GOLD MARKET
COIN FABRICATORS<br />
Corporate gifts<br />
Although bought for this purpose since the early 1990s, Mumbai reports a surge in fabrication over the past 3 - 4 years.<br />
Hundreds of companies nationwide have rewarded staff with coins or used them as promotional prizes for their customers.<br />
Large orders for 100,000 and even 500,000 1 g coins, have occurred, alongside orders for 100’s and sometimes 1000’s of<br />
5 g, 10 g and larger coins. Although large coin fabricators deal directly with corporate companies, many large jewellery<br />
retailers also act on behalf of corporate companies.<br />
Personal savings<br />
Most retailers observe that the purchase of coins for personal savings purposes is normally low, but some in Mumbai,<br />
Ahmedabad and the south report an increase in recent years.<br />
For many consumers, coins are a vehicle to accumulate gold that will eventually be converted into jewellery.<br />
However, retailers observe that most coins featuring a religious Hindu design tend not to be sold back by consumers, unless<br />
there is an economic “necessity”. It would be “like melting down a God”.<br />
In the south, several retailers commented that, for this reason, some customers were becoming resistant to buying coins of<br />
this kind in large quantities.<br />
DISTRIBUTION<br />
Jewellery retailers<br />
Apart from those coins produced for corporate companies, trade estimates suggest that more than 80% of coins bought for<br />
private purposes are retailed by jewellery outlets.<br />
In most outlets, the coins are usually not visible, as the retailer would prefer to sell jewellery at a higher profit margin.<br />
The retail mark-up on coins is low, normally around Rs 50 (US$ 1.00), regardless of its weight. Some retailers sell them at<br />
the carat gold price without any mark-up as a customer service.<br />
Banks<br />
In 1999, 3 banks tried to retail commemorative coins, but sales did not meet expectations. A relatively high price by <strong>Indian</strong>,<br />
though not by international, standards was reported as an important reason for their lack of success.<br />
Corporation Bank. Tendulkar coin. 1/4 oz. Minted by Perth Mint (Australia). Supplied by Societe Generale.<br />
Bank of India. Millenium 2000 coin. 10 g. Minted by Royal Canadian Mint. Supplied by ScotiaMocatta.<br />
State Bank of India. Millenium 2000 coin. 10 g. Minted by Pamp (Switzerland). Supplied by Rothschild.<br />
Some banks are reported to be investigating how they can retail coins more effectively.<br />
Internet<br />
Fabmart Pvt Ltd (Bangalore) is pioneering the sale of 10 g coins through its website. There is a choice of 22 different designs<br />
depicting Hindu Gods and Goddesses. Laser hallmarked. Minted by VNM in Pondicherry.<br />
A small coin fabrication unit.<br />
More coins appear to be fabricated in the west and south than in the north and east.<br />
AN INTRODUCTION TO THE INDIAN GOLD MARKET 83
COIN FABRICATORS<br />
SEASONALITY<br />
Most coins tend to be sold at the time of festivals and during the marriage seasons. Many fabricators and<br />
retailers report that about 50% of annual fabrication and sales occurs around Diwali (October-November).<br />
QUANTITY<br />
Generally, large jewellery retailers report that their coin sales would range from less than 1% up to 5% of their<br />
turnover. Some fabricators and bullion dealers also retail directly to corporate companies and the public.<br />
Coin sales appear to be higher in large cities. For most small urban and rural jewellery retailers, sales seem to be<br />
non-existent or extremely low. Private demand in the west and south also appears to be higher than in the north and east.<br />
Estimating the size of the coin market is extremely difficult as fabrication is so fragmented.<br />
Informal trade estimates suggest (at this time) that 15 tonnes may be fabricated in the west, 10 - 15 tonnes in the south and<br />
less than 10 tonnes in the north. Fabrication in the east is reported as low, probably less than 5 tonnes. An indicative<br />
fabrication estimate for 2001 is 35 tonnes of fine gold. This would equate to about 40 tonnes by gross weight of carat gold<br />
coins.<br />
The quantity of coins fabricated for corporate purposes nationwide may exceed 10 tonnes. From the fabricator perspective,<br />
this would normally include not only tailor-made coins ordered by corporate companies but also tailor-made branded coins<br />
for jewellery retailers that may sell them to both corporate companies and the public.<br />
Some <strong>Indian</strong> analysts believe that coin fabrication for corporate and private use may have been 50 tonnes, perhaps as high<br />
as 70 tonnes, in 2001. This may be the case but, when GIR visited major coin fabrication centres in the north, notably New<br />
Delhi, Meerut and Agra, gold coin output appeared to be low (while silver coin fabrication was extremely high). In addition,<br />
the bulk of small fabricators appear to fabricate less than 5 kg annually. Some large refiners also tend to include in their<br />
estimates minted coins and bars that are bought, or swapped for scrap, by jewellery retailers and then melted down for<br />
jewellery fabrication purposes.<br />
While the quantity of coins fabricated nationally for corporate and private use is an unresolved issue, the important point is<br />
that coin fabrication is substantial and overall demand, according to the trade, has grown at both corporate and private<br />
levels over the past 3-4 years, although there is variation among regions and States.<br />
EXAMPLES OF STANDARD MINTED COIN WEIGHTS<br />
Weights Mumbai Mumbai Mumbai Mumbai Ahmedabad Bangalore Cochin<br />
in grammes National Parekh Narrondass National Gujarat Bangalore Chemmanur<br />
<strong>Gold</strong> Platinum Manordass India <strong>Gold</strong> Refinery <strong>Gold</strong><br />
Refinery Bullion Centre Refinery<br />
100 100 - 100 100 - 100 100<br />
50 50 50 50 50 - 50 50<br />
25 - 25 25 25 - - -<br />
20 20 20 - 20 - - -<br />
10 10 10 10 10 10 10 10<br />
8 * - - - - - 8 8<br />
5 5 5 5 5 5 5 5<br />
4 * - - - - - 4 4<br />
2.5 - - - - 2.5 - 2.5<br />
2 2 2 2 2 2 2 2<br />
1 1 1 1 1 1 1 1<br />
0.5 - - 0.5 0.5 - 0.5 -<br />
Standard purity 995 999 995 995 999 999 999<br />
* 8 g and 4 g coins are normally K22.<br />
Most refineries will also tailor-make coins and bars to any specified weight, purity, caratage and design.<br />
Rectangular bars<br />
National Refinery None.<br />
Parekh Platinum 100 g, 50 g.<br />
Narrondass Manordass In all weights.<br />
National India Bullion In all weights.<br />
Gujarat <strong>Gold</strong> Centre 50 g, 20 g, 10 tola, 5 tola, 1 tola.<br />
Bangalore Refinery In all weights, except 8 g and 4 g.<br />
Chemmanur Refinery In all weights, except 8 g and 4 g.<br />
84<br />
AN INTRODUCTION TO THE INDIAN GOLD MARKET
COIN FABRICATORS<br />
A bullion dealer that sells coins in Mumbai.<br />
Many coins are sold at the time of Diwali in October and November.<br />
Photograph: Parekh<br />
Organised fabricators produce tailor-made and well-packaged coins for hundreds of corporate companies<br />
and institutions. They are used as gifts and incentives for staff, trade customers and consumers.<br />
AN INTRODUCTION TO THE INDIAN GOLD MARKET 85
BAR HOARDING<br />
Bullion dealers and jewellery retailers in urban and rural areas generally reported that, in their view, bar<br />
hoarding by the public is low.<br />
The exceptions were some trade entities in Mumbai and Ahmedabad.<br />
In major cities, speculative trading in TT bars occurs but the number of speculators is regarded as small and confined<br />
mainly to the “elite”.<br />
Anecdotal evidence suggests that the net increase in bars hoarded may have been as low as 20 tonnes in 2001.<br />
The level of net bar hoarding is an unresolved issue. Some <strong>Indian</strong> analysts believe it may be higher than the estimates<br />
in this report.<br />
PERSPECTIVE<br />
Several reasons for the low level of bar hoarding were advanced.<br />
• Owning imported TT bars implied an association with the underground economy. Even if bought with legitimate funds,<br />
bar ownership would be queried by the tax authorities.<br />
• Many people were still not aware that TT bar ownership, banned during the period of the <strong>Gold</strong> (Control) Act, was now<br />
legal. Even those who were aware that it is legal felt more comfortable owning jewellery and coins.<br />
• <strong>Gold</strong> is not an “idle” asset. <strong>Gold</strong> in the form of jewellery could be worn. Most wives would also persuade their husbands<br />
to convert bars, if held, into jewellery.<br />
• Unlike Western countries, gold jewellery is still widely regarded as the best way to “invest” in gold for store of value and<br />
savings purposes.<br />
• In the early to mid-1990s, there had been more bar hoarding, but it had declined in recent years in most States due to<br />
the static rupee gold price.<br />
In the major metropolitan cities, the trade did report some private speculation in bars. There were large investors who<br />
bought and sold TT bars (sometimes 100 or more), but this did not constitute bar hoarding. There appeared to be little<br />
long-term accumulation. The number of speculators had also fallen since the mid to late 1990s.<br />
Some trade entities, in the metropolitan cities, also commented that significant quantities of TT bars may be bought to<br />
“park” underground funds, but in their view the bars were likely to be held for a short period before being used for other<br />
purposes.<br />
Some top end jewellery retailers, in Mumbai in particular, also observed that, although few TT bars were currently used to<br />
pay for jewellery (apart from NRI’s who often brought back bars and coins for this purpose), they expected consumers to<br />
accumulate more bars in the future. There was some evidence that this was starting to happen. It would be cheaper to<br />
convert accumulated bars, rather than accumulated jewellery, into new jewellery for marriage purposes.<br />
The trade made these observations in the context of a static rupee gold price between 1997 - 2001. Although the price had<br />
risen since September 2001, they believed that the public were still wary about the direction of the gold price. Attitudes to<br />
bar ownership might change but, in their view, most purchases in the future were more likely to be for short-term<br />
speculative purposes, or accumulated for conversion into jewellery.<br />
ABOVE GROUND STOCKS<br />
Anecdotal evidence (at this time) suggests that bar hoarding as a proportion of India’s above ground stocks<br />
of gold may be below 2%, i.e. below 240 tonnes.<br />
The net annual increase in the above ground stock of TT and other bars appears to have been small in recent years.<br />
The annual increase in the net amount of bars hoarded is difficult to resolve as some trade entities appear not to<br />
differentiate clearly between the gross and net level of private bar purchases in any one year.<br />
The on-going dishoarding of bars, originally bought for speculative or “money” purposes, or for conversion into jewellery<br />
over time, appears not to be taken sufficiently into account.<br />
86<br />
AN INTRODUCTION TO THE INDIAN GOLD MARKET
BAR HOARDING<br />
Some trade entities in Mumbai and Ahmedabad expect more consumers to accumulate TT and minted bars<br />
for conversion into gold jewellery in the future.<br />
AN INTRODUCTION TO THE INDIAN GOLD MARKET 87
BULK DELIVERY OF OFFICIAL GOLD IMPORTS<br />
The official import of gold bars into India by banks and other authorised entities can be cleared at<br />
14 airports.<br />
Most are cleared at 5 international airports:<br />
North New Delhi<br />
West Ahmedabad, Mumbai<br />
East Kolkata<br />
South Chennai<br />
Imports can also be cleared at some domestic airports, having been trans-shipped directly by air from international<br />
airports. After clearance, many shipments are transported by air and road throughout India.<br />
Most bars arrive at airports where the State taxes are low, or where they can be subsequently trans-shipped to States<br />
with low State taxes.<br />
State sales and municipal taxes tend to change. In recent years, Ahmedabad and Jaipur (clearance at New Dehli) have<br />
been important distribution centres. In 2002, Mumbai and Gurgaon have also become important.<br />
Open General Licence (OGL). In 1997-99, for which statistics are available, 59% was cleared at Ahmedabad and New<br />
Delhi.<br />
Non-Resident <strong>Indian</strong> (NRI). In 1994-99, 93% was cleared at Calicut, Mumbai, New Delhi and Chennai.<br />
Special Import Licence (SIL). In 1994-99, 96% was cleared at Ahmedabad, Mumbai and New Delhi.<br />
SHIPPERS<br />
Important agents, that clear gold bullion through Customs and arrange its transportation to final delivery destinations,<br />
include the following:<br />
Brink’s Arya India Private Limited<br />
Established in 1981 as a joint-venture with Brinks Inc (USA). Branch offices: 15. Headquarters: Mumbai.<br />
Group 4 Securitas Cash Services (P) Ltd<br />
Established in 1998 as a subsidiary of Group 4 Falck (Denmark). Branch offices: 11. Headquarters: New Delhi.<br />
Securitrans India Pvt Ltd<br />
Established in 1999 as a private company. Services Viamat International (Zurich) and Guardforce (Hong Kong). Branch<br />
offices: 10. Headquarters: New Delhi.<br />
Major airlines that deliver gold to India include Air India, British Airways, Emirates and Swissair. Side shipments within India<br />
are normally undertaken by <strong>Indian</strong> Airlines.<br />
Bar imports generally arrive in India 3 - 6 days after the bank has placed an order with an international bullion dealer.<br />
88<br />
Approximately 650 tonnes of gold bars were imported officially in bulk for the domestic market and<br />
jewellery exporters in 2001.<br />
AN INTRODUCTION TO THE INDIAN GOLD MARKET
BULK DELIVERY OF OFFICIAL GOLD IMPORTS<br />
SOURCES OF BULK DELIVERY<br />
More than 95% of shipments originate from, or are routed through, Switzerland, South Africa and the United<br />
Kingdom.<br />
According to the DGCIS, the table below – based on consignment notes - generally indicates the last port of call prior to the<br />
shipment landing in India.<br />
It does not reflect the actual quantity of bars produced in each country. For example, TT bars made in South Africa are<br />
often transported via Zurich.<br />
While highlighting Switzerland as a bullion transit centre, it also underlines the importance of Switzerland, South Africa and<br />
the UK as major producers of TT bars.<br />
Country Tonnes<br />
1996-97 1997-98 1998-99 1999-00 1999-01<br />
Switzerland 42.7 179.6 235.2 236.2 306.3<br />
South Africa 0.8 11.9 101.3 149.4 69.9<br />
UK 1.2 34.5 65.6 64.2 85.5<br />
Sub-total 44.7 226.0 402.1 449.8 461.7<br />
UAE 2.1 30.3 26.9 6.9 3.8<br />
USA 1.9 4.4 5.3 10.2 0.3<br />
Australia 1.0 0.9 10.1 2.1 0.6<br />
Hong Kong 0.2 0.3 4.7 0.1 0.1<br />
Other 2.1 3.5 6.3 .2.2 4.7<br />
Total 52.0 265.4 455.4 471.3 471.2<br />
Source: Directorate General of Commercial Intelligence and Statistics (DCGIS), Kolkata. * The table combines the two categories of imports as<br />
recorded by the DGCIS: “Other non-monetary unwrought forms of gold” and “Other non-monetary semi-manufactured forms of gold”. The latter is<br />
included as gold bars are often recorded as semi-manufactured products. NRI imports are not included, as the DGCIS does not record a breakdown<br />
by port of entry. The DGCIS advise that its gold import statistics indicate the minimum amount imported, as it is not always advised of all official<br />
imports.<br />
SHIPPING AGENT OFFICES<br />
Brink’s, Group 4 and Securitrans have gold storage facilities in 17 cities. Most are located in the south.<br />
State City Brinks Group 4 Securitrans<br />
NORTH<br />
Delhi (NCT) New Delhi Yes Yes Yes<br />
Rajasthan Jaipur Yes * ** Yes<br />
Chandigarh (UT) Chandigarh Yes ** Yes<br />
WEST<br />
Maharashtra Mumbai Yes Yes Yes<br />
Maharashtra Pune Yes - -<br />
Gujarat Ahmedabad Yes Yes Yes<br />
Gujarat Surat Yes Proposed Yes<br />
SOUTH<br />
Tamil Nadu Chennai Yes Yes Yes<br />
Tamil Nadu Coimbatore Yes Yes Yes<br />
Tamil Nadu Salem - Yes -<br />
Karnataka Bangalore Yes Yes Yes<br />
Andhra Pradesh Hyderabad Yes Yes Yes<br />
Andhra Pradesh Visakhapatnam Yes Yes -<br />
Kerala Cochin - Yes -<br />
Kerala Trivandrum Yes - -<br />
EAST<br />
West Bengal Kolkata Yes Yes -<br />
Orissa Bhubaneshwar Yes ** -<br />
Total offices 15 11 10<br />
* Brink’s: Storage facility for Jaipur is planned.<br />
** Group 4: Services Jaipur and Chandigarh via Delhi, Bhubaneshwar via Kolkata.<br />
AN INTRODUCTION TO THE INDIAN GOLD MARKET 89
BULK DELIVERY OF OFFICIAL GOLD IMPORTS<br />
INTERNATIONAL AIRPORTS AND CUSTOMS CLEARANCE CITIES<br />
State City Int’l Customs Clearance Delivery within India<br />
airport clearance<br />
NORTH<br />
Delhi New Delhi Yes Yes - -<br />
Rajasthan Jaipur - Yes (embargo) Cleared Delhi* Road<br />
Chandigarh Chandigarh - - Cleared Delhi Road<br />
Jammu Jammu - - Cleared Delhi Road or air<br />
Uttar Pradesh Kanpur - - Cleared Delhi Road or air<br />
Uttar Pradesh Lucknow - - Cleared Delhi Road or air<br />
Punjab Ludhiana - - Cleared Delhi Road<br />
WEST<br />
Maharashtra Mumbai Yes Yes - -<br />
Gujarat Ahmedabad Yes Yes - Also air from M’bai<br />
Gujarat Rajkot - - Cleared A’bad Road<br />
Madhya Pradesh Indore - - Cleared Mumbai Road or air<br />
Goa Goa Yes Yes Cleared Mumbai Road or air.<br />
SOUTH Sometimes cleared in<br />
M’bai. Mainly air<br />
shipments from M’bai<br />
Tamil Nadu Chennai Yes Yes - -<br />
Tamil Nadu Coimbatore Yes Yes - Also air from Chennai<br />
Tamil Nadu Salem - - Cleared Coimbatore Road<br />
Tamil Nadu Trichy - - Cleared Cochin or Road<br />
Coimbatore<br />
Pondicherry Pondicherry - - Cleared Chennai Road<br />
Karnataka Bangalore Yes Yes - -<br />
Karnataka Mangalore - - Cleared B’lore Road<br />
Andhra Pradesh Hyderabad Yes Yes - -<br />
Andhra Pradesh Visakhapatnam - Yes - -<br />
Kerala Cochin Yes Yes - -<br />
Kerala Trivandrum Yes Yes - -<br />
EAST<br />
West Bengal Kolkata Yes Yes - Also air shipments from<br />
M’bai<br />
Orissa Bhubaneshwar - Yes Cleared Kolkata Road<br />
Source: Brink’s Arya and Securitrans India. * Deliveries to Jaipur are currently cleared in New Delhi.<br />
Although gold imports can be cleared in 14 cities, in recent years the bulk has been cleared at Ahmedabad<br />
and New Delhi.<br />
90<br />
AN INTRODUCTION TO THE INDIAN GOLD MARKET
BULK DELIVERY OF OFFICIAL GOLD IMPORTS<br />
Mumbai and Gurgaon have become more important as bulk delivery centres due to a reduction in their<br />
State sales taxes on bar imports in 2002.<br />
AN INTRODUCTION TO THE INDIAN GOLD MARKET 91
92<br />
Perspective<br />
<strong>Gold</strong> jewellery products<br />
Jewellery fabricators<br />
CONTENTS<br />
Traditional jewellery retailers<br />
Number<br />
Size<br />
Methods pf payment<br />
Buy-backs for cash<br />
Inventories<br />
Anticipated changes in distribution network<br />
Promotional activities<br />
<strong>Gold</strong> jewellery consumers<br />
Motivation to own gold jewellery<br />
Adornment dimension<br />
Investment dimension<br />
Transactions<br />
Wedding jewellery<br />
Other gifts within the family<br />
Personal purchases<br />
Social classes<br />
Rural versus urban demand<br />
Regional demand<br />
Importance of cities as retail centres<br />
Indicative bridal amounts by social class<br />
Indicative wedding sets<br />
Indicative monthly seasonality<br />
Auspicious days for Hindu weddings<br />
Branded jewellery retail chains<br />
Hallmarking<br />
<strong>Gold</strong> jewellery exports<br />
CHAPTER 5<br />
GOLD JEWELLERY<br />
India is the world’s largest gold jewellery market.<br />
<strong>Indian</strong> consumers bought more than 950 tonnes of gold jewellery in 2001.<br />
AN INTRODUCTION TO THE INDIAN GOLD MARKET
PERSPECTIVE<br />
INDIA<br />
The gold jewellery market in India is different from that in Western countries.<br />
<strong>Gold</strong> jewellery is sold at fluctuating and low prices related to the prevailing value of its fine gold content. The declared<br />
mark-up ranges from 5 - 25%.<br />
It acts as a tradable investment in that it is easy for consumers to sell or exchange their jewellery at a reasonable price,<br />
as many do.<br />
While cultural, adornment and other factors influence the purchase of gold jewellery, its parallel role as an investment<br />
for store of value, savings and money purposes is also relevant.<br />
WESTERN COUNTRIES<br />
<strong>Gold</strong> jewellery is sold at fixed and high prices ranging from 100% to 300% and more above the value of its fine gold<br />
content.<br />
It is bought primarily for adornment purposes. While the intrinsic value of gold jewellery is important, the investment<br />
dimension is not blatant.<br />
It is difficult for consumers to exchange or sell their jewellery. Only a fraction of the original purchase price can<br />
normally be redeemed.<br />
To mark the difference from gold jewellery sold in Western countries, the broad term “investment jewellery” is<br />
widely used by Western analysts to describe gold jewellery sold in India.<br />
Photograph: Alukkas<br />
A common retailer estimate is that more than 70% of jewellery purchases is marriage-related.<br />
The category would include jewellery bought for weddings and other marriage-related purposes, not least<br />
to accumulate gold for young daughters.<br />
AN INTRODUCTION TO THE INDIAN GOLD MARKET 93
GOLD JEWELLERY PRODUCTS<br />
This section covers caratages, the typical weights and relative importance of the 5 main product<br />
categories, and the variety of regional styles.<br />
K22 is the dominant caratage.<br />
The bangle is the most important product for most large retailers. accounting on average for around 30% of the weight<br />
of gold jewellery sold. A pair typically weighs between 12 g and 24 g.<br />
Kolkata is renowned for its intricate filigree jewellery.<br />
There is increasing consumer demand for innovative designs.<br />
CARATAGES<br />
Most plain gold jewellery is sold as K22, but K24, K23, K21 and K18 jewellery is also available.<br />
K22 jewellery is generally sold as “22/20”. This means that, when the item is melted down, its fine gold content will be<br />
approximately 10% less than its designated weight. This traditional practice takes into account gold wastage, and an<br />
extensive use of solders, in the fabrication of most handmade items.<br />
Since the introduction of voluntary hallmarking, and the use of solders such as cadmium, many large retailers are now<br />
selling jewellery that is “22/22”.<br />
K24 is often available to those customers, especially in some rural areas, who want simple, lower value added jewellery.<br />
K23 is also available, notably in the west and north. In Maharashtra, it can account for 20% (sometimes 90%) of jewellery<br />
sales in some outlets. In rural areas in the Punjab, K23 is widely sold.<br />
K21, a traditional caratage in the Middle East, is sometimes available .<br />
K18 is normally used for gold jewellery incorporating diamonds.<br />
IMPORTANT CATEGORIES<br />
There are 5 broad categories that normally account for the bulk of gold jewellery sales: necklaces, bangles,<br />
chains, earrings and finger rings.<br />
<strong>Gold</strong> usage<br />
The importance of each category, as a percentage of the total weight of gold jewellery sold, can vary greatly among<br />
retailers, even in the same locality.<br />
The table below records the variation among the large urban retailers visited.<br />
Category % Split of retail sales<br />
by weight<br />
Necklaces 10 - 35<br />
Bangles 20 - 50<br />
Chains 10 - 40<br />
Earrings 5 - 20<br />
Finger rings 5 - 10<br />
Other 5 - 10<br />
Total 100<br />
Bangles. Generally the most important category, typically around 30% of the total weight of gold jewellery sold. They are<br />
normally sold as pairs, sometimes 6 pairs or more at a time.<br />
Chains. Variable, even in the same locality. In the south, chains appear to be more important, typically 25 - 35%.<br />
Necklaces. Variable, but typically 15 - 20%. A marked decline in importance in many outlets over the past 5 years.<br />
The importance of earrings and finger rings tends to increase progressively down the distribution chain. In small rural and<br />
suburban outlets, their proportion often exceeds 50%. However, among many large retailers, their sale is also reported to<br />
be increasing.<br />
94<br />
AN INTRODUCTION TO THE INDIAN GOLD MARKET
GOLD JEWELLERY PRODUCTS<br />
Handmade jewellery weights<br />
Among large urban retailers, the typical weights of handmade items also varies greatly, dependent on the wealth of<br />
customers and regional preferences.<br />
In some outlets, extremely heavy items can be sold. Necklaces can weigh as much as 2 kg, bangles and chains and even<br />
a pair of earrings more than 50 g, and finger rings more than 20 g. Less common items such as waist belts can exceed<br />
200 g, while golden plaits can be more than 500 g.<br />
The table below illustrates the more common range of weights available. The inclusion of the “typical” range of weights sold<br />
is designed only to indicate the relative weights of different categories.<br />
Category Common range of “Typical” range of<br />
weights available weights sold<br />
Necklace 15 - 200 g 30 - 60 g<br />
Bangle 8 - 20 g 8 - 12 g<br />
Chain 10 - 40 g 10 - 15 g<br />
Earrings 2 - 20 g 3 - 6 g<br />
Finger ring 2 - 10 g 3 - 6 g<br />
Large retailers observe generally that the average weight of individual items across all categories has fallen over the past<br />
5 years. A typical reduction in weight is around 20%.<br />
The weights of all categories tend to decrease progressively down the distribution chain. In small rural and suburban<br />
outlets, necklaces may comprise only a locket strung on a synthetic chain. “Studs” or “tops” (earrings) may weigh 1 - 3 g.<br />
Machine-made jewellery weights<br />
Machine-made jewellery is generally lighter than handmade jewellery. Its weight range is normally less.<br />
Category Common range of<br />
weights available<br />
Chain 6 - 25 g<br />
Bangle 6 - 25 g<br />
Earrings 2 - 15 g<br />
Finger ring 3 - 15 g<br />
Over the past 5 years, the sale of jewellery that is mainly machine-made has increased significantly. Among large urban<br />
retailers, its proportion of total jewellery sales typically ranges between 10% and 20%, and as high as 35% in some outlets.<br />
Chain, the most important category, is reported to be increasingly available in towns and villages.<br />
Marriage symbols<br />
Although symbols can vary by regions, State and caste, many married women wear a mangalsutra, or a gold chain.<br />
A mangalsutra is a necklace that usually incorporates black glass beads.<br />
<strong>Gold</strong> dinner and Pooja sets<br />
Although not widely available, the following records the weight of K22 sets retailed by Kirtilals in Hyderabad.<br />
Dinner set Weight<br />
4 large plates 220 g each<br />
4 cups 38 g each<br />
1 small plate 100 g<br />
Total 1,132 g<br />
Pooja set * Weight<br />
1 plate 222 g<br />
1 bowl 60 g<br />
2 beakers 60 g each<br />
1 pot 48 g<br />
2 lamps 175 g each<br />
Total 1,150 g<br />
* For Hindu religious purposes.<br />
AN INTRODUCTION TO THE INDIAN GOLD MARKET 95
GOLD JEWELLERY PRODUCTS<br />
STYLES AND DESIGN<br />
A broad trade estimate is that around 80% of gold jewellery is sold nationally as plain gold jewellery.<br />
Around 20% is studded jewellery incorporating elements such as precious and semi-precious stones, pearls and synthetic<br />
materials.<br />
In some States, notably in the south, some large urban retailers observe that, while sales of diamond-studded gold jewellery<br />
have increased, sales of other forms of studded gold jewellery have decreased. One reason is that many consumers are<br />
increasingly aware that studded jewellery tends to have a lower resale value. In other States, however, notably in the north<br />
and west, sales of other forms of studded jewellery are reported to have increased.<br />
Styles vary around the country. Generally, jewellery is regarded as heavier and more intricate in the north, lighter in the<br />
south.<br />
Different proportions of silver, copper and other alloy materials can yield slight variations in the colour of gold jewellery.<br />
Preferences among regional fabrication centres are broadly described: yellow (north), red (east), yellow/white (west) and<br />
yellow/red (south).<br />
New styles of jewellery are accommodating consumer demand, especially over the past 5 years, for “new” and “fashionable”<br />
gold jewellery.<br />
Selected features of different regional styles are often blended together. More subtle designs often reflect a Western<br />
influence.<br />
Innovative designs are also applied to studded jewellery, incorporating precious and semi-precious stones such as diamonds,<br />
emeralds, rubies and sapphires, artificial materials such as zircons and glass, and pearls.<br />
New styles are also taking into greater account the “wearability” of jewellery for a variety of social and work-related<br />
occasions.<br />
Fashion, modern clothes, lifestyle and comfort are now considered important influencing factors by fabricators that serve<br />
large urban retailers.<br />
EXAMPLES OF REGIONAL GOLD JEWELLERY<br />
The photographs and texts on the following pages were kindly provided by Tribhovandas Bhimji Zaveri (TBZ, Zaveri<br />
Bazaar, Mumbai). TBZ, established in 1864, is acknowledged throughout India as one of the country’s leading jewellery<br />
retailers. Most leading retailers stock a diverse range of regional gold jewellery styles.<br />
96<br />
AN INTRODUCTION TO THE INDIAN GOLD MARKET
REGIONAL JEWELLERY STYLES<br />
KOLKATA<br />
Kolkata (West Bengal) goldsmiths have been regarded for centuries as the best in India. They fabricate intricate filigree<br />
jewellery. It often incorporates gold granules or circular cushions interspersed with gold studs that are set onto plain or<br />
twisted wire.<br />
NEW DELHI AND AGRA<br />
<strong>Gold</strong>smiths in north India, especially in New Delhi and Agra (Uttar Pradesh), excel at the jadao technique that inlays hard<br />
stones, precious stones and pearls into gold. The stones, set in K24, are then mounted onto K22 jewellery. Although the<br />
Chinese have carved jade into beautiful shapes for centuries, <strong>Indian</strong> goldsmiths have perfected the art of incorporating jade<br />
into gold jewellery.<br />
AN INTRODUCTION TO THE INDIAN GOLD MARKET 97
REGIONAL JEWELLERY STYLES<br />
AMRITSAR<br />
Amritsar (Punjab) specialises in heavy filigree work, often incorporating heart shaped motifs into heavy chains. Since the<br />
17th century, Amritsar gold jewellery has been renowned for its distinctive local style.<br />
JAIPUR<br />
The minakari technique, which means “artistry of coloured glass”, traces its origins to the 16th century workshops of<br />
Maharajah Man Singh in Jaipur (Rajasthan). The colours are normally confined to a glowing ruby red, a brilliant translucent<br />
green and an opaque white, supplemented occasionally by a greyish blue. Floral and leaf patterns are usually interspersed<br />
with birds and animals.<br />
98<br />
AN INTRODUCTION TO THE INDIAN GOLD MARKET
REGIONAL JEWELLERY STYLES<br />
AHMEDABAD<br />
Ahmedabad (Gujarat) is famous for its distinctive “ras rava” style of gold jewellery, and for its influence on jewellery<br />
fabrication nationally. Granules and minute flat discs with gold links are normally incorporated into twisted or braided gold<br />
wire.<br />
KARWAR<br />
<strong>Gold</strong>smiths in the ancient port of Karwar (Karnataka) fabricate gold jewellery renowned for its complexity of structure and<br />
combination of motifs. It is light in weight and made from die-struck pieces.<br />
AN INTRODUCTION TO THE INDIAN GOLD MARKET 99
REGIONAL JEWELLERY STYLES<br />
COIMBATORE<br />
Coimbatore (Tamil Nadu) is an important fabrication centre due to its proximity to Chennai. Its jewellery tends to imitate<br />
forms found in nature. Its speciality is light filigree jewellery that incorporates gold wire, stamped florets, flat discs and<br />
hemispheres.<br />
KUNDAN JEWELLERY<br />
Kundan jewellery incorporates the irregular shapes of uncut precious, semi-precious or coloured stones or pearls into<br />
carefully wrought yellow gold mounts that can be leaf, octagonal, square, oval and pear shaped. The rich colourful effect is<br />
repeated on the back of the settings, brilliantly enamelled with floral motifs. Rajasthan and Gujarat are important kundan<br />
fabrication centres.<br />
100<br />
AN INTRODUCTION TO THE INDIAN GOLD MARKET
REGIONAL JEWELLERY STYLES<br />
SWAMI JEWELLERY<br />
Antique swami work jewellery, popular in south India, depicts designs or figures of deities in the Hindu pantheon, normally<br />
in an alto-relievo or embossed style. The deities most often depicted are Vishnu, Shiva, Ganesh and Sarasvati. European<br />
religious symbols have also been depicted since Victorian times.<br />
DESHI JEWELLERY<br />
Deshi, also called gheru, is a polish that gives a red-copper colour to gold jewellery. It also softens sharply reflective<br />
surfaces. In historical times, tamarind juice was used to obtain the red sheen.<br />
AN INTRODUCTION TO THE INDIAN GOLD MARKET 101
Around 85% of gold jewellery is handmade or mainly handmade. Around 15% is mainly machine-made,<br />
but its proportion is increasing.<br />
There are approximately 3 million active goldsmiths and ancillary workers. Most work in units with less than<br />
5 workers.<br />
A goldsmith typically has a capacity to fabricate 10 g of carat jewellery each day.<br />
Units are under pressure from retailers and consumers to produce innovative and higher quality jewellery.<br />
Large quantities of gold jewellery are fabricated in every region. Mumbai dominates the fabrication of machine-made<br />
jewellery.<br />
BACKGROUND<br />
Fabrication takes place in cities and large towns, as well as in many smaller towns and villages.<br />
Most units are small, normally comprising less than 20 workers, many less than 5 workers.<br />
Most are contracted to retailers and wholesalers, although some act as wholesalers and retailers in their own right. Many<br />
retailers and wholesalers own fabrication units.<br />
Most handmade jewellery is fabricated in the locality where it is retailed, although the output of major fabrication centres<br />
such as Kolkata is available nationwide. Machine-made jewellery tends to be sourced from major centres such as Mumbai<br />
and New Delhi.<br />
Retailers and wholesalers normally supply the gold when placing an order. A typical leadtime for delivery is one week. The<br />
inventory of gold held by most units tends to be low.<br />
The income of goldsmiths is low. Monthly income typically ranges from less than Rs 5,000 (US$ 100) to Rs 15,000<br />
(US$ 300), working 10 or more hours per day, 6 - 7 days per week.<br />
Many units and goldsmiths work sporadically according to seasonality and fluctuations in local demand.<br />
NUMBER OF WORKERS<br />
Since the repeal of the <strong>Gold</strong> (Control) Act in 1990, the workforce appears to have grown from around<br />
1 million to around 3 million.<br />
In the last <strong>Gold</strong> Control Statement in 1989, licences were held by 380,000 goldsmiths, each allowed to employ one ancillary<br />
worker. According to the trade, there were also many unlicensed goldsmiths.<br />
Trade estimates of the size of the workforce nationwide vary greatly. Some estimate the workforce at more than 5 million.<br />
However, anecdotal evidence (at this time) suggests that the number of active goldsmiths and apprentices may be less than<br />
2 million, although ancillary and part-time workers might exceed 1 million.<br />
There are several reasons. When asked to estimate the increase in goldsmiths in their own locality since 1990, most<br />
fabricators refer to multiples of 2 - 4. Trade estimates tend also to include artisans and ancillary workers associated with<br />
the diamond, silver and imitation jewellery industries. Even at an annual fabrication level of 2,000 tonnes, the daily output<br />
of 3 million goldsmiths and ancillary workers would be less than 3 g of carat gold.<br />
FABRICATION CENTRES<br />
Mumbai is now regarded as the largest fabrication centre due to its high output of machine-made jewellery.<br />
The 5 most important centres are listed below. Their jewellery is widely available regionally or nationally.<br />
102<br />
JEWELLERY FABRICATORS<br />
Region State City<br />
North New Delhi New Delhi/Meerut<br />
East West Bengal Kolkata<br />
West Maharashtra Mumbai<br />
Gujarat Ahmedabad/Rajkot<br />
South Tamil Nadu Coimbatore<br />
AN INTRODUCTION TO THE INDIAN GOLD MARKET
JEWELLERY FABRICATORS<br />
All centres, with the exception of Coimbatore, have progressively increased their output, and the proportion sold outside<br />
their cities, over the past 5 years. Kolkata is now reported to sell around 75% of its output outside, Mumbai 70% and New<br />
Delhi 50%.<br />
The fabrication of machine-made jewellery is dominated by Mumbai, widely acknowledged to account for 60% or more of<br />
national output. According to the trade, it has around 200 factories, some with more than 100 chain-making machines. The<br />
other significant centre is New Delhi/Meerut with around 50 factories.<br />
Most large retailers now tend to offer a wider variety of jewellery from these and many other fabrication centres. Other<br />
significant centres include Jaipur and Amritsar (north) and Hyderabad, Bangalore, Karwar, Nellore and Belgaum (south).<br />
Trade estimates of the amount fabricated in the 5 major centres vary greatly, but anecdotal evidence suggests that some<br />
centres may fabricate more than 50 tonnes annually.<br />
Indicative trade estimates put the workforce in New Delhi, Meerut and Kolkata at more than 100,000, in Mumbai at more<br />
than 200,000.<br />
The trade also observe that many goldsmiths, skilled in a traditional style, are relocating to fabrication centres around the<br />
country, notably from West Bengal.<br />
LARGER UNITS<br />
Since 1990, larger units fabricating handmade jewellery have emerged, but the number remains low<br />
nationwide.<br />
Conservative trade estimates put the number of large units employing more than 50 workers in New Delhi at around 50, in<br />
Coimbatore 30, and in Kolkata 20. In Mumbai, the number may be more than 100.<br />
The table below illustrates the tasks undertaken by 94 workers in a large fabrication unit in Coimbatore. The unit includes<br />
goldsmiths from West Bengal and Maharashtra.<br />
Category Number of workers<br />
Smelting and refining 2<br />
Die making 1<br />
Wire drawing 1<br />
<strong>Gold</strong>smiths 60<br />
Assistants to goldsmiths 20<br />
Quality check 2<br />
Polishing 2<br />
Cutting and engraving 4<br />
Packing 2<br />
Total workforce 94<br />
Photograph: B.C. Sen<br />
Fabricating handmade jewellery in Kolkata.<br />
<strong>Gold</strong>smiths from West Bangal – renowned as the best in India – work in other centres throughout the country.<br />
AN INTRODUCTION TO THE INDIAN GOLD MARKET 103
JEWELLERY FABRICATORS<br />
SMALLER UNITS<br />
The trade has difficulty estimating the number of smaller units in their cities, but generally observe that there<br />
may be several thousand medium size units with 20 - 40 workers nationwide.<br />
However, the bulk of handmade jewellery is fabricated by thousands of small units with less than 20 workers.<br />
Most of these small units are reported to have less than 5 workers, often the members of a single family.<br />
A striking feature of all handmade fabrication units is that they each tend to service a very small number of clients. Even<br />
large units with more than 50 workers may supply less than 10 retailers and wholesalers, in some cases only one.<br />
OUTPUT CAPACITY<br />
Handmade jewellery<br />
Trade estimates of a goldsmith’s capacity vary greatly, from less than 5 g to more than 20 g of carat jewellery daily.<br />
Daily output varies according to demand, the skill of the goldsmith, the size and complexity of the piece, the number of<br />
similar pieces being made at the same time, and whether it is fabricated in an “organised”, as opposed to a small family,<br />
unit.<br />
A typical capacity is described as 10 g of carat jewellery per day.<br />
For example, a standard 10 g bangle, or a pair of 6 g earrings, would take about a day to make, a standard 20 g necklace<br />
about 2 days. Complicated pieces might take 2 or 3 times as long. Some pieces might take a week or more.<br />
Fabrication of a single piece often involves the participation of several workers with specialised skills and tasks, sometimes<br />
operating outside the unit. The average output per worker would often be less than 10 g.<br />
Machine-made jewellery<br />
One large chain-maker in Mumbai indicated that the daily output of a single machine could range from 300 g of thin chain<br />
up to 4 kg of thick chain.<br />
TRADE OBSERVATIONS<br />
Designs<br />
Fabricators are under increasing pressure from retailers to provide jewellery with innovative designs. Many large units (and<br />
retailers) now employ their own in-house designers.<br />
Quality<br />
Larger retailers are now demanding an even higher standard of workmanship and finish.<br />
Training<br />
Large and medium size units emphasise their need for support: more technical information and more opportunities to attend<br />
technical workshops and seminars.<br />
Low income<br />
<strong>Gold</strong>smiths observe that, although they are so important to the gold jewellery market, their income does not reflect their<br />
technical and design skills. Many advise that they are earning less in real terms than 5 years ago.<br />
Future<br />
There appears to be a surplus of goldsmiths, the outcome of limited growth in the gold jewellery market since 1998. In the<br />
1990s, many youngsters were encouraged to enter the industry.<br />
104<br />
AN INTRODUCTION TO THE INDIAN GOLD MARKET
JEWELLERY FABRICATORS<br />
JEWELLERY WHOLESALERS<br />
Since 1990, wholesalers have become increasingly important. They are now supplying 30% or more<br />
(sometimes 60%) of the stock of many large urban retailers.<br />
Most retailers rely on them to provide machine-made chains from Mumbai and elsewhere, as well as handmade items made<br />
locally or from a variety of fabrication centres.<br />
The wholesaling category cannot be clearly separated as many fabricators act as their own wholesalers, many also acting<br />
as retailers, and many wholesalers also own fabrication units.<br />
Anecdotal evidence suggests that there are many large wholesalers selling 50 kg or more each month, operating alongside<br />
thousands of smaller wholesalers, sub-wholesalers and commission agents.<br />
Most are reported to service retailers only within their locality or State, but many act regionally and nationally, if located<br />
within a major fabrication centre.<br />
A typical large wholesaler is reported as having between 10 and 50 large clients, although it can run to many more if they<br />
focus on smaller clients. Its staff would often be less than 10 people.<br />
Many offer a partial credit facility, some offer consignment stocks. The inventory of a large wholesaler can be substantial,<br />
especially if they fabricate jewellery on a speculative basis. Inventories of 50 kg and more are not uncommon.<br />
The wholesaling of jewellery nationwide has been stimulated since banks were authorised to import and sell gold<br />
throughout the country. Large retailers are now able to buy gold from bullion dealers nationwide for collection by the<br />
wholesaler. This service has reduced the need to hand carry gold to major fabrication centres.<br />
Most jewellery is fabricated by goldsmiths in small units of less than 20 workers.<br />
AN INTRODUCTION TO THE INDIAN GOLD MARKET 105
TRADITIONAL JEWELLERY RETAILERS<br />
There are approximately 300,000 “traditional” gold jewellery outlets. They are family-owned businesses.<br />
Less than 15,000 family retailers may account for 30% or more of gold jewellery sales nationwide.<br />
The exchange of old jewellery, coins and bars for new gold jewellery and buy backs for cash are standard transactions.<br />
Dishoarding may have supplied more than 40% of gold used to fabricate new jewellery in 2001.<br />
Large retailers report that their inventories have increased by 20 - 50% over the past 5 years. The inventory stock in<br />
total is unlikely to exceed 400 tonnes of fine gold.<br />
Many large retailers report that their profit margin on gold jewellery sales has fallen.<br />
Large showrooms are expected to increase their share of the jewellery market. The distribution network is expected to<br />
contract over time.<br />
BACKGROUND<br />
Family-owned jewellery retailers are generally categorised as “traditional jewellers”.<br />
The term is misleading as many are at the forefront of innovation.<br />
Although they may operate under the same names, especially in large cities, the outlets tend to be owned and run as<br />
separate and loosely associated businesses by fathers, sons, brothers, nephews, cousins and other close relatives.<br />
In their role as jewellery retailers, they act as dealers. They buy back and exchange jewellery at prices linked to the<br />
prevailing gold price. They also retail and buy back coins (and bars, if requested).<br />
Many are involved in other jewellery-related businesses and activities: fabrication, wholesaling, refining, coin fabrication and<br />
bullion dealing.<br />
Some large retailers in metropolitan and smaller cities also own showrooms outside India, mainly in the Gulf countries, but<br />
some also in Europe, the USA and elsewhere.<br />
Many large retailers also have non-precious metal related businesses. Many retailers sell jewellery as an ancillary product.<br />
NUMBER<br />
Since the repeal of the <strong>Gold</strong> (Control) Act in 1990, the number of jewellery outlets appears to have grown<br />
from 16,000 to approximately 300,000.<br />
Since the last <strong>Gold</strong> Control Statement in 1989, no statistics have been available. Trade estimates vary greatly from 250,000<br />
to several hundred thousand.<br />
Even within major metropolitan cities, trade estimates vary widely. In Mumbai, for example, estimates range from 4,000 to<br />
more than 10,000.<br />
The reason for the range in estimates is due mainly to the “uncountable” tens of thousands of very small outlets that have<br />
been established in cities, towns and many villages throughout India since 1990. Outlets that only sell silver or imitation<br />
jewellery also tend to be included.<br />
Retail distribution increased rapidly due to 4 main factors.<br />
• Many of the 380,000 goldsmiths, certified in 1989, became small retailers, especially in suburban and rural areas.<br />
• Many thousands of pawnbrokers also started to retail gold jewellery.<br />
• Many retailers, licensed in 1989, were well positioned to establish new outlets for other family members.<br />
• Many families, without previous experience, were encouraged to become jewellery retailers as it appeared to be so<br />
profitable.<br />
Although new outlets continue to be opened, retailers in most States refer to the rate of overall expansion having eased<br />
since 2000.<br />
To provide some indication of the number of outlets in cities, towns and villages, the following are anecdotal trade estimates.<br />
The extent to which large urban retailers include smaller outlets in their cities varies.<br />
106<br />
AN INTRODUCTION TO THE INDIAN GOLD MARKET
TRADITIONAL JEWELLERY RETAILERS<br />
State City Number Indicative population*<br />
of outlets<br />
Maharashtra Mumbai > 4,000 9,926,000<br />
Delhi New Delhi > 3,000 8,419,000<br />
West Bengal Kolkata > 2,000 11,022,000<br />
Gujarat Ahmedabad > 2,000 3,312,000<br />
Tamil Nadu Chennai > 2,000 5,422,000<br />
Karnataka Bangalore > 3,000 4,130,000<br />
Andhra Pradesh Hyderabad > 600 4,344,000<br />
Uttar Pradesh Agra > 500 948,000<br />
Tamil Nadu Coimbatore > 300 1,101,000<br />
Rajasthan Jaipur > 200 1,518,000<br />
Punjab Ludhiana > 200 1,043,000<br />
Kerala Cochin > 200 1,141,000<br />
Maharashtra Nagpur > 200 1,604,000<br />
State Town or Number Indicative population*<br />
village of outlets<br />
Maharashtra Jalgaon 150 300,000<br />
Punjab Fatehgarh 70 120,000<br />
Rajasthan Kotputli 70 300,000<br />
Gujarat Limdi 70 45,000<br />
Uttar Pradesh Kosi Kalan 30 100,000<br />
Andhra Pradesh Suryapet 30 100,000<br />
Haryana Samalkha 25 50,000<br />
Kerala Pala 13 20,000<br />
Tamil Nadu Sripelubudur 7 10,000<br />
* Indicative populations. Cities (Statistical Outline of India, 2001-2002, Tata Services Limited.<br />
Figures relate to the Census in 1991). Towns and villages (trade estimates).<br />
The number of retail outlets is not necessarily proportional to the size of population. Retailers in cities can sell to customers<br />
throughout their States (and in other States). In cities such as New Delhi and Mumbai, some large retailers service<br />
customers nationwide.<br />
Retailers in rural towns also sell to customers from neighbouring villages. Unusual towns, such as Jalgaon, can attract<br />
customers up to 3-400 km away.<br />
The extent to which large retailers sell to “outside” customers varies. A sample of large retailers in the metropolitan cities<br />
suggests that outside customers may account for the following proportion of their sales: New Delhi (50%), Kolkata (30%),<br />
Chennai (20%) and Mumbai (15%). Their estimates may not be accurate, but they illustrate the current willingness of<br />
customers to travel to other centres, especially for purchases of “bridal jewellery”.<br />
The rough estimate of 300,000 outlets suggests that, on average, one retail outlet serves 3,300 people in a population of<br />
one billion. However, the ratio varies among States, and tends to be lower in major cities.<br />
Large retailers can sell more than 50 times as much gold jewellery as a small retailer.<br />
AN INTRODUCTION TO THE INDIAN GOLD MARKET 107
TRADITIONAL JEWELLERY RETAILERS<br />
SIZE<br />
A relatively small number of retailers appears to account for a high proportion of gold jewellery sales<br />
nationwide.<br />
Although most retailers are cautious about revealing their own sales, and estimating the sales of their competitors, some<br />
general comments can be made.<br />
• There appear to be several thousand outlets nationwide that sell more than 300 g daily (on average during a year).<br />
Some outlets sell more than 1 kg daily. Many large retailers sell 50 times, some 100 times, as much as small outlets.<br />
• In most of the cities visited, the top 10% of outlets are reported to account for 50% or more of total jewellery sales.<br />
More than 50% of the total number of outlets in their cities are regarded as selling less than 50 g daily.<br />
• In the small towns and villages visited, although there can be large and dominant outlets in some, sales generally appear<br />
to be more evenly spread across many small outlets, most appearing to sell less than 50 g daily.<br />
Anecdotal evidence (at this time) suggests that a very high proportion (perhaps 75%) of the approximately 300,000 outlets<br />
in urban and rural areas sell less than 50 g daily, many less than 10 g.<br />
It also suggests that less than 15,000 large family retailers may account for as much as 30% or more of gold jewellery sales<br />
nationwide.<br />
METHODS OF PAYMENT<br />
Retailers accept payment in 3 forms: cash, old jewellery and coins/bars. The amount of old gold jewellery<br />
recycled is substantial.<br />
Although the sample of urban and rural retailers is small, the range and indicative typical amounts were recorded (as a<br />
percentage split) as follows.<br />
URBAN Range Indicative estimates<br />
Cash 40 - 85 70<br />
Old jewellery 5 - 60 25<br />
Coins/bars < 1 - 10 < 5<br />
Total 100<br />
RURAL<br />
Cash 30 - 80 60<br />
Old jewellery 20 - 70 35<br />
Coins/bars < 1 - 10 < 5<br />
Total 100<br />
Anecdotal evidence suggests that in 2001 the split nationally may have been approximately: cash (65%), old jewellery<br />
(30%) and coins/bars (less than 5%).<br />
Urban retailers observe that the amount of old jewellery exchanged has increased over the past 5 years. The proportion<br />
had risen for many from 15 - 20% to 25%.<br />
Most rural retailers indicate that the level of exchange is normally high, but tends to fluctuate according to local economic<br />
conditions.<br />
When visiting retailers in the west and south in May 2002, almost all reported that exchange had increased significantly due<br />
to the higher gold price, alongside a depressed economic environment. At times it had exceeded 50%.<br />
Old gold jewellery<br />
Old jewellery is exchanged mainly to buy new jewellery for marriage purposes, to replace worn-out jewellery, and to obtain<br />
fashionable new designs.<br />
Marriage jewellery. Although the wealthy tend to pay for new jewellery mainly in cash, the middle and lower classes tend<br />
to rely a lot more on the exchange of old jewellery accumulated over many years.<br />
Worn-out jewellery. As bangles, chains and earrings are usually worn on a daily basis, many customers exchange broken,<br />
dented and scuffed pieces. High caratage jewellery is prone to wear and tear.<br />
“Fashionable” jewellery. Exchanging items, even if bought only months or a few years previously, for new jewellery with<br />
fashionable new designs has grown significantly over the past 5 years, mainly by the high and upper middle classes.<br />
The amount of old gold jewellery exchanged can greatly influence the amount of gold imported, as well as annual estimates<br />
of the amount of jewellery fabricated and consumed.<br />
108<br />
AN INTRODUCTION TO THE INDIAN GOLD MARKET
TRADITIONAL JEWELLERY RETAILERS<br />
Coins and bars<br />
The proportion of coins and bars received as payment is generally recorded as low. A typical proportion is less than<br />
1% - 2%, but it can be as high as 5 - 10% in some outlets.<br />
While coins were usually used, NRI’s often use small bars acquired from outside India.<br />
Some urban retailers expect the proportion to rise as some of their customers are buying more coins for accumulation and<br />
gift purposes than in the past. They anticipate that more than 50% of these coins will eventually be converted into<br />
jewellery.<br />
BUY-BACKS FOR CASH<br />
The buy-back of old jewellery for cash is significant, but extremely difficult to quantify nationally.<br />
The variation among retailers is marked, even in the same locality. Some also confused buy-backs for cash with exchange.<br />
In some cities (notably in Mumbai), independent scrap merchants also account for a significant amount of buy-backs.<br />
In 2001, among large urban retailers, buy-backs as a percentage of gold jewellery sales were reported to range between<br />
1% and 10%.<br />
Among rural and smaller urban retailers, it ranged between 5% and 40%.<br />
During visits to the west and south in May 2002, however, almost all urban and rural retailers observed that the level of buybacks<br />
had increased significantly due to the high gold price, in some cases the percentage exceeding 50% of gold jewellery<br />
sales. When combined with an increased level of exchange, at times some had no need to buy TT bars.<br />
Anecdotal evidence suggests that in 2001 buy-backs nationally may have been as high as 10% of gold jewellery sales.<br />
A conservative estimate is that it was around 7%.<br />
It can be stressed that many retailers find it difficult to differentiate precisely the split between old jewellery, coins and bars<br />
acquired through exchange and through buy-backs for cash. The important point is that recycling in all its forms is<br />
substantial, and in 2001 appears to have provided 40% or more of the gold used for jewellery fabrication.<br />
General retailer comments on the nature of buy-backs, and the propensity of customers to sell their old jewellery, can be<br />
recorded.<br />
• Urban high and upper middle classes (includes large farmers) do not normally sell back their jewellery.<br />
• Middle and lower classes in urban and rural areas tend to sell back old jewellery, including wedding jewellery, when there<br />
is an economic “necessity” to do so.<br />
• Most customers, who sell back jewellery, would try to replace some of the jewellery when their financial circumstances<br />
improved.<br />
• Although the selling back of jewellery is more common in rural areas, many farmers also use their jewellery to secure<br />
loans from moneylenders and banks. This practice inhibits the level of buy-backs in some States.<br />
• Rural buy-backs also tend to be sporadic. Farmers tend to sell back more jewellery during the monsoon season to cover<br />
family costs when little or no agricultural income is generated.<br />
• In the view of some retailers, customers tend to plan their selling back (unless an emergency occurs such as the need<br />
for medical treatment) to coincide with a known future expenditure. If the gold price rises unexpectedly, many would<br />
take the opportunity to sell sooner the jewellery that they would have sold anyway.<br />
Retailers observe generally that their level of buy-backs over the period 1998 - September 2001 was relatively stable. The<br />
higher level of buy-backs (and exchange) in the first half of 2002 is mainly the outcome of gold jewellery’s sensitivity to a<br />
significant increase in the gold price.<br />
A scrap dealer in Mumbai buying back old gold jewellery for cash when the gold price spiked in May 2002.<br />
AN INTRODUCTION TO THE INDIAN GOLD MARKET 109
TRADITIONAL JEWELLERY RETAILERS<br />
INVENTORIES<br />
The inventories of most large and many smaller retailers have increased substantially, especially over the<br />
past 5 years.<br />
Large retailers observe generally that their inventories have increased by 20 - 50% over this period. Many smaller retailers<br />
also report that they have been obliged to increase their inventories.<br />
Reasons include the trend among customers to buy ready-made, rather than customised, jewellery. Many are now insisting<br />
on a much wider variety of “fashionable” pieces to choose from. Retailers have responded to this trend, and fuelled it, to<br />
attract new customers in a static market.<br />
To increase their inventories, many retailers have reinvested their profits, while both large and small retailers appear to be<br />
supported increasingly by wholesalers who offer partial credit terms or consignment stocks at higher prices.<br />
Inventories vary greatly in size. A large retailer may have 30 kg of gold jewellery on display, some 100 kg and more. Many<br />
small retailers have less than 5 kg, some only a few hundred grammes, and even less when they rely on their customers to<br />
provide the gold for fabrication purposes.<br />
Although inventory turnover rates vary considerably, large retailers indicate that a typical average is now likely to be around<br />
3 times annual sales, although in the mid-1990s it was higher at around 4 - 6 times. Among medium size and smaller<br />
retailers, who operate with small inventories and sell more customised jewellery, the inventory turnover rate would be<br />
higher.<br />
Anecdotal evidence suggests that the total amount of gold jewellery held in inventories by retailers nationwide is unlikely to<br />
exceed 400 tonnes of fine gold (equivalent to around 500 tonnes of carat gold).<br />
Inventories tend to be stable. Retailers observe generally that they do not increase their inventories when<br />
the gold price falls, or reduce them when the gold price rises.<br />
To replace the net amount of gold jewellery sold (taking into account the amount of old jewellery exchanged or bought back<br />
for cash), and to preserve the size of their inventory, they usually buy gold on a daily or weekly basis regardless of the<br />
prevailing gold price. They do not speculate on the gold price.<br />
When buying gold bars from bullion dealers, they advise that they rarely keep them in bar form for long. They are normally<br />
converted into jewellery as soon as possible.<br />
Inventories act generally as depositories of family wealth.<br />
In India, most traditional retailers view their inventories differently from retailers in Western countries. Apart from being the<br />
vehicle to retail gold jewellery, inventories also serve as a long-term family investment in gold.<br />
110<br />
Most jewellery retailers are small. Many sell on average less than 50 g of gold jewellery daily.<br />
AN INTRODUCTION TO THE INDIAN GOLD MARKET
TRADITIONAL JEWELLERY RETAILERS<br />
ANTICIPATED CHANGES IN THE DISTRIBUTION NETWORK<br />
Most traditional retailers expect the jewellery distribution network to evolve over the next 10 years, although<br />
most stress that the rate of change is likely to be gradual. They expect large showrooms to increase their<br />
share of the jewellery market.<br />
Large showrooms will become increasingly dominant in major cities.<br />
The rationale of large retailers is that their large inventories, wide range of innovative jewellery designs and commitment to<br />
promotion will attract more and more of the emerging middle class. Their high profile and prestige will increasingly<br />
reassure customers that are concerned about product quality. The new generation of well-educated (many universitytrained)<br />
family members will also ensure that showrooms adopt improved business and marketing practices. They will also<br />
be better equipped to respond to changing consumer needs and preferences.<br />
Large showrooms in smaller cities will become more sophisticated, and more large showrooms will be<br />
established in major towns and important villages.<br />
There will be a natural evolution. Growth in the size and number will be driven not only by resident retailers, but also by<br />
new entrants (some from outside the city, town or village) opening or franchising new showrooms. This development is<br />
likely to erode over time the sales growth of retailers in those cities that have many “outside” customers.<br />
Some traditional retailers will establish well-branded small regional or national chains of wholly owned or<br />
franchised showrooms.<br />
During the 1990s, many large retailers opened new family outlets within their cities.<br />
Several are now aware that there are opportunities to establish or franchise sophisticated new showrooms in smaller cities<br />
and large towns within their State and nationally.<br />
An important motivation is that competition within major cities is so intense. Another is their view that high growth in the<br />
jewellery market is more likely to occur outside the major cities.<br />
Some have already opened or franchised new showrooms in smaller cities and large towns. Several others report that they<br />
are planning to do so.<br />
However, there is likely to be a contraction over time in the number of traditional retailers nationwide.<br />
Although few outlets have closed down in recent years, the trade expects some contraction to take place across all outlet<br />
categories.<br />
The timing and extent of contraction will be much influenced by the extent to which the gold jewellery market will grow. Its<br />
overall growth has been limited since 1998.<br />
Large showrooms. Vulnerable showrooms are those that are not prepared or not able to adapt to an increasing level of<br />
competition, especially in large cities. The overheads of large showrooms are high.<br />
Medium-size retailers (150 - 300 g daily). Notably those in cities where there are many large showrooms. The trade observe<br />
generally that this is the category most at risk.<br />
Small outlets (less than 100 g). Contraction is likely to be variable. Many small outlets will continue to prosper, servicing<br />
the poorer communities in cities, towns and villages.<br />
They also expect some contraction to occur in the clusters of traditional outlets in some city locations where there is<br />
substantial traffic congestion. In large cities, suburban clusters will become increasingly important.<br />
Traditional jewellers are also aware that, as a category, they will lose market share to non-traditional branded jewellery retail<br />
chains being established nationwide in department stores and shopping centres, and as stand-alone outlets.<br />
Although the retail chains (covered in a separate section) are still at the experimental stage, and their combined volume is<br />
less than 1% of the jewellery market, they are expected to erode the sales of traditional retailers in many cities over time.<br />
AN INTRODUCTION TO THE INDIAN GOLD MARKET 111
TRADITIONAL JEWELLERY RETAILERS<br />
PROMOTIONAL ACTIVITIES<br />
This section illustrates the range of promotional activities undertaken by jewellery retailers. In an<br />
increasingly competitive market, many large retailers now undertake sophisticated promotional programmes.<br />
There are 4 categories of promotion that are common to most retail outlets.<br />
Carat gold prices<br />
Display boards record the prevailing K22 and other carat gold prices per gramme or 10 g as the basis of their gold jewellery<br />
pricing policy.<br />
<strong>Gold</strong> jewellery displays<br />
Great care is normally taken to show as much gold jewellery as possible. Hundreds, sometimes thousands of pieces, are<br />
displayed on the walls and in the showcases of larger outlets.<br />
Trained counter staff<br />
A high level of personal service is offered. Many large retailers have 20, sometimes 100 and more, counter staff. Most are<br />
highly experienced, or well trained, to motivate and reassure customers.<br />
Hospitality<br />
Most retailers, at every level, encourage their customers to view their visit as a social event. The customer normally sits<br />
down, trays or selected pieces of jewellery are brought to the counter, transactions tend to be leisurely, and refreshments<br />
are often offered.<br />
Although few retailers go beyond this level of promotion, many large retailers now undertake a wide variety of promotional<br />
programmes.<br />
The following lists some reported activities:<br />
Advertising<br />
On TV, cable networks, cinema, radio, press and billboards. Large promotional banners outside showrooms are common.<br />
Festivals and auspicious days<br />
Promotion at the time of national and local festivals, and important auspicious days in the State’s Hindu calendar.<br />
Innovative jewellery collections<br />
Tailor-made displays of new collections for marriage and important family occasions and anniversaries, for festivals and<br />
special events, and for the young.<br />
Pricing incentives<br />
Periods when discounts, reduced “making” charges and other incentives apply.<br />
Promotional materials<br />
For example, calendars drawing attention to auspicious marriage and other days, promotional leaflets, sophisticated<br />
packaging and branded carry-bags.<br />
Mail-shots<br />
Advising customers of new collections and promotional events.<br />
Travelling sales exhibitions<br />
In suburbs, as well as in nearby cities and towns. Normally in hotels.<br />
Community projects<br />
For example, well-publicised support of public gardens and charitable events.<br />
PR programmes<br />
For example, regular media interviews and the loan of jewellery for publicity purposes.<br />
Branding<br />
The most conspicuous change in the attitude to promotion is represented in the scale of the refurbishment of so many<br />
existing large showrooms during the 1990s, and the construction of new showrooms with an image that is contemporary<br />
with the aspirations of the emerging middle class. Many retailers are conscious of the need to brand their outlets.<br />
112<br />
AN INTRODUCTION TO THE INDIAN GOLD MARKET
TRADITIONAL JEWELLERY RETAILERS<br />
Many large retailers now undertake extensive promotion.<br />
Although most promotional budgets are less than Rs 5 lakh (US$ 10,000), several exceed Rs 1 crore<br />
(US$ 200,000).<br />
AN INTRODUCTION TO THE INDIAN GOLD MARKET 113
GOLD JEWELLERY CONSUMERS<br />
<strong>Gold</strong> jewellery is bought as an “adornment”. It is also bought as an “investment”. For most consumers,<br />
the motivations are intertwined.<br />
As much as 50% of annual sales may rely on new purchases associated with about 8 million weddings each year.<br />
In total, more than 70% of all purchases is broadly regarded as marriage-related because jewellery is accumulated for<br />
this purpose over many years.<br />
India is fundamentally a “gift-giving” market. Most jewellery is given to brides (and bridegrooms), women and young<br />
girls by their parents, husbands or relatives.<br />
Fashion is stimulating a higher proportion of personal purchases in large urban showrooms. Although described as<br />
personal, most are the outcome of family decisions, and many fall within the gift-giving category.<br />
Lighter weight “wearable” jewellery is viewed by retailers as an emerging new market with much potential.<br />
In the rural areas, much low value added jewellery appears still to be bought personally as a way to store “savings”.<br />
Jewellery purchases tend to be higher over 2 periods: October - January (4 months) and April - May (2 months).<br />
Although “everyone buys gold”, the jewellery market appears to rely on the top 60% (109 million households) for the<br />
bulk of annual purchases. Retailers stress the importance of the emerging middle class.<br />
The urban population may account for 40% of jewellery purchases at this time. The rural/urban split is not a static<br />
proportion each year. Rural demand weakens in a depressed agricultural environment.<br />
The south (40%) is regarded as the most important jewellery consuming region, followed by the west (20 - 25%), north<br />
(20 - 25%) and the east (15%).<br />
Cities are important retail centres in their States. For example, Greater Mumbai (Maharashtra) may account for 35%,<br />
and Chennai (Tamil Nadu) for 30% of sales within their States.<br />
This section relies on information and insights provided by gold jewellery retailers.<br />
MOTIVATION TO OWN GOLD JEWELLERY<br />
“<strong>Gold</strong> is an auspicious metal. It is supposed to be divine. It is considered as bringing the Goddess Laxmi into your home.<br />
It is a symbol of wealth and prosperity.”<br />
“Giving gold jewellery to your daughter at the time of marriage is a necessity. Owning gold jewellery is a necessity. It is<br />
our tradition.”<br />
“<strong>Gold</strong> jewellery’s main role is as an asset. Its advantage is its liquidity and high resale value.”<br />
These retailer observations illustrate two parallel motivations. <strong>Gold</strong> jewellery is owned as an “adornment” for cultural,<br />
status and decorative reasons. It is also owned as an “investment” for store of value, savings and money purposes.<br />
Although attitudes towards owning gold have started to diverge among the rich/poor, young/old and urban/rural, both<br />
motivations remain relevant across all categories.<br />
114<br />
The purchase of gold jewellery is normally the outcome of a family decision.<br />
AN INTRODUCTION TO THE INDIAN GOLD MARKET
ADORNMENT DIMENSION<br />
<strong>Gold</strong> jewellery is a symbol of wealth, status and good fortune that is underpinned by the Hindu religion.<br />
Weddings<br />
The bride is normally adorned with as much jewellery as the family can afford. Large items tend to be worn by female<br />
guests. For most families, a public display of wealth and financial security at weddings is an age-old tradition and ritual.<br />
Among the wealthy, much bridal jewellery is rarely worn again: stored in one of millions of bank “lockers” (deposit boxes).<br />
Large items tend to be withdrawn only occasionally for important functions.<br />
Daily wear<br />
Jewellery is normally worn by women on a daily basis. Most married women wear an item indicating their married status,<br />
many wearing a mangalsutra or long gold chain. Ancillary gold items can include earrings, finger rings and pairs of bangles.<br />
Adornment-related observations<br />
GOLD JEWELLERY CONSUMERS<br />
“Wearable” jewellery<br />
Economic and social changes during the 1990s have encouraged many women to acquire items, within their bridal<br />
collection or through additional purchases or the exchange of old jewellery, that are suited to a variety of social and<br />
work-related occasions, clothing and lifestyle. This has led to increasing sales of lighter weight and smaller items.<br />
Most retailers view “wearable” jewellery as an important new market segment for the middle class. Wedding jewellery tends<br />
to be heavier, formal and more traditional in design.<br />
“Fashionable” jewellery<br />
For both wedding and “wearable” jewellery, many women are insisting on jewellery with innovative and contemporary<br />
designs.<br />
Machine-made jewellery is becoming more popular. It is light, sleek, modern and available in many stylish designs.<br />
Competition<br />
Although there is economic growth, much disposable income that might previously have been spent on jewellery is now<br />
being absorbed by lifestyle products such as TV’s, white goods, electrical appliances, clothing and holidays. The<br />
joint-family system is also gradually being replaced, especially in urban areas, by nuclear families that tend to be less<br />
conservative and less committed to gold.<br />
Image<br />
<strong>Gold</strong> jewellery’s image remains strong among the middle and lower classes, but the sale of large amounts for adornment<br />
purposes is intertwined with the consumer’s perception of gold as a worthwhile asset.<br />
At the top end, demand has weakened for several reasons. <strong>Gold</strong> jewellery is viewed as “old-fashioned”. The younger<br />
generation appears to be less committed to owning or wearing as much as their parents. Retailers are well aware that they<br />
need to address these issues.<br />
Positive factors<br />
The population and number of marriages increase each year. Economic growth will generate a much larger middle class.<br />
The custom of wearing much jewellery at weddings and important functions is expected to endure for a long time. Personal<br />
purchases of wearable, fashionable and small items of jewellery are expected to increase significantly over time.<br />
Photograph: Alukkas<br />
For many jewellery consumers the gold bangle is the most important product category.<br />
Bangles account on average for about 30% by weight of the gold jewellery sales of large urban retailers.<br />
AN INTRODUCTION TO THE INDIAN GOLD MARKET 115
INVESTMENT DIMENSION<br />
In a country where there is widespread poverty, no social security net, an underground economy, and a<br />
vulnerable currency alongside exchange control, gold jewellery has been viewed as an important family<br />
investment for decades.<br />
As an investment, gold jewellery acts mainly as a “store of value”. It is easy to buy and sell close to the value of its gold<br />
content. It is accepted as “money” everywhere. Its rupee price has normally kept pace with, and exceeded, the rate of<br />
inflation over the long term. It is portable and easy to store. It is a discreet asset.<br />
The investment dimension is important for most women because much of the family’s jewellery is generally viewed as their<br />
personal property. For many married women, it is the only valuable asset they own.<br />
The investment dimension is also important to men. Jewellery enables fathers to provide some financial security for their<br />
daughters at the time of marriage. For most brides, it represents their inheritance. Within the family, husbands often<br />
prefer to give gifts of gold jewellery, and to encourage their wives to buy jewellery rather than ephemeral items, because<br />
the family’s overall wealth is enhanced.<br />
<strong>Gold</strong> jewellery can be used to secure loans. Thousands of banks, co-operative banks, moneylenders and pawnbrokers accept<br />
gold jewellery as security, normally 50 - 60% of the value of gold content. For many people, pledging gold jewellery is the<br />
only way to obtain a loan. The amount pledged nationally during the 1980s was registered at around 60 tonnes. There is<br />
now no official record, but it might exceed this level several times.<br />
<strong>Gold</strong> jewellery can be sold to cover emergencies. Among small farmers, it can be sold to cover family and other costs when<br />
agricultural income is low.<br />
It is also used to absorb “excess money”, a term commonly used. The poorer population has limited access to banks, while<br />
many others distrust banks or prefer not to use them.<br />
Investment-related observations<br />
GOLD JEWELLERY CONSUMERS<br />
Static rupee gold price<br />
Since 1998, the investment dimension has weakened. A static annual price for 4 years until late 2001 did not keep pace<br />
with inflation. Over the previous 26 years, in all but one (1982), the price had increased every year. Consumers were not<br />
resistant to paying higher prices over this period as an annual price increase was “guaranteed”. Many consumers appear to<br />
be more sensitive to higher gold prices. They distrust volatile spurts, and have lost some faith in the role of gold as a<br />
long-term investment.<br />
Competition<br />
For many consumers, increasing access to bank deposit accounts, the share market, life insurance and pension funds has<br />
reduced gold jewellery’s investment role.<br />
Encouraging factors<br />
Although the rupee gold price has been static in recent years, gold jewellery retains its residual advantage as a discreet,<br />
tradable and wearable asset. Many people have also lost heavily on <strong>Indian</strong> share markets and in property investment in<br />
recent years. The underground economy is expected to endure for many years. Many retailers stress that now is the time<br />
to emphasise, in an appropriate way, the advantages of owning gold jewellery for store of value and savings purposes.<br />
TRANSACTIONS<br />
A common retailer estimate is that more than 70% of all jewellery sold is marriage-related.<br />
Transactions fall under 3 broad categories.<br />
• Gifts of bridal and other jewellery at the time of weddings.<br />
• Other gifts of jewellery within the family.<br />
• Personal purchases.<br />
Retailers observe that much jewellery, bought as “other gifts” and for personal purposes, is much influenced by a family’s<br />
need to accumulate gold for their daughter’s wedding, and to enhance the personal wealth of married women.<br />
In joint-families, and in many nuclear families, most purchases are the outcome of a family decision. Men play an<br />
important role. They tend to determine or agree the choice of retailer and the amount to be spent. They can also<br />
participate in choosing bridal and other jewellery.<br />
For many families, buying jewellery is a social event. When bridal jewellery is bought, the presence of 10 or more relatives<br />
is not uncommon. For other purchases, a small group of relatives or close friends tends also to be present.<br />
116<br />
AN INTRODUCTION TO THE INDIAN GOLD MARKET
GOLD JEWELLERY CONSUMERS<br />
MARRIAGES<br />
Family purchases of jewellery at the time of marriage appear to account for as much as 50% of annual<br />
jewellery sales nationwide.<br />
Large urban showrooms. Its share can range from 25% to 80%, most retailers reporting a range between 40 - 60%. Most<br />
observe that its share has fallen over the past 5 years, typically by 10%. Reasons include a reduction in the average amount<br />
bought, and an increase in the purchase or replacement of jewellery with fashionable new designs.<br />
Smaller suburban outlets. Its share tends to vary. While some indicate its share at 50 - 70%, others refer to high<br />
personal purchases of small items such as earrings, studs and finger rings.<br />
Rural outlets. Its share tends to vary. While some indicate its share at 60 - 70%, it can often be 40% or less where more<br />
jewellery is bought for “savings” or “money” purposes.<br />
Number of marriages<br />
A broad estimate is that around 8 million marriages take place each year. The number increases annually by about 1.5%<br />
(130,000). There is no official statistic as marriages are not registered.<br />
The estimate assumes that 90% of young <strong>Indian</strong>s marry. In 2001, 18 million was the average number of men and women<br />
in each year, aged 20 - 24 (Tata Services Limited).<br />
Marriage season<br />
Most marriages take place on 40 - 60 auspicious days during the year, according to the Hindu solar or lunar calendar.<br />
The number and the dates of auspicious days change each year, and can also vary by region, State and community.<br />
In Mumbai (Maharashtra), a Hindu lunar calendar records 49 auspicious days for 2002, and 42 days for 2003. In both years,<br />
75% of the days occur in the first 6 months. There are no auspicious days in August, September or October.<br />
In Coimbatore (Tamil Nadu), a Hindu solar calendar records 62 auspicious days for 2002, 64% of the days occurring in the<br />
first 6 months. Every month has at least one auspicious day.<br />
As important “marriage seasons” can sometimes shift to different months each year, seasonality can be affected. Generally,<br />
most marriages occur intermittently over an 8 month period, November to June.<br />
Photograph: Alukkas<br />
The gold jewellery market relies heavily on purchases associated with 8 million weddings each year.<br />
AN INTRODUCTION TO THE INDIAN GOLD MARKET 117
GOLD JEWELLERY CONSUMERS<br />
WEDDING JEWELLERY<br />
An agreed amount of jewellery in grammes, or a rupee value, is normally given at the time of marriage,<br />
regardless of the prevailing gold price.<br />
The amount of new jewellery that is purchased can be influenced by several factors.<br />
Arranged marriages<br />
An arranged, as opposed to a “love”, marriage generally involves the gifting of much more jewellery. A common<br />
observation is that more than 90% of rural and 60% of urban marriages are arranged. The number of arranged marriages<br />
is expected to fall. In rural areas, the decline is likely to be gradual.<br />
Dowry<br />
Although the dowry system has been illegal since the early 1960s, the giving of jewellery and other items to the bride, groom<br />
and other family members occurs at every level.<br />
In the case of an arranged marriage, a weight or rupee value of gold jewellery is normally agreed between the families. In<br />
the south, the weight is widely expressed in terms of sovereigns (K22 coins weighing 8 g). For example, 5 sovereigns<br />
(40 g) or less at lower levels, 100 sovereigns (800 g) or more at higher levels.<br />
At higher levels, jewellery as a percentage of the total amount is reported as falling, due to the groom’s and couple’s<br />
preference for lifestyle products. A typical comment is that a percentage in urban areas of around 60% in the mid 1990s<br />
would now range between 25 - 40%. However, as the overall rupee value demanded by many grooms has increased, a<br />
substantial amount of jewellery still tends to be given.<br />
Accumulated jewellery<br />
Many families acquire wedding items over several years in order to meet their obligations at the marriage of their<br />
daughters. Some accumulate items that will eventually be converted into wedding jewellery. Some family jewellery, owned<br />
by the mother or grandmother, may also be converted, or repolished and given.<br />
Economic environment<br />
The conversion of more existing family jewellery may occur if family finances are stretched.<br />
<strong>Gold</strong> price<br />
If the gold price is considered high, more existing family jewellery may also be converted.<br />
Non-Resident <strong>Indian</strong>s (NRI’s)<br />
Millions of <strong>Indian</strong>s working in the Middle East, Europe, USA and elsewhere remit funds to their families. This enables many<br />
poorer families to boost their purchases substantially.<br />
New jewellery is normally bought 2 - 4 weeks prior to the marriage, although it may be chosen well beforehand. Retailers<br />
in both urban and rural areas observe that, as the purchase of bridal jewellery is so important, many families travel to<br />
larger cities and towns. Status is enhanced, and more designs are available.<br />
Purchases can range from a few grammes to several kilos.<br />
The chosen categories, weights and styles of individual items can vary according to regional, community and personal<br />
preferences. An appendix illustrates what might be purchased at the level of 200 g.<br />
Apart from bridal jewellery bought by the bride’s parents, other jewellery can also be bought at this time. The bride can<br />
receive items from the groom’s family, the groom from the bride’s family. Other members of both families can give or receive<br />
gifts of jewellery (or coins).<br />
OTHER GIFTS WITHIN THE FAMILY<br />
The giving of gold jewellery at important family occasions is common among those who can afford to do so.<br />
It may be given at a child’s naming ceremony, puberty, birthdays and anniversaries, and on the occasion of festivals and<br />
some auspicious days.<br />
For example, at a naming ceremony, a small bangle, hip chain, chain, pendant and anklet may be given.<br />
The main recipients are girls and women. Girls need to accumulate jewellery for their marriage. For many married women,<br />
jewellery is their only personal asset.<br />
The “other gift” market is important for most large showrooms, its share ranging from 10 - 15% and more. For most small<br />
urban and rural outlets, the gift market tends to be small.<br />
PERSONAL PURCHASES<br />
Fashion is reported as stimulating more personal purchases in large urban showrooms. Investment<br />
continues to drive many personal purchases in smaller outlets and in rural areas.<br />
Although described as “personal”, retailers observe that most purchases are the outcome of family decisions. Many fall<br />
within the category of gifts when funded by the head of the family.<br />
118<br />
AN INTRODUCTION TO THE INDIAN GOLD MARKET
GOLD JEWELLERY CONSUMERS<br />
Among large urban retailers, personal purchases range from 10 - 40% of sales, typically between 10 - 15%. Most report<br />
an increase over the past 5 years, typically by 5%.<br />
Older married women, 30 - 50 years, are reported to account for the bulk. Small items can be self-purchased by working<br />
or unmarried young women, but generally their capacity to spend is regarded as limited. For larger items, most rely on the<br />
support of their parents.<br />
In rural areas, most personal purchases appear to be for “savings” purposes. Many outlets refer spontaneously to only two<br />
categories of transaction: “weddings” and “savings”.<br />
SEASONALITY<br />
Seasonality by State, and within States, can vary greatly, but there are periods when sales are generally<br />
reported as higher: October - January (4 months) and April - May (2 months).<br />
Indicative monthly seasonality, as recorded by leading retailers in 9 States and New Delhi, suggests that in 11 of the<br />
12 months at least one area is enjoying “high” sales.<br />
Apart from factors such as the economy, the prevailing gold price and the marriage seasons, local demand can be influenced<br />
in other ways.<br />
Festivals<br />
Hundreds of festivals around the country provide an incentive to give or buy jewellery.<br />
The most widely celebrated festival is Diwali. It commemorates the Hindu New Year, occurring in October or November.<br />
Jewellery demand is also stimulated by Government departments and companies tending to pay bonuses at this time.<br />
Harvest festivals are also important. For example, Pongal (Tamil Nadu) and Onam (Kerala) in January.<br />
Some retailers include within this category “family festivals” such as the naming ceremony, as well as particularly auspicious<br />
days.<br />
Many retailers promote heavily at the time of festivals. Festival-related purchases range between 10 - 30% of the annual<br />
sales of large showrooms.<br />
Auspicious days<br />
Many consumers are stimulated to buy more jewellery, or to coincide their planned purchases with auspicious days.<br />
The number and dates can vary by State and community, and whether the Hindu lunar or solar calendar is used. Customers<br />
also have their own personal auspicious days.<br />
In Coimbatore, a solar calendar records 13 particularly auspicious days, apart from auspicious wedding days. In Mumbai, a<br />
lunar calendar records 15. There is at least one each month. None of the days coincide.<br />
Some days are regarded as especially important, notably Dhanteras (2 days before Diwali) and usually Akshayatritiya (in May).<br />
Including auspicious wedding days, retailers observe that in total there are around 100 auspicious days each year. There<br />
are also a large number of inauspicious days.<br />
A World <strong>Gold</strong> Council promotion encouraging the purchase of gold jewellery on the auspicious day of<br />
Akshayatritiya.<br />
AN INTRODUCTION TO THE INDIAN GOLD MARKET 119
GOLD JEWELLERY CONSUMERS<br />
SOCIAL CLASSES<br />
Middle class<br />
Retailers everywhere refer to the impact of economic growth on jewellery consumption during the 1990s.<br />
The National Council of Applied Economic Research (NCAER) estimates that, over the past 7 years, the number of<br />
households of the high, upper middle and middle class has increased by 66%, from 30 million to 49 million, approximately<br />
20% of the 181 million households.<br />
It expects this group to increase over the next 5 years by a further 85% to 91 million households.<br />
Although the NCAER’s income classification by class by Western standards is extremely low (and lower than that estimated<br />
by large retailers), it illustrates the growth in the size of the middle class.<br />
Most large retailers view the emerging “middle class” in both urban and rural areas as their primary target for jewellery sales.<br />
Lower middle class<br />
Retailers observe that “everyone will try to own some gold”.<br />
According to the NCAER classification, the lower middle class accounts for 72 million (40%) of the 181 million households.<br />
55 million households (76% of the lower middle class) are in rural areas. Although their capacity to buy gold each year is<br />
limited, retailers stress that they have a strong commitment to owning and giving gold when they can afford to do so.<br />
Low class<br />
The capacity of the low class to buy gold is reported in most States to be extremely limited.<br />
According to the NCAER, the low class accounts for 59 million (33%) of the 181 million households.<br />
53 million low class households (89% of all low class households) are in the rural areas. Almost all fall below the poverty<br />
line.<br />
Importance of each class to the jewellery market<br />
Trying to obtain a sense of the importance of annual purchases by class is difficult as the NCAER classification does not match<br />
the perception of most retailers.<br />
For many large retailers, for example, the “middle class” category would start at family income levels of Rs 15,000 (US$ 300)<br />
per month. This would put almost all the upper middle and middle class into the “high” class by NCAER standards (although<br />
NCAER does not take into account the impact of the underground economy).<br />
Anecdotal evidence suggests tentatively at this time the following:<br />
Nationally, around 40% (72 million households) have a limited capacity to buy much jewellery each year, unless supported<br />
by a family NRI.<br />
The top 5% (9 million households) may well account for more than 15%, but their commitment to buying extremely large<br />
quantities, compared to the past, is eroding, particularly in urban areas.<br />
The market appears to rely on around 60% (109 million households) for the bulk of annual purchases.<br />
The national breakdown would not apply to individual States, such as the wealthier States in the south and Punjab in the<br />
north.<br />
120<br />
“Wearable” gold jewellery – lighter in weight and stylish – is widely regarded as an<br />
important new market segment.<br />
AN INTRODUCTION TO THE INDIAN GOLD MARKET
GOLD JEWELLERY CONSUMERS<br />
RURAL VERSUS URBAN DEMAND<br />
The sentiment of leading retailers suggests that the urban population may account for as much as 40% of<br />
gold jewellery purchases at this time.<br />
Their estimates of urban demand in 10 States range from 40% to 65%.<br />
State Indicative % split of demand<br />
within the State<br />
Urban Rural Total<br />
population population<br />
Maharashtra 65 35 100<br />
Uttar Pradesh 60 40 100<br />
Punjab 50 50 100<br />
Rajasthan 50 50 100<br />
Gujarat 50 50 100<br />
Kerala 55 45 100<br />
Andhra Pradesh 40 60 100<br />
West Bengal 40 60 100<br />
Karnataka 40 60 100<br />
Tamil Nadu 40 60 100<br />
Range 40-65 35-60 100<br />
Source: Leading jewellery retailers in major cities.<br />
Although their indicative estimates for their States may not be accurate, large retailers generally report that urban demand<br />
(i.e. purchases by the population living and working in urban areas) became more important during the 1990s due to high<br />
industrial growth. In recent years, the agricultural sector in many States has been relatively depressed.<br />
Retailers also observe that the rural/urban split is not a static proportion. The rural population’s proportion is likely to<br />
increase in the future, especially in years when the agricultural economy is particularly strong.<br />
REGIONAL DEMAND<br />
Retailers, wholesalers and bullion dealers throughout the country report that the south is the most important<br />
gold jewellery market.<br />
Trade estimates of the south’s market share range from 35% to more than 50%.<br />
While there is consensus that the east has the lowest share, there is some disagreement over the relative size of the west<br />
and north.<br />
Anecdotal evidence suggests the following approximate split:<br />
Region Market share<br />
% Split<br />
South 40<br />
West 20-25<br />
North 20-25<br />
East 15<br />
Total 100<br />
Anecdotal evidence also indicates that the following States are particularly important within their regions.<br />
South. Tamil Nadu may account for 35%. There is little consensus about the relative size of Andhra Pradesh,<br />
Karnataka and Kerala. They are all large. The small State of Kerala is regarded as having the highest per capita<br />
consumption in the south and nationally.<br />
West. Gujarat and Maharashtra may account for 75%. Madhya Pradesh and Chhattisgarh are viewed as less important.<br />
North. Uttar Pradesh and Punjab may account for 40%. Many large consumers in the north rely on New Delhi<br />
retailers. Rajasthan and Haryana (bordering New Delhi) and the other States are considered less important.<br />
East. West Bengal may account for 40%. Bihar and Orissa are regarded as less important. The small border States in the<br />
North East (Assam and others) are considered significant.<br />
AN INTRODUCTION TO THE INDIAN GOLD MARKET 121
GOLD JEWELLERY CONSUMERS<br />
IMPORTANCE OF CITIES AS RETAIL CENTRES<br />
The sentiment of leading urban retailers underlines the importance of cities as retail centres of gold jewellery<br />
in their States.<br />
Their estimates of the market share of the major city within their State range from 25% to 35%.<br />
State Major city % of total<br />
retail sales<br />
in the State<br />
Maharashtra Greater Mumbai 35<br />
Rajasthan Jaipur 30<br />
Gujarat Ahmedabad 30<br />
Tamil Nadu Chennai 30<br />
Andhra Pradesh Hyderabad 30<br />
West Bengal Kolkata 30<br />
Karnataka Bangalore 25<br />
Kerala Cochin 25<br />
Range 25-35<br />
Source: Leading jewellery retailers in major cities.<br />
Although their estimates may be exaggerated, retailers observe that many consumers in smaller cities, towns and some<br />
villages travel to major cities when they need to buy a large quantity of jewellery. City retailers offer a wider range of<br />
designs. City purchases carry high status.<br />
TRADE OBSERVATIONS ON THE PROMOTION OF GOLD JEWELLERY<br />
The following records the sentiment of several leading retailers:<br />
Focus on marriage-related jewellery.<br />
High volume over the next 10 years will continue to rely on marriage-related purchases. There is a need to underpin this<br />
market.<br />
Parallel focus on “wearable” jewellery and self-purchases.<br />
Both categories are recognised as extremely important to achieve growth over the next 10 – 20 years. However, the extent<br />
of their promotion should be balanced against the need to support the marriage-related jewellery market.<br />
The market relies heavily on the “gifting” of jewellery.<br />
The target market is not only the female recipient but also the person who gives or pays for the jewellery. Givers and<br />
recipients both need to be motivated.<br />
The purchase of most jewellery is normally the outcome of a family decision. Reassuring the head of the household,<br />
parents and husbands is also important.<br />
Motivate the younger generation<br />
Many young people are not as committed as their parents to buying or receiving large quantities of gold jewellery.<br />
Jewellery has both an “adornment” and “investment” dimension.<br />
Retailers at every level are aware that the adornment dimension is strengthening. <strong>Gold</strong> jewellery needs to be positioned as<br />
“fashionable”. However, there is also a need to underpin gold jewellery’s “investment” dimension.<br />
Retailers observe that investment-related advantages can be emphasised credibly. Jewellery remains a “trusted and secure<br />
asset” that has risen in value over the “long term”. It is a “highly liquid asset” with a “high resale value”.<br />
122<br />
AN INTRODUCTION TO THE INDIAN GOLD MARKET
GOLD JEWELLERY CONSUMERS<br />
<strong>Gold</strong> jewellery retailers at every level stress the importance of motivating the younger generation.<br />
A World <strong>Gold</strong> Council advertisement in 2002.<br />
AN INTRODUCTION TO THE INDIAN GOLD MARKET 123
GOLD JEWELLERY CONSUMERS<br />
INDICATIVE BRIDAL AMOUNTS OF GOLD JEWELLERY - BY SOCIAL CLASS<br />
Social class Punjab Uttar Pradesh Capital<br />
Ludhiana Agra New Delhi<br />
High 4,000 g 800 g 1,200 g<br />
Upper Middle 1,000 g 400 g 800 g<br />
Middle 500 g 200 – 300 g 300 g<br />
Lower middle 100 – 200 g 100 – 200 g 120 g<br />
Low < 50 g < 50 g < 50 g<br />
Social class Rajasthan Maharashtra West Bengal<br />
Jaipur Mumbai Kolkata<br />
High 1,000 g 500 g 800 g<br />
Upper Middle 700 g 300 g 600 g<br />
Middle 400 g 150 g 300 g<br />
Lower middle 200 g 100 g 150 g<br />
Low < 50 g < 50 g < 50 g<br />
Social class Gujarat Andhra Pradesh Karnataka<br />
Ahmedabad Hyderabad Bangalore<br />
High 1,000 g 2,000 g 400 - 600 g<br />
Upper Middle 400 g 800 - 1,000 g 250 - 300 g<br />
Middle 200 – 300 g 200 – 300 g 200 g<br />
Lower middle 100 – 200 g 100 – 150 g 100 g<br />
Low < 50 g < 50 g < 50 g<br />
Social class Tamil Nadu Kerala<br />
Chennai Cochin<br />
High 2,000 g 4,000 g<br />
Upper Middle 800 g 2,500 g<br />
Middle 250 g 1,000 g<br />
Lower middle 100 g 500 g<br />
Low < 50 g < 200 g<br />
Source: Leading jewellery retailers in major cities.<br />
The amount of gold jewellery given at the time of marriage can range from a few grammes to 1,000 g and<br />
more.<br />
Although gold jewellery is normally accumulated over many years, the purchase of new jewellery for the bride, bridegroom<br />
and other family members at the time of marriage may account for as much as 50% of national gold jewellery sales each<br />
year.<br />
This table is indicative only.<br />
Retailer estimates, even in the same locality, tend to vary greatly according to their own definition of each social class and<br />
the size of their outlet.<br />
124<br />
AN INTRODUCTION TO THE INDIAN GOLD MARKET
GOLD JEWELLERY CONSUMERS<br />
INDICATIVE WEDDING SETS – AT THE 200 GRAMME LEVEL<br />
Item Punjab Uttar Pradesh Rajasthan West Bengal<br />
Ludhiana Agra Jaipur Kolkata<br />
Necklace 50 g 40 g 70 g 80 g<br />
30 g 35 g<br />
Bangle 10 g each (3 pairs) 18 g each (1 pair) 15 g each (2 pairs) 15 g each (2 pairs) or<br />
12 g each (2 pairs) 30 g each (1 pair)<br />
Chain 20 g 15 g 20 g 20 g<br />
Earrings 5 g pair 6 g pair 25 g pair 10 g pair (2 pairs)<br />
4 g pair<br />
Finger ring 5 g 4g each (3 rings) 5 g 5 g<br />
Mangalsutra* 25 g 20 g 15 g<br />
Other 20 g bracelet and<br />
7 g ring for groom<br />
Total weight 197 g 213 g 200 g 200 g<br />
Item Capital Gujarat Maharashtra Karnataka<br />
New Delhi Ahmedabad Nagpur Bangalore<br />
Necklace 50 g 50 g 50 g 40 g<br />
20 g 20 g<br />
Bangle 10 g each (2 pairs) 20 g each (1 pair) 10 g each (2 pairs) 12 g each (1 pair)<br />
12 g each (2 pairs) 4 g each (3 pairs)<br />
Chain 10 g each (3 chains) 12 g 15 g 24 g<br />
8 g 16 g<br />
Earrings 6 g - 8 g per pair (3 pairs) 10 g pair 5 g pair 12 g pair<br />
6 g pair<br />
Finger ring 4 g - 5 g (3 rings) 5 g 4 g 6 g<br />
3 g 2 g<br />
Mangalsutra* 25 g 22 g 25 g 16 g<br />
5 g pendant<br />
Other 5 g nath 2 g pendant 5 g nathi 8 g mathes<br />
5 g earchain 7 g earchain 12 g bindi<br />
5 g tikka 39 g poocha pair<br />
Total weight 200 g 207 g 200 g 200 g<br />
Item Andhra Pradesh Tamil Nadu Kerala<br />
Hyderabad Coimbatore Cochin<br />
Necklace 40 g 48 g 30 g<br />
20 g 20 g<br />
Bangle 14 g each (2 pairs) 12 g each (1 pair) 6 g - 12 g (4 pairs)<br />
10 g each (1 pair)<br />
Chain 22 g 28 g 32 g<br />
Earrings 12 g pair 4 g pair (2 pairs) 2 g - 8 g per pair (4 pairs)<br />
6 g pair<br />
Finger ring 5 g 6 g 2 g - 6 g each (5 rings)<br />
4 g 3 g<br />
Mangalsutra* 45 g 40 g 15 g<br />
6 g pendant 1 g thali<br />
Total weight 190 g 197 g 200 g<br />
Source: Leading jewellery retailers. Notes on other gold items: nath or nathi (for the nose), bindi or tikka (for the head),<br />
pocha (for the hands), mathes (for the ears). * Mangalsutra or equivalent.<br />
The bride is normally clad with as much jewellery as the family can afford.<br />
For most brides, wedding jewellery includes items that can also be worn on a daily basis.<br />
AN INTRODUCTION TO THE INDIAN GOLD MARKET 125
GOLD JEWELLERY CONSUMERS<br />
INDICATIVE MONTHLY SEASONALITY<br />
Month Punjab Uttar Pradesh Rajasthan Capital<br />
Ludhiana Agra Jaipur New Delhi<br />
January High Medium High High<br />
February High High Medium High<br />
March Medium High Medium Medium<br />
April Medium High Medium Medium<br />
May Low High Medium Low<br />
June Low Low Low Low<br />
July Low Low Low Low<br />
August Medium Low Low Medium<br />
September Medium Medium Low Medium<br />
October Medium High Low Medium<br />
November High High Medium High<br />
December High Medium High High<br />
Month Gujarat Maharashtra Andhra Pradesh Karnataka<br />
Ahmedabad Mumbai Hyderabad Bangalore<br />
January High High Medium Medium<br />
February Medium Low Medium Low<br />
March Low Low Low Low<br />
April High High High Medium<br />
May High High High High<br />
June Medium Low High High<br />
July Low Low Low High<br />
August Low Medium Medium Medium<br />
September Low Medium High Low<br />
October Medium Medium High High<br />
November High High High High<br />
December High High Low Medium<br />
Month Tamil Nadu Kerala<br />
Chennai Cochin<br />
January High High<br />
February Medium Medium<br />
March Low Medium<br />
April Medium High<br />
May High High<br />
June High Low<br />
July Low Low<br />
August Low High<br />
September Medium High<br />
October High Medium<br />
November High Medium<br />
December High High<br />
Source: Leading jewellery retailers in major cities.<br />
Seasonality by State, within States, and among retailers (even in the same cities) can vary greatly.<br />
This table indicates that jewellery demand is generally higher during 2 periods: October - January and April - May.<br />
Local seasonality each year can be influenced by the timing of wedding seasons, festivals and auspicious days, as well as<br />
by the economic environment and movement in the gold price.<br />
126<br />
AN INTRODUCTION TO THE INDIAN GOLD MARKET
LUNAR CALENDAR<br />
Mumbai (Maharashtra)<br />
2002 Auspicious days Total 2003 Auspicious days Total<br />
January - - January 15, 20, 22, 29 4<br />
February 15, 21, 22, 28 4 February 5, 6, 7, 8, 18, 19 6<br />
March 5, 6, 7 3 March 4, 5, 6, 9, 10 5<br />
April 15, 16, 17, 22, 24, 25, 26, 27, 28, 30 10 April 14, 17, 20, 21 4<br />
May 1, 8, 9, 15, 19, 20, 21, 24, 26, 27, 28 11 May 4, 11, 18, 26 4<br />
June 4, 5, 6, 15, 16, 18, 19, 20, 21, 22 10 June 6, 8, 9, 11, 14, 20, 21, 22 8<br />
July 1, 2, 3 3 July 3, 4, 6, 10 4<br />
August - - August - -<br />
September - - September - -<br />
October - - October - -<br />
November 16, 20, 21, 22, 30 5 November 20, 25, 26, 27 4<br />
December 1, 12, 13 3 December 2, 3, 9 3<br />
Total 49 Total 42<br />
Source: Panchang (Hindu Calendar <strong>Book</strong>), Mumbai<br />
GOLD JEWELLERY CONSUMERS<br />
AUSPICIOUS DAYS FOR HINDU WEDDINGS<br />
SOLAR CALENDAR<br />
Coimbatore (Tamil Nadu)<br />
2002 Auspicious days Total<br />
January 3, 7, 10, 20, 21, 27 6<br />
February 1, 3, 4, 8, 15, 17, 22, 24, 25 9<br />
March 10, 11, 24, 31 4<br />
April 4, 7, 8, 17, 24, 25, 29 7<br />
May 3, 6, 8, 9, 10, 17, 23, 24 8<br />
June 5, 6, 13, 21, 27, 30 6<br />
July 7, 8, 15 3<br />
August 26 1<br />
September 4, 8, 9, 11 4<br />
October 28, 31 2<br />
November 8, 10, 11, 15, 22, 24, 25, 29 8<br />
December 1, 2, 8, 9 4<br />
Total 62<br />
Source: Kota Jewellers, Coimbatore<br />
Most weddings take place on auspicious days according to the Hindu lunar or solar calendars.<br />
The number and dates of days change each year, and can also vary by region, State and community. Solar calendars tend<br />
to be used in the south, lunar calendars in the north.<br />
AN INTRODUCTION TO THE INDIAN GOLD MARKET 127
BRANDED JEWELLERY RETAIL CHAINS<br />
Large national chains of branded jewellery retail outlets have emerged since the mid-1990s.<br />
The section covers 5 leading national chains: Tanishq, Carbon, Gili, Inter <strong>Gold</strong> and Oyzterbay. Combined, they retail<br />
through 188 outlets in 49 cities. All have plans to expand.<br />
The chains focus on selling fashionable, lighter weight, studded jewellery as a “fashion accessory” at fixed prices.<br />
Although they account for less than 1% of the jewellery market, they anticipate significant growth as the economy<br />
develops.<br />
MAIN FEATURES<br />
The new chains operate in a way that is different from the thousands of “traditional” retailers.<br />
• Most retail jewellery at fixed prices (not at variable prices reflecting the prevailing gold price).<br />
• Most focus on selling relatively low-price items to urban women for their own personal use or as gifts.<br />
• Most stock K18 jewellery, normally studded with diamonds and other stones, and usually machine-made (not<br />
handmade).<br />
• About 50% of the outlets are small “shops-in-shops” in department stores and shopping centres, or in traditional<br />
jewellery outlets. About 50% are stand-alone stores or small shops.<br />
• Their mark-ups are generally higher. Most will exchange jewellery. Few will buy it back for cash.<br />
• All brand their companies, and the image of their jewellery, nationally.<br />
RETAIL CHAINS<br />
Gili<br />
Established in Mumbai in 1995. Owned by Gitanjali Jewels Ltd. 52 outlets are located in 20 cities. They are almost all<br />
shops-in-shops. Counters are placed in department stores (30%) and in traditional jewellery outlets (70%). Its only “Gili<br />
Shop”, an independent store, is in Cochin. It fabricates all jewellery in-house at its factory in Mumbai. The company is<br />
expanding internationally. There are 8 outlets in Dubai.<br />
Brand name: “Gili - Gitanjali Jewels”.<br />
Tanishq<br />
Established in Bangalore in 1996. Part of Titan Industries, a Tata group enterprise. 54 stores are located in 42 cities.<br />
It plans to open a total of 75 stores. Most fabrication takes place at its factory in Hosur (Tamil Nadu). Tanishq is the largest<br />
branded retail chain. Most of its plain gold jewellery is K22.<br />
Brand name: “Tanishq - Pure Jewellery, Pure Joy”.<br />
Carbon<br />
Established in Bangalore in 1996. Owned by Peakok Jewellery Private Limited. 36 “shops-in-shops” are located in 14 cities.<br />
It is planning to open stores. Most fabrication takes place in-house, mainly in Bangalore.<br />
Brand name: “Carbon - 18K Fashion Accessories”.<br />
Inter <strong>Gold</strong><br />
Established in Mumbai in 1997. 14 outlets are located in 9 cities. It operates three categories of outlet: 7 stores, 4 smaller<br />
shops and 3 “shops-in-shops”. It is planning to open 50 more outlets. It fabricates all jewellery in-house at its factory in<br />
Goa. Most designs are done in-house in collaboration with Hammer & Sohne (Germany). It is associated with India’s largest<br />
exporter of studded precious metal jewellery.<br />
Brand name: “Inter <strong>Gold</strong> - Jewellers to the World”.<br />
Oyzterbay<br />
Established in Bangalore in 2000. 32 outlets are located in 18 cities: 20 stores and smaller shops, and 12 “shops-in-shops”.<br />
Most fabrication to in-house designs takes place in Bangalore, Mumbai and Jaipur.<br />
Brand name: “Oyzterbay - Jewellery for the Living”.<br />
128<br />
AN INTRODUCTION TO THE INDIAN GOLD MARKET
BRANDED JEWELLERY RETAIL CHAINS<br />
DISTRIBUTION<br />
The number of outlets is expected to increase rapidly over the next 5 years. Not only by the featured chains,<br />
but also by other chains and new entrants.<br />
The featured chains have, to date, established 86 jewellery stores and small shops, and 102 “shops-in-shops”.<br />
Company Stores and<br />
smaller shops<br />
Shops-in-shops Total<br />
Tanishq 54 - 54<br />
Gili 1 51 52<br />
Carbon - 36 36<br />
Oyzterbay 20 12 32<br />
Inter <strong>Gold</strong> 11 3 14<br />
Total 86 102 188<br />
Including non-featured chains, the total number of outlets is likely to exceed 250 nationwide.<br />
The retail chains mount extensive advertising campaigns to brand their outlets nationally.<br />
AN INTRODUCTION TO THE INDIAN GOLD MARKET 129
BRANDED JEWELLERY RETAIL CHAINS<br />
PRODUCTS AND CONSUMERS<br />
“Wearable” and “fashionable” jewellery<br />
Generally, the retail chains are encouraging urban women, especially younger women, to acquire lighter weight,<br />
inexpensive, lifestyle jewellery that is “wearable”. It can be used every day. It can be worn on many occasions within the<br />
home, at work or socially. It can be bought on impulse. In most outlets, it can easily be exchanged to accommodate the<br />
latest “fashionable” trend. Innovation is their hallmark. New collections tend to be launched every few months.<br />
Studded jewellery<br />
The chains focus on higher value added studded jewellery. None sell hallmarked jewellery. Some sell no plain gold<br />
jewellery. Most items (Tanishq is an exception) tend to contain less than 10 g of gold.<br />
Fixed prices<br />
Unlike traditional retailers, the chains sell jewellery at fixed prices, although prices can be adjusted across the board to reflect<br />
significant gold price movements. One reason for fixed prices is that store managers are now employees (not trusted<br />
family members), and to offer jewellery at fluctuating prices through so many outlets is considered an unmanageable task.<br />
Most items are priced below Rs 10,000 (US$ 200). They observe that many potential customers are resistant to fixed prices<br />
for larger items.<br />
Promotion<br />
All chains brand their outlets and jewellery through extensive TV and press advertising campaigns.<br />
Perspective<br />
The retail chains are at an experimental stage. Some are aware that they may need to include innovative plain gold<br />
jewellery, or increase its proportion, within their product range.<br />
ADDENDUM ON FABMART – INTERNET RETAILER<br />
Fabmart was established in Bangalore (Karnataka) as a private company in 1999. A major shareholder is Reliance Industries,<br />
India’s largest private sector company. Fabmart retails music, books, toys, computers, videos, watches, coins, jewellery and<br />
other items through its website.<br />
When an order for jewellery is received, it is forwarded to one of 20 leading jewellery suppliers in 6 major cities. Pricing is<br />
fixed on the day of the order. Most orders are less than Rs 10,000. Fabmart normally delivers the item by courier within<br />
7 days. All jewellery is hallmarked. There is a 30 day money-back guarantee.<br />
While <strong>Indian</strong> residents account for the bulk of its jewellery business, Fabmart also services international customers. They<br />
either take delivery overseas, or request that the purchase be sent to relatives or friends within India.<br />
130<br />
Tanishq, the largest retail chain, has outlets in 42 cities.<br />
AN INTRODUCTION TO THE INDIAN GOLD MARKET
Region/State Gili Tanishq Carbon Inter <strong>Gold</strong> Oyzterbay<br />
NORTH<br />
Uttar Pradesh Noida Noida<br />
Kanpur Kanpur<br />
Agra<br />
Meerut<br />
Lucknow<br />
Varanasi<br />
Rajasthan Jaipur Jaipur Jaipur<br />
Punjab Ludhiana Ludhiana Ludhiana<br />
Amritsar<br />
Jalandhar Jalandhar<br />
Haryana Gurgaon<br />
Jammu & Kashmir Jammu Jammu<br />
Srinagar<br />
Himachal Pradesh<br />
Uttaranchal<br />
Delhi New Delhi New Delhi New Delhi New Delhi New Delhi<br />
Chandigarh (UT) Chandigarh Chandigarh Chandigarh Chandigarh<br />
WEST<br />
Maharashtra Mumbai Mumbai Mumbai Mumbai Mumbai<br />
Pune Pune Pune Pune<br />
Nagpur Nagpur<br />
Nasik<br />
Gujarat Ahmedabad Ahmedabad Ahmedabad Ahmedabad Ahmedabad<br />
Surat Surat<br />
Anand<br />
Baroda<br />
Jamnagar<br />
Madhya Pradesh Indore Indore Indore<br />
Chhattisgarh Raipur<br />
Goa Panjim-Goa Goa<br />
EAST<br />
West Bengal Kolkata Kolkata Kolkata Kolkata Kolkata<br />
Bihar Patna<br />
Orissa Bhubaneshwar Bhubaneshwar<br />
Jharkand Ranchi<br />
Assam Guwahati Guwahati Guwahati<br />
SOUTH<br />
Andhra Pradesh Hyderabad Hyderabad Hyderabad Hyderabad<br />
Vijayawada<br />
Vizag Vizag<br />
Tamil Nadu Chennai Chennai Chennai Chennai<br />
Coimbatore Coimbatore<br />
Salem Salem<br />
Hosur<br />
Madurai<br />
Tuticorn<br />
Trichy<br />
Karnataka Bangalore Bangalore Bangalore Bangalore<br />
Mangalore Mangalore<br />
Hubli<br />
Kerala Calicut Calicut<br />
Cochin Cochin Cochin<br />
Trivandrum<br />
Pondicherry (UT) Pondicherry Pondicherry<br />
TOTALS<br />
BRANDED JEWELLERY RETAIL CHAINS<br />
Cities covered 20 42 16 9 18<br />
Retail outlets 52 54 36 14 32<br />
Source: Individual companies. Gili outlets as recorded on its website.<br />
LOCATION OF OUTLETS<br />
The 5 featured retail chains currently sell jewellery through 188 outlets in 48 cities in 22 States and UT’s.<br />
AN INTRODUCTION TO THE INDIAN GOLD MARKET 131
HALLMARKING<br />
The Bureau of <strong>Indian</strong> Standards (BIS), the national standards body of India, launched its long-term<br />
scheme to encourage the voluntary hallmarking of gold jewellery in April 2000.<br />
Known as the BIS Certification Scheme for Hallmarking of <strong>Gold</strong> Jewellery, the scheme is supported by the Reserve Bank<br />
of India.<br />
It has 4 declared objectives:<br />
• Protect the consumer against irregular gold quality.<br />
• Support the export of gold jewellery.<br />
• Develop gold-based financial products to assist in mobilising dormant gold reserves in private hands.<br />
• Develop India as a reliable gold market centre commensurate with its status as the world’s largest national gold<br />
market.<br />
In early 2002, 12 Assaying and Hallmarking Centres had been authorised to service 275 Certified Jewellers.<br />
BACKGROUND<br />
Established in 1986, BIS falls under the administrative control of the Department of Consumer Affairs within<br />
the Ministry of Consumer Affairs, Food and Public Distribution. Its headquarters is in New Delhi, with regional<br />
offices in Mumbai, Kolkata, Chandigarh and Chennai, supported by branch offices in 17 other cities.<br />
The BIS scheme involves the authorisation of independent entities to act as Assaying and Hallmarking Centres, and the<br />
certification of jewellers (Certified Jewellers) to use the centres for hallmarking purposes.<br />
In the first 18 months, BIS has authorised 12 centres (in 9 cities) and certified 275 jewellers. Although most Certified<br />
Jewellers are retailers, fabricators and wholesalers can also be appointed.<br />
Plain gold jewellery has been hallmarked since June 2000, and gold jewellery incorporating diamonds since September 2001.<br />
The scheme is voluntary, and there is no obligation on Certified Jewellers to hallmark all the gold jewellery that they retail,<br />
fabricate or wholesale.<br />
As BIS receives no government subsidy, the hallmarking scheme (like all other BIS schemes) is obliged to operate as a<br />
business in order to cover its technical, administrative and promotional costs. Income is derived from charges levied on<br />
Hallmarking Centres, Certified Jewellers and each item of jewellery hallmarked.<br />
The hallmarking scheme is in line with the International Convention on the Control and Marking of Articles of Precious Metals<br />
(Vienna Convention). BIS expects that India will in due course become a member of the Vienna Convention so that articles<br />
hallmarked in India can be imported into member countries without further testing or marking.<br />
HALLMARKING CENTRES<br />
Hallmarking Centres are obliged to have a legal identity and an independent status. They may not be linked to<br />
any jewellery manufacturer or retailer, although they can be set up by a Jewellers’ Association provided that no office<br />
bearer is involved in day to day activities.<br />
BIS specifies rigorous procedures for the receipt, sampling, assaying and hallmarking of jewellery as laid down in IS (<strong>Indian</strong><br />
Standard) 1417 (fineness and marking), IS 1418 (assaying methods) and ISO 9002 (receipt, sampling and hallmarking).<br />
Hallmarking Centres are audited at least twice annually by trained BIS assessors.<br />
A batch of jewellery is initially assayed for homogeneity using a touchstone. A minimum of 10% of the items is then scraped,<br />
cut or drilled to provide a composite sample for testing by fire assay or spectrometric assay. Hallmarks are applied by punch<br />
or laser. The centre is required to complete its assaying and hallmarking procedures within 48 hours of the receipt of the items.<br />
CERTIFIED JEWELLERS<br />
Jewellers are only certified if they adopt a system of quality management approved by BIS. Prior to its arrival<br />
at a Hallmarking Centre, each batch of jewellery items must also be checked for homogeneity and assayed in-house, and<br />
the caratage specified.<br />
BIS Certified Jewellers are required to display their BIS Licence Number. Hallmarked jewellery should be clearly<br />
differentiated from non-hallmarked jewellery in a separate showcase, or with a tag or label. Display materials should<br />
illustrate and define the components of hallmarks, as well as record the millesimal fineness of authorised caratages.<br />
A magnifying glass to enable customers to see the hallmarks should also be available.<br />
132<br />
AN INTRODUCTION TO THE INDIAN GOLD MARKET
HALLMARKS<br />
In accordance with BIS procedures, hallmarking is normally applied to all parts of the item that can easily be<br />
detached or replaced. An exception is made for bangles and light items - hallmarking need only be applied once. The<br />
height of the marks are either 0.5 mm or 1.00 mm.<br />
A hallmark comprises 5 compulsory symbols, illustrating the following:<br />
• BIS mark<br />
• Fineness<br />
• Assaying and Hallmarking Centre mark<br />
• Year of marking<br />
• Jeweller’s mark<br />
Fineness<br />
There are 6 defined levels of millesimal purity:<br />
958 Corresponding to 23 carat<br />
916 Corresponding to 22 carat<br />
875 Corresponding to 21 carat<br />
750 Corresponding to 18 carat<br />
585 Corresponding to 14 carat<br />
375 Corresponding to 9 carat<br />
Year of marking<br />
A letter of the alphabet, as designated by BIS, indicates the year in which the item was hallmarked.<br />
A 2000<br />
B 2001<br />
C 2002<br />
PRICING<br />
BIS<br />
To recover its costs, BIS charges are currently as follows:<br />
HALLMARKING<br />
Hallmarking Centres pay a certification fee of Rs 40,000 that covers a 3 year period. They also pay a 10 % commission on<br />
all assaying and hallmarking charges incurred by Certified Jewellers.<br />
Certified Jewellers pay an annual certification fee of Rs 25,800.<br />
Hallmarking Centres<br />
Assaying and hallmarking charges are at the discretion of the Hallmarking Centre. They are usually based on the item’s<br />
weight. For example:<br />
Below 20 g Rs 50 per item<br />
Above 20 g Rs 75 per item<br />
The headquarters of the Bureau of <strong>Indian</strong> Standards is in New Delhi.<br />
AN INTRODUCTION TO THE INDIAN GOLD MARKET 133
State City Assaying and Hallmarking Centre Start date<br />
NORTH<br />
Delhi New Delhi Micro Assaying & Hallmarking Centre 2000 May<br />
New Delhi MMTC Limited 2000 June<br />
New Delhi Jalan Hallmarking Centre 2001 August<br />
WEST<br />
Maharashtra Mumbai Geekay Exim (India) Ltd 2000 September<br />
Mumbai Jewel Metallochem 2001 May<br />
Gujarat Ahmedabad Gujarat <strong>Gold</strong> Centre 2000 July<br />
EAST<br />
West Bengal Kolkata JJ Hallmarking Centre 2001 November<br />
SOUTH<br />
Andhra Pradesh Hyderabad Vimta Labs 2000 July<br />
Tamil Nadu Chennai Bharat Assayer 2001 December<br />
Coimbatore Emerald Testings Pvt Ltd 2000 December<br />
Kerala Cochin Chemmanur <strong>Gold</strong> Refinery 2000 April<br />
Calicut Calicut Assay & Hallmarking 2000 April<br />
Source: Bureau of <strong>Indian</strong> Standards<br />
134<br />
HALLMARKING<br />
LOCATION OF HALLMARKING CENTRES<br />
The voluntary hallmarking of gold jewellery is supervised by the Bureau of <strong>Indian</strong> Standards.<br />
AN INTRODUCTION TO THE INDIAN GOLD MARKET
HALLMARKING<br />
Most jewellery in the World <strong>Gold</strong> Council’s “Collection g” programme is hallmarked.<br />
AN INTRODUCTION TO THE INDIAN GOLD MARKET 135
GOLD JEWELLERY EXPORTS<br />
According to The Gem & Jewellery Export Promotion Council (GJEPC), around 800 enterprises<br />
fabricate plain or studded gold jewellery for export.<br />
Over the past 4 years, their duty-free import of gold has increased from 35 tonnes to 54 tonnes.<br />
<strong>Gold</strong> jewellery exports have surged over the past 10 years, from US$ 304 million in 1991-92 to US$ 1.2 billion in<br />
2001-02.<br />
Over the same period, value addition above the cost of gold used has grown from 24% to 51%, rising from US$ 73<br />
million to US$ 594 million.<br />
The jewellery export industry receives much government support through the GJEPC, which falls under the<br />
administrative control of the Ministry of Commerce and Industry.<br />
EXPORT FABRICATION LOCATIONS<br />
<strong>Gold</strong> jewellery for export is fabricated in 4 categories of location.<br />
Fabricators in SEEPZ (Mumbai) and in the Domestic Tariff Areas account for almost all gold jewellery exports.<br />
Special Economic Zones (SEZ)<br />
Isolated, demarcated manufacturing zones dedicated to exports. A new category, effective from April 2000.<br />
SEEPZ (Mumbai), converted to SEZ status in 2000, dominates the gold jewellery export industry. Its 72 large units<br />
(expected to increase to 120 by 2003) fabricate 44% of the value of India’s gold jewellery exports.<br />
Export Processing Zones (EPZ)<br />
Smaller, isolated, demarcated manufacturing zones dedicated to exports. MEPZ (Chennai) and NOIDA EPZ (near New Delhi)<br />
fall into this category, but their gold jewellery output is low.<br />
Export Orientated Units (EOU)<br />
These units can be located anywhere. A Customs officer is also obliged to be in attendance 24 hours daily to monitor all<br />
materials brought into and out of each unit.<br />
Domestic Tariff Areas (DTA)<br />
Defined as any location falling outside a demarcated zone. Fabricators in DTA’s account for 52% of the value of gold<br />
jewellery exports.<br />
EXPORT MARKETS<br />
3 countries account for 85% of the value of India’s gold jewellery exports: USA (55%), United Arab Emirates<br />
(20%) and the United Kingdom (10%).<br />
Export growth over the past 10 years has relied largely on the USA market, sales having increased from less than US$ 100<br />
million in 1991-92 to US$ 647 million in 2001-02.<br />
PRODUCTS<br />
Almost all gold jewellery fabricated in the export zones is studded, mainly with diamonds.<br />
Although SEEPZ (Mumbai) accounts for 44% of the value of gold jewellery exports, its 72 units are reported to produce<br />
studded gold jewellery only.<br />
However, fabricators in the DTA’s, accounting for 52% of the value of gold jewellery exports, are reported to produce a<br />
substantial amount of plain gold jewellery.<br />
Most export products are fabricated to meet the precise requirements of overseas customers. Although many customers<br />
provide detailed drawings, most fabricators have in-house designers as well.<br />
136<br />
AN INTRODUCTION TO THE INDIAN GOLD MARKET
SOURCES OF GOLD BULLION<br />
Jewellery exporters can obtain gold bars duty-free from nominated agencies.<br />
Conditions apply as specified in the Government’s EXIM (Export/Import) Policy. A “nominated agency” is either a Public<br />
Sector Undertaking (PSU) such as MMTC, or a bank authorised by the Reserve Bank of India.<br />
Export against supply by foreign buyer<br />
<strong>Bars</strong> can be obtained either directly or through a nominated agency.<br />
Export against supply by nominated agencies<br />
<strong>Bars</strong> can be obtained in advance or as replenishment after export. This method is widely used in export zones.<br />
Export against Advance Licence<br />
A licence to obtain bars, as well as mountings, sockets, frames and findings, to a specified amount of gold in advance of an<br />
order. It carries an obligation to re-export the gold in a value added fabricated form.<br />
Replenishment Scheme<br />
<strong>Bars</strong> can be obtained from a nominated agency based on a percentage of the documented FOB value of the jewellery<br />
exported. Since April 2002, it is now no longer necessary to obtain a replenishment licence.<br />
Source Kilogrammes<br />
1998 - 1999 1999 - 2000 2000 – 2001 2001 - 2002<br />
MMTC 22,920 22,460 16,621 14,100<br />
ABN AMRO Bank 1,826 8,610 10,551 5,125<br />
State Bank of India 8,965 6,910 7,301 4,783<br />
Bank of Nova Scotia 505 6,710 16,349 25,169<br />
Bank of India 497 3,676 3,429 4,067<br />
Corporation Bank 111 256 174 1,021<br />
Total 34,824 48,624 54,425 54,265<br />
Source: GJEPC<br />
GOLD JEWELLERY EXPORTS<br />
GOLD BULLION SUPPLIED TO JEWELLERY EXPORTERS<br />
Jewellery export fabricators now annually absorb more than 50 tonnes of duty-free gold bullion imports.<br />
Photograph: Inter Classik<br />
Around 15,000 artisans fabricate jewellery in SEEPZ (Mumbai).<br />
AN INTRODUCTION TO THE INDIAN GOLD MARKET 137
Country US dollars in millions % split<br />
1991 1992 1993 1994 1995 1996 1997 1998 1999 2000 2001 in 2001<br />
- 1992 - 1993 - 1994 - 1995 - 1996 - 1997 - 1998 - 1999 - 2000 - 2001 - 2002<br />
USA 54.3 54.8 65.4 82.0 86.2 107.0 156.4 436.6 600.9 646.2 647.0 55<br />
UAE 120.3 72.8 95.5 96.2 105.7 154.6 150.4 239.1 170.6 230.1 234.0 20<br />
UK 38.5 31.9 31.5 47.3 65.2 83.1 89.2 80.3 100.5 102.1 111.2 10<br />
Singapore 6.6 8.6 20.4 13.7 21.0 20.1 23.5 19.8 30.9 39.6 45.0 4<br />
Hong Kong 3.2 4.1 6.6 22.8 22.6 23.8 21.3 44.0 36.5 37.6 13.0 1<br />
Kuwait 4.2 7.4 11.3 21.2 12.6 20.6 21.6 21.6 11.2 13.3 12.8 1<br />
Germany * * * * * 5.1 4.5 25.5 29.6 19.5 12.0 1<br />
Belgium * * * * * 1.6 1.7 10.3 28.1 * * *<br />
Bahrain * * * * * 3.2 6.5 12.2 5.8 * * *<br />
Others 12.0 12.7 15.4 20.6 33.6 38.0 35.9 63.8 87.9 69.9 91.8 8<br />
Gross 239.1 192.3 246.1 303.7 346.8 457.3 510.9 853.1 1,102.0 1,168.8 1,166.8 100<br />
exports<br />
Returned - 1.3 - 1.0 - 1.5 - 2.0 - 5.4 - 7.5 - 10.6 - 6.9 - 14.6 - 18.9 n.a. n.a.<br />
items<br />
Net exports 237.8 191.4 244.6 301.7 341.4 449.8 500.4 846.2 1,087.4 1,149.9 n.a. n.a.<br />
Add SEEPZ 66.5 94.6 122.8 184.1 227.7 297.9 339.1 # # # # #<br />
Grand 304.3 286.1 367.4 485.8 569.2 747.7 839.5 846.2 1,087.4 1,149.9 n.a. n.a.<br />
Total<br />
Source: GJEPC. * Exports included in “Others”. # Countrywise destination of gold jewellery exported from SEEPZ (Mumbai) is only included from<br />
!998 - 1999.<br />
The USA is India’s most important export market. It now absorbs 55% of the value of gold jewellery exports.<br />
Category US dollars in millions<br />
1991 1992 1993 1994 1995 1996 1997 1998 1999 2000 2001<br />
- 1992 - 1993 - 1994 - 1995 - 1996 - 1997 - 1998 - 1999 - 2000 - 2001 - 2002<br />
<strong>Gold</strong> jewellery 304.3<br />
exports<br />
286.0 367.4 485.8 569.2 747.7 839.5 846.2 1,087.4 1,149.9 1,166.8<br />
<strong>Gold</strong> bar<br />
imports<br />
231.6 162.9 350.4 373.6 347.9 409.6 284.3 394.8 438.8 497.1 573.22<br />
Value<br />
addition<br />
72.7 123.1 16.9 112.2 221.3 338.2 555.2 451.4 648.6 652.8 593.6<br />
% Value<br />
addition<br />
24 43 10 23 39 45 66 53 60 57 51<br />
Source: GJEPC<br />
GOLD JEWELLERY EXPORTS<br />
GOLD JEWELLERY EXPORTS TO MAJOR MARKETS<br />
VALUE ADDITION - GOLD JEWELLERY EXPORTS VERSUS GOLD BULLION USAGE<br />
Value addition on gold jewellery exports has grown from US$ 73 million in 1991-92 to more than US$ 600<br />
million in recent years.<br />
138<br />
AN INTRODUCTION TO THE INDIAN GOLD MARKET
Location US dollars in millions % Split<br />
1991 1992 1993 1994 1995 1996 1997 1998 1999 2000 in 2000<br />
- 1992 - 1993 - 1994 - 1995 - 1996 - 1997 - 1998 - 1999 - 2000 - 2001<br />
EPZ & EOU<br />
Jhandewalan 11.4 6.8 3.2 n.a. n.a n.a. 3.1 n.a. n.a. n.a. -<br />
SEEPZ 64.8 94.6 122.8 184.1 227.7 297.9 339.1 406.2 525.3 507.7 44<br />
MEPZ n.a. 1.4 1.1 0.5 1.0 1.0 0.7 1.6 2.4 2.5 -<br />
NODIA – EPZ 3.2 17.9 20.5 39.4 43.5 42.6 n.a. 28.7 30.0 40.6 4<br />
Sub- total 79.4 120.7 147.5 224.0 272.2 341.6 342.9 436.5 557.8 550.6 48<br />
DTA 224.8 165.2 219.8 261.8 297.0 406.2 496.6 409.7 529.6 599.4 52<br />
Total exports 304.3 286.1 367.4 485.8 569.2 747.7 839.5 846.2 1,087.4 1,149.9 100<br />
Zone % total 26 42 40 46 48 46 41 52 51 48 48<br />
Source: GJEPC.<br />
GOLD JEWELLERY EXPORTS<br />
LOCATION OF GOLD JEWELLERY EXPORT FABRICATION<br />
According to the GJEPC, 44% (US$ 508 million) of the value of India’s gold jewellery exports was fabricated<br />
in SEEPZ (Mumbai) in 2000 - 2001.<br />
Photograph: Inter Classik<br />
Inter Classik Jewellery is one of 72 large fabrication units in SEEPZ (Mumbai).<br />
In 1990, there were only 10 units.<br />
AN INTRODUCTION TO THE INDIAN GOLD MARKET 139
The GJEPC, established in 1966, has its headquarters in Mumbai.<br />
It has 5 regional offices located in New Delhi (since 1976), Jaipur (1980), Chennai (1985), Surat (1987) and Kolkata (1999).<br />
Supervised by the Ministry of Commerce and Industry and elected industry representatives, its membership comprises 6,800<br />
registered exporters, the bulk located in Mumbai (61%) and Jaipur (15%). Although most focus on the cutting and<br />
polishing of diamonds and gems, about 800 are involved in the fabrication of gold jewellery.<br />
The GJEPC (80 employees) provides a wealth of services to its members, including the following:<br />
Jewellery Product Development Centres (JPDC)<br />
Established in Mumbai in 1985, and subsequently in New Delhi (1986) and Jaipur (1998), the centres conduct seminars and<br />
training courses, from one day up to a year in duration.<br />
Sardar Patel Centre of Jewellery Design and Manufacture<br />
Located at the <strong>Indian</strong> Diamond Institute (IDI) in Surat, the centre offers a 3 year course in jewellery design and<br />
manufacture.<br />
India International Jewellery Show (IIJS)<br />
India’s most important jewellery trade fair has been held annually since 1973, normally in Mumbai. The IIJS in 2001 had<br />
140 exhibitors, 150 overseas visitors from 29 countries, and 3,000 domestic visitors.<br />
International Exhibitions<br />
The GJEPC co-ordinates the participation of jewellery exporters at international gold jewellery fairs, notably in Singapore,<br />
Abu Dhabi, Bahrain, Germany (Munich), Switzerland (Basel), USA (New York) and Chile (Santiago).<br />
GJEPC MEMBERSHIP AND REGISTRATION<br />
GJEPC estimates that 800 (12%) of its 6,680 registered diamond, gem and gold jewellery exporters fabricate<br />
plain or studded gold jewellery.<br />
Fabricators in the west (including Gujarat) account for 65% of GJEPC membership, while fabricators in the north (including<br />
Jaipur) account for 27%.<br />
140<br />
Category 1999 -2000 2000 - 2001 2000 - 2001<br />
Number Number % Split<br />
GJEPC members 7,001 6,930 -<br />
Registered exporters 6,792 6,680 -<br />
Membership breakdown<br />
Mumbai (Western region) 4,240 4,253 61<br />
Gujarat 269 294 4<br />
Delhi (Northern region) 834 858 12<br />
Jaipur 1,158 1,009 15<br />
Chennai (Southern region) 398 413 6<br />
Kolkata (Eastern region) 102 103 1<br />
Total 7,001 6,930 100<br />
Source: GJEPC<br />
GOLD JEWELLERY EXPORTS<br />
THE GEM & JEWELLERY EXPORT PROMOTION COUNCIL<br />
AN INTRODUCTION TO THE INDIAN GOLD MARKET
Plain gold jewellery Location US$ millions<br />
Modern Impex Mumbai 30.3<br />
P.P. Jewellers New Delhi 26.8<br />
Rajesh Exports Bangalore 23.1<br />
Studded gold jewellery Location US$ millions<br />
Merrygold Jewellers Mumbai 11.2<br />
Vaibhav Gems Jaipur 3.5<br />
Source: GJEPC Annual Awards<br />
GOLD JEWELLERY EXPORTS<br />
GOLD JEWELLERY EXPORTERS - GJEPC AWARD WINNERS IN 2000 - 2001<br />
Some fabricators in Mumbai, New Delhi and Bangalore export more than US$ 20 million of plain gold<br />
jewellery annually.<br />
AGR<br />
Australia<br />
Harmony<br />
South Africa<br />
Johnson Matthey<br />
United Kingdom<br />
KILOBARS<br />
Rand Refinery*<br />
South Africa<br />
*Actual size<br />
Argor-Heraeus<br />
Switzerland<br />
Valcambi<br />
Switzerland<br />
Pamp<br />
Switzerland<br />
Many exporters use kilobars, normally at 995 purity, for the fabrication of gold jewellery.<br />
AN INTRODUCTION TO THE INDIAN GOLD MARKET 141
142<br />
<strong>Gold</strong> plating<br />
Zari thread<br />
Ayurvedic medicines<br />
CONTENTS<br />
Indicative industrial gold usage 1990 – 2001<br />
Appendix<br />
Imitation gold jewellery<br />
CHAPTER 6<br />
INDUSTRIAL GOLD USAGE<br />
A retailer of silver and imitation gold jewellery in Kosi Kalan (Uttar Pradesh).<br />
There are thousands of similar outlets serving the low income populations in rural and urban areas.<br />
AN INTRODUCTION TO THE INDIAN GOLD MARKET
INDUSTRIAL GOLD USAGE<br />
Since the repeal of the <strong>Gold</strong> (Control) Act, industrial gold usage is reported to have grown to more than<br />
40 tonnes, due mainly to a surge in the fabrication of gold plating products and the widespread use of<br />
gold for plating purposes.<br />
There are 3 important categories:<br />
• <strong>Gold</strong> plating<br />
• Zari thread<br />
• Ayurvedic medicines<br />
Monitoring industrial gold usage in India, where the market is so fragmented, is no easy task. The statistics rely on the<br />
indicative estimates of Madhusudan Daga.<br />
GOLD PLATING<br />
The gold plating of silver and other metals and materials is a “cottage industry” throughout India.<br />
The category includes the use of gold for plating cutlery, dinner sets, tea sets, plates, bowls, tumblers, trays and other<br />
utensils, as well as gold plated decorative ornaments, watch cases and straps, inkpots and pens, optical frames, mirrors and<br />
glass. It also includes electroplated gold items and imitation gold jewellery.<br />
The fabrication of imitation gold jewellery has grown significantly. Increased consumer demand is attributed to its low price<br />
(relative to real gold), improved product quality, new fashionable designs and rising levels of crime in major cities.<br />
ZARI THREAD<br />
India is renowned for its decorative golden Zari thread.<br />
It can be woven into materials for sarees, suits, sashes, blouses, ceremonial cloths and many other embroidered items. The<br />
craft has been practised for thousands of years. Zari is a Hindu word for a metallic thread.<br />
Most Zari thread and materials are made by hand in west and north India:<br />
Gujarat Surat<br />
Uttar Pradesh Bareilly, Varanasi, Agra<br />
Rajasthan Jaipur, Barmer<br />
Surat is the most important fabrication centre.<br />
The most important export markets for Zari products are the USA (accounting for 20% of exports), UK (17%) and Japan<br />
(10%).<br />
AYURVEDIC MEDICINES<br />
Although gold is incorporated in less than 1% of ayurvedic medicines consumed, around 5 tonnes of gold is<br />
now reported to be swallowed in tablet or powder form each year by millions of <strong>Indian</strong>s.<br />
About 50% of gold consumption is for ‘rejuvenation’ purposes, especially during the winter months. There are more than<br />
20 commonly used ‘rejuvenation’ brands. For example, Brihat Vatchintamani Ras, Vasant Kusumar Ras and Suvarna Malini<br />
Vasant.<br />
A typical daily dose would include 1 – 2 mg of gold within a mixture of herbs.<br />
<strong>Gold</strong> is also widely used for the treatment of many illnesses, including rheumatoid arthritis, osteoarthritis, tuberculosis,<br />
schizophrenia, epilepsy, colitis, heart disease, neurological disorders, malabsorption syndromes and complications<br />
associated with diabetes.<br />
Traditional ayurvedic medicines, known for more than 3,000 years, are recorded in 3 classical treatises: Charak, Sushrut and<br />
Vaghbhatta. The term incorporates the Sanskrit words ‘ayu’ (life) and ‘veda’ (knowledge). The widespread use of gold dates<br />
back to around 600 AD when a chemist, Nagarjuna, pioneered the medical use of metals and minerals.<br />
AN INTRODUCTION TO THE INDIAN GOLD MARKET 143
INDUSTRIAL GOLD USAGE<br />
INDICATIVE INDUSTRIAL GOLD USAGE 1990 – 2001<br />
Category Tonnes<br />
1990 1991 1992 1993 1994 1995 1996 1997 1998 1999 2000 2001<br />
Decorative<br />
- <strong>Gold</strong> plating 0.7 2.0 3.0 4.5 4.0 3.5 3.5 4.0 5.0 15.0 18.0 30.0<br />
- Zari crafts 0.4 1.5 2.0 12.0 12.0 10.0 12.0 10.0 9.0 8.0 8.0 6.0<br />
- Foils - - - 0.2 0.3 0.5 0.5 0.5 1.0 1.0 1.0 1.0<br />
Sub- total 1.1 3.5 5.0 16.7 16.3 14.0 16.0 14.5 15.0 24.0 27.0 37.0<br />
Medical 0.2 0.2 0.3 1.0 1.0 2.0 2.0 2.0 2.0 3.0 4.0 5.0<br />
Electronic 0.2 0.5 0.5 1.0 1.0 1.0 1.0 1.0 1.2 1.2 1.0 1.0<br />
Total 1.5 4.2 5.8 18.7 18.3 17.0 19.0 17.5 18.2 28.2 32.0 43.0<br />
Sources: 1990: <strong>Gold</strong> (Control) Act statistics. 1991-2001: Based on statistics compiled by Madhusudan Daga.<br />
<strong>Gold</strong> plating (70%), Zari crafts (14%) and ayurvedic medicines (12%) account for the bulk of industrial gold<br />
usage.<br />
144<br />
Source: http://travel.indiamart.com<br />
Zari crafts are reported to have absorbed 6 tonnes of gold in 2001.<br />
AN INTRODUCTION TO THE INDIAN GOLD MARKET
INDUSTRIAL GOLD USAGE<br />
IMITATION GOLD JEWELLERY<br />
Imitation gold jewellery is fabricated and sold in cities, towns and many villages throughout India.<br />
It is made in copper, brass, silver or other materials and then gold-plated. Most items contain 1 g or less of fine gold.<br />
While lower income families account for the bulk of fabrication nationwide, retailers in Mumbai observe that imitation<br />
jewellery is now being used by young and older consumers across all social classes.<br />
In Mumbai, the number of imitation jewellery outlets is reported to have grown over the past 5 years from less than 50 to<br />
more than 200. Informal trade estimates suggest that the number of fabricators may exceed 20,000 (including unemployed<br />
goldsmiths), as Mumbai’s output is also distributed nationally.<br />
An imitation gold chain can be bought for as little as Rs 600 (US$ 12), a bangle for Rs 700 (US$ 14) and a necklace for<br />
Rs 1,000 (US$ 20).<br />
A retailer of high quality imitation gold jewellery in Mumbai.<br />
Ayurvedic medicines containing gold are widely used for rejuvenation and the treatment of many illnesses.<br />
AN INTRODUCTION TO THE INDIAN GOLD MARKET 145
146<br />
Annual 1970 - 2001<br />
Monthly 1997 - 2001<br />
Annual 1925 - 1969<br />
CHAPTER 7<br />
MUMBAI GOLD PRICES<br />
CONTENTS<br />
The Bombay Bullion Association was established in 1948.<br />
The Mumbai gold price per 10 g grew from Rs 184 in 1970 to an annual average of Rs 4,462 in 2001.<br />
AN INTRODUCTION TO THE INDIAN GOLD MARKET
MUMBAI GOLD PRICES<br />
<strong>Indian</strong> gold prices are normally expressed in rupees per 10 g at 995 purity, or per 10 tola at 999 purity.<br />
Over the past 10 years, the difference between the Mumbai and London gold price has steadily narrowed.<br />
In 1990, the Mumbai premium averaged 56%. In 2001, it averaged 9%.<br />
MUMBAI<br />
The prevailing price of standard gold in Mumbai is widely accepted as a national benchmark.<br />
The Mumbai price reflects the international US dollar price, the rupee exchange rate with the US dollar (the official, as well<br />
as the unofficial cash and hawala rates), and the level of local gold supply and demand. It also takes into account bar import<br />
costs (including Customs duty), and applicable State sales and other taxes in Mumbai.<br />
The standard gold price in other cities and towns can be slightly higher or lower than the Mumbai price, dependent on local<br />
rupee exchange rates, State and municipal taxes, bar transportation costs, and their own level of local gold supply and<br />
demand.<br />
The relevant standard gold price then determines the local price of 10 tola bars, and the local price per gramme at which<br />
jewellery retailers sell, exchange and buy back gold jewellery at 22 carat and other caratages.<br />
Bank prices for 10 tola bars at 999 purity are now also widely publicised.<br />
This has occurred since November 1997, when authorised banks started importing gold bars. As banks rely on imported<br />
gold bars, and do not buy bars on the secondary market, their prices can sometimes be above the standard gold price.<br />
SOURCES<br />
There are no accessible statistics that record Mumbai’s highest, lowest and average monthly and annual gold prices, and<br />
Mumbai’s variation from London gold prices, back to 1970. In addition, many published statistics, relating to the 1970s and<br />
1980s, appear to use prices on the last trading day of March, or India’s April - March financial year average, as indicative<br />
calendar year averages.<br />
When referring to the tables in this section, the following can be noted:<br />
Period 1970 - 1989<br />
Rupee gold prices. The price in Mumbai on the last trading day of March, as recorded by The Bombay Bullion Association<br />
Ltd.<br />
US dollar gold prices. The average for March at the London gold fix, as recorded by Samuel Montagu & Co Ltd in its<br />
historical bulletins.<br />
Rupee/US dollar exchange rates. The annual period rate, as recorded by the IMF in its International Financial Statistics<br />
Yearbook.<br />
Difference between Mumbai and London prices. It is only indicative as the average US dollar price for March is compared<br />
to the rupee price on the last trading day of March.<br />
Period 1990 - 2001<br />
Based on statistics compiled by Madhusudan Daga, who provides many of the statistics normally published by The Bombay<br />
Bullion Association Ltd.<br />
Rupee gold prices. Average monthly and annual prices in Mumbai.<br />
US dollar gold prices. Average monthly and annual prices at the London fixes. The annual average is the average of the<br />
monthly averages.<br />
Rupee/US dollar exchange rate. Official average monthly and annual rates, based on daily rates recorded in Mumbai.<br />
Both periods<br />
Equivalent London gold price in rupees per 10 g. Based on the official exchange rate, 10 g equals 0.32151 oz, and purity<br />
at 995.<br />
AN INTRODUCTION TO THE INDIAN GOLD MARKET 147
MUMBAI GOLD PRICES<br />
ANNUAL 1925 - 1969<br />
Mumbai gold prices on the last trading day in March<br />
Year Rs per 10 g<br />
1925 18<br />
1926 18<br />
1927 18<br />
1928 18<br />
1929 18<br />
1930 18<br />
1931 18<br />
1932 23<br />
1933 25<br />
1934 28<br />
1935 30<br />
1936 29<br />
1937 30<br />
1938 29<br />
1939 31<br />
1940 36<br />
1941 37<br />
1942 44<br />
1943 51<br />
1944 52<br />
1945 62<br />
1946 83<br />
1947 88<br />
1948 95<br />
1949 94<br />
1950 99<br />
1951 98<br />
1952 76<br />
1953 73<br />
1954 77<br />
1955 79<br />
1956 90<br />
1957 90<br />
1958 95<br />
1959 102<br />
1960 111<br />
1961 119<br />
1962 120<br />
1963 97<br />
1964 108<br />
1965 123<br />
1966 144<br />
1967 n.a.<br />
1968 162<br />
1969 176<br />
Source: The Bombay Bullion Association Ltd<br />
The Mumbai price grew from Rs 18 in 1925 to Rs 176 in 1969. The annual average price in 2001 was Rs 4,462.<br />
148<br />
AN INTRODUCTION TO THE INDIAN GOLD MARKET
MUMBAI GOLD PRICES<br />
INDICATIVE DIFFERENCE BETWEEN MUMBAI AND LONDON GOLD PRICES<br />
ANNUAL 1970 – 2001<br />
YEAR MUMBAI LONDON OFFICIAL LONDON MUMBAI DIFFERENTIAL<br />
EXCHANGE AT OFFICIAL EXCHANGE<br />
RATES<br />
Rs per 10 g US$ per oz Rs per US$ Rs per 10 g Rs % + or -<br />
1970 - 1989 End March March Annual<br />
1970 184 35.09 7.50 84 100 + 119<br />
1971 193 38.87 7.49 93 100 + 108<br />
1972 203 48.31 7.59 117 86 + 74<br />
1973 278 84.24 7.74 209 69 + 33<br />
1974 506 168.36 8.10 436 70 + 16<br />
1975 540 178.18 8.38 478 62 + 13<br />
1976 532 132.63 8.96 380 152 + 29<br />
1977 573 148.28 8.74 415 158 + 38<br />
1978 665 183.72 8.19 481 184 + 38<br />
1979 937 242.20 8.13 630 307 + 48<br />
1980 1,330 553.93 7.86 1,393 - 63 - 5<br />
1981 1,700 499.23 8.66 1,383 317 + 23<br />
1982 1,645 333.33 9.46 1,009 636 + 63<br />
1983 1,800 420.20 10.10 1,358 442 + 33<br />
1984 1,975 394.50 11.36 1,434 541 + 38<br />
1985 2,130 303.57 12.37 1,201 929 + 77<br />
1986 2,140 345.90 12.61 1,395 745 + 54<br />
1987 2,570 408.88 12.96 1,695 875 + 52<br />
1988 3,130 443.55 13.92 1,975 1,155 + 58<br />
1989 3,140 390.15 16.23 2,026 1,114 + 55<br />
1990 - 2001 Annual Annual Annual Rs per 10 g Rs % + or -<br />
1990 3,399 383 17.61 2,173 1,226 + 56<br />
1991 4,044 362 22.95 2,669 1,375 + 53<br />
1992 4,255 344 29.50 3,250 1,005 + 31<br />
1993 4,384 361 31.56 3,658 726 + 20<br />
1994 4,652 384 31.50 3,889 763 + 20<br />
1995 4,798 384 32.47 4,006 792 + 20<br />
1996 5,191 388 35.39 4,415 776 + 18<br />
1997 4,556 331 36.33 3,852 704 + 18<br />
1998 4,182 294 41.27 3,901 281 + 7<br />
1999 4,333 279 43.14 3,868 465 + 12<br />
2000 4,520 279 44.94 4,029 491 + 12<br />
2001 4,462 271 47.19 4,111 351 + 9<br />
From 1970 until February 1992, when all gold imports for the domestic market were unofficial, the Mumbai<br />
price averaged 49% above the London price.<br />
The Mumbai premium fell to around 20% between 1993-97, when NRI’s accounted for the bulk of imports. It has since<br />
ranged between 7 - 9%, after authorised banks started to import gold in November 1997.<br />
AN INTRODUCTION TO THE INDIAN GOLD MARKET 149
INDICATIVE DIFFERENCE BETWEEN MUMBAI AND LONDON GOLD PRICES<br />
MONTHLY 1997 – 1999<br />
1997 MUMBAI LONDON OFFICIAL LONDON MUMBAI DIFFERENTIAL<br />
EXCHANGE<br />
Rs per 10 g US$ per oz Rs per US$ Rs per 10 g Rs % + or -<br />
January 4,897 354.90 35.87 4,093 804 + 20<br />
February 4,826 346.78 35.89 4,002 824 + 21<br />
March 4,790 351.80 35.87 4,058 732 + 18<br />
April 4,788 344.33 35.80 3,964 824 + 21<br />
May 4,782 343.84 35.82 3,960 822 + 21<br />
June 4,637 340.94 35.81 3,926 711 + 18<br />
July 4,469 324.06 35.75 3,725 744 + 20<br />
August 4,512 323.93 35.96 3,746 766 + 20<br />
September 4,442 322.90 36.44 3,659 783 + 21<br />
October 4,400 324.70 36.23 3,783 617 + 16<br />
November 4,135 306.00 37.26 3,666 469 + 13<br />
December 3,995 288.74 39.22 3,641 354 + 10<br />
Average 4,556 331.08 36.33 3,852 704 +18<br />
1998 MUMBAI LONDON OFFICIAL LONDON MUMBAI DIFFERENTIAL<br />
EXCHANGE<br />
Rs per 10 g US$ per oz Rs per US$ Rs per 10 g Rs % + or -<br />
January 4,009 288.80 39.37 3,656 353 + 10<br />
February 3,995 297.33 38.90 3,719 276 + 7<br />
March 3,994 295.70 39.52 3,757 237 + 6<br />
April 4,210 307.80 39.66 3,925 285 + 7<br />
May 4,143 299.10 40.51 3,896 247 + 6<br />
June ** 4,215 292.30 42.24 3,970 245 + 6<br />
July 4,271 292.90 42.52 4,005 266 + 7<br />
August 4,186 284.10 42.77 3,907 279 + 7<br />
September 4,234 289.00 42.52 3,951 283 + 7<br />
October 4,336 295.90 42.32 4,027 309 + 8<br />
November 4,306 294.15 42.39 4,009 297 + 7<br />
December 4,280 291.60 42.55 3,990 290 + 7<br />
Average 4,182 294.06 41.27 3,901 281 + 7<br />
** Import duty increased in June 1998 from Rs 220 to Rs 250 per 10 g.<br />
1999 MUMBAI LONDON OFFICIAL LONDON MUMBAI DIFFERENTIAL<br />
EXCHANGE<br />
Rs per 10 g US$ per oz Rs per US$ Rs per 10 g Rs % + or -<br />
January ** 4,347 287.10 42.51 3,924 423 + 11<br />
February 4,357 287.30 42.47 3,923 434 + 11<br />
March 4,330 286.00 42.45 3,904 426 + 11<br />
April 4,390 282.60 42.74 3,884 506 + 13<br />
May 4,314 276.70 42.78 3,806 508 + 13<br />
June 4,109 261.30 43.15 3,625 484 + 13<br />
July 4,051 256.10 43.28 3,564 487 + 14<br />
August 4,086 256.85 43.46 3,589 497 + 14<br />
September 4,179 264.75 43.54 3,707 472 + 13<br />
October 4,749 310.70 44.44 4,440 309 + 7<br />
November 4,615 293.20 43.40 4,092 523 + 13<br />
December 4,473 283.00 43.48 3,957 516 + 13<br />
Average 4,333 278.80 43.14 3,868 465 +12<br />
** Import duty increased in January 1999 to Rs 400 per 10 g.<br />
150<br />
MUMBAI GOLD PRICES<br />
AN INTRODUCTION TO THE INDIAN GOLD MARKET
MONTHLY 2000 – 2001<br />
2000 MUMBAI LONDON OFFICIAL LONDON MUMBAI DIFFERENTIAL<br />
EXCHANGE<br />
Rs per 10 g US$ per oz Rs per US$ Rs per 10 g Rs per 10 g % + or -<br />
January 4,511 284.31 43.55 3,981 530 + 13<br />
February 4,707 299.86 43.61 4,205 502 + 12<br />
March 4,543 286.39 43.59 4,014 529 + 13<br />
April 4,460 279.69 43.64 3,925 535 + 14<br />
May 4,368 275.18 43.99 3,892 476 + 12<br />
June 4,522 285.73 44.68 4,105 417 + 10<br />
July 4,529 281.60 44.77 4,054 475 + 12<br />
August 4,516 274.00 45.69 4,025 491 + 12<br />
September 4,518 273.60 45.90 4,038 480 + 12<br />
October 4,538 270.00 46.34 4,023 515 + 13<br />
November 4,481 266.00 46.77 4,000 481 + 12<br />
December 4,542 271.40 46.75 4,080 462 + 11<br />
Average 4,520 278.98 44.94 4,029 491 +12<br />
2001 MUMBAI LONDON OFFICIAL LONDON MUMBAI DIFFERENTIAL<br />
EXCHANGE<br />
Rs per 10 g US$ per oz Rs per US$ Rs per 10 g Rs % + or -<br />
January 4,465 264.50 46.54 3,958 507 + 13<br />
February 4,369 261.85 46.52 3,917 452 + 12<br />
March ** 4,269 263.00 46.62 3,942 327 + 8<br />
April 4,267 260.50 46.79 3,919 348 + 9<br />
May 4,437 272.65 46.93 4,114 323 + 8<br />
June 4,400 270.20 46.99 4,083 317 + 8<br />
July 4,381 267.55 47.14 4,055 326 + 8<br />
August 4,453 272.40 47.12 4,127 326 + 8<br />
September 4,628 283.05 47.64 4,336 292 + 7<br />
October 4,692 283.11 48.02 4,371 321 + 7<br />
November 4,602 276.16 47.99 4,261 341 + 8<br />
December 4,580 275.86 47.92 4,251 329 + 8<br />
Average 4,462 270.90 47.19 4,111 351 + 9<br />
** Import duty reduced in March 2001 to Rs 250 per 10 g.<br />
MUMBAI GOLD PRICES<br />
INDICATIVE DIFFERENCE BETWEEN MUMBAI AND LONDON GOLD PRICES<br />
The current 7 – 8% premium of the Mumbai price above the London price largely reflects the impact of<br />
Customs duty at Rs 250 per 10 g.<br />
AN INTRODUCTION TO THE INDIAN GOLD MARKET 151
152<br />
Perspective<br />
Key features at the retail level<br />
<strong>Gold</strong> bullion<br />
Bank importers<br />
Bullion dealers<br />
Pricing an imported 10 tola bar<br />
<strong>Gold</strong> jewellery<br />
Fabricators<br />
Wholesalers<br />
Retailers<br />
PRICING AND PROFITABILITY<br />
<strong>Gold</strong> refining<br />
Organised refiners<br />
Small refiners<br />
Minted coins and bars<br />
Organised fabricators<br />
Small fabricators<br />
Retailers<br />
CHAPTER 8<br />
CONTENTS<br />
Photograph: Tribhovandas Bhimji Zaveri<br />
India is one of the few countries in the world where gold jewellery – superbly fabricated – can be bought<br />
with a mark-up of 25% or less above the prevailing value of its gold content.<br />
AN INTRODUCTION TO THE INDIAN GOLD MARKET
PRICING AND PROFITABILITY<br />
Bank importers normally mark-up imported TT bars by around 0.1%. Secondary and lower tier bullion<br />
dealers rely mainly on movements in the gold price for their profitability.<br />
<strong>Gold</strong> jewellery is typically retailed at a declared price ranging between 5 - 25% above the prevailing gold price.<br />
Retailers that sell gold jewellery with the correct caratage tend to have a gross profit (after fabrication costs) of less<br />
than 10%.<br />
Wholesalers generate a gross profit of 2 - 3%.<br />
Most goldsmiths earn between Rs 4,000 – 15,000 (US$ 80 - 300 per month).<br />
Small refiners can charge as little Rs 10 (US$ 0.20) per 10 g to refine small quantities of old gold jewellery.<br />
Coin fabricators charge between Rs 20 – 60 (US$ 0.40 – 1.20) to make a 10 g coin.<br />
Retailers usually sell a 10 g coin at a mark-up of less than Rs 50 (US$ 1.00).<br />
PERSPECTIVE<br />
This section can only provide indicative information. Pricing and profitability for each trade category can vary regionally,<br />
within cities, and in the rural areas.<br />
While there is some reference to the pricing of smaller businesses, the section focuses mainly on top end businesses for two<br />
reasons. Within cities (and nationally), top end jewellery retailers are important as retail conduits. Although their standard<br />
prices tend to be higher, the important point is that even these higher prices are extremely low by Western standards.<br />
Tax elements<br />
Reference to Customs duty, and State and municipal taxes, is usually omitted in this section for two reasons.<br />
Standard bullion prices can sometimes incorporate these taxes.<br />
State sales and other taxes, applicable to jewellery and other products, vary. For example, the State sales tax applied to<br />
gold jewellery in the 4 main cities ranges from 1% in New Delhi to 4% in Chennai. The level of taxes can also change.<br />
KEY FEATURES AT THE RETAIL LEVEL<br />
Prices are “unfixed” at every level.<br />
The prices of all gold products are generally unfixed, linked to the prevailing gold bullion price at the time of the<br />
transaction.<br />
Although some of the national retail jewellery chains, established since the mid-1990s, have started selling branded<br />
jewellery at fixed prices, their combined volume accounts for less than 1% of the market.<br />
Customers require a breakdown of charges.<br />
Customers, at every level, normally require a detailed breakdown of all charges. For example, jewellery retailers are<br />
expected to advise customers of the value of the carat gold content, the fabrication or “value addition” charge (including not<br />
only the “labour” or “making” charge to fabricate the item, but also in many cases the “wastage” factor), the value of the<br />
precious or semi-precious stones if the item is studded, and the relevant taxes.<br />
Customers ask what price they will receive if they sell back or exchange the item.<br />
Many retailers observe that this question is almost invariably asked at the time of purchase. For most customers, jewellery<br />
is viewed as a tradable asset.<br />
Customers bargain.<br />
Buying, exchanging or selling jewellery, bars and coins invariably involves some bargaining between the customer and the<br />
retailer, even though the discount tends to be small as the retailer’s gross margin above the prevailing gold price is<br />
generally so low.<br />
AN INTRODUCTION TO THE INDIAN GOLD MARKET 153
PRICING AND PROFITABILITY<br />
GOLD BULLION<br />
BANK IMPORTERS<br />
The <strong>Gold</strong> Cells of authorised bank importers are obliged to absorb all overheads and the direct costs incurred when buying<br />
gold bars (from international suppliers) and selling them (to secondary tier dealers). Overheads include administrative and<br />
insurance costs and, in some cases, the cost of consignment stocks that move slowly.<br />
To cover these costs, and to generate a profit, a <strong>Gold</strong> Cell generally relies on 3 - 5 sources of income.<br />
Small gross mark-up<br />
Banks normally apply a small percentage or rupee amount to the actual cost of the bullion (delivered to a location in India)<br />
at the time it is purchased from an international supplier.<br />
The actual cost takes into account the US dollar gold price quoted by the international supplier (that supplied the consignment<br />
stock), the bar mark-up per ounce charged by the supplier (inclusive of the refiner’s fabrication charge and the cost<br />
of insured delivery to the required city in India), the US$/rupee exchange rate, Customs duty, State sales taxes and other<br />
taxes.<br />
The bank’s gross mark-up on the actual cost of an imported TT bar is currently low, at around 0.1% (Rs 15 per oz - about<br />
US$ 0.32), although it can vary according to the size of the transaction and the prevailing level of TT supply and demand.<br />
Since the introduction of the OGL Scheme in 1997, the bank’s mark-up on imported TT bars has fallen significantly. In 1997,<br />
it was around 0.6% (about Rs 90 per oz - US$ 2).<br />
Rupee exchange rates<br />
The opportunity to convert US dollars into rupees in-house enables banks to generate a small amount of incremental income.<br />
Typically, a few paise per US dollar.<br />
Interest earned on advance payments<br />
As most secondary tier dealers are obliged to lodge large cash deposits and/or make payment in full before delivery, the<br />
bank can earn interest on those funds until obliged to pay international suppliers.<br />
Movements in the gold price<br />
Although the <strong>Gold</strong> Cells of most banks are permitted to take some risk on movements in the gold price, almost all do not.<br />
On rare occasions, in a rapidly rising gold price scenario and anticipated demand is “guaranteed”, a small risk might be<br />
undertaken by some.<br />
<strong>Gold</strong> loans<br />
Income is also derived if the bank offers gold loans to jewellery exporters (and, if it is part of the <strong>Gold</strong> Deposit Scheme, to<br />
domestic fabricators and retailers).<br />
For example, one bank requires a cash deposit (110%), a bank guarantee (110%) or other securities to 100% value of the<br />
gold plus 10% cash, plus an annualised interest payment ranging from 7.5% to 10.5%, plus handling charges.<br />
Addendum<br />
International refiners that supply TT bars indirectly (via international dealers) have seen their margins on TT bars fall<br />
substantially, from around US$ 1.25 - 1.50 per ounce in the early 1990s to less than 70 cents in 2002.<br />
BULLION DEALERS<br />
Secondary tier dealers<br />
The relatively few domestic dealers that buy TT bars in bulk from bank importers normally place an accumulated order on<br />
behalf of several subsidiary customers (e.g. lower tier dealers and large jewellery businesses) in order to eliminate or reduce<br />
their exposure to an unexpected fall in the rupee gold price. When acting on behalf of others, their margins tend to be<br />
small, usually less than Rs 50 per ounce. When buying on their own account, their profit or loss is dependent on<br />
movements in the standard bullion price.<br />
Lower tier dealers<br />
Tertiary and lower tier dealers may also reduce their risk by acting on behalf of others. However, in the absence of a<br />
hedging facility, both large and smaller dealers (and their customers) are exposed to unexpected falls in the gold price. Their<br />
profit or loss is dependent on movements in the standard bullion price, and sometimes the prevailing price of unofficial<br />
imports of TT bars.<br />
For this reason, most lower tier dealers (and their customers) tend to buy TT bars in small quantities, often on a daily basis.<br />
154<br />
AN INTRODUCTION TO THE INDIAN GOLD MARKET
Recycling of old gold scrap and bars<br />
The bulk of dishoarded jewellery is bought back (from known customers), or exchanged for new jewellery, by jewellery<br />
retailers.<br />
However, where the retailer from which the jewellery has been bought is not accessible (e.g. closed down, or located far<br />
away), some lower tier bullion dealers, some refiners, as well as specialised scrap dealers will buy back old jewellery (as well<br />
as bars and coins) for cash.<br />
The price is usually based on a conservative estimate of the caratage.<br />
PRICING AN IMPORTED 10 TOLA BAR<br />
The schedule illustrates a method of calculating a bank’s TT wholesale price in rupees, assuming a gold price of US$ 300<br />
and an exchange rate of Rs 48.<br />
Bank importers normally mark-up imported TT bars by around 0.1%. The mark-up can vary according to prevailing supply<br />
and demand.<br />
Description Amount Calculation<br />
US$ gold price per oz.<br />
Quoted by international dealer. $ 300<br />
Add gross mark-up per oz charged by<br />
international dealer, inclusive of delivery.<br />
Assume: US$ 85 per oz. $ 300.85 $300 plus $0.85<br />
US$ price of a TT bar. Gross weight: 3.75 oz.<br />
Purity: 999 purity. $ 1,126.98 $300.85 x 3.746 oz<br />
Conversion to rupees.<br />
Assume exchange rate: US$ 1.00 = Rs 48 Rs 54,095.04 $ 1,126.98 x Rs 48<br />
Add Customs duty per oz.<br />
Assume: Rs 250 per 10 g.<br />
Gross TT weight: 116.64 g Rs 2,916.00 Rs 250 x 11.664<br />
Cost before State and other taxes Rs 57,011.04 Rs 54,095.04 plus Rs 2,916.<br />
Add State sales and other taxes per TT<br />
Assume 1.15% Rs 655.62 Rs 57,011.04 x 0.115<br />
Total cost to bank per TT Rs 57,666.66 Rs 57,011.04 plus Rs 655.62<br />
Add bank gross mark-up<br />
Assume 0.1% Rs 57.66 Rs 57,666.66 x 0.001<br />
TT wholesale price Rs 57,726.52 Rs 57,666.66 plus Rs 57.66<br />
Percentage above international gold price 7.01% $ 300 x 48 x 3.746 =<br />
Rs 53,942.40.<br />
Additional statistics:<br />
- Bank gross mark-up per oz in rupees Rs 15.39 Rs 57.66 divided by 3.746<br />
- Bank gross mark-up per oz in US$ $ 0.32 Rs 15.39 divided by 48<br />
Source: Bank importer.<br />
PRICING AND PROFITABILITY<br />
AN INTRODUCTION TO THE INDIAN GOLD MARKET 155
PRICING AND PROFITABILITY<br />
GOLD JEWELLERY<br />
JEWELLERY FABRICATORS<br />
Contracts<br />
Where retailers and wholesalers do not undertake their fabrication in-house, they enter into a contract with one or more<br />
independent fabrication units.<br />
Most fabrication by these units is undertaken on the basis that retailers and wholesalers, and the public if they deal<br />
directly with them, supply the required amount of gold. The prevailing gold price is usually irrelevant to the transaction.<br />
The units normally cover their costs in one of 3 ways. The agreed charges vary according to the category, weight,<br />
complexity and quality of the item, although some fabricators may charge the same (or similar) rate per gramme for all<br />
designs if they specialise in a specific category and style.<br />
In the form of retained gold<br />
Under this system, fabricators return gold jewellery to an agreed weight, caratage and solder content, retaining an agreed<br />
percentage of the fine gold content to cover the wastage and labour charges. Where this occurs, the percentage retained<br />
tends to range between 4 - 10 %.<br />
In the form of retained gold plus labour charges<br />
Under this system, wastage and the labour charges are negotiated separately. For example, wastage might be 4% and the<br />
labour charge Rs 15 per gramme.<br />
In the form of labour charges only<br />
In recent years, many top end retailers and wholesalers now require fabricators to take responsibility for the wastage<br />
factor. Instead, they pay a higher labour charge (inclusive of wastage), normally in rupees per gramme.<br />
This system has grown among top end retailers as a result of the use of cadmium (it evaporates under heat after<br />
fabrication) or high caratage solders, access to more sophisticated assaying procedures and assay centres, the need to<br />
upgrade caratages since hallmarking was first mooted in the late 1990s, and a motivation to reduce their costs.<br />
Under this system, they expect to receive jewellery containing the same amount of fine gold supplied. The higher labour<br />
charge tends to range between Rs 25 - 50 per gramme, but can be more for complicated items.<br />
Indicative fabrication costs to retailers<br />
The schedule below illustrates the relative charges (inclusive of wastage and labour costs) incurred by a top end retailer for<br />
different categories of standard items. It does not imply that these charges are standard. They would vary according to<br />
the complexity of the items.<br />
Item Handmade<br />
Rs per gramme US$ per gramme<br />
Necklace 35 0.70<br />
Bangle 30 0.60<br />
Chain 45 0.90<br />
Earring 45 0.90<br />
Ring 35 0.70<br />
Generally, a top end retailer would expect average fabrication costs to be around 8 - 10% above the value of the prevailing<br />
gold price.<br />
Profitability<br />
Independent fabrication units are generally regarded as low profit enterprises. Most have also seen their incomes and<br />
profits decline for two reasons, apart from the pressure of increasing competition.<br />
Where gold retention is part or the entire source of income, they have been squeezed by a rupee gold price that has been<br />
largely static in recent years.<br />
The trend among top end retailers to pay labour charges only (permitting no wastage) has also reduced a fabrication unit’s<br />
profitability. The labour charge tends not to cover the previous wastage charge in full. The unit is also often obliged to use<br />
additional gold from its own inventory to provide sufficient feedstock to fabricate the required items.<br />
For example, in Kolkata, it is reported that about 5 years ago, the system was typically 6.5% wastage (Rs 30) plus a labour<br />
charge of Rs 6 per gramme. Total: Rs 36 per gramme. Many units are now receiving around Rs 25 - 30.<br />
The income of employed goldsmiths and ancillary workers is generally low. Wages are reported to range between Rs 4,000<br />
- 15,000 (US$ 80 - 300) per month.<br />
156<br />
AN INTRODUCTION TO THE INDIAN GOLD MARKET
JEWELLERY WHOLESALERS<br />
Jewellery wholesalers, acting as middlemen between fabricators and retailers, normally expect to make a gross profit of<br />
2 - 3%. It can be higher if credit is given.<br />
They are normally paid in cash, or in the form of gold. As many major wholesalers also produce jewellery on a speculative<br />
basis (not just in response to orders), their profitability can depend on movements in the standard bullion price.<br />
JEWELLERY RETAILERS<br />
Methods of payment<br />
Retail customers obtain new gold jewellery using one or a combination of 4 methods. In summary:<br />
• Cash payment. Some retailers now also accept credit cards.<br />
• Exchange of old for new jewellery. Its value is credited.<br />
• Supply of bars and coins. The gold content value is credited.<br />
• Supply of old jewellery for refashioning into new jewellery.<br />
Retailers normally communicate a breakdown of pricing elements, although some can be combined and the terminology can<br />
vary. In summary:<br />
Carat gold price<br />
Quoted in rupees per gramme at the appropriate caratage.<br />
Labour charge<br />
Normally quoted in rupees per gramme, although a flat amount can also be quoted.<br />
Wastage charge<br />
Normally quoted as a percentage.<br />
Hallmarking charge<br />
If applicable, a supplementary charge is sometimes levied.<br />
PRICING AND PROFITABILITY<br />
State sales and other taxes<br />
Variable by State and city.<br />
Carat gold price<br />
Carat gold prices per gramme or per 10 g are normally displayed in most outlets. For example, at K22 and K18, and<br />
sometimes K24, K23 and K21 as well.<br />
The price usually reflects that calculated by the local jewellery association. It is based on the prevailing local standard<br />
bullion price per gramme or TT.<br />
The carat gold price is not always directly proportional to the standard bullion price, as it sometimes includes a surcharge<br />
that may also include part or all applicable State and municipal taxes on jewellery, and a contribution to wastage.<br />
For example, if the standard bullion price is Rs 450 per gramme, the quoted K22 price may be Rs 430 (as opposed to a<br />
proportional carat price of Rs 412).<br />
The carat gold price is used as the basis for buying, selling and exchanging jewellery.<br />
Labour charges<br />
“Labour” or “making” charges are normally expressed in rupees per gramme, although for small low weight items (such as<br />
rings, earrings and nose pins), the labour charge can be a fixed amount per item.<br />
In small suburban and rural outlets (usually where the retailer fabricates the jewellery on-site), the labour charge is often a<br />
fixed amount per item. Although the charge can vary according to the weight of the item, the cost is not necessarily<br />
calculated on a consistent rupees per gramme basis.<br />
The tables below can only provide a rough indication of the approximate level of labour charges quoted for different<br />
jewellery categories. The charges, especially at the top end, are inevitably dependent on the intricacy of designs and the<br />
quality of craftsmanship, and whether the wastage cost is included.<br />
AN INTRODUCTION TO THE INDIAN GOLD MARKET 157
PRICING AND PROFITABILITY<br />
Top end retailers<br />
The labour charge for some standard machine-made items can be 10 - 20% less than standard handmade items.<br />
Category Handmade<br />
Labour charge per gramme<br />
Rs Approx US$<br />
Necklace 40 - 200 0.80 - 4.20<br />
Bangle 30 - 100 0.60 - 2.10<br />
Chain 30 - 80 0.60 - 1.60<br />
Earrings 75 - 100 1.60 - 2.10<br />
Ring 75 - 100 1.60 - 2.10<br />
Category Machine-made<br />
Labour charge per gramme<br />
Rs Approx US$<br />
Necklace 40 - 200 0.80 - 4.20<br />
Bangle 30 - 80 0.60 - 2.10<br />
Chain 30 - 70 0.60 - 1.40<br />
Earrings 60 - 90 1.20 - 1.90<br />
Ring 50 - 70 1.00 - 1.40<br />
Small suburban and rural retailers that fabricate on-site<br />
The table below illustrates how jewellery can sometimes be priced with a fixed labour charge in rupees per item.<br />
Category Weight Handmade<br />
Fixed labour charge<br />
Rs Approx US$<br />
Necklace 25 g 200 4.20<br />
Bangle 10 g 100 2.10<br />
Earrings 6 g 100 2.10<br />
Ring 5 g 100 2.10<br />
The table below illustrates how jewellery can sometimes be priced in rupees per gramme, regardless of the category, at<br />
different (and decreasing) rates according to the weight of the item.<br />
Item weight Handmade<br />
Variable labour charge per gramme<br />
Rs Approx US$<br />
2 g 25 0.50<br />
4 g 20 0.40<br />
8 g 15 0.30<br />
24 g 10 0.20<br />
Crude “money” jewellery<br />
The labour charge can be as low as Rs 2 - 5 per gramme (plus wastage) for simple items in K24, K23 and K22 at specified<br />
weights.<br />
For example, a retailer may stock a range of crude rings weighing 1/2, 1, 2, 3, 4, 5 and 10 grammes, and crude bangles at<br />
heavier weights.<br />
Wastage charges<br />
The wastage charge, sometimes referred to as a “polishing” charge, is intended to cover the gold lost in the fabrication and<br />
polishing of gold jewellery, and in many cases to contribute towards the total cost of the jewellery. For example, if the<br />
wastage charge is high, it enables the labour charge to be lower.<br />
While most outlets levy a wastage charge, it can also be absorbed within an overall “value addition” or total fabrication<br />
charge (including labour charges).<br />
The quoted wastage charge can vary from zero to 10%. A top end wastage charge tends to range between 4 - 8% (although it<br />
is often absorbed within a total “value addition” charge). In small suburban and rural areas, it typically ranges between 2 - 4%.<br />
158<br />
AN INTRODUCTION TO THE INDIAN GOLD MARKET
Hallmarking charges<br />
The few hundred retailers that currently sell hallmarked jewellery either absorb the cost or increase the labour charge. For<br />
example, by Rs 5 - 15 per gramme.<br />
Authorised hallmarking centres can set their own charges. For example:<br />
Below 20 g Rs 50 per item (US$ 1.00)<br />
Above 20 g Rs 75 per item (US$ 1.50)<br />
For most retailers hallmarking is an expensive exercise, when obliged to operate competitively at low retail margins. The<br />
hallmarking cost for a pair of small earrings (2 items) would be Rs 100.<br />
A retailer is also obliged to recover the annual BIS certification fee of Rs 25,800.<br />
Exchanging old for new jewellery<br />
If the old jewellery had been bought from the same retailer.<br />
The customer is normally credited with the quoted K22 carat gold price per gramme, if it had been sold as K22 and<br />
cadmium solder had been used.<br />
If it had been sold as 22/20 (i.e. a low caratage solder had been used so that after melting the residual gold content would<br />
be 10% less than the original weight of the jewellery), the K22 carat gold price per gramme would normally be reduced by<br />
3% or more. The credited value would then be set against the price of the new jewellery.<br />
If the old jewellery had been bought from another retailer.<br />
The old jewellery would be assayed using a touchstone. As the caratage often turns out to be less than the declared<br />
caratage, an appropriately lower carat gold price would apply.<br />
In addition, there would be a further reduction: around 10 - 20% if the solder is non-cadmium, and around 8 - 10% if the<br />
solder is cadmium (or high caratage).<br />
Supplying old jewellery for refashioning into new jewellery<br />
Under this system, often used in suburban areas, small towns and villages, gold in any form (but usually accumulated old<br />
jewellery) is given to a local retailer or fabricator so that it can be refashioned into new items.<br />
The customer can hand over sufficient gold to cover all fabrication costs (i.e. labour and wastage charges). Or he can pay<br />
for the fabrication costs in rupees.<br />
The prevailing carat gold price is irrelevant to the transaction. The actual caratage of the old and new jewellery is not<br />
necessarily an issue.<br />
In rural areas in particular, this can be the cheapest way in rupee terms to obtain new gold jewellery provided the goldsmith<br />
does not reduce the caratage or retain any recoverable wastage. Customers sometimes watch him as he fabricates the new<br />
jewellery.<br />
Selling back old jewellery for cash<br />
If the old jewellery had been bought from the same retailer.<br />
Using the carat gold price, the retailer first calculates its value at the caratage at which it had originally been sold, and then<br />
reduces it according to his own declared formula. For example:<br />
Around 5% if the solder is cadmium (or high caratage).<br />
Around 10% if the solder is non-cadmium.<br />
PRICING AND PROFITABILITY<br />
If the old jewellery had been bought from another retailer.<br />
Most retailers tend not to buy back old jewellery from customers with whom they have not dealt in the past. In the event<br />
that they do, the price would tend to be low, often 10% or more below the standard bullion price.<br />
Studded gold jewellery<br />
All retailers observe that studded jewellery is more profitable than plain gold jewellery.<br />
While gross profitability (after fabrication costs) on plain gold jewellery is reported at around 10%, diamond and other<br />
studded jewellery can yield 15 - 20% and often much more.<br />
Retailers normally advise customers of the breakdown in the cost of diamond (and other precious and semi-precious)<br />
jewellery: weight of gold, cost of diamonds, labour charge and taxes.<br />
Retailers will exchange old for new diamond jewellery. The customer would usually receive the prevailing break-up value,<br />
less the labour charge. However, retailers will normally only buy back diamond jewellery if it had originally been bought<br />
from them. The price would be based on the prevailing break-up value, less 15 - 20%.<br />
Staff costs<br />
In metropolitan cities, wages for counter staff (often 20 or more in large showrooms) are reported to range from less than<br />
Rs 5,000 (US$ 100) per month up to Rs 15,000 (US$ 300).<br />
AN INTRODUCTION TO THE INDIAN GOLD MARKET 159
ORGANISED REFINERS<br />
Although organised refiners are few, the table below records the published charges levied by an organised refiner. The<br />
refining (to 995 purity) and gold loss charges reduce on a graduated scale according to weight.<br />
Assumptions:<br />
<strong>Gold</strong> price US$ 300<br />
Exchange rate Rs 48 per US dollar<br />
Scrap purity K20<br />
PRICING AND PROFITABILITY<br />
GOLD REFINING<br />
Melting and refining gold jewellery<br />
on a gross weight basis Rupees Approximate US dollars<br />
Under 4 kg Rs 40 per 10 g US$ 2.59 per oz<br />
10 kg or more Rs 6 per 10 g US$ 0.39 per oz<br />
<strong>Gold</strong> assaying<br />
Dip muster sample Rs 200 US$ 4.17<br />
Cut sample Rs 100 US$ 2.08<br />
Urgent assay Rs 400 US$ 8.33<br />
Duplicate certificate Rs 50 US$ 1.04<br />
<strong>Gold</strong> loss on refining gold jewellery<br />
on a fine weight basis<br />
Under 5 kg. At 7 g per 1,000 g Rs 26.98 per 10 g refined US$ 1.75 per oz refined<br />
10 kg or more. Nil Nil<br />
The table below indicates the approximate cost of refining old gold jewellery into an assayed, certified and stamped slab of<br />
gold ready for recycling.<br />
Gross weight Rupees Approximate US dollars<br />
Under 4 kg Rs 64.17 per 10 g US$ 4.16 per oz<br />
10 kg or more Rs 8.50 per 10 g US$ 0.55 per oz<br />
SMALL REFINERS<br />
The bulk of the refining of old gold jewellery is undertaken by thousands of small refiners in cities, towns and villages. Both<br />
large and small retailers and fabricators use them as they are so accessible, and their charges are significantly less when<br />
refining small quantities.<br />
Some retailers and fabricators also undertake their own refining in-house. Some recycle old gold jewellery (after assay)<br />
without refining it.<br />
Using the same gold price, exchange rate and scrap purity assumptions, the table below indicates the charge levied by a<br />
reputable small refiner in a major city. It is indicative only. Some small refiners can charge as low as Rs 10 per 10 g when<br />
they retain the silver content.<br />
Category Rupees Approximate US dollars<br />
Melting and refining Rs 15 per 10 g US$ 0.97 per oz<br />
<strong>Gold</strong> loss at 1.5 g per 1000 g Rs 6.36 per 10 g fine US$ 0.41 per oz fine<br />
Assaying Rs 1.50 per 10 g US$ 0.10 per oz<br />
Total cost Rs 22.29 per 10 g US$ 1.44 per oz<br />
Although small refiners are much less expensive for refining small quantities, top end retailers will be obliged increasingly to<br />
use organised refiners to ensure that the purity of recycled jewellery meets hallmarking standards.<br />
160<br />
AN INTRODUCTION TO THE INDIAN GOLD MARKET
PRICING AND PROFITABILITY<br />
MINTED COINS AND BARS<br />
ORGANISED FABRICATORS<br />
Although charges vary among fabricators, and bulk orders are subject to negotiation, the following records the published<br />
wholesale charges levied by an organised fabricator in a major city. Its minimum order is 1 kg.<br />
Assumptions:<br />
<strong>Gold</strong> price US$ 300<br />
Exchange rate US$ 1.00 = Rs 48<br />
For standard minted coins and bars<br />
Using standard in-house designs, weights and dimensions.<br />
Weight - at 995 purity Fabrication charge per item<br />
Rupees Approximate US dollars<br />
500 g Rs 225 US$ 4.69<br />
200 g Rs 100 US$ 2.08<br />
100 g Rs 60 US$ 1.25<br />
50 g Rs 50 US$ 1.04<br />
20 g Rs 30 US$ 0.62<br />
10 g Rs 25 US$ 0.52<br />
5 g Rs 23 US$ 0.48<br />
2 g Rs 20 US$ 0.42<br />
1 g Rs 15 US$ 0.31<br />
For tailor-made minted coins and bars<br />
Using standard in-house weights and dimensions, 995 purity and applying requested designs.<br />
Standard weights Fabrication charge per item<br />
Rupees Approximate US dollars<br />
10 g Rs 50 US$ 1.04<br />
5 g Rs 40 US$ 0.83<br />
2.5 g Rs 30 US$ 0.62<br />
1.25 g Rs 20 US$ 0.42<br />
Guineas<br />
8 g Rs 40 US$ 0.83<br />
4 g Rs 30 US$ 0.62<br />
Supplementary charges<br />
Assumes that the customer provides acceptable bars (e.g. TT bars) for conversion into minted coins or bars.<br />
Cost category Additional charges *<br />
Rupees Approximate US dollars<br />
Melting<br />
<strong>Gold</strong> loss:<br />
Rs 4 per 10 g US$ 0.25 per oz<br />
5 g coins and less: 1.5 g per 1 kg Rs 6.94 per 10 g US$ 0.45 per oz<br />
10 g coins: 0.7 g per 1 kg Rs 3.24 per 10 g US$ 0.21 per oz<br />
* Excludes the cost of new designs and dies, if required.<br />
SMALL FABRICATORS<br />
The many small fabricators of coins normally charge less than organised fabricators, especially for small quantities.<br />
The table below records the fabrication charge for 10 g coins by a small entity in a major city.<br />
Quantity - at 995 purity Fabrication charge per item<br />
Rupees Approximate US dollars<br />
For 10 coins Rs 20 each US$ 0.42<br />
For 100 coins Rs 8 – 10 each US$ 0.17 - 0.21<br />
RETAILERS<br />
Coins are normally retailed by jewellery retailers. The mark-up is generally low, usually Rs 50 (US$ 1.00) or less above the<br />
carat gold price for coins 10 g and less. Some retailers sell coins as a “service” without a mark-up.<br />
AN INTRODUCTION TO THE INDIAN GOLD MARKET 161
162<br />
GOLD MINING AND EXPLORATION<br />
Primary gold producers<br />
Secondary gold producers<br />
<strong>Gold</strong> mining potential<br />
<strong>Indian</strong> Bureau of Mines<br />
Appendices<br />
<strong>Gold</strong> production by State and District<br />
<strong>Gold</strong> production in India 1970-2001<br />
CHAPTER 9<br />
CONTENTS<br />
Hutti <strong>Gold</strong> Mines is India’s largest gold mining company.<br />
Its mines are located in Karnataka (south India). Annual gold output is around 2 tonnes.<br />
AN INTRODUCTION TO THE INDIAN GOLD MARKET
GOLD MINING AND EXPLORATION<br />
For 36 years (1957-1993), the mining of gold was nationalised under the Mines & Minerals (Regulation<br />
& Development) Act 1957.<br />
In line with the <strong>Indian</strong> government’s policy of economic deregulation initiated in 1991, a new National Mineral Policy<br />
was announced in March 1993. Alongside 12 other minerals, the mining of gold was liberalised to include private<br />
initiatives.<br />
The new policy is designed to encourage the development and exploitation of the country’s mineral resources, focusing<br />
on those minerals, such as gold, where there is a disparity between domestic supply and demand.<br />
Although current annual gold mine output is only around 2 tonnes, there are many gold exploration projects. More than<br />
20 million tonnes of proven, probable and possible gold ore reserves have now been identified.<br />
PRIMARY GOLD PRODUCERS<br />
The original Act, renamed the Mines and Minerals (Development and Regulation) Act 1957, was amended in<br />
January 1994 and December 1999.<br />
Restrictions on foreign equity participation have been removed. More powers have been given to State governments to<br />
grant, renew and transfer mineral concessions. Area restrictions have also been liberalised to apply to a single State, not<br />
the country as a whole. For example, in each State, a Reconnaissance Permit can now cover 10,000 square kilometres, a<br />
Prospecting Licence 25 square kilometres, and a Mining Lease 10 square kilometres.<br />
Two companies mine primary gold in India. The mines are located in two States in the south: Karnataka and Andhra<br />
Pradesh.<br />
The Hutti <strong>Gold</strong> Mines Co Ltd (HGML)<br />
Established in 1947, but known as Hutti <strong>Gold</strong> Mines since 1956. An undertaking of the Karnataka State Government under<br />
the administrative control of the Department of Commerce and Industry.<br />
Mines: Located in Karnataka. Hutti (in the Raichur district) and Mangalur (in the Gulburga district).<br />
Annual gold output is around 2 tonnes.<br />
M/s Bharat <strong>Gold</strong> Mines Ltd (BGML)<br />
Incorporated in 1972. A Public Sector Undertaking under the administrative control of the Ministry of Coal and Mines.<br />
Mines: Located in the Kolar <strong>Gold</strong> Field in Karnataka, and in the Anantapur and Chittoor districts of Andhra Pradesh.<br />
Current annual gold output is less than 100 kg, following the closure of several mines in the Kolar <strong>Gold</strong> Field in 2000.<br />
SECONDARY GOLD PRODUCERS<br />
Two other companies produce gold as a by-product from copper slimes and concentrates. The smelters are<br />
located in Bihar in the east and Gujarat in the west.<br />
M/s Hindustan Copper Ltd (HCL)<br />
Incorporated in 1967. A Public Sector Undertaking under the administrative control of the Ministry of Coal and Mines.<br />
Smelter: Located at Ghatsala in the Singhbhum East district of Bihar.<br />
Annual gold output, as a by-product of copper slimes, has ranged between 400 - 700 kg.<br />
Indo-Gulf Corporation Ltd (Birla Copper)<br />
Part of the Birla Group of companies. The smelter, commissioned in May 1998, is located at Dehej in the Bharuch district<br />
of Gujarat.<br />
Annual gold output, as a by-product of imported copper concentrates, was 5.1 tonnes in its first year of production<br />
(2000-01).<br />
AN INTRODUCTION TO THE INDIAN GOLD MARKET 163
GOLD MINING AND EXPLORATION<br />
GOLD PRODUCTION BY STATE AND DISTRICT: 1998-99 - 2000-01<br />
<strong>Gold</strong> mines in Karnataka produce 97% of India’s primary gold mine output.<br />
State District Kilogrammes<br />
1998 - 1999 1999 - 2000 2000 - 2001<br />
Primary gold<br />
Andhra Pradesh Anantapur 43 5 #<br />
Chittoor 182 179 28<br />
Karnataka Kolar 306 239 36<br />
Raichur 1,427 1,546 1,784<br />
Tumkur *** 220 184 174<br />
Sub-total 2,178 2,153 2,022<br />
Secondary gold<br />
Bihar * Singhbhum East 505 433 435<br />
Gujarat ** Bharuch - - 5,097<br />
Sub-total 505 433 5,532<br />
Total 2,683 2,586 7,554<br />
Source: <strong>Indian</strong> Bureau of Mines. ** <strong>Gold</strong> is recovered as a by-product of copper slimes. ** <strong>Gold</strong> is recovered as a by-product during the refining of<br />
imported copper. *** Includes gold recovered from ore obtained incidental to prospecting and exploratory operations. # Temporarily suspended due<br />
to lack of electricity.<br />
GOLD MINING POTENTIAL<br />
According to the <strong>Indian</strong> Bureau of Mines, 9 States have been identified as offering gold mining potential.<br />
<strong>Gold</strong> has been mined in India, albeit in small quantities, for more than 2,000 years.<br />
State<br />
NORTH<br />
District<br />
Jammu & Kashmir Jammu<br />
Rajasthan Banswara, Jodhpur, Sirohi<br />
WEST -<br />
EAST<br />
Bihar Monghir, West Champaran<br />
Chhattisgarh Bastar, Raigarh, Raipur<br />
Jharkhand<br />
SOUTH<br />
Ranchi, Singhbhum<br />
Andhra Pradesh Ananatpur, Chittoor, Kurnool, Nellore<br />
Karnataka Dharwar, Gulbarga, Hassan, Kolar, Raichur, Shimoga, Tumkur<br />
Kerala Kozhikode, Malapuram, Palakkad, Wynad<br />
Tamil Nadu Dharampur<br />
Source: <strong>Indian</strong> Bureau of Mines.<br />
Government and State agencies, active in gold exploration, include the following:<br />
Geological Survey of India (GSI)<br />
Headquarters: Kolkata. A department within the Ministry of Coal and Mines. Established in 1851.<br />
Mineral Exploration Corporation Ltd (MEC)<br />
Headquarters: Nagpur. A Public Sector Undertaking under the administrative control of the Ministry of Coal and Mines.<br />
Incorporated in 1972.<br />
State Directorates of Geology and Mining<br />
Notably, in Rajasthan (north), Madhya Pradesh (west), West Bengal (east) and Andhra Pradesh, Kerala and Karnataka (south).<br />
Many domestic and foreign companies, with registered offices in India, have been granted Reconnaissance Permits and<br />
Prospecting Licences that refer to gold. Notably, the following:<br />
New Delhi. AMIL Mining India Pvt Ltd, CRA Exploration (India) Pvt Ltd, Pasminco Exploration Pvt Ltd, Phelps Dodge<br />
Exploration India Pvt Ltd, WSIL, Mineral Sands India Pvt Ltd.<br />
Mumbai. De Beers India Prospecting Pvt Ltd, Metmin Finance & Holdings Pvt Ltd, Adamas India Pvt Ltd.<br />
Thane. ACC-RIO TINTO Exploration Ltd.<br />
Bangalore. Geomysore Services (India) Pvt Ltd.<br />
164<br />
AN INTRODUCTION TO THE INDIAN GOLD MARKET
Year Tonnes Year Tonnes<br />
1970 3.241 1986 1.931<br />
1971 3.656 1987 1.864<br />
1972 3.290 1988 1.944<br />
1973 3.278 1989 1.827<br />
1974 3.145 1990-91 2.077<br />
1975 2.825 1991-92 2.041<br />
1976 3.152 1992-93 1.850<br />
1977 3.014 1993-94 2.075<br />
1978 2.774 1994-95 2.373<br />
1979 2.637 1995-96 2.036<br />
1980 2.452 1996-97 2.710<br />
1981 2.495 1997-98 2.636<br />
1982 2.244 1998-99 2.683<br />
1983 2.154 1999-00 2.586<br />
1984 1.989 2000-01 7.554<br />
1985 1.853 2001-02 9.000 *<br />
Source: <strong>Indian</strong> Bureau of Mines. * Estimated.<br />
India’s domestic gold output has grown from less than 2.6 tonnes to 9 tonnes over the past 3 years, due to<br />
Birla Copper (Gujarat) producing gold as a by-product of imported copper concentrates.<br />
The <strong>Indian</strong> Bureau of Mines, established in 1948, falls under the Department of Mines within the Ministry of<br />
Coal and Mines.<br />
Its national headquarters in Nagpur (Maharashtra) has 6 technical divisions: Mines Control and Conservation of Minerals,<br />
Mineral Economics, Ore Dressing, Technical Consultancy, Mining and Mineral Statistics, Planning and Co-ordination. It has<br />
regional and sub-regional offices, as well as laboratories and pilot plants, located throughout the country. Employees: 1,600.<br />
Its functions include approving mining plans and schemes, undertaking geological studies, conducting feasibility studies,<br />
preparing mineral maps, updating the National Mineral Inventory, disseminating information from its data base, evolving new<br />
technologies, and providing consultancy services. It also advises the <strong>Indian</strong> and State governments on issues related to<br />
mineral policy, mineral legislation, trade policy, royalty, taxation and other matters.<br />
The Bureau publishes around 40 books, market survey reports, monographs, bulletins and periodicals each year.<br />
Publications, relevant to the gold industry, include the following:<br />
<strong>Indian</strong> Minerals Yearbook (Annual)<br />
Bulletin of Mineral Information<br />
Monthly Statistics of Mineral Production<br />
GOLD MINING AND EXPLORATION<br />
GOLD PRODUCTION 1970 - 2001<br />
INDIAN BUREAU OF MINES<br />
The headquarters of the <strong>Indian</strong> Bureau of Mines is in Nagpur (Maharashtra).<br />
AN INTRODUCTION TO THE INDIAN GOLD MARKET 165
166<br />
Net supply<br />
Gross supply<br />
Net demand<br />
Gross fabrication and demand<br />
Total imports<br />
CHAPTER 10<br />
GOLD SUPPLY AND DEMAND<br />
CONTENTS<br />
Appendices<br />
Net new gold supply<br />
Indicative usage of net new gold supply<br />
Indicative gross jewellery fabrication<br />
Indicative gross fabrication and demand<br />
Total gold imports – includes gold imported for jewellery exporters<br />
Indicative above ground stocks<br />
Photograph: B.C. Sen<br />
<strong>Gold</strong> imports for the domestic market grew from less than 200 tonnes in 1990 to more than<br />
670 tonnes in 2001.<br />
AN INTRODUCTION TO THE INDIAN GOLD MARKET
GOLD SUPPLY AND DEMAND<br />
Movements in net supply and demand since 1990 fall into 2 broad periods.<br />
1990 - 1997: High growth over 8 years. From 178 tonnes to 645 tonnes<br />
1998 - 2001: Largely static market over 4 years. Ranging between 650 - 690 tonnes.<br />
To understand unexpected movements in imports, it is necessary to take into account the large quantity of old jewellery,<br />
coins and bars recycled. It is substantial and tends to increase when the gold price spikes. A small increase in<br />
recycling at this time can reduce imports substantially.<br />
In 2001, when 672 tonnes were imported for the domestic market, an indicative estimate is that gross demand was<br />
about 1,053 tonnes.<br />
The gross statistic puts high tonnages of industrial fabrication (4%), coin fabrication (3%) and net bar hoarding (2%)<br />
into perspective. Jewellery accounts for around 90% of gross demand.<br />
NET SUPPLY<br />
1990 – 1997 (8 years)<br />
Imports for the domestic market grew rapidly from 176 tonnes to 642 tonnes in 1997.<br />
Official imports were permitted for the first time in decades when the Non-Resident <strong>Indian</strong> (NRI) scheme was launched in<br />
March 1992. It enabled NRI’s (and organised NRI syndicates) to import 5 kg of gold every 6 months.<br />
Over the period, official imports accounted for 63% of total imports. NRI’s accounted for 56%. The Special Import Licence<br />
(SIL) scheme that included gold from April 1994 accounted for 7%. Unofficial imports were responsible for 37%.<br />
1998 – 2001 (4 years)<br />
Imports for the domestic market remained largely static, ranging between 640 – 690 tonnes.<br />
Since 1998, authorised banks and Public Sector Undertakings have dominated official imports. Their first imports under the<br />
OGL scheme occurred in November 1997. Banks and PSU’s now account for more than 99%.<br />
Over the period, official imports accounted for approximately 87% of total imports.<br />
<strong>Gold</strong> mine output and gold as a by-product<br />
Primary gold mining yields around 2 tonnes annually. Total gold output increased to 9 tonnes in 2001, due to Birla Copper<br />
starting to process imported copper concentrates in 2000.<br />
Imports for jewellery exporters<br />
Duty-free gold imports for re-export as jewellery (mainly studded with diamonds and other stones) have grown<br />
substantially from 11 tonnes in 1990 to 54 tonnes in 2001 - 2002. These imports are not included in the analysis of the<br />
domestic market.<br />
GROSS SUPPLY<br />
Annual gross supply is much influenced by the amount of old jewellery, coins and bars recycled.<br />
Although the high level of recycling is not under-estimated by <strong>Indian</strong> analysts, it has not been widely publicised outside India.<br />
There are many forms of recycling as recorded in the chapter on “<strong>Gold</strong> Jewellery”.<br />
The <strong>Indian</strong> gold market is so complex, and so variable by State, by urban and rural area, and by retailer, that any national<br />
estimate of recycling can only be indicative. To try to obtain precise estimates is just not possible.<br />
What is important is a broad understanding of the approximate size, nature and annual change in recycling, and how it<br />
impacts on gross and net demand.<br />
Recycling of old jewellery, coins and bars<br />
Although there is great variation by retailer, by rural/urban area and by State, anecdotal evidence suggests (conservatively)<br />
that 40% of new jewellery sold nationally in 2001 was fabricated from old jewellery exchanged for new jewellery or bought<br />
back for cash, or from old coins and bars. This suggests that for every 1,200 kg of gold imported, an additional 800 kg of<br />
old gold was recycled.<br />
Large retailers in several States report an increase in recycling, mainly for exchange purposes, over the past 3 - 4 years.<br />
Compared to 40% in 2001, the national average may have been around 35% in 1998.<br />
In the first 6 months of 2002, due to the spurt in the gold price, recycling nationally is reported to be have exceeded 50%.<br />
AN INTRODUCTION TO THE INDIAN GOLD MARKET 167
GOLD SUPPLY AND DEMAND<br />
Coins and TT bars<br />
Anecdotal evidence suggests that more than 50% of annual coin fabrication is converted into jewellery over time.<br />
It also suggests (at this time) that most TT bars bought for personal hoarding would enter the jewellery market (i.e. sold<br />
for cash), or would be converted into jewellery, over time.<br />
Many coin and TT bar purchases appear to act as deferred purchases of gold jewellery.<br />
Consolidated gross supply<br />
When recycling is taken fully into account, gross annual supply is broadly estimated at 1,053 tonnes in 2001.<br />
Gross supply 2001 2000<br />
New gold 681 680<br />
Recycled gold 372 347<br />
Total 1,053 1,027<br />
Source: See appendix “Indicative gross fabrication and demand”.<br />
To repeat, an estimate of the amount of gold recycled can only be indicative. The important point is that the amount is<br />
substantial, and sensitive to movements in the gold price.<br />
NET DEMAND<br />
In a gold market that comprises hundreds of thousands of family retailers and fabricators, the breakdown of<br />
demand is obliged to rely on an interpretation of anecdotal evidence. There are no firm statistics.<br />
In this section, net gold jewellery demand (i.e. excludes fabrication from recycled gold) and net bar hoarding are combined<br />
for 3 reasons. Both have an investment dimension. Hoarded bars tend to enter the jewellery market over time. Among<br />
analysts there is also not yet a broad consensus about the split. This report does suggest a tentative split, based on<br />
available anecdotal evidence. Its net bar hoarding estimate is low.<br />
1990 – 1997 (8 years)<br />
Net demand for gold in all categories rose rapidly over the period from 178 tonnes in 1990 to 645 tonnes in 1997.<br />
Industrial fabrication increased from less than 2 tonnes to an indicative 18 tonnes, due mainly to an increase in the use of<br />
gold for Zari crafts.<br />
Coin fabrication grew from zero, as fabrication was banned under the <strong>Gold</strong> (Control) Act, to an indicative 19 tonnes.<br />
Net jewellery fabrication & bar hoarding increased from 176 tonnes to 609 tonnes. The reason for its rapid growth was the<br />
outcome of several factors:<br />
• Restrictions on gold ownership during the <strong>Gold</strong> (Control) Act had generated pent-up demand.<br />
• Jewellery became more accessible when the number of retailers increased from 16,000 to more than 200,000.<br />
• <strong>Gold</strong> could be officially imported by NRI’s.<br />
• Population increased by 14%.<br />
• Rural, and especially urban, wealth increased. Industrial production grew by 52%. Agricultural output was high in 1992<br />
- 94 and again in 1996. GDP grew by 37% in real terms.<br />
• Rupee gold price rose slowly and steadily each year, as it had done for decades, until 1996.<br />
• In 1997, when the annual average price fell for the first time in decades (by 12%), gold was viewed as inexpensive in a<br />
booming economy.<br />
1998 – 2001 (4 years)<br />
Net demand in total was largely static over this period, ranging between 650 - 690 tonnes.<br />
Industrial fabrication increased from 18 to an indicative 43 tonnes, due mainly to an increase in demand for gold plating<br />
purposes.<br />
Coin fabrication grew from 23 to an indicative 35 tonnes, influenced by increased corporate demand for coins as gifts and<br />
promotional prizes, and an increase in personal purchases.<br />
Net jewellery fabrication & bar hoarding appears to have declined. In 2001 (603 tonnes) it appears to have been 7% less<br />
than in 1998 (650 tonnes).<br />
Why was net demand largely static when there were so many positive factors such as the following?<br />
• Population grew by 6%.<br />
• GDP increased by 26%.<br />
• <strong>Gold</strong> was less expensive - the price, static in nominal terms, fell in real terms.<br />
168<br />
AN INTRODUCTION TO THE INDIAN GOLD MARKET
GOLD SUPPLY AND DEMAND<br />
The trade attribute static net demand to some inhibiting factors. For example, expenditure on lifestyle products increased<br />
at the expense of gold jewellery. More old gold jewellery was recycled. Among large retailers in major cities, the sale of<br />
diamond jewellery increased. The static rupee gold price weakened gold’s private investment dimension. Importantly, the<br />
rural economy was relatively depressed.<br />
GROSS FABRICATION AND DEMAND<br />
<strong>Gold</strong> jewellery<br />
When exchange and buy-backs for cash are taken into account, the gross fabrication of gold jewellery increases<br />
dramatically.<br />
In 2001, when net fabrication was 583 tonnes, gross fabrication appears to have been around 955 tonnes.<br />
Although the gross estimate can only be indicative, it can be recognised that a small decrease in gross fabrication,<br />
alongside a small increase in exchange and buy-backs, can result in a large decrease in net fabrication. And vice versa.<br />
Example<br />
Assume that gross fabrication over a period of 3 months is normally 300 tonnes, and exchange/buy-backs feed 40% so that<br />
net fabrication is 180 tonnes.<br />
If gross fabrication falls by 10% (30 tonnes) to 270 tonnes, and exchange/buy-backs feed 50% (135 tonnes), net<br />
fabrication would fall by 25% to 135 tonnes.<br />
This scenario is relevant to the first quarter of 2002. When the rupee gold price increased unexpectedly by 10 – 15%, net<br />
fabrication (and imports) fell by more than 50%, while gross fabrication (and demand) appeared to fall by only around<br />
15 - 20%.<br />
Total domestic market<br />
Gross demand for gold in 2001 is estimated at 1,053 tonnes: jewellery (91%), industrial (4%), coins (3%) and net bar<br />
hoarding (2%).<br />
Two important points can be made.<br />
• Jewellery retailers tend to refer to quantities of gold in carat (not fine) gold terms. In carat terms, for example, the<br />
market would be around 1,200 tonnes assuming an average actual caratage of K20.<br />
• The market does not make structural sense, and the comments of retailers also do not make sense, unless the extent<br />
of gross demand is taken into account.<br />
The indicative gross demand estimate of 1,053 tonnes explains why there are approximately 300,000 jewellery retailers,<br />
2 million active goldsmiths and 10,000 refiners.<br />
It puts high tonnages of industrial fabrication (4%), coin fabrication (3%) and net bar hoarding (2%) into perspective.<br />
Jewellery accounts for around 90% of the gross market.<br />
It also makes sense of trade estimates that the total market is well over 1,000 tonnes in carat terms, in some cases<br />
estimated at 2,000 tonnes.<br />
It also explains why net demand (and imports) fell so much more than gross demand in the first six months of 2002.<br />
Total imports<br />
This section has focused on supply and demand within the domestic market. In the appendix, “Total gold imports”,<br />
reference is made to gold imported for re-export as jewellery.<br />
When these imports are combined with those for the domestic market, total annual imports ranged between 700 – 727<br />
tonnes over the 4-year period 1998 – 2001.<br />
When indicative gold jewellery fabrication in 2001 for the domestic market (955 tonnes) is combined with that for export<br />
(54 tonnes), India fabricated more than 1,000 tonnes of gold jewellery.<br />
AN INTRODUCTION TO THE INDIAN GOLD MARKET 169
For the domestic market 1990 - 2001<br />
Excludes the recycling of old gold<br />
Tonnes<br />
Year Official imports Other imports Total Mining Grand Mumbai<br />
NRI SIL OGL Sub- Unofficial Seizures imports and total gold<br />
Total for concentrates for price<br />
domestic domestic per 10 g<br />
use use (Rs)<br />
1990 - - - - 170 6.0 176 2.1 178 3,399<br />
1991 - - - - 150 5.0 155 2.0 157 4,044<br />
1992 93 - - 93 166 3.0 262 1.9 264 4,255<br />
1993 116 - - 116 122 1.5 239 2.1 241 4,384<br />
1994 158 19 - 177 118 1.1 296 2.4 298 4,652<br />
1995 228 21 - 249 134 1.1 384 2.0 386 4,798<br />
1996 256 42 - 298 109 1.1 408 2.7 411 5,191<br />
1997 398 68 62 528 113 1.3 642 2.6 645 4,556<br />
1998 93 2 533 628 60 0.5 688 2.5 691 4,182<br />
1999 4 2 554 560 90 0.9 651 2.6 654 4,333<br />
2000 4 2 526 532 140 0.7 673 7.6 680 4,520<br />
2001 2 1 599 602 70 0.5 672 9.0 681 4,462<br />
Total 1,352 157 2,274 3,783 1,442 22.7 5,246 39.5 5,286 -<br />
Table source: Grendon International Research<br />
GOLD SUPPLY AND DEMAND<br />
NET NEW GOLD SUPPLY<br />
Sources. NRI, SIL, OGL, Seizures: Madhusudan Daga and other sources. Mining: Bureau of Mines, financial year (April-March) used for annual totals.<br />
Unofficial imports: estimates by Madhusudan Daga.<br />
1990 – 1997: High growth over 8 years. From 178 tonnes to 645 tonnes.<br />
1998 – 2001: Largely static market over 4 years. Ranging between 650 – 690 tonnes.<br />
170<br />
AN INTRODUCTION TO THE INDIAN GOLD MARKET
For the domestic market 1990 - 2001<br />
Excludes the recycling of old gold<br />
Tonnes<br />
Year Industrial fabrication Coin Jewellery & Total<br />
Decorative Medical Electronic Total fabrication bar<br />
hoarding<br />
(net usage)<br />
1990 1.1 0.2 0.2 1.5 - 176 178<br />
1991 3.5 0.2 0.5 4.2 4 149 157<br />
1992 5.0 0.3 0.5 5.8 7 251 264<br />
1993 16.7 1.0 1.0 18.7 10 212 241<br />
1994 16.3 1.0 1.0 18.3 13 267 298<br />
1995 14.0 2.0 1.0 17.0 16 253 386<br />
1996 16.0 2.0 1.0 19.0 16 376 411<br />
1997 14.5 2.0 1.0 17.5 19 609 645<br />
1998 15.0 2.0 1.2 18.2 23 650 691<br />
1999 24.0 3.0 1.2 28.2 27 599 654<br />
2000 27.0 4.0 1.0 32.0 31 617 680<br />
2001 37.0 5.0 1.0 43.0 35 603 681<br />
Total 190 23 11 223 201 4,862 5,286<br />
Table source: Grendon International Research<br />
GOLD SUPPLY AND DEMAND<br />
INDICATIVE USAGE OF NET NEW GOLD SUPPLY<br />
Sources. Grand total: uses figures in “Net New <strong>Gold</strong> Supply” table. Industrial fabrication (decorative, medical and electronic): estimates by<br />
Madhusudan Daga. Fabrication of minted coins/bars: GIR in consultation with fabricators, and Madhusudan Daga who believes fabrication in recent<br />
years may have been higher. Jewellery fabrication (net) & bar hoarding (net): a residual figure.<br />
Between 1990 and 2001:<br />
• Industrial fabrication has grown from less than 2 tonnes to an indicative 43 tonnes.<br />
• Coin fabrication has grown from zero to an indicative 35 tonnes.<br />
• Net gold usage for jewellery & bar hoarding grew to 650 tonnes in 1998, but has since fallen to about 600 tonnes.<br />
Net gold jewellery demand & net bar hoarding are combined for 3 reasons.<br />
Both have an investment dimension. Many hoarded bars enter the jewellery market over time. Among analysts there is not<br />
yet a broad consensus about the split.<br />
AN INTRODUCTION TO THE INDIAN GOLD MARKET 171
GOLD SUPPLY AND DEMAND<br />
INDICATIVE GROSS JEWELLERY FABRICATION<br />
For the domestic market 2001 and 2000<br />
Includes the recycling of old gold<br />
Tonnes<br />
Category 2001 2000<br />
Jewellery & bar hoarding<br />
(net usage) 603 617<br />
Less<br />
Increase in inventories 25 (25)<br />
Increase in net bar hoarding* 20 (14)<br />
Net sales 558 578<br />
Add recycling<br />
Exchange 279 254<br />
Buy-backs for cash 65 65<br />
Coins and bars 28 28<br />
Sub-total 372 347<br />
Gross sales 930 925<br />
Add back<br />
Increase in jewellery inventories 25 25<br />
Gross fabrication 955 950<br />
Table source: Grendon International Research<br />
Basis: 40% increase in inventories since 1997. Net bar hoarding: 3% (2001) and 2% (2000) of imports. Recycling as a proportion of nationwide<br />
sales, including exchange, buy-backs for cash and dishoarded bars and coins: 40% (2001) and 37.5% (2000). This table does not include recycling<br />
through non-jewellery retailers. However, anecdotal evidence suggests that (outside Mumbai) most recycling occurs through jewellery retailers.<br />
* Some analysts consider the amount of net bar hoarding to be higher.<br />
An indicative estimate of gross jewellery fabrication for 2001 is 955 tonnes. It includes 372 tonnes of<br />
recycled gold.<br />
The table highlights the extent to which jewellery fabrication relies on the recycling of old jewellery, coins and bars.<br />
172<br />
AN INTRODUCTION TO THE INDIAN GOLD MARKET
GOLD SUPPLY AND DEMAND<br />
INDICATIVE GROSS FABRICATION AND DEMAND<br />
For the domestic market in 2001 and 2000<br />
Includes the recycling of old gold<br />
Tonnes<br />
Fabrication 2001 2000<br />
Tonnes % Split Tonnes % Split<br />
Industrial 43 4 32 3<br />
Jewellery<br />
Gross sales 930 88 925 90<br />
Increase in inventories 25 2 25 2<br />
Sub-total 955 91* 950 93*<br />
Coins 35 3 31 3<br />
Gross fabrication 1,033 98 1,013 99<br />
Net bar hoarding 20 2 14 < 2<br />
Gross demand 1,053 100 1,027 100<br />
Table source: Grendon International Research<br />
Sources. Derived from previous tables. * Totals do not add up due to rounding.<br />
The market does not make structural sense, and the comments of the trade do not make sense, unless the<br />
extent of gross fabrication is taken into account.<br />
The indicative estimate of 1,053 tonnes puts the tonnages of industrial fabrication (4%), coin fabrication (3%) and net bar<br />
hoarding (2%) into perspective. Jewellery accounts for around 90% of the gross market.<br />
AN INTRODUCTION TO THE INDIAN GOLD MARKET 173
GOLD SUPPLY AND DEMAND<br />
TOTAL GOLD IMPORTS<br />
Includes gold imported for jewellery exporters 1990 - 2001<br />
Year For For Grand<br />
domestic jewellery Total<br />
gold exporters<br />
usage<br />
1990 176 11 187<br />
1991 155 17 172<br />
1992 262 18 280<br />
1993 239 24 263<br />
1994 296 25 321<br />
1995 384 23 407<br />
1996 408 29 437<br />
1997 642 24 666<br />
1998 688 35 723<br />
1999 651 49 700<br />
2000 673 54 727<br />
2001 672 54 726<br />
Total 5,246 363 5,609<br />
Table source: Grendon International Research<br />
Sources. Total for domestic usage: taken from table “Net new gold supply”. For jewellery exporters: from various sources. 1990-1992: WGC. 1993-<br />
1997: derived from GJEPC financial year (April-March) rupee statistics. 1998-2001: uses GJEPC financial year kilogramme statistics.<br />
Since 1990, gross imports (including imports for jewellery exporters) have increased from 187 tonnes to 726<br />
tonnes.<br />
The import of gold for re-export as jewellery has grown from 11 tonnes to 54 tonnes.<br />
174<br />
AN INTRODUCTION TO THE INDIAN GOLD MARKET
GOLD SUPPLY AND DEMAND<br />
INDICATIVE ABOVE GROUND GOLD STOCKS<br />
Based on estimated gold imports since 1831<br />
Years Category Tonnes<br />
1831 – 1931 Net imports 3,700<br />
1832 – 1940 Net exports (1,400)<br />
Stock at end of 1940 2,300<br />
1941 – 1950 Net imports * 311<br />
1951 – 1957 Unofficial imports 653<br />
Stock at end of 1957 ** 3,264<br />
1958 – 1963 Unofficial imports 520<br />
1964 – 1967 Unofficial imports 720<br />
1968 – 1973 Unofficial imports 750<br />
1974 – 1978 Unofficial imports 210<br />
1979 Unofficial imports 11<br />
1980 Unofficial exports (9)<br />
Stock at end of 1980 5,466<br />
1981 – 1985 Unofficial imports 381<br />
1986 – 1990 Unofficial imports 520<br />
Stock at end of 1989 6,367<br />
1990 – 1994 Official imports and other sources 1,137<br />
1995 – 1999 Official imports and other sources 2,787<br />
2000 – 2001 Official imports and other sources 1,362<br />
Table source: Grendon International Research<br />
Stock at end of 2001 11,653<br />
Including official gold reserves 12,011<br />
of 358 tonnes at end 2001<br />
Sources: * 1831 – 1957: ** Reserve Bank of India Bulletin, April 1958. 1958-1980: Estimates by Mr Shantilal Sonawala, former President of Bombay<br />
Bullion Association. 1981-1989: <strong>Gold</strong> Fields Mineral Services Ltd (GFMS).<br />
Stocks at the end of 2001 are recorded at approximately 12,000 tonnes. 45% of the stock (5,300 tonnes)<br />
has been acquired since 1990.<br />
The 181 million families in India hold an average of 64 grammes of fine gold (around 85 grammes of carat gold). As 26%<br />
of the population is below the poverty line, the top 50% would obviously hold substantially more than the average.<br />
At least 90% appears to be held as gold jewellery. Anecdotal evidence (at this time) suggests that around 5% may be held<br />
in the form of coins and bars. The net accumulation of coins and bars is considered low because much has been<br />
converted into jewellery. In addition, it was illegal to fabricate coins or own bars during the <strong>Gold</strong> (Control) Act period.<br />
Some <strong>Indian</strong> analysts believe that historical estimates of the amount of gold imported into India may be<br />
understated.<br />
AN INTRODUCTION TO THE INDIAN GOLD MARKET 175
176<br />
AN INTRODUCTION TO THE INDIAN GOLD MARKET<br />
World <strong>Gold</strong> Council<br />
Communication<br />
Bibliography<br />
SUPPLEMENTARY SECTIONS<br />
CONTENTS<br />
About Virtual Metals Research & Consulting Ltd<br />
About Grendon International Research Pty Ltd<br />
The World <strong>Gold</strong> Council has been supporting the <strong>Indian</strong> gold market since 1993.<br />
AN INTRODUCTION TO THE INDIAN GOLD MARKET
WORLD GOLD COUNCIL<br />
The World <strong>Gold</strong> Council (WGC) is an international organisation formed and funded by leading gold mining<br />
companies from around the world to increase the demand for gold.<br />
Established in 1987, the WGC has offices worldwide. Its international headquarters is in London.<br />
WGC India has been active since 1993. Its headquarters is in Mumbai.<br />
WGC India undertakes advertising, promotional and PR programmes, as well as market research. It provides technical<br />
support to major fabricators. It also liaises with government institutions, including the Reserve Bank of India, Ministry of<br />
Finance and Bureau of <strong>Indian</strong> Standards.<br />
Its market-related programmes to support the gold jewellery industry include the following:<br />
TV and Press Advertising Programmes<br />
Undertakes generic campaigns, as well as partly WGC-funded co-operative advertising campaigns with trade partners.<br />
Encourages retailers to associate their showrooms with all promotional campaigns undertaken by the WGC.<br />
PR Programmes<br />
Undertakes extensive trade and consumer PR programmes. Encourages, for example, media coverage of gold demand<br />
trends, gold jewellery fashion trends and the investment-related advantages of owning gold and gold jewellery.<br />
Market Research<br />
Undertakes trade and consumer research to assist in the formulation of appropriate promotional strategies.<br />
Collection g<br />
Launched in 2002 to stimulate gold jewellery purchases by the younger generation. More than 125 leading retailers now<br />
stock the Collection’s wide range of innovative lightweight items, 25 g and less. All items are hallmarked.<br />
Swarnanjali Jewellery Design Contest<br />
Encourages designers to develop innovative designs under 3 categories: bridal, formal and casual. The top 10 designs in<br />
each category are fabricated for national display in about 15 cities. Initiated in 1997, more than 15,000 designers have<br />
entered the contests.<br />
Hallmarking<br />
Encourages leading retailers to hallmark their jewellery as part of a long-term programme. The Bureau of <strong>Indian</strong> Standards<br />
(BIS) launched its national programme in 2000.<br />
<strong>Gold</strong> Clubs<br />
Encourages leading retailers, fabricators and wholesalers in major centres to establish <strong>Gold</strong> Clubs in order to discuss<br />
important trade issues. Established in Mumbai and Chennai.<br />
Shopping Festivals<br />
Encourages groups of retailers to stage a “festival”, usually for a period of one month. WGC sometimes subsidises<br />
advertising and promotion. The first festival was staged in Coimbatore in 1998. Festivals have also taken place in Mumbai,<br />
New Delhi and Pondicherry.<br />
Local Festivals<br />
Encourages groups of retailers to create a jewellery collection for specific local festivals, such as Diwali, Pongal, Durga Pooja<br />
and Onam in the appropriate region. WGC sometimes subsidises advertising and promotion. The first festivals were staged<br />
in 1997.<br />
<strong>Gold</strong> Exhibitions<br />
Encourages groups of retailers, usually 15 - 20 from inside and outside the State, to display and sell their jewellery at an<br />
urban venue. WGC sometimes subsidises advertising and promotion. Exhibitions have been staged since 1997.<br />
Up-country Franchise Initiatives<br />
Encourages major urban retailers to franchise their brand names and jewellery to less sophisticated retailers in smaller<br />
towns. Initiated in the south in 2001.<br />
Technical Education<br />
Technical workshops and seminars have been held annually in 6 - 7 fabrication centres since 1996. Designed for domestic<br />
fabricators and goldsmiths, exporters and students.<br />
Publications<br />
Available to leading trade entities.<br />
<strong>Gold</strong> Demand Trends. Statistical review of the international gold market. Quarterly.<br />
<strong>Gold</strong>. Magazine with articles relating to the gold market worldwide. Quarterly.<br />
<strong>Gold</strong> Technology. Magazine with technical articles for fabricators. 3 - 4 times each year.<br />
AN INTRODUCTION TO THE INDIAN GOLD MARKET 177
178<br />
WORLD GOLD COUNCIL<br />
GENERIC ADVERTISING<br />
A WGC advertisement supporting the generic promotion of gold jewellery in 2002.<br />
AN INTRODUCTION TO THE INDIAN GOLD MARKET
WORLD GOLD COUNCIL<br />
TRADITIONAL GOLD JEWELLERY<br />
The WGC supports the promotion of traditional gold jewellery not only in its festival programmes but also<br />
in partnered programmes with leading retailers.<br />
AN INTRODUCTION TO THE INDIAN GOLD MARKET 179
180<br />
WORLD GOLD COUNCIL<br />
SHOPPING FESTIVALS<br />
The WGC works closely with leading retailers to stage gold jewellery “Shopping Festivals” in major cities.<br />
In 2002, the WGC supported festivals in New Delhi, Mumbai, Tamil Nadu and Kerala.<br />
AN INTRODUCTION TO THE INDIAN GOLD MARKET
WORLD GOLD COUNCIL<br />
LOCAL FESTIVALS<br />
The WGC encourages the promotion of gold jewellery at the time of religious, harvest and other local<br />
festivals. In 2002, in partnership with leading retailers, the WGC organised advertising and advertorial<br />
programmes covering 8 important festivals.<br />
AN INTRODUCTION TO THE INDIAN GOLD MARKET 181
182<br />
WORLD GOLD COUNCIL<br />
GOLD JEWELLERY EXHIBITIONS<br />
The WGC encourages the staging of gold jewellery exhibitions for consumers.<br />
The Jewels of India exhibition (top) in Bangalore and the Sonar Sansar <strong>Gold</strong> World exhibition (below)<br />
in Kolkata, for example, are organised each year by 50 – 60 leading retailers from around India with<br />
the support of the WGC.<br />
AN INTRODUCTION TO THE INDIAN GOLD MARKET
WORLD GOLD COUNCIL<br />
YOUNGER GENERATION<br />
WGC advertisements supporting the Collection g gold jewellery programme in 2002.<br />
The programme, targeted at young women, offers more than 125 participating retailers access to 1,200<br />
items of gold jewellery that are unique, stylish, lightweight and in K22 gold. The collection includes<br />
pendants, earrings, bracelets, rings, bangles and complete sets.<br />
AN INTRODUCTION TO THE INDIAN GOLD MARKET 183
• <strong>Indian</strong> Government institutions<br />
• Bullion importers<br />
• International gold dealers<br />
• Shipping agents<br />
• International gold refiners<br />
• Refiners and coin fabricators<br />
• <strong>Gold</strong> jewellery exporters<br />
• National Institute of Jewellery Design<br />
• Consumer jewellery publication<br />
• <strong>Gold</strong> mining and exploration<br />
• <strong>Gold</strong> market consultants in India<br />
• London Bullion Market Association<br />
• World <strong>Gold</strong> Council<br />
International telephone code for India: 91<br />
MINISTRY OF FINANCE<br />
Department of Economic Affairs<br />
Ministry of Finance, North Block, New Delhi 110 001.<br />
Tel: (011) 301 5292<br />
Fax: (011) 301 3355<br />
Central Board of Customs & Excise<br />
Ministry of Finance, Department of Revenue, North Block,<br />
New Delhi 110 001.<br />
Tel: (011) 301 3908<br />
Fax: (011) 301 5173<br />
RESERVE BANK OF INDIA<br />
Department of Banking Operations & Development<br />
Reserve Bank of India, Central Office, Centre-1,<br />
World Trade Centre, Cuffe Parade, Mumbai 400 005.<br />
Tel: (022) 2218 9131<br />
Fax: (022) 2215 5954<br />
email: rbidoco@bom3.vsnl.net.in<br />
Exchange Control Department<br />
Reserve Bank of India, Central Office, Forex Markets<br />
Division, Amar Building, Fort, Mumbai 400 001.<br />
Tel: (022) 2261 7912<br />
Fax: (022) 2261 1427<br />
Department of External Investments & Operations<br />
Reserve Bank of India, 22nd Floor, Central Office,<br />
Shahid Bhagat Singh Road, Mumbai 400 001.<br />
Tel: (022) 2266 1602<br />
Fax: (022) 2266 4667<br />
MINISTRY OF COMMERCE AND INDUSTRY<br />
Directorate General of Foreign Trade<br />
Gate No. 2, Udyog Bhavan, 1 Rafi Marg,<br />
New Delhi 110 011.<br />
Tel: (011) 301 6466<br />
Fax: (011) 301 8613<br />
184<br />
CATEGORIES<br />
INDIAN GOVERNMENT INSTITUTIONS<br />
COMMUNICATION<br />
Directorate General of Commercial Intelligence<br />
and Statistics<br />
1 Council House Street, Kolkata 700 001.<br />
Tel: (011) 301 3908<br />
Fax: (011) 301 5173<br />
MINISTRY OF CONSUMER AFFAIRS, FOOD AND<br />
DISTRIBUTION<br />
Bureau of <strong>Indian</strong> Standards<br />
Manak Bhavan, 9 Bahadur Shah Zafar Marg,<br />
New Delhi 110 002.<br />
Tel: (011) 323 0131 or 3375<br />
Fax: (011) 323 9382<br />
Email: bis@vsnl.com<br />
MINISTRY OF COAL AND MINES<br />
<strong>Indian</strong> Bureau of Mines<br />
Indira Bhavan, Civil Lines, Nagpur 400 001.<br />
Tel: (0712) 533 631<br />
Fax: (0712) 533 041<br />
Email: ibmnag@mah.nic.in<br />
BULLION IMPORTERS<br />
PUBLIC SECTOR BANKS<br />
State Bank of India<br />
<strong>Gold</strong> Banking Department<br />
State Bank Bhavan, 11th Floor, Madame Cama Road,<br />
Mumbai 400 021.<br />
Tel: (022) 2202 2426 - Ext 5423<br />
Fax: (022) 2202 2768.<br />
Website: www.sbi.com.in, or www.statebankofindia.com<br />
Allahabad Bank<br />
<strong>Gold</strong> Banking, Foreign Department<br />
Head Office, 119 Park Street, 2nd Floor, Kolkata 700 016.<br />
Tel: (033) 229 2310 or 229 7896<br />
Fax: (033) 217 7363<br />
Email: albfd@giascl01.net.in<br />
Bank of India<br />
Bullion Banking Department<br />
Express Towers, 7th Floor, Nariman Point,<br />
Mumbai 400 021.<br />
Tel: (022) 2202 3020 - Ext 387<br />
Fax: (022) 2202 2831<br />
Email: intidept@bom3.vsnl.net.in<br />
Website: www.bankofindia.com<br />
Corporation Bank<br />
Precious Metals Cell<br />
15 Mittal Chambers, Nariman Point, Mumbai 400 021.<br />
Tel: (022) 2283 2429 or 2202 3304<br />
Fax: (022) 2285 6202 or 2284 4798<br />
Website: www.corpbank.com<br />
AN INTRODUCTION TO THE INDIAN GOLD MARKET
<strong>Indian</strong> Overseas Bank<br />
Precious Metals Section, Foreign Exchange Department<br />
Central Office, Chennai 600 002.<br />
Tel: (044) 859 1566<br />
Fax: (044) 859 1564<br />
Email: iobfx@vsnl.com<br />
Website: www.iob.com<br />
Punjab National Bank<br />
<strong>Gold</strong> Cell, International Banking Division<br />
7 Bhikhaiji Cama Place, New Delhi 110 066.<br />
Tel: (011) 618 5981 or 617 6297<br />
Fax: (011) 619 3315<br />
Email: pnbibd@ndf.vsnl.net.in<br />
Website: www.pnbindia.com<br />
FOREIGN BANKS<br />
ABN-AMRO Bank<br />
Precious Metals Sales Department<br />
14 Veer Nariman Road, Mumbai 400 023.<br />
Tel: (022) 2287 2957<br />
Fax: (022) 2287 3143<br />
Email: in.preciousmetals@ap.abnamro.com<br />
Website: www.abnamroindia.com<br />
Standard Chartered Bank<br />
Trade Products Department - Bullion<br />
90 Mahatma Gandhi Road, Mumbai 400 001.<br />
Tel: (022) 2269 0288<br />
Fax: (022) 2270 1063<br />
Website: www.standardchartered.com<br />
The Bank of Nova Scotia<br />
ScotiaMocatta<br />
11 Maker Chambers VI, 220 Nariman Point,<br />
Mumbai 400 021.<br />
Tel: (022) 2288 0994 or 2288 3411 - 3415<br />
Fax: (022) 2288 1078<br />
Website: www.scotiabank.com<br />
The Hongkong and Shanghai Banking Corporation<br />
Limited - HSBC<br />
Precious Metals Department<br />
52/60 Mahatma Gandhi Road, Mumbai 400 001.<br />
Tel: (022) 2268 1110<br />
Fax: (022) 2269 2305<br />
Website: www.hsbc.co.in<br />
NEWLY-AUTHORISED BANKS*<br />
Union Bank of India<br />
239 Vidhan Bhavan Marg, Nariman Point,<br />
Mumbai 400 021.<br />
Email: union@bom3.vsnl.net.in<br />
Website: www.unionbankofindia.com<br />
ICICI Bank Ltd<br />
ICICI Bank Towers, Bandra-Kurla Complex,<br />
Mumbai 400 051.<br />
Tel: (022) 2653 1037 - 42<br />
Fax: (022) 2653 1089<br />
Website: www.icicibank.com<br />
COMMUNICATION<br />
The HDFC Bank Ltd<br />
Sandoz House, Dr Annie Besant Road, Worli,<br />
Mumbai 400 018<br />
Tel: (022) 2496 1616 or 2498 8484<br />
Fax: (022) 2496 5235 or 2495 1771<br />
Website: www.hdfcbank.com<br />
* Source: <strong>Indian</strong> Banking Year <strong>Book</strong> 2000<br />
PUBLIC SECTOR UNDERTAKINGS<br />
MMTC Limited<br />
Gem & Jewellery Department<br />
Core-1, Scope Complex, 7 Institutional Area,<br />
Lodhi Road, New Delhi 110 003.<br />
Tel: (011) 436 2200 or 1336<br />
Fax: (011) 436 4103<br />
Email: gold@mmtc.delhi.nic.in<br />
Website: www.mmtclimited.com<br />
PEC Ltd<br />
<strong>Gold</strong> Division<br />
‘Hansalaya’ 15, Barakhamba Road, New Delhi 110 001.<br />
Tel: (011) 371 3932<br />
Fax: (011) 331 5508 or 3804<br />
Website: www.peclimited.com<br />
The HHEC of India Ltd<br />
Jewellery & Import Division<br />
Jawahar Vyapar Bhawan Annexe, 1 Tolstoy Marg,<br />
New Delhi 110 001.<br />
Tel: (011) 370 1185 or 1086<br />
Fax: (011) 370 1051<br />
Email: hhecnd@ndc.vsnl.net.in<br />
Website: www.hhecworld.com<br />
The State Trading Corporation of India Ltd<br />
Marketing Department<br />
Jawahar Vyapar Bhawan, 1 Tolstoy Marg,<br />
New Delhi 110 001.<br />
Tel: (011) 331 3177 or 370 1100<br />
Fax: (011) 332 4416<br />
Website: www.stcindia.com<br />
INTERNATIONAL GOLD DEALERS<br />
LIAISON OFFICES IN INDIA<br />
Mitsui & Co<br />
Steel & Metals Section<br />
Mafatlal Centre, 7th Floor, 238 Nariman Point,<br />
Mumbai 400 021.<br />
Tel: (022) 2204 8192<br />
Fax: (022) 2204 6099<br />
Societe Generale<br />
Commodity Markets & Export Finance<br />
Maker Chambers IV, 13th Floor, Nariman Point,<br />
Mumbai 400 021.<br />
Tel: (022) 5630 9530 or 5687 0909<br />
Fax: (022) 5604 5459<br />
Website: www.socegen.com<br />
AN INTRODUCTION TO THE INDIAN GOLD MARKET 185
OFFICES OUTSIDE INDIA<br />
Commerzbank Singapore<br />
8 Shenton Way, #43-01 Temasek Tower,<br />
Singapore 068811.<br />
Tel: 65-6372 1742<br />
Fax: 65-6225 0414<br />
Credit Suisse First Boston<br />
Uetlibergstrasse 231, CH-8070, Zurich, Switzerland.<br />
Tel: 41-1-333 6826<br />
Fax: 41-1-333 5515<br />
HSBC Bank USA London Branch<br />
Thames Exchange, 10 Queen Street Place,<br />
London EC4R 1BQ, United Kingdom.<br />
Tel: 44-20-7621 7801<br />
Fax: 44-20-7621 7878<br />
Mitsui & Co Precious Metals Inc, London Branch<br />
Wren House, 15-23 Carter Lane, London EC4V 5HH,<br />
United Kingdom.<br />
Tel: 44-20-7246 8935<br />
Fax: 44-20-7248 6050<br />
MKS Finance SA<br />
10 Promenade St Antoine, Geneva 3, CH-1211,<br />
Switzerland.<br />
Tel: 41-22-818 5200<br />
Fax: 41-22-311 1800<br />
N.M. Rothschild & Sons Limited<br />
New Court, St Swithin’s Lane, London EC4P 4DU,<br />
United Kingdom.<br />
Tel: 44-207-280 5000<br />
Fax: 44-207-280 5095<br />
Societe Generale<br />
Tour Societe Generale, 17 Cours Valmy,<br />
92987 Paris La Defense Cedex, France.<br />
Tel: 33-1-4213 3963<br />
Fax: 33-1-4213 4697<br />
Standard Bank London Ltd<br />
Cannon Bridge House, 25 Dowgate Hill,<br />
London EC4R 2SB, United Kingdom.<br />
Tel: 44-207-283 4343<br />
Fax: 44-207-815 4236<br />
The Bank of Nova Scotia – ScotiaMocatta<br />
80, Cheapside, London EC2V 6LD, United Kingdom.<br />
Tel: 44-207-489 1200<br />
UBS Warburg<br />
Precious Metals Distribution, P O Box, CH-8098, Zurich,<br />
Switzerland.<br />
Tel: 41-1-239 4111<br />
Fax: 41-1-239 4434<br />
186<br />
COMMUNICATION<br />
SHIPPING AGENTS<br />
Brink’s Arya India Private Limited<br />
International House, 1st Marine Cross Road, Churchgate,<br />
Mumbai 400 020.<br />
Tel: (022) 5638 4900<br />
Fax: (022) 5638 4901<br />
Email: gs@brinksarya.com<br />
Group 4 Securitas Cash Services (P) Ltd<br />
Panchwati, 82-A, Sector-18, Gurgaon 122 016.<br />
Tel: (0124) 639 8888<br />
Fax: (0124) 639 7129<br />
Securitrans India Pvt Ltd<br />
A-27/1, Mahipalpur Extension, Mahipalpur,<br />
New Delhi 110 037.<br />
Tel: (011) 678 1823 or 1961 or 1983 or 3826<br />
Fax: (011) 678 1807 or 1978<br />
Email: finance@apsecuritas.com<br />
Website: www.apsecuritas.com<br />
INTERNATIONAL GOLD REFINERS<br />
AN INTRODUCTION TO THE INDIAN GOLD MARKET<br />
<strong>Gold</strong> refiners that normally produce TT bars for<br />
international gold dealers:<br />
Australian <strong>Gold</strong> Refineries<br />
Horrie Miller Drive, Newburn, WA 6104, Australia.<br />
Tel: 61-8-9479 9999<br />
Fax: 61-8-9479 9909<br />
Email: admin@agrjv.com.au<br />
Harmony <strong>Gold</strong> Mining Company Ltd<br />
Harmony Refinery, P.O. Box 1, Glen Harmony 9435,<br />
South Africa.<br />
Commercial enquiries:<br />
Tel: 27-11-411 2240<br />
Fax: 27-11-411 2266<br />
Rand Refinery Limited<br />
Refinery Road, Industries West, PO Box 565, Germiston<br />
1400, South Africa.<br />
Tel: 27-11-873 2222<br />
Fax: 27-11-825 1806<br />
Johnson Matthey Plc<br />
Orchard Road, Royston, Hertfordshire, SG8 5HE,<br />
United Kingdom.<br />
Tel: 44-1763-253 000<br />
Fax: 44-1763 253 821<br />
<strong>Gold</strong> refiners in Switzerland whose TT bars are normally<br />
sold by associated international gold dealers:<br />
Argor-Heraeus SA<br />
Contact: Commerzbank Singapore<br />
Metalor Technologies SA<br />
Contact: UBS Warburg<br />
Pamp SA<br />
Contact: MKS Finance SA<br />
Valcambi SA<br />
Contact: Credit Suisse First Boston
REFINERS AND COIN FABRICATORS<br />
WEST<br />
India Government Mint, Mumbai<br />
Shahid Bhagat Singh Marg, Mumbai 400 023.<br />
Tel: (022) 2266 1838<br />
Fax: (022) 2266 1450<br />
Shirpur <strong>Gold</strong> Refinery Ltd<br />
Vikas Centre, 104 S.V. Road, Santacruz (West),<br />
Mumbai 400 054.<br />
Tel: (022) 2611 6400 or 1666<br />
Fax: (022) 2611 6705 or 615 2196<br />
Narrondass Manordass<br />
135 Sheikh Memon Street, Mumbai 400 002.<br />
Tel: (022) 2342 6783 or 0421<br />
Fax: (022) 2341 0776<br />
National India Bullion Refinery Unit No 1<br />
Andheri-Kurla Road, Safaid Pool, Mumbai 400 072.<br />
Tel: (022) 2851 0542<br />
Fax: (022) 2851 5390<br />
National Refinery Private Ltd<br />
87 Tardeo Road, Mumbai 400 034.<br />
Tel: (022) 2495 1263 or 1264<br />
Fax: (022) 2495 1229<br />
28 1st Agiary Lane, Zaveri Bazaar, Mumbai 400 003.<br />
Tel: (022) 2342 2144<br />
Email: nrpl@nationalrefinery.com<br />
Parekh Platinum Ltd<br />
16B, Samhita Industrial Estate, Off Andheri Kurla Road,<br />
Mumbai 400 072.<br />
Tel: (022) 2851 0205 or 0501 or 3588<br />
Fax: (022) 2851 2219<br />
Email: pplbom@bom3.vsnl.net.in<br />
Gujarat <strong>Gold</strong> Centre<br />
Gujarat Hosiery Mill Compound, Gomtipur Road,<br />
Ahmedabad 300 021, Gujarat.<br />
Tel: (079) 212 5132 or 216 0851<br />
Fax: (079) 214 6187<br />
Email: ggc@icenet.net<br />
SOUTH<br />
Bangalore Refinery (P) Ltd<br />
A-18, 3rd Stage, Peenya Industrial Estate,<br />
Bangalore 560 058, Karnataka.<br />
Tel: (080) 836 1183 or 1347<br />
Fax: (080) 836 3786<br />
Chemmanur <strong>Gold</strong> Refinery Pvt Ltd<br />
CGR House, 55/2458, Alappat Road Extension,<br />
Ravipuram, Cochin - 15, Kerala.<br />
Tel: (0484) 351 746 or 749<br />
Fax: (0484) 373 250<br />
Email: mail@chemmanurgold.com<br />
COMMUNICATION<br />
VNM <strong>Gold</strong><br />
Palayam Road, Calicut 673 001, Kerala.<br />
Tel: (0495) 722 125 or 924<br />
Fax: (0495) 720 526<br />
Email: vnmgold@vsnl.com<br />
GOLD JEWELLERY EXPORTERS<br />
The Gem & Jewellery Export Promotion Council<br />
Diamond Plaza, 5th Floor, 391-A, Dr D.B. Marg,<br />
Mumbai 400 004.<br />
Tel: (022) 2382 1806 or 2380 6916.<br />
Fax: (022) 2380 8752 or 2380 4958<br />
Email: gjepc@vsnl.com<br />
Exhibition Cell: gjepc@bol.net.in<br />
Website: www.gjepc.org<br />
The list below refers to the 5 GJEPC Award Winners in<br />
2000 - 2001 that fabricate plain and studded gold<br />
jewellery, as well as Inter Classik - it provided information<br />
on SEEPZ (Mumbai).<br />
Modern Impex<br />
7 Camac Street, Azimganj House, Block No. 308,<br />
Kolkata 700 017.<br />
Tel: (033) 282 0415 or 9017<br />
Fax: (033) 282 8906.<br />
PP Jewellers<br />
2708 Bank Street, Karol Bagh, New Delhi 110 005.<br />
Tel: (011) 575 7711 or 573 1697<br />
Fax: (011) 575 8811 or 578 7640<br />
Email: ppjewellers@ppjewellers.org<br />
Rajesh Exports Ltd<br />
Batavia Chambers, Kumara Krupa Road,<br />
Kumara Park East, Bangalore 560 001.<br />
Tel: (080) 226 6735 or 0443<br />
Fax: (080) 225 9503<br />
Merrygold Jewellers<br />
Conwood House, Yashodham, Gen. A.K. Vaidya Marg,<br />
Goregaon (East), Mumbai 400 063.<br />
Tel: (022) 2873 4375 or 3983<br />
Fax: (022) 2873 3910<br />
Email: goldfinger@vsnl.com<br />
Vaibhav Gems Ltd<br />
K-6B Adarsh Nagar Road, Jaipur 302 004.<br />
Tel: (0141) 601 020<br />
Fax: (0141) 603 228<br />
Email: vgl@vaibhavgems.com<br />
Inter Classik Jewellery (I) Pvt Ltd<br />
Plot No. 2 & 3, Opposite G & J Complex - II, SEEPZ,<br />
Andheri (E), Mumbai 400 096.<br />
Tel: (022) 2829 0035 or 0683<br />
Fax: (022) 2829 0668<br />
Email: intclas@bom5.vsnl.net.in<br />
AN INTRODUCTION TO THE INDIAN GOLD MARKET 187
The NIJD in Ahmedabad is one of several organisations in<br />
India that offers training courses for jewellery fabricators<br />
and retailers.<br />
National Institute of Jewelery Design<br />
Dhirajba Gordhandas Zaveri Education and Research<br />
Foundation, 9/10 Panchratna, Panchwati, C.G. Road,<br />
Ahmedabad 380 006, Gujurat.<br />
Tel: (079) 642 3400 or 5400<br />
Fax: (079) 656 3473<br />
Email: nijd@dhirajba.org<br />
Website: www.dhirajba.org<br />
The Art of Jewellery, launched in January 2002, is a new<br />
magazine for jewellery consumers. Published in<br />
Bangalore, it focuses on south India.<br />
Dipti Publications<br />
184 Indiranagar 2nd Stage, Bangalore 560 038.<br />
Telephone:<br />
Bangalore (080) 528 0178<br />
Chennai (044) 822 9925<br />
Hyderabad (040) 790 3412<br />
Jaipur (0141) 301 473<br />
New Delhi (011) 723 2075<br />
<strong>Indian</strong> Bureau of Mines<br />
Indira Bhavan, Civil Lines, Nagpur 440 001.<br />
Tel: (0712) 524 500 or 792 (Extension: 1105)*<br />
Fax: (0712) 532 471<br />
Email: ibmnag@mah.nic.in<br />
Website: www.ibm.nic.in<br />
*Extension for ordering publications<br />
The Hutti <strong>Gold</strong> Mines Co Ltd (HGML)<br />
No 6/13, Gurappa Avenue, Primrose Road Cross,<br />
Bangalore 560 025, Karnataka.<br />
Tel: (080) 532 3840.<br />
Fax: (080) 532 4245<br />
Email: hgml@vsnl.com<br />
M/s Bharat <strong>Gold</strong> Mines Ltd (BGML)<br />
Suvarna Bhavan, Oorgaum, P.O. Kolar <strong>Gold</strong> Field,<br />
Karnataka 563 120.<br />
Fax: (08153) 60330<br />
M/s Hindustan Copper Ltd (HCL)<br />
Tamra Bhavan, 1 Ashutosh Chowdury Avenue,<br />
Kolkata 700 019.<br />
Fax: (033) 240 8478 or 247 8640<br />
Indo-Gulf Corporation Ltd (Birla Copper)<br />
Unit Birla Copper, P.O. Box Dahej Lakhigam, Dist.<br />
Bharuch, Gujarat 392 130.<br />
Fax: (091) 2641 56002/3<br />
188<br />
NATIONAL INSTITUTE OF JEWELLERY<br />
DESIGN (NIJD)<br />
CONSUMER JEWELLERY PUBLICATION<br />
GOLD MINING AND EXPLORATION<br />
COMMUNICATION<br />
Geological Survey of India (GSI)<br />
27 Jawaharlal Nehru Road, Kolkata 700 016.<br />
Tel: (033) 249 6941.<br />
Fax: (033) 249 6941<br />
Email: gsi_chq@vsnl.com<br />
Website: www.gsi.gov.in<br />
Mineral Exploration Corporation Ltd (MEC)<br />
Seminary Hills, Highland Drive Road, Nagpur 440 006.<br />
Fax: (0712) 510 133 or 548<br />
GOLD MARKET CONSULTANTS IN INDIA<br />
Madhusudan Daga<br />
306, Satyanarayan Bhavan, 7/1 Dr R. G. Thadoni Marg,<br />
Worli, Mumbai 400 018.<br />
Tel: (022) 2493 4500 or 2490 0197<br />
Fax: (022) 2490 0197<br />
Bhargava N. Vaidya<br />
Ground/4th Floor, Vaidya Bhavan,<br />
92 Atmaram Merchant Road, 2 Anant Wadi,<br />
Mumbai 400 002.<br />
Tel: (022) 2208 7849<br />
Email: bnv@vsnl.com<br />
LONDON BULLION MARKET ASSOCIATION<br />
3rd Floor, 13-14 Basinghall Street,<br />
London EC2V 5BQ, United Kingdom<br />
Tel: 44-20-7796 3067<br />
Fax: 44-20-7796 2112<br />
Email: alchemist@lbma.org.uk<br />
Website: www.lbma.org.uk<br />
WORLD GOLD COUNCIL<br />
AN INTRODUCTION TO THE INDIAN GOLD MARKET<br />
Headquarters - Mumbai<br />
101 Maker Chamber VI, 10th Floor, 220 Nariman Point,<br />
Mumbai 400 021.<br />
Tel: (022) 5630 1323<br />
Fax: (022) 5630 1324<br />
Chennai<br />
B-2 Alexander Square, 34/35 Sardar Patel Road, Guindy,<br />
Chennai 600 032.<br />
Tel: (044) 230 0083 or 0084<br />
Fax: (044) 230 0086<br />
International headquarters – London<br />
45 Pall Mall, London SW1Y 5JG, United Kingdom.<br />
Tel: 44-20-7930 5171<br />
Fax: 44-20-7839 6561<br />
Website: www.gold.org
BIBLIOGRAPHY<br />
Agricultural Statistics at a Glance 2001. Agricultural Statistics Division, Ministry of Agriculture, New Delhi, May 2001.<br />
All India Sales Tax Tariff 2001. Commercial Law Publishers (India) Pvt Ltd, New Delhi, September 2001.<br />
Bharat’s Planning for <strong>Gold</strong> Bonds Scheme 1993. By Ninad Karpe. B.L.H. Publishers’ Distributors Pvt Ltd, New Delhi 1993.<br />
Census of India 2001, Provisional Population Totals. Registrar General & Census Commission, New Delhi, June 2001.<br />
<strong>Gold</strong> (Control) Act, 1968. Government of India Act 45 of 1968.<br />
<strong>Gold</strong> Surveys. <strong>Gold</strong> Fields Mineral Services Ltd, London. International gold supply and demand surveys are published<br />
annually.<br />
Handbook of Statistics on <strong>Indian</strong> Economy. Reserve Bank of India, Mumbai, December 2000.<br />
India Market Demographics Report 1998. By I. Natarajan. National Council of Applied Economic Research, New Delhi.<br />
<strong>Indian</strong> Banking Year <strong>Book</strong> 2000. <strong>Indian</strong> Banks’ Association, Mumbai, April 2001.<br />
<strong>Indian</strong> Gem & Jewellery Statistical <strong>Book</strong>let. Published annually by The Gem & Jewellery Export Promotion Council, Mumbai.<br />
India Minerals Yearbook. Published annually by the <strong>Indian</strong> Bureau of Mines, Nagpur.<br />
International Financial Statistics Yearbooks. International Monetary Fund, Washington.<br />
Nabhi’s New Import Export Policy & Handbook of Procedures (Vol. 1) 1997 – 2002. A Nabhi publication, New Delhi, April<br />
2001.<br />
Performance Highlights of Banks 1999 – 2000. <strong>Indian</strong> Banks’ Association, Mumbai.<br />
Retail <strong>Gold</strong> Investment and Private Investor Stocks – A Review. Prepared for the World <strong>Gold</strong> Council by <strong>Gold</strong> Fields Mineral<br />
Services Ltd, London, November 2001.<br />
Statistical Outline of India 2001 – 2002. Tata Services Limited, Department of Economics and Statistics, Mumbai, December<br />
2001.<br />
Survey of <strong>Indian</strong> Investors. Securities and Exchange Board of India, Mumbai, June 2000.<br />
The Bombay Bullion Association Ltd. A <strong>Gold</strong>en Jubilee Millennium 2000 publication.<br />
The Case for Importing <strong>Gold</strong>. The Bombay Bullion Association Ltd, Mumbai, March 1978.<br />
The Early History of <strong>Gold</strong> in India. By Rajni Nanda. Munshiram Manoharlal Publishers Pvt Ltd, New Delhi 1992.<br />
Traditional Jewellery of India. By Oppi Untracht. Thames and Hudson Ltd, London, 1997.<br />
Grendon International Research<br />
<strong>Gold</strong>’s Private Investment Dimension. Paper delivered at LBMA Precious Metals Conference, Istanbul, May 2001.<br />
Private <strong>Gold</strong> Investment Demand – <strong>Bars</strong>, Coins and “Investment” Jewellery. Paper delivered at Australian <strong>Gold</strong> Conference,<br />
Melbourne, April 2002.<br />
AN INTRODUCTION TO THE INDIAN GOLD MARKET 189
ABOUT VIRTUAL METALS RESEARCH & CONSULTING LTD<br />
An internationally recognised consultancy offering cutting edge<br />
precious metals research and analysis.<br />
Virtual Metals is a small dynamic team of highly experienced analysts dedicated to revealing the truth about the current and<br />
future state of the precious metals markets. Financially supported by world-class mining companies1 , Virtual Metals<br />
specialises in proprietary research covering gold, silver and the platinum group metals, giving clients the insights necessary<br />
for sound long-term strategic decision making.<br />
Apart from the mining industry, Virtual Metals has as clients refiners, bullion banks, equity brokers, trading houses and fund<br />
managers. Clients in all segments of the mining and metals industries select Virtual Metals for independent outsourced value<br />
and experience without adding to corporate overhead.<br />
The Virtual Metals Team excels in macro economic analysis, the generation of supply and demand scenarios, costs analysis,<br />
derivative research and price forecasting. Confidentiality, experience and independence are key elements of such advisory<br />
roles. Our aim is to assist those in need of external expertise, as well as those who wish to supplement their own in-house<br />
resources. With our extensive international contacts, we are able to broaden our services through links with experienced<br />
associates in related fields worldwide.<br />
Our close associations with market participants forged over more than 15 years is at the heart of one of the Company’s<br />
primary objectives and that is to support the precious metals industries and wherever possible to give something back to<br />
the respective markets. Thus through sponsorships, Virtual Metals shares on complimentary basis a great deal of the<br />
Company’s in-house intelligence.<br />
To acquire a copy of the comprehensive analytical report India's <strong>Gold</strong>en Era - The Age of the Kaliyug or for further<br />
details regarding the Virtual Metals team and services please contact Sarah Marsden on +44 (0)20 7487 3600 or email<br />
sarah@virtualmetals.co.uk<br />
1 Barrick/Homestake, <strong>Gold</strong> Fields, Harmony, Western Areas with others to follow.<br />
190<br />
AN INTRODUCTION TO THE INDIAN GOLD MARKET
ABOUT GRENDON INTERNATIONAL RESEARCH PTY LTD<br />
Grendon International Research Pty Ltd (GIR) is a small marketing consultancy, research and promotional company<br />
that focuses on the gold industry.<br />
GIR was established in 1989 by Nigel Desebrock. It has undertaken international, regional and national consultancy<br />
projects for mining companies, refiners, mints, bullion dealers and the World <strong>Gold</strong> Council. It covers the gold investment,<br />
jewellery, industrial and refining sectors.<br />
Apart from consultancy, GIR has also compiled and published three widely acclaimed industry reference books, the outcome<br />
of fieldtrips to more than 30 countries.<br />
• The Industry Catalogue of <strong>Gold</strong> Bullion Coins (380 pages, 1999)<br />
• The Industry Catalogue of <strong>Gold</strong> <strong>Bars</strong> <strong>Worldwide</strong> (344 pages, 1998)<br />
• <strong>Gold</strong> Refiners & <strong>Bars</strong> <strong>Worldwide</strong> (476 pages, 1991)<br />
In 1993, GIR (Curator) established The Industry Collection of <strong>Gold</strong> <strong>Bars</strong> <strong>Worldwide</strong> with the support of N.M. Rothschild<br />
& Sons (Australia) Ltd (Custodian & Owner) and the World <strong>Gold</strong> Council (Sponsor). Apart from acting as an information and<br />
photographic resource for the industry, major exhibitions have been staged in Europe, North and South America, South East<br />
Asia and the Middle East. They tell the story of gold from gold-bearing ore – through gold bars – to the end uses of gold.<br />
The collection, the largest in the world, contains more than 700 standard, innovative and unusual bars (1000 g and less)<br />
from 29 countries.<br />
Nigel Desebrock was educated in South Africa and, on a Rhodes scholarship, at Oxford University. His practical marketing<br />
experience includes six years with Bass Ltd, Europe’s largest brewery group at the time, six years with International <strong>Gold</strong><br />
Corporation (the marketing arm of the Chamber of Mines of South Africa) in London and Johannesburg where he became<br />
Manager, Investment Division (<strong>Worldwide</strong>), and three years with <strong>Gold</strong> Corporation (which included the Perth Mint and<br />
Australian <strong>Gold</strong> Refineries) where he became Managing Director, <strong>Gold</strong>Corp Australia.<br />
He is an occasional speaker at international gold conferences, most recently at the LBMA Precious Metals Conference in<br />
Istanbul (2001) and at the Australian <strong>Gold</strong> Conference in Melbourne (2002) where he delivered papers on private gold<br />
investment worldwide that took into account “investment jewellery” in countries such as India.<br />
GIR is an associate member of the Australian <strong>Gold</strong> Council.<br />
Grendon International Research Pty Ltd<br />
33 Alexandra Road, East Fremantle, WA 6158, Australia<br />
Tel: 61-8-9319 2171<br />
Fax: 61-8-9319 2154<br />
email: grendon@global.net.au<br />
website: www.grendon.com.au<br />
GRENDON<br />
INTERNATIONAL<br />
RESEARCH<br />
GOLD<br />
MARKETING<br />
CONSULTANT<br />
GIR’s reference books can be ordered directly from GIR<br />
or off the GIR website: www.grendon.com.au<br />
AN INTRODUCTION TO THE INDIAN GOLD MARKET 191
192<br />
AN INTRODUCTION TO THE INDIAN GOLD MARKET<br />
Photograph: Alukkas<br />
<strong>Gold</strong> jewellery accounts for 90% of India’s gross annual consumption of gold.<br />
For most consumers, gold jewellery has both an “adornment” and “investment” dimension.<br />
AN INTRODUCTION TO THE INDIAN GOLD MARKET<br />
DECEMBER 2002