Access Document
Access Document
Access Document

You also want an ePaper? Increase the reach of your titles
YUMPU automatically turns print PDFs into web optimized ePapers that Google loves.
_..'... . ~<br />
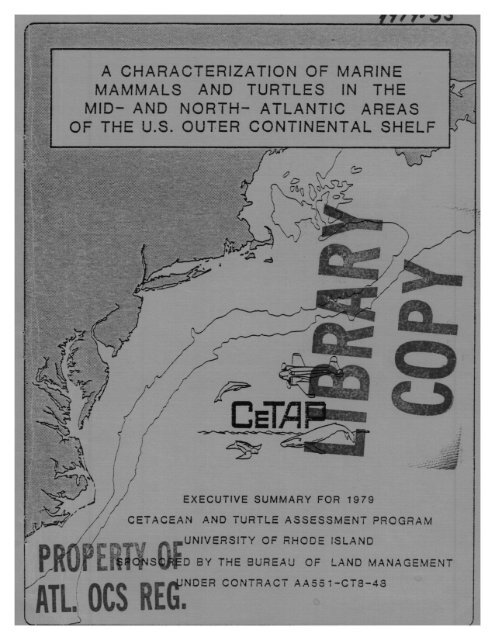
A CHARACTERIZATION OF MARINE<br />
MAMMALS AND TURTLES IN THE<br />
MID- AND NORTH- ATLANTIC AREAS<br />
OF THE U .S . OUTER CONTINENTAL SHELF<br />
•11,?T11"ilrl<br />
1<br />
.~m cj<br />
/J l ~<br />
J/j 1<br />
~<br />
EXECUTIVE SUMMARY FOR 1979<br />
^<br />
CETACEAN AND _ t URTLE A~SESSMENT PROGRAM<br />
~, UNIVERSITY OF RHODE ISLAND<br />
w ~~<br />
,<br />
~<br />
, p I<br />
C~VS D BY THE BUREAU OF LAND MANAGEMENT<br />
NDER CONTRAC T AA551-CTS- 4 3<br />
ATL . UCS Ktu .<br />
~
A CHARACTERIZATION OF MARINE MAMMALS AND TURTLES I N THE<br />
MID- AND NORTH-ATLANTIC AREAS OF THE U .S . OUTER CONTINENTAL SHELF<br />
Submitted June, .1981<br />
Prepared for :<br />
U .S . Department of the Interior<br />
Bureau of Land Management<br />
18th and C Street, NW, Room 2455<br />
Washington, DC 20240<br />
EXECUTIVE SUMMARY FOR 1979<br />
for the<br />
Cetacean and Turtle Assessment Program<br />
University of Rhode Island<br />
Kingston, Rhode Island 02881<br />
Under Contract #AA551-CT8-48 PROPEriY<br />
'kE P RO `~<br />
AlL REGN
INTRODUCTION<br />
Program History<br />
EXECUTIVE SUMMARY<br />
The Cetacean and Turtle Assessment Program CCETAP) began at the<br />
University of Rhode Island after receipt of a Request For Proposal<br />
(.RFP) from the Bureau of Land Management (BLM) in June of 1978 .<br />
CETAP's proposal was submitted in competition with other offerors .<br />
After a series of negotiations, the BLM awarded a contract to CETAP<br />
entitled "A Characterization of Marine Mammals and Turtles in the<br />
Mid- and North-Atlantic Areas of the U .S . Outer Continental Shelf ."<br />
Staff hiring and other startup procedures began immediately . A com-<br />
prehensive program for training marine mammal and turtle observers<br />
was put together within one month . Several training flights were<br />
conducted before the end of 1978, and by January 1979, a full-scale<br />
field data collection effort was underway .<br />
Program Purpose<br />
The BLM determined a lack of information on marine mammals and<br />
turtles in the mid- and north-Atlantic outer continental shelf areas .<br />
As a result, the general objectives of CETAP were defined to be an<br />
inventory which will :<br />
a . Determine which species of marine mammals and marine turtles<br />
inhabit and/or migrate through the mid- and north-Atlantic regions ;<br />
b . Identify, delineate, and describe areas of importance<br />
(_feeding, breeding, calving, etc .) to marine mammals and marine<br />
turtles in these regions ;<br />
c . Determine the temporal and spatial distributions of marine<br />
mammals and marine turtles in these regions ;<br />
d . Determine behavioral characteristics of marine mammals and<br />
1
marine turtles in these regions ;<br />
e . Estimate the size of and extent of marine mammal and marine<br />
turtle populations in these regions ;<br />
f . Emphasize all items "a" through "e" above for those species<br />
classified as threatened or endangered by the Departments of Interior<br />
and of Commerce .<br />
Data collected by this inventory is deemed necessary for respond-<br />
ing to various legislation (Outer Continental Shelf (OCS) Lands Act,<br />
1953 ; National Environmental Policy Act, 1969 ; Marine Mammal Protec-<br />
tion Act, 1972 ; Endangered Species Act, 1473 ) , and for making effec-<br />
tive management decisions concerning OCS development .<br />
METHODS AND TECHNIQUES<br />
CETAP was designed with four program elements : Administration,<br />
Field Research Operations, Data Management Operations, and Scientific<br />
Analysis/Reporting Operations . These program elements are inter-<br />
active in that many people have multiple roles : a person is often<br />
responsible for duties within two, three, or all four program elements .<br />
The advantages of this structure are that talent, knowledgeability,<br />
and technical expertise are spread throughout the program without<br />
incurring a cost-penalty derived from having a staff that is too<br />
large and therefore unwieldy . Furthermore, communication is fostered<br />
and scientific feedback encouraged . The four program elements are<br />
interdependent, yet each has its own specific function .<br />
Administration<br />
The administration, composed of a scientific director, program<br />
manager, assistant program managers, fiscal clerk, and secretaries,<br />
is responsible for ensuring compliance to stated scientific goals,<br />
contractual obligations, and the many federal, state, and university<br />
regulations . Scientific goals are established by an executive<br />
committee consisting of scientists who are both internal and external<br />
to the program . They bring the variety of backgrounds, interests,<br />
9
and expertise necessary to objectively design research projects which •<br />
respond to BLM's needs, monitor progress, and effectively evaluate<br />
the results .<br />
Field Research Operations<br />
This program element, headed by an assistant program manager,<br />
is responsible for implementing the field data collection methods<br />
designed by the scientists . CETAP field research is both active and<br />
passive . The active aspects involve the use of aircraft and ships<br />
as platforms for the collection of marine mammal, marine turtle, and<br />
environmental information by staff observers and scientists . Passive<br />
aspects involve the collection and compilation of marine mammal and<br />
turtle data obtained by non-CETAP personnel . This latter data source<br />
includes programs conducted by other researchers and agencies with<br />
the only provision being that the information must be pertinent to<br />
the CETAP study area .<br />
The study area (.Figure 1) is the Outer Continental Shelf (OCS)<br />
between Cape Hatteras, North Carolina, and Cape Sable, Nova Scotia .<br />
The shelf boundaries are defined as the shoreline and the smoothed<br />
surface projection of the 2000 m isobath or depth contour line .<br />
The active survey efforts use both aircraft and ships . Because<br />
each platform provides different opportunities in terms of the<br />
quality and quantity of data that can be collected, the respective<br />
data from each often receive somewhat differing treatments .<br />
The principal survey method is called the Dedicated Aerial<br />
Survey . An extensively rebuilt Beechcraft AT-11 aircraft is char-<br />
tered by CETAP for the survey . Dedicated aerial survey methods are<br />
conducted according to a rigorously defined sampling plan . The<br />
plan is statistically designed so that all study area components,<br />
and therefore cetacean and turtle habitats within the study area,<br />
have an equal probability of being sampled . In 1979, eight semi-<br />
seasonal surveys were made . Each survey attempted to sample 7z %<br />
of the sea surface area within the study area . From the cetacean<br />
3
Q<br />
45<br />
400<br />
~. -<br />
~ B<br />
\ , A<br />
- ,. .<br />
, f<br />
E<br />
- . .<br />
'<br />
G , `,<br />
/ .<br />
,<br />
,<br />
HlI I<br />
~<br />
/<br />
l<br />
1<br />
/<br />
' 1 Gi<br />
34°<br />
770 70° 65°<br />
~,<br />
~<br />
, ~ "<br />
- --<br />
~<br />
9- '<br />
C I<br />
Figure 1 . The study area ranged from Cape Hatteras, North Carolina,<br />
to Nova Scotia, Canada, and between the coastline to the surface<br />
projection of the 2,000 m depth contour . For sampling purposes,<br />
the study area was divided into nine sampling areas or blocks<br />
denoted by letters A through I . The dashed line depicts the 200 m<br />
depth contour .<br />
4
and turtle sightings, and the environmental measurements made while<br />
flying along the designated transect lines, CETAP obtained information<br />
pertinent to the occurrence of cetacean and turtle species within<br />
the study area, their temporal and spatial distributions, apparent<br />
density of cetaceans and turtle species within the sampled areas,<br />
correlations between cetacean and turtle occurrence and environmental<br />
variables, and relative abundance of cetacean and turtle species both<br />
semi-seasonally and geographically . Factors affecting the sightability<br />
and/or countability of cetaceans and turtles were also measured and<br />
recorded for later analysis .<br />
Platforms-of-opportunity surveys were conducted simultaneously .<br />
These surveys were conducted by the placement of one or more CETAP<br />
observers on board aircraft or ships known to be operating within<br />
the study area . Normally the aircraft or ship has a primary mission<br />
for another research institution, federal agency, or commercial<br />
group . Therefore, the only control CETAP has over where and when observa-<br />
tions are to be made is via stringent selection of the platform in<br />
advance of the flight or cruise . Once an acceptable platform is<br />
identified, one or more CETAP observers is assigned to the platform .<br />
Each observer is provided with standardized field data collection<br />
instructions and forms in order to obtain the best possible sightinq<br />
data on cetaceans and turtles, as well as environmental and operational<br />
information . After the flight or cruise, the data are reduced and<br />
converted to a standardized form for further analysis .<br />
A number of special surveys using both aerial and ship platforms<br />
were undertaken in 1979 . These surveys were performed for either or<br />
both of two reasons : ( 1) Certain species were not adequately<br />
sampled by the regular aerial or ship surveys ; and (2) certain<br />
areas were unique or events of short duration, and thus, not<br />
adequately sampled by the regular surveys . The most extensive<br />
special survey was the Right Whale Survey and Right Whale Minimum<br />
Count . This special survey was conducted in May, 1979, over the<br />
entire Gulf of Maine and OCS regions immediately south of Georges<br />
Bank . The goal of the survey was to offset the paucity of data on<br />
the northern right whale's population size and distributions in time<br />
5
and space .<br />
Additional special aerial surveys termed Hot Spot Flights were<br />
conducted several times in order to further investigate a small<br />
geographical area and the endangered cetaceans reported therefrom .<br />
For example, one Hot Spot Flight became an oil spill response when<br />
the area under study was determined by the sinking of the M/V REGAL<br />
SWORD and its subsequent leakage of fuel oil . The area of sinking/<br />
leakage was east of Cape Cod in a region of regular occurrence and<br />
feeding by at least two endangered species of cetaceans .<br />
Data Management Operations<br />
This program element, headed by a Coordinator for Data Manage-<br />
ment, is responsible for coordinating the data related activities<br />
of CETAP and the Data Projects Group . This involves establishment<br />
and.maintenance of a data base followed by preliminary product<br />
generation . First-year activities included the development of the<br />
field forms onto which field observers would record their data .<br />
These forms had to be tailored to the different types of field<br />
effort since each collected data in a unique way . This is due to<br />
a number of causes such as platform type, sampling design, altitude,<br />
speed, observer skill level, and the various kinds of environmental<br />
information collected during the surveys . Other activities involved<br />
the establishment of formats for tables, graphs, and plots of synthe-<br />
sized data pertinent to the interpretation and report-writing tasks<br />
carried out by the scientists . The generation of preliminary tables<br />
and graphs was begun in 1979 along with negotiations with NOOC/EDIS<br />
for developing magentic storage tape for archival purposes .<br />
Scientific Analysis/Reporting Operations<br />
This fourth program element, headed by the Scientific Director's<br />
Executive Committee, is responsible for designing the format for, and<br />
writing of, annual and final reports . First-year activities included<br />
developing report format and selecting data reduction and analysis<br />
6
procedures . Reduced data in the form of tables and graphs were then<br />
used to make interpretations and write the reports required under<br />
the contract .<br />
It was determined early during the first year that many func-<br />
tional specialities were required to properly address the BLM's<br />
requirements . These functional specialities are areas of scientific<br />
expertise . For this reason the Scientific Director oversaw the<br />
designation of Task Groups . Each Task Group consisted of a Task<br />
Leader and one or more Task Members . Each Task Leader is a scientist<br />
with experience in the particular speciality As such, the Task<br />
Leader acts as the investigator in charge of the analyses and<br />
report writing for the speciality . All reports are then reviewed<br />
and edited by the scientific leadership and finally integrated to<br />
form the Annual Report .<br />
The Annual Report and this Executive Summary are therefore<br />
arranged by functional speciality . A listing of functional speciality<br />
section headings follows .<br />
Functional Specialities - Task Group Reports<br />
In the remainder of this Executive Summary, the results of<br />
the first year activities are presented in ten sections . Each<br />
section has its own title and combination of authors . These are<br />
listed below .<br />
General Distribution of Cetaceans in the Continental Shelf<br />
Waters of the Northeastern U .S . - James H .W . Hain, Richard K .<br />
Edel, Herbert E . Hays, Steven K . Katona, John D . Roanowicz<br />
Calibration of the Beechcraft AT-11 Forward Observation Bubble<br />
for Population Estimation Purposes - Robert 0 . Kenney, Gerald<br />
P . Scott<br />
Estimates of Cetacean and Turtle Abundance in the CETAP Study<br />
Area with an Analysis of Factors Affecting Them - Gerald P .<br />
Scott, James R . Gilbert, Robert D . Kenney, Richard K . Edel<br />
7
Spatial and Temporal Distribution of Humpback Whales in the<br />
CETAP Study Area - Robert D . Kenney, Donna R . Goodale, Gerald<br />
P . Scott, Howard E . Winn<br />
Right Whale Sightings and the Right Whale Minimum Count -<br />
Howard E . Winn, Donna R . Goodale, Martin A .M . Hyman, Robert<br />
D . Kenney, Carol A . Price, Gerald P . Scott<br />
Correlations Between Cetacean Sightings and Selected Environmental<br />
Variables - Richard K . Edel, Michael Cagan, James H .W .<br />
Hain, Peter W . Sorensen<br />
Feeding Behavior of the Humpback Whale - James H .W . Hain,<br />
Gary R . Carter, Scott D . Kraus, Charles A . Mayo, Howard E .<br />
Winn<br />
Sea Turtles in the Region Between Cape Hatteras and Nova<br />
Scotia in 1979 - C . Robert Shoop, Thomas L . Doty, Nancy E .<br />
Bray<br />
Photogrammetric Investigation of Cetacean Morphometry -<br />
Gerald P . Scott, Mary Ratnaswamy, Howard E . Winn<br />
Cetacean Responses in Association with the REGAL SWORD Oil<br />
Spill - Donna R . Goodale, Martin A .M . Hyman, Howard E . Winn<br />
Reminder :<br />
The data and interpretation thereof contained in this report<br />
are based on observations made by CETAP personnel during 1979<br />
in the defined study area . Any exceptions are individually<br />
noted .<br />
8
GENERAL DISTRIBUTION OF CETACEANS IN THE CONTINENTAL SHELF<br />
WATERS OF THE NORTHEASTERN UNITED STATES<br />
James H .W : Hain, Richard K . Edel, Herbert E . Hays,<br />
Steven K . Katona, John D . Roanowicz<br />
1 . This section describes the temporal and spatial distribution<br />
of 21 species of cetaceans (whales, dolphins, and porpoises) in the<br />
continental shelf waters of the northeastern United States . The<br />
section is based on data collected during the initial 14 months of<br />
field studies by the Cetacean and Turtle Assessment Program (_CETAP)<br />
at the University of Rhode Island, from 1 November 1978 through 9<br />
January 1980 . The study area is defined as the continental shelf<br />
waters of the northeastern United States between Cape Hatteras, NC,<br />
and Cape Sable, Nova Scotia ; and from the coastline to 5 n . mi .<br />
seaward of the 1000 fathom depth contour .<br />
2 . While the study reported here is the most comprehensive and<br />
well supported work of this type for the area to date, the results<br />
are influenced by three major factors : sighting or search effort,<br />
the inherently imperfect nature of sampling, and the natural varia-<br />
bility of biological systems . For example, in the latter case, the<br />
observations reported here repres,ent a relatively modest sample taken<br />
over a relatively short time period . The natural variability of<br />
biological systems is well described and might be depicted as :<br />
N<br />
7 ~<br />
v<br />
L<br />
O<br />
~<br />
-1<br />
Short-term mean~<br />
(or trend) ,<br />
1,<br />
ABUNOANCE OR JISTRIBUTION PATTERNS<br />
Long-term n ean<br />
ror trend)<br />
Figure 2 . The conceptual relationship of<br />
short-term sampling to long-term biological<br />
- Q systems . When a modest sample of relativei,r<br />
?resent Short duration is drawn from a biological<br />
sample system exhibiting a high degree of natural<br />
variability, one often does not know from<br />
where within the system the sample was<br />
taken .<br />
9
Therefore, the sample on which these results are based has been<br />
taken from an unknown point within the overall system, and may not<br />
necessarily represent the average, or generalized, case . This factor<br />
should be kept firmly in mind when considering the present results .<br />
3 . Over 143,700 nautical miles of trackline were surveyed<br />
during 16,400 on-watch hours in the period described . Due to various<br />
sampling schemes, logistical constraints, and weather considerations,<br />
this survey effort was non-uniform--both temporally and geographically .<br />
Since the sighting effort influences considerably the distributional<br />
data, a quantifiable measure of sighting effort was prepared . The<br />
question to be answered was ; did a ship or aircraft pass through<br />
an area with one or more on-watch observers searching at least a<br />
two-mile swath under satisfactory sighting conditions? If so, how<br />
often? To determine this, the density of tracklines searched was<br />
evaluated both visually and numerically, and the results compared<br />
and integrated . This treatment (detailed in Chapter II of the<br />
CETAP Annual Report for 1979) produced a sighting effort index for<br />
each 1 0 quadrat in the study area . As a result, each quadrat was<br />
assigned a rating of poor, fair, good, or excellent coverage .<br />
When all sighting effort was totalled over each 45-day survey<br />
period, the sighting effort analysis showed that, on the average,<br />
47% of the total study area was covered on each of the nine survey<br />
periods . This was considered to be "fair" coverage . Of all quadrats<br />
in all time periods, 75 % were surveyed at or below this level . In<br />
general, wintertime coverage for the entire study area, average<br />
coverage to the south of Long Island, and average coverage of the<br />
northeastern Gulf of Maine and eastern Georges Bank was at the<br />
lower levels--generally in the "poor" or "fair" category . The best<br />
average coverage for the study area was in the waters to the south,<br />
east, and north of Cape Cod--where coverage for the late spring,<br />
summer, and early fall was considered "good" or "excellent" .<br />
The sighting effort summed and averaged for the year (10 January<br />
1979 to 9 January 1980) is shown in Figure 3 . Note that the sampling<br />
period prior to 10 January 1979 is not included in this treatment<br />
since low sighting effort during the program startup period would<br />
1 n
45<br />
44<br />
43<br />
42<br />
41<br />
4a<br />
39<br />
38<br />
37<br />
36<br />
77 78 75 74 73 72 71 74 69 68 67 66 65<br />
35 35<br />
34 ' + ` 34<br />
77 76 75 74 73 72 71 7a 89 68 6? 66 65<br />
Figure 3 . Average sighting effort for the period 10 January 1979 through<br />
9 January 1980--derived from the summed and averaged sighting effort<br />
index values for individual Survey Periods 1 through 8 .<br />
11<br />
45<br />
44<br />
43<br />
42<br />
41<br />
~ 44<br />
I<br />
I<br />
39<br />
38<br />
37<br />
i 36
unfairly bias the averages . This treatment provides a general<br />
impression of the average coverage, or sighting effort, for the<br />
year .<br />
With specific regard to the BLM Lease Sale Areas, the south-<br />
western portion of Lease Sale Areas 40, 49, and 59, and the eastern<br />
portion of 42, were covered at the "good" to "excellent" level on<br />
four of nine surveys . Proposed Lease Sale Area 52 received coverage<br />
at this level on two of nine surveys, and partial coverage at this<br />
level on an additional four of nine surveys . Sighting effort was<br />
weakest in all lease areas in the winter . There was "poor" or<br />
"fair" coverage of the northeast portion of 40, 49, and 59 during<br />
all seasons . There was "poor" or "fair" coverage of the western<br />
portion of 42 during all seasons, except late summer . Lease Sale<br />
Area'52 received only partial coverage at the "good" to "excellent"<br />
level in spring, early summer, and fall .<br />
4 . In the 14 months of data collection reported in this<br />
chapter, 4,405 sightings of 69,026 individuals, representing 21<br />
species of cetaceans were made . Of the total sightings, 3,245 (or<br />
72 % ), were identifiable to species . Table I presents a list of the<br />
species sighted, sighting frequencies, and the number of individuals<br />
of each species sighted . The listing is arranged in order from the<br />
most commonly sighted to those rarely sighted . Of the 21 species<br />
sighted, 13 were relatively common, and were encountered on a regular<br />
and widespread basis . As noted above, 28% of all sightings were<br />
not identifiable to species .<br />
5 . For a broad examination of the distribution of cetaceans<br />
in the study area, the total sightings were treated as large whales<br />
(average length > 25 feet or 7 .6 m) and small whales (average<br />
length < 25 feet or 7 .6 m), and are shown for each of the four<br />
seasons (Figure 4a-d and 5a-d) . For the large whales, 2,111 sightings<br />
of 5,048 individuals, representing seven species, were reported . Also<br />
included in this summary are such categories as "unidentified large<br />
whale", "unidentified rorqual", or "either a fin or a sei whale" .<br />
For the small whales, 2,294 sightings of 63,978 individuals, repre-<br />
senting 14 species were reported, As above, categories such as<br />
12
~<br />
Table 1 . Sighting frequency and number of individuals, totalled .over all data classes (except<br />
Historical) for the period 1 November 1978 to 9 January 1980 .<br />
COhNiON SPECIES<br />
Large whales<br />
Dalaenoptera physalus *<br />
Me a tera novaeangliae *<br />
Oalaenoptera acutorostrata<br />
Physeter catodon *<br />
Eubalaena la9 cial is*<br />
Subtotal<br />
UNCOhY10N OR RARE SPECIES<br />
Large whales<br />
TOTAL<br />
Balaenoptera borealis*<br />
Orcinus orca<br />
Subtotal<br />
*Endangered species<br />
No. of No . of<br />
Sightings Individuals<br />
Small whales<br />
No. of No . of<br />
Si htg ings Individuals<br />
734 2175 Tursiops truncatus 477 6466<br />
416 1054 Globicephala spp . 275 5190<br />
158 280 Lage norhynchus acutus 190 10109<br />
144 485 Phocoena phocoena 187 702<br />
119 197 Gran us rig seus 183 3911<br />
1571 4191 Delph inus delphis 164 7614<br />
Stenella spp . (spotted) 67 4916<br />
Stenella coeruleoalba 67 4341<br />
Subtotal 1610 43309<br />
Small whales<br />
7 16 Lagenorhynchus albirostris 15 136<br />
4 13 Ziphius cavlrostris 2 9<br />
11 29 Stenella longirostris 2 90<br />
Steno bred a nensis<br />
2 65<br />
Oelphinapterus leucas 1 3<br />
Mesop lodon spp . 1 _ 3<br />
Subtotal<br />
23 306<br />
1582 4220 1663 43615
J<br />
~<br />
77<br />
45 -i-<br />
•o 40 40<br />
] 4 ! 4<br />
77 70 6S<br />
LARGE WHALES<br />
SPRING<br />
Figure 4 . General distribution of large whales-- all species with average length > 25 feet (7 .6 m)--<br />
1 November 1978 to 9 January 1980 . Seasonal plots<br />
July, August ; fall = September, October, November ;<br />
70 BS 77 70 65<br />
r}-- 45 45<br />
!4 34<br />
77 70 65<br />
LARGE WHALES<br />
SUMMER<br />
show spring = March, April, May ; summer = June,<br />
winter = December, January, February .<br />
45j<br />
•o
~<br />
in<br />
77<br />
•5 --F-<br />
40<br />
34 --h<br />
+<br />
+ +<br />
7n<br />
7 ~ 74<br />
+<br />
*4+~+ + ~+ +<br />
+<br />
++ ++-~ -*4+ +<br />
+ '<br />
~/ t + ~•<br />
# +~ + +~+ +<br />
+ + + ++ +<br />
LAHGE WHALES<br />
FALL<br />
Figure 4 . (continued) .<br />
+<br />
Bs 77<br />
.~ - 45 s<br />
•o 40<br />
-}- ! 4 !l<br />
65 77<br />
10<br />
?0<br />
LARGE WHALES<br />
WINTEH<br />
as<br />
-r 65<br />
44<br />
34
~<br />
77<br />
454<br />
40<br />
9• ! 4 I<br />
70<br />
65<br />
40<br />
45<br />
40<br />
77<br />
! 4 !l<br />
77 70 65 77 70 65<br />
SMALL WHRLES SMALL WHRLES<br />
SPPING SUMMEFi<br />
Figure 5 . General distribution of small whales--all species with average length < 25 feet ( 7 .6 m)--<br />
1 November 1978 to 9 January 1980 . Seasonal plots show spring = March, April, May ; summer = June,<br />
July, August ; fall = September, October, November ; winter = December, January, February .<br />
l5<br />
70<br />
65<br />
4S<br />
40
~<br />
J<br />
77<br />
l5 -}<br />
l0<br />
34 -F<br />
7~7<br />
Figure 5 . (continued) .<br />
70 85<br />
70<br />
SMALL WHALES<br />
FALL<br />
lS,<br />
-f- !t<br />
65<br />
tS<br />
40 40<br />
!t<br />
77<br />
77<br />
70 85<br />
?0<br />
SMALL WHALES<br />
WINTEH<br />
65<br />
lS<br />
40<br />
34
"unidentified dolphins" and "unidentified blackfish" have been in-<br />
cluded in the plots to show the general distribution of animals<br />
within this size class in the study area .<br />
!- The overview presented by this treatment suggests that cetaceans,<br />
both large and small,are widely distributed throughout the study area<br />
in all four seasons of the year . If the effects of sighting effort<br />
were to be subtracted out, the point densities created as the result<br />
of non-uniform sampling would be smoothed somewhat, and the actual<br />
distribution would appear more uniform . Several additional points<br />
are suggested :<br />
a . Small whales or dolphins are common along the shelf edge<br />
over large areas of the mid-Atlantic bight during all four seasons<br />
of the year .<br />
b . Small whales are seen less frequently over the continental<br />
shelf proper, i .e ., in shallower water, in the mid-Atlantic bight .<br />
Again, this is generally true for all seasons . The exception is<br />
those animals found close to shore in the North Carolina and Delmarva<br />
areas (this has been found to be largely Tursio s truncatus ) .<br />
c . There is a suggestion that large whales are absent or<br />
scarce in the northeastern Gulf of Maine in winter . A more definitive<br />
statement on this requires additional sampling .<br />
d . There is a suggestion of a general scarcity of large whales<br />
in continental shelf waters south of Long Island in the fall .<br />
e . It is generally believed that whales are absent or scarce<br />
in northern waters in the winter . Our data suggest that this is<br />
not the case . In spite of low sampling levels, whales were observed<br />
over large areas of the shelf . Additional wintertime sampling will<br />
be of interest .<br />
6 . To date, five endangered species (as defined by the Endangered<br />
Species Act of 1973, 16 U .S .C . 1531-1543) of marine mammals have been<br />
sighted in the study area . These five species are Balaenoptera<br />
physalus (fin), Megaptera novaeangliae (humpback), Physeter catodon<br />
(sperm), Eubalaena qiacialis (right), and Balaenoptera borealis (sei) .<br />
The relative number of sightings can be obtained by referring to<br />
Table 1 . Since all are large whale species, and all common large<br />
18
whales but one are endangered, the general seasonal distribution of<br />
the endangered species is approximated by the large whale plots<br />
given in Figure 4a-b . For more detailed information on the endan-<br />
gered species, refer.to the appropriate sections of Chapter II, as<br />
well as Chapters VI, VII, and VIII in the CETAP Annual Report for<br />
1979 . The other endangered species which might possibly occur in the<br />
waters of the northeastern U .S . continental shelf, Balaenoptera<br />
musculus , the blue whale, has not been observed by CETAP to date .<br />
7 . In the detailed information presented in Chapter II of the<br />
CETAP Annual Report for 1979, each species is treated individually<br />
in a species account . The distribution of the 13 common species is<br />
shown graphically by subdividing the year into eight 45-day periods .<br />
The accompanying text gives information on group size, interspecies<br />
associations, migration and movements, feeding locations, and presence<br />
of calves or juveniles . One area, however, not adequately treated by<br />
the individual species accounts is that of multispecies sightings<br />
(groups of cetaceans comprised of two or more species) . These associa-<br />
tions occurred in 12% of the total sightings . Mixed groups of Globi -<br />
cephala spp . and T . Trunatus (pilot whales and bottlenose dolphins),<br />
dolphins bowriding large whales, or feeding aggregations of several<br />
species of whales and dolphins are typical examples of these multi-<br />
species associations . Of the vari.ous associations, the most common<br />
was that of fin (B . h salus) and humpback (M . novaeangliae ) whales .<br />
8 . Analysis of the species distributions to date suggests that,<br />
in the broadest sense, the 13 most common species in the study area<br />
can be considered to be of three basic types . Figures 6a-c show<br />
the distribution of these basic types and the relation of the dis-<br />
tribution patterns to the BLM Lease Sale Areas . The species and<br />
characteristics contained in each are as follows :<br />
Type I - Represented by a single species, Phocoena phocoena ,<br />
the harbor porpoise . The distribution is widespread throughout the<br />
Gulf of Maine, waters in the vicinity of Cape Cod, and over much of<br />
Georges Bank . The distribution is almost solely over the shelf<br />
proper, and shows no strong tendency for the shelf edge . Based on<br />
CETAP data, distribution does not appear to extend southwest beyond<br />
19
Nantucket . That is, the species is not found over the continental<br />
shelf south of 40°PJ and west of 70°t,l . Figure 6a shows this pattern .<br />
Type II - Represented by all common species of baleen whales,<br />
B . physalus , M . novaeangliae , B . acutorostrata , E . glacialis , and one<br />
species of odontocete, L . acutus . This distribution is widespread<br />
and common throughout the entire Gulf of Maine, and waters in the<br />
vicinity of Cape Cod, and over much of Georges Bank . There is a<br />
more scattered and occasional distribution trailing southwest from<br />
this area over the remainder of the shelf to Cape Hatteras (fin<br />
whales are relatively more common in this area than the other four<br />
species) . While some whales are sighted along the shelf edge at<br />
times, the general tendency of this type is to occupy the shelf<br />
proper . This distribution pattern is shown in Figure 6b .<br />
. Type III - Seven odontocetes follow this general distribution<br />
pattern (Figure 6c) but are best grouped into three subtypes or<br />
variations . The overall distribution pattern, however, shows a strong<br />
tendency for association with the shelf edge (centered about the 1000 m<br />
depth contour), rather than the shelf proper .<br />
A . G . r~g 'seus , S . coeruleoalba , and Stenella spp . (spotted)<br />
are similar in their distribution patterns . This pattern<br />
is characterized by a generally linear distribution along<br />
the shelf edge from south of Nantucket southwestward to<br />
Cape Hatteras . Extensions of the distribution eastward of<br />
Nantucket, along the Georges Bank edge, are seasonal only--<br />
primarily in the summer . There is no general tendency for<br />
the distribution to extend landward of the shelf edge onto<br />
the shelf proper . The general distribution is a more<br />
southerly one, centered in the mid-Atlantic bight area .<br />
B . Distribution of this variety is seen in P . catodon ,<br />
Globicephala spp ., and D . delphis . Again the distribution<br />
occurs along the shelf edge, and again is centered over<br />
the 1000 m depth contour . There are several differences,<br />
however, between this subtype and the former . The species<br />
of this subtype are more widespread in space and time, and<br />
appear to be more nearly four-season occupants all along<br />
20
the shelf edge from the eastern tip of Georges Bank southwest-<br />
ward to Cape Hatteras . A second feature is the general tendency<br />
for the distribution to extend up onto the shelf at the northern<br />
end of the study area . This takes place in the waters south of<br />
. Cape Cod, on Georges Bank, in the Northeast Channel (northeast<br />
of Georges Bank), and in the Gulf of Maine . Thus, there is a<br />
seasonal "bulge" or expansion of the distribution to shallower<br />
regions of northern waters . All three species have this in<br />
common .<br />
C . This variation on the basic Type III pattern is represented<br />
by a single species, T . truncatus . The general pattern is<br />
similar to that of subtype A--a linear distribution along<br />
the shelf edge, extension to the Georges Bank edge in the<br />
warm seasons, and general southerly tendency to the overall<br />
distribution . With Tursiops , however, a distinct feature is<br />
a "J" shape to the species distribution at the southern end<br />
of the study area . That is, there is a "crook" in the dis-<br />
n tribution at the southern end, and an arm of the distribution<br />
extends along the coastline from the area of Cape Hatteras<br />
northward to Cape Henlopen, DE .<br />
Based on the present data, there seems to be a strong argument for<br />
considering each of the major species as members of one of these three<br />
basic distribution types . This hypothesis aims at a preliminary<br />
attempt at characterizing where and when the various species, or<br />
groups of species, occur . The hypothesis will be tested further as<br />
additional data are collected and examined .<br />
9 . The above statements about the distribution of the whales in<br />
northeastern U .S . continental shelf waters may have application to<br />
decision makers dealing with the northeastern U .S . OCS study area .<br />
_ A . P . phocoena , a Type I species, will come under consideration<br />
with regard to almost the entire Lease Sale Area 42 and the<br />
northeastern half of Area 52 . The species has not been reoorted<br />
present in Lease Areas 40, 49, or 59 .<br />
B . The baleen whales (all but one of which are endangered)<br />
and L . acutus , the Type II species, are found on a regular<br />
21
and widespread basis throughout most of Lease Sale Areas 42<br />
and 52 . They are apparently found on a more occasional and<br />
scattered basis in Lease Sale Areas 40, 49, and 59 .<br />
C . The odontocetes or toothed whales (only one of which,<br />
the sperm whale . P. catodon , is endangered) of Type III are<br />
apparently widely and regularly distributed in Lease Sale<br />
Areas 40, 49, and 59 . The distribution of those species in<br />
subtype III-A is widespread and year-round in the southern<br />
half of Lease Areas 42 and 52, and in the warm-weather seasons<br />
expands shoreward into all of Area 42 and most of Area 52 .<br />
Subtypes III-B and III-C apparently extend their distribution<br />
east-rardinto the southern portions of Lease Sale Areas 42 and<br />
52 in the warm seasons only .<br />
Figures 6a-6c show the BLM Sale Area outlines in relation to<br />
the three general cetacean distribution types .<br />
22
40,49 : ••~<br />
r<br />
J<br />
~<br />
i<br />
i<br />
i<br />
9<br />
r---'<br />
...~~ . ..<br />
i 52 '<br />
Figure 6a . Cetacean distribution pattern Type I (indicated by lined<br />
area) includes a single species, Phocoena phocoena , th .e harbor porpoise .<br />
Distribution is on the shelf proper over large areas of the Gulf of<br />
Maine and Georges Bank . The approximate boundaries of BLM Lease Sale<br />
Areas 40, 42, 49, 52, and 59 are shown .<br />
23
. ~<br />
. ~<br />
40<br />
, 5®<br />
. ~ O<br />
. .<br />
~<br />
~<br />
~<br />
,/ '' .<br />
r<br />
r<br />
~<br />
Figure 6b . Cetacean distribution pattern Type II (indicated by lined<br />
area) includes all the common baleen whales, B . physalus, M . novaeangliae ,<br />
B . acutorostrata , E . glacialis , and a single odontocete or toothed whale,<br />
L . acutus . Distribution is primarily on the shelf proper with no strong<br />
tendency for shelf-edge concentrations . Unlined distribution areas<br />
indicate small numbers of outlying sightings not considered to be part<br />
of the main pattern . The approximate boundaries of BLM Lease Sale Areas<br />
40, 42, 49, 52, and 59 are shown .<br />
24<br />
/<br />
.<br />
e<br />
~<br />
:
~aA<br />
O p<br />
O<br />
O --i<br />
o f ~ ~ ~ ~o<br />
a / O O<br />
,<br />
;<br />
; 0<br />
= o<br />
~ 0<br />
0<br />
0<br />
Figure 6c . Cetacean distribution pattern Type III (indicated by lined<br />
area) includes a majority of sightings of all the common odontocetes<br />
(toothed whales) except for Lagenorhynchus acutus , the white-sided<br />
dolphin . This pattern, common to the foregoing species, shows a<br />
strong tendency for a shelf-edge distribution, centered about the<br />
1000 m depth contour . The Type III distribution has three variations<br />
which are explained in the text . Unlined distribution areas indicate<br />
small numbers of outlying sightings not considered to be part of the<br />
main pattern . The approximate boundaries of BLM Lease Sale Areas 40,<br />
42, 49, 52, and 59 are shown .<br />
a
CALIBRATION OF THE BEECHCRAFT AT-11 FORWARD OBSERVATION BUBBLE<br />
FOR POPULATION ESTIMATION PURPOSES<br />
Robert D . Kenney and Gerald P . Scott<br />
1 . This section describes the methodology used in the calibration<br />
and placement of reference marks on the clear panels of the acrylic<br />
nose bubble which is part of the aircraft used to survey the CETAP<br />
study area for cetaceans and sea turtles . Reference marks are nec-<br />
essary because an estimate of right angle sighting distance from<br />
the track line of the aircraft to each cetacean and turtle sighting<br />
(Figure 7) is required for species' population estimate calculations .<br />
2 . Since the real time measurement of actual distance is a<br />
difficult and time-consuming procedure, CETAP decided to classify<br />
sightings into distance intervals . Six right angle distance intervals<br />
were chosen for each side of the aircraft. These intervals are 0-1/8,<br />
1/8-1/4, 1/4-1/2, 1/2-3/4, 3/4-1, and greater than 1 nautical mile .<br />
Observers riding in the aircraft's acrylic nose bubble classify each<br />
sighting into one of these intervals through the use of the reference<br />
marks . When a sighting is made, the observer moves his head to the<br />
standard reference position and determines the right-angle distance<br />
interval in which the sighting falls . This information is then called<br />
out to the data recorder .<br />
3 . The placement of bubble reference marks was performed and<br />
calibrated dynamically and statically . Dynamic calibration involved<br />
flights at standard altitude and speed (750 feet, 120 knots) at the<br />
appropriate known distances from a fixed light tower (Figure 8) .<br />
At the point where the tower was perpendicular to the flight track,<br />
a reference mark Copaque tape) was placed on the appropriate nose<br />
window panel . Static calibration involved the use of a calibrated<br />
post, known distances, and measured angles (Figure 9) . Trigonometric<br />
calculations were performed to link the horizontal distance between<br />
the observers's eye and the acrylic panel plus the distance between<br />
the panel and the post to vertical distances on the calibrated post .<br />
26
The trigonometric formula, (d + 100 cm) tan 0= b, where d = the<br />
average distance between the observers' nose bridge and the bubble<br />
(in cm), e = the angle of declination from the horizon needed to<br />
intercept a known distance b, on the calibrated post, was used<br />
to determine e and thus to check and correct the locations for<br />
the distance interval marks on the bubble "glass" .<br />
4 . The establishment and calibration of distance intervals<br />
and reference marks ensures that cetacean and turtle sightings made<br />
by CETAP's observers are classified into distance intervals in a<br />
reliable and reproducible manner .<br />
27
Figure 7 . Diagrammatic representation of tangential relationship of<br />
aircraft altitude (a), inclination to a sighting (a), and right angle<br />
distance to that sighting (D) . The right angle distance of the sight-<br />
ing to the survey trackline is a critical measurement for population<br />
estimation calculations .<br />
28
Figure 8 . Diagram illustrating the dynamic calibration of AT-11<br />
forward observation bubble with reference to a fixed light tower .<br />
Aircraft is flown precisely at pre-determined distance intervals<br />
and standardized reference marks are placed on glass of forward<br />
observation bubble .<br />
29<br />
3RENTON REEF TOW ER
ESTIMATES OF CETACEAN AND TURTLE ABUNDANCE IN THE CETAP STUDY AREA<br />
WITH AN ANALYSIS OF FACTORS AFFECTING THEM<br />
Gerald P . Scott, James R . Gilbert,<br />
Robert D . Kenney, Richard K . Edel<br />
la CETAP employed aerial sampling surveys to assess the abundance<br />
of cetaceans and sea turtles from the outer continental shelf waters<br />
within the study area . Abundance estimates calculated from the<br />
sighting data are based on the Cox-Eberhardt method . No attempt was<br />
made to adjust the estimates for the varying glare and sea state<br />
conditions encountered by the sampling survey field crew, or for<br />
animal submergence times, i .e ., the percentage of each time unit<br />
that the animals are under the sea surface and non-visible . For<br />
this reason it is stressed that the abundance estimates presented<br />
in this report are conservative and should be as indices of relative<br />
minimum abundance of a species or species' group in a defined area<br />
at a defined timea Although the abundance estimates were not<br />
adjusted to account for glare and sea state, the effects of these<br />
two variables on the survey observers' ability to sight animals at<br />
the surface are presented .<br />
2 . The study area is shown in Figure 1 . The total sea surface<br />
area encompassed within the area is 81,154 n .mi .2 (278,350 km2),<br />
Because of its size, the study area was divided into nine sampling<br />
areas or "blocks",eight (A-H) with approximately equal areas and<br />
one (I) with an area one-half as large (Table 2) . This was done to<br />
accommodate logistical and safety considerations into the sampling<br />
plan .<br />
3 . The sampling plan itself was designed with consideration of<br />
program and BLM needs, current sampling theory, and the availability of<br />
time to adequately survey the area . A semi-seasonal or eiQht survev<br />
period approach, with each survey sampling about 72 percent of the sea<br />
surface within each block, was chosen to provide the most cost effective<br />
compromise between analytical requirements for precise data and the costs<br />
31
w<br />
Table 2 . Areas of the CETAP sampling blocks .<br />
Sampling Block<br />
AREA A 3 C D E F G H I TOTAL<br />
n .mi .2 10,640 10,373 10,237 9,884 10,383 9,850 8,228 8,202 3,357 81,154<br />
N km2 36,494 35,578 35,112 33,901 35,613 33,785 28,221 28,132 11,514 278,350
incurred by surveying so much area for so many species . As a result,<br />
the sampling design called for the simple random selection of transect<br />
lines from the pool of all possible northwest-southeast lines spaced at<br />
two n .mi . intervals within each block . At least four sampling lines<br />
were chosen to ensure that a minimum of 400 n .mi . (741 km) of sampling<br />
transects were surveyed (Figure 10 and Table 3) . Block I was only<br />
about one half the size of the other eight blocks and so needed<br />
proportionally less mileage to obtain the same percentage of sea<br />
surface coverage as the other eight blocks . Sampling surveys were<br />
conducted at 750 foot altitude and 120 knots ground speed in all<br />
cases . Weather affects the quality of data collections, so minimum<br />
criteria were established early . These criteria require sea states<br />
of Beaufort three or less and a visibility of at least 2 n .mi .<br />
before a sample is considered acceptable . The absence of transect<br />
lines within a block during a given survey (Figure 10) is due to<br />
bad weather preventing the survey of the block within the survey<br />
"window" . With nine blocks each requiring one day to survey, .ni.ne<br />
days are needed to complete one semiseasonal survey of the study<br />
area . Since the northeastern seaboard has weather systems that<br />
rarely are stable enough for nine consecutive good weather days,<br />
a thirty-day "window" within which the nine sampling days are<br />
executed was necessary .<br />
4 . Actual sampling observations were conducted by survey teams<br />
of six people . The flight crew, consisting of pilot and co-<br />
pilot-navigator, were furnished by the aircraft vendor, The re-<br />
maining four were CETAP staff observers . To maximize efficiency,<br />
two observers at a time were on duty in the aircraft's observation<br />
bubble . A third observer was designated the data recorder, and the<br />
fourth was in a resting and equipment service status . Observers<br />
were rotated into the bubble at the end of each transect line or<br />
hourly, whichever occurred first .<br />
5 . While flying along a transect line, the two duty observers<br />
scanned the sea surface from directly ahead of the aircraft to<br />
approximately 60 0 to either side of the transect line, and reported<br />
all sightings and environmental data to the recorder . Sightings<br />
33
77• 70•<br />
77• 70•<br />
65• 77•<br />
pr• 77 -<br />
70•<br />
650<br />
70• 63'<br />
Figure 10 . The sampling transects flown during the first year's<br />
sampling effort . Thick lines are transects ; thin lines are area<br />
boundaries . Dashed lines represent the 200 m contour . Roman<br />
numerals represent the survey numbers .<br />
Id
77• 70• 65° 77• 70• 65•<br />
77• 70• 65 iv- 65 •<br />
Figure 10 (continued) .<br />
35
Table 3 . Sampling transects per area and survey from the first year's field effort .l<br />
Sannpling Tra n sec ts date saxTle d per area<br />
Survey A 0 C 0 E~ F G 11 I<br />
2<br />
1 4 0 0 3 4 4 4 3 3<br />
4/2/79 --- --- 12/2/79 24/1/79 23/1/79 19/1/79 16,11/1/79 16/1/79<br />
1<br />
1 2 2<br />
II 4 4 4 5 4 4 2 4 4<br />
3/3/19 9/3/19 23/2/79 10,13/3//9 2,3,17/3/79 1/3/79 28/2/79 28/2/79 27/2/79<br />
1/3/79<br />
1 3<br />
1 1 1 4 4 4 4 4 4 3 5 4<br />
rn 23/4/79 24/4/79 25/4/79 1/5/79 3/5/79 13/4/79 11 .12/4/79 21/4/79 17,20/4/79<br />
2<br />
IV 4 5 4 4 4 4 4 5 4<br />
1,6/6/79 7/6/79 8/6/79 9/6/79 14/6/79 31/5/19 30/5/79 16/6/79 3/6/79<br />
3<br />
V 5 5 4 4 4 4 4 5 4<br />
9/7/79 10/7/79 11/7/19 19/7/79 30/7/79 18/7/79 6/8/79 5/8/79 4/8/19<br />
7/ 8/ 79<br />
VI 4 4 4 4 4 4 5 2 1<br />
26/8/79 21/8/79 10/9/79 9/9/79 2/9/79 12/9/19 31/8/79 16/9/79 16/9/79<br />
VII 0 4 0 4 4 4 5 5 4<br />
--- 28/10/79 --- 6/11/19 1/11/79 19/10/79 18/10/79 16/10/79 17/10/79<br />
V111 5 5 0 0 4 0 5 5 4<br />
15/12/19 21/12/79 --- --- 4/1/30 --- 12/1/80 19/1/79 18/12/79<br />
1The niuubers listed are as follows : a single mwber (n) placed above a date iuplies that n transects were<br />
sautpled on that date . lf severa) inte9ers are listed above dates then those muitiers of transects were<br />
sanq,led on the dates listed .
were classified into right angle distance "strips" as discussed in<br />
the previous section . Only these transect line sightings collected<br />
under environmental conditions which met or exceeded the minimal<br />
survey criteria were used for the numerical analyses performed as<br />
part of the abundance estimation task .<br />
6 . A total of 634 sightings were made from transect line<br />
sampling flights under conditions meeting or exceeding CETAP's<br />
minimum criteria . This total is comprised of 99 sightings of large<br />
whales (four species in the family Balaenopteridae, Eubalaena<br />
glacialis, and Physeter catodon ), 320 sightings of small whales<br />
(seven species in the family Delphinidae), and 215 sightings of<br />
marine turtles ( Caretta caretta , and Dermochelys coriacea ) .<br />
7 . A minimum population estimate (minimum total abundance)<br />
was computed by survey period and block for each of the fifteen<br />
species or species' groups commonly sighted . These are summarized<br />
over the entire study area in Table 4 . It is emphasized that<br />
these estimates are average or point estimates believed to be<br />
conservative because of the following reasons .<br />
a . During the course of data analysis, it was determined<br />
that species' density estimates (estimates of the numbers of each<br />
species of whale or turtle per unit sea surface sampled) were<br />
significantly affected by the sea state and glare quantity conditions<br />
existing during survey, and, by the species category itself (pro-<br />
bably due to size and behavioral differences between species) .<br />
b . The affect was primarily one of negative bias, i .e ., sea<br />
state, glare, and species category considerations tend to lower<br />
the resultant species density estimates .<br />
c. It is known that cetaceans and sea turtles are diving<br />
animals . As a result, all individuals of a species occupying the<br />
area sampled may not be at the surface, and therefore sightable,<br />
during the brief interval when the aircraft with its observers<br />
flies over a given portion of the sampling area .<br />
8 . The "population" estimates presented in Table 4 are<br />
interpreted in species accounts below . For the purposes of the<br />
37
Table 4 . Minimum population esti.mates** wi.thi.n the entire study area by<br />
species and survey period .<br />
Survey<br />
Species I II III IV V VI VIl VIII<br />
A) Large Whales<br />
w<br />
00 e) Dolphins<br />
R . acutorostrata 0 0 0 162 63 0 0 28<br />
*R . borealis 0 0 0 109 32 0 0 0<br />
* B . physalus 81 213 175 660 1,102 93 63 28<br />
* E . qlacialis 0 0 29 24 0 0 0 0<br />
*M . novaean liae 0 0 61 684 633 0 0 28<br />
*P . catodon 0 300 174 81 289 135 104 80<br />
D . dalphis 263 17,606 13,747 4,447 0 6,724 10,219 1,376<br />
G_. g riseu s 0 9,471 615 2,450 2,093 10,220 9,753 1,024<br />
Globicepha la spp . 0 915 4,299 10,996 11,448 2,826 5,814 3,540<br />
L . acutus 0 0 4,713 18,255 20,458 24,287 7,901 1,193<br />
P . p hocoena 0 0 271 2,946 658 0 0 307<br />
Stenella spp . 1,153 4,033 6,217 22,376 13,000 7,901 1,756 18,732<br />
T . truncatu s 1) 1,91)3 2,713 1,819 3,443 2,194 6,254 1,610<br />
C) Turtles<br />
C . caretta 0 0 102 3,749 4,017 1,108 3,493 156<br />
*D . corlacea 0 0 0 70 107 636 154 0<br />
~-- --- - -- -- -- -<br />
- -- ---<br />
Endangered species as defined by the U .S . Congress<br />
**For an explanation of min imum population estimates or mininwm point estim tes, see text .
interpretations, the following definitions apply . The study area<br />
is the CETAP area of investigation, i .e ., the northeastern OCS<br />
region shown in Figure 1 . Estimated minimum number refers to the<br />
average or point estimate obtained by pooling the estimates from<br />
the nine blocks . With this estimate, in parentheses, is the 95<br />
percent confidence interval around it, e .g ., 162 (± 118, 95 % CI) .<br />
This should be read "within the study area and during at least one<br />
survey period, there were 162 plus or minus 118 whales at the<br />
95 percent level of confidence ." Relative density is the estimated<br />
number of individuals per unit area unadjusted for the survey,<br />
environmental, or species-category variables discussed in item 7 .<br />
Only thirteen species or species' groups of cetaceans presented in<br />
Table 4 are discussed . Turtles are discussed in a later section .<br />
a . The large whales .<br />
Balaenoptera acutorostrata - the minke whale<br />
The estimated minimum number of minke whales found in the study<br />
area during the survey period of highest abundance was 162 (± 118<br />
95% CI) individuals . The highest relative density of this species<br />
was found in sampling Block C during June, 1979 . Block C contains<br />
a portion of Lease Sale Area 52 . Minke whales are not considered<br />
to be endangered and while no estimates of the western North .Atlantic<br />
stock(s) are available, the level of the North Atlantic minke whale<br />
population has been estimated to range from 50,000 to 70,000<br />
individuals .<br />
Balaenoptera borealis - the sei whale<br />
The estimated minimum number of sei whales in the study area<br />
during the survey period of highest abundance was 109 (.± 173, 95% CI) .<br />
The highest relative density for this species was found in sampling<br />
Block C in June, 1979 . Block C contains a portion of Lease Sale<br />
Area 52 . It is believed by some that two stocks of sei whales<br />
exist in the western North Atlantic . Individuals of this species<br />
found in the CETAP study area belong to the Nova Scotian stock, which<br />
is thought to range from southern Newfoundland (the summer and<br />
northern limit) to approximately 30° N latitude (the latitude of<br />
St . Augustine, Florida ; the winter and southern limit) . Sei whales<br />
39
are considered to be endangered and investigations have estimated,<br />
based on tag and recapture estimates, the Nova Scotian stock to<br />
range from 1,398 to 2,248 individuals .<br />
Balaenoptera physalus - the fin whale<br />
The estimated minimum number of fin whales in the study area<br />
during the survey period of highest abundance was 1,102 (± 1,417,<br />
95% CI) . The highest relative density of this species was in<br />
sampling Block A during July, 1979 . Block A contains a portion of<br />
Lease Sale Area 52 . Fin whales are considered to be endangered,<br />
and there are an estimated 2,000 individuals in the Nova Scotian<br />
stock ( presumably the stock to which fin whales in the CETAP study<br />
area belong) . The population level of fin whales in the western<br />
North Atlantic is thought to range between 3600 and 6300 individuals .<br />
Eubalaena glacialis - the right whale<br />
The estimated minimum number of right whales in the study area<br />
during the survey period of highest abundance was 29 (± 44, 95% CI) .<br />
The highest relative density of this species was found in sampling<br />
Block B during April, 1979 . Right whales are considered to be<br />
endangered .<br />
Megaptera novaeangliae - the humpback whale<br />
The estimated minimum number of humpback whales in the study<br />
- 275,<br />
area during the survey period of highest abundance was 684 ( +<br />
95% CI) . The highest relative density of this species was found in<br />
sampling Block A in July, 1979 . Block A contains a portion of<br />
Lease Sale Area 52 . Humpback whales are considered to be endangered .<br />
The stocks in the western North Atlantic have been estimated to be<br />
in excess of 2050 individuals .<br />
Physeter catodon - the sperm whale<br />
The estimated minimum number of sperm whales in the study area<br />
during the survey period of highest abundance was 300 (± 373,<br />
95% CI) . The highest relative density of this species was in<br />
sampling Block I during February, 1979 . Sperm whales are considered<br />
to be endangered . The stock of sperm whales in the central and<br />
western North Atlantic has been estimated to be 22,000 individuals .<br />
40
. Dolphins<br />
Delphinus delphis - the common or saddleback dolphin<br />
The estimated minimum number of common (or saddleback) dolphins<br />
found in the study area during the period of highest abundance was<br />
17,606 (± 26,749, 95% CI) . The highest relative density of this<br />
species was in sampling Block G .during January and February, 1979 .<br />
Block G contains a portion of Lease Sale Area 59 . This species is<br />
not considered to be endangered . More than 30,000 common dolphins<br />
are thought to comprise the North Atlantic stock(s) of this species .<br />
Gram us riseus - Risso's dolphin or Grampus<br />
The estimated minimum number of Risso's dolphins (or Gray<br />
grampus) found in the study area during the survey period of highest<br />
abundance was 10,220 (± 10,194, 95% CI) . The highest relative<br />
density of this species was in sampling Block G during October,<br />
1979 . Block G contains a portion of Lease Sale Area 59 . This<br />
species is not considered to be endangered . No estimates of the<br />
western North Atlantic stock(s) of Risso's dolphins are available .<br />
Globicephala spp . - the pilot whale<br />
The estimated minimum number of pilot whales (both G . melaena<br />
and G) macrorhynchus ) found in the study area during the survey<br />
period of highest abundance was 11,448 (± 18,202, 95% CI) . The<br />
highest relative density of these species was in sampling Block C<br />
during July, 1979 . Block C contains a portion of Lease Sale Area 52 .<br />
Th.is genus is not considered endangered . The 1947 stock of long-<br />
finned pilot whales (G . melaena ) available to the Newfoundland<br />
fishery was estimated to consist of fewer than 60,000 individuals . No<br />
estimates of the stock size of short-finned pilot whales (G . macror -<br />
h ny chus ) in the western North Atlantic are available .<br />
Lagenorhynchus acutus - the Atlantic white-sided dolphin<br />
The estimated minimum number of Atlantic white-sided dolphins<br />
found in the study area during the survey period of highest abundance<br />
is 24,287 (± 15,146, 95% CI) . The highest relative density of this<br />
species was in sampling Block A during July, 1979 . Block A contains<br />
a portion of Lease Sale Area 52 . This species is not considered<br />
41
endangered . No estimate of the western North Atlantic stock size<br />
of Atlantic white-sided dolphins is available .<br />
Phocoena phocoena - the harbor porpoise<br />
The estimated minimum number of harbor porpoise found in the<br />
study area during the survey period of highest abundance is 2,946<br />
(- + 1,130, 95% CI) . The highest relative density of this species<br />
was in sampling Block B during June, 1979 . Block B contains a<br />
portion of Lease Sale Area 52 . This species is not considered<br />
endangered . A minimum of 4,000 harbor porpoise were estimated to<br />
inhabit the waters of the approaches to the Bay of Fundy . No other<br />
estimates of the stock(s) of this species are available .<br />
Stenella spp . - spotted dolphins<br />
The estimated minimum number of all species in the genus Stenella<br />
found in the study area during the survey period of highest abundance<br />
is 22,376 (± 16,988, 95% CI) . The highest relative density for this<br />
genus was in sampling Block E during June, 1979 . This genus is not<br />
considered endangered . No estimates of the western North Atlantic<br />
stock(s) of this genus are available .<br />
Tursiops truncatus - the Atlantic bottlenosed dolphin<br />
The estimated minimum number of Atlantic bottlenosed dolphins<br />
found in the study area during the survey period of highest abundance<br />
is 6,254 (t 12,309, 95% CI) . The highest relative density for this<br />
species was in sampling Block I during October, 1979 . This species<br />
is not considered endangered . The stock size of Atlantic bottlenosed<br />
dolphins available to a shore-based fishery operated from Cape<br />
Hatteras in the recent past was estimated to be between 13,748 and<br />
17,000 individuals . No other estimated of the stock(s) of this<br />
species in the western North Atlantic are available .<br />
42
SPATIAL AND TEMPORAL DISTRIBUTION OF HUMPBACK WHALES<br />
IN THE CETAP STUDY AREA<br />
Robert D . Kenney, Donna R . Goodale,<br />
Gerald P . Scott, Howard E . Winn<br />
1 . This section reports on data compiled for a single endangered<br />
species, the humpback whale ( Megaptera novaeangliae ) . The interpretations<br />
presented are based not only on CETAP-collected data but also<br />
from the literature and previously unpublished data collected prior<br />
to the establishment of CETAP . The sources, year of collection, and<br />
number of sightings is as follows :<br />
Source Yr . of Collection # of Sightings<br />
Literature & unpublished Pre-1979 113<br />
Gulf of ME Sighting Network 1974-79 327<br />
CETAP 1979 419<br />
Ninety-four percent of these 859 sightings were positively identified<br />
humpback whales ; the remaining six percent were tentatively identified<br />
as such .<br />
2 . The temporal aspects of the humpback whale distribution<br />
(Figure 11) indicates the following :<br />
a . Winter sightings (December, January, February, and March)<br />
are low in number compared to all other months .<br />
b . The frequency of sightings rapidly increases during April and<br />
reaches a maximum in May .<br />
c . The frequency of sightings remains higher during May, June,<br />
July, and August than during other months .<br />
d . After the maximum in May, the frequency of sightings dimin-<br />
ishes over time except for the month of October when the sighting<br />
frequency was slightly higher than in September .<br />
e . Whale-watch boat sightings (the non-shaded portions of the<br />
bars in Figure 12 which result from extensive coverage of a limited<br />
area north of Cape Cod, MA )complement the pattern described in a<br />
through d above .<br />
3 . Spatially, the distribution of CETAP's humpback sightings<br />
43
(Figure 11) indicates a predominance of occurrence in the northern<br />
portion of the study area, i .e ., north of 40°N latitude . This area<br />
includes Georges Bank, the Great South Channel (southeast of Nantucket),<br />
and the Gulf of Maine . When all sightings are viewed (Figure 13),<br />
three highly localized regions of concentration within the Gulf of<br />
Maine become apparent . These three are Jeffreys Ledge (east of Cape<br />
Ann, MA), Stellwagen Bank (north of Cape Cod, MA), and the Province-<br />
town Slope (the western slope of the Great South Channel and adjoining<br />
the Nantucket Shoals) . It is thought that sighting effort bias may<br />
affect this interpretation but not negate it .<br />
4 . Humpback sightings occurred 70 percent of the time in water<br />
depths of 50 fathoms (91 .4 m) or less . The mean depth for the 1979<br />
sightings was 45 .9 fathoms (84 .1 m) . No significant difference in<br />
sighting distribution with respect to depth occurred over time .<br />
Both Figures1l and 13 show the predominance of humpback sightings<br />
over the shelf rather than over the continental slope or mid-Gulf<br />
of Maine Basins in spite of the fact that effort occurred over both<br />
shelf and off-shelf areas . Furthermore, the occurrence of sightings<br />
tends to follow the perimeters of Georges Bank and the Gulf of Maine .<br />
5 . No preferences or correlations between humpback occurrence<br />
and sea temperature are apparent from the data . Sea temperatures<br />
measured at sightings did vary with latitude and season, however .<br />
6 . The number of individual humpback whales per sighting, i .e .,<br />
the group size, varied slightly with time . The lower numbers of<br />
individuals per group occurred during winter months . Between<br />
February and August, the average number of individuals per group<br />
increased month by month from one whale per sighting in February<br />
to just over three whales per sighting in August . During the months<br />
of September, October, and November, the number of whales per group<br />
remained above two and a half, In absolute terms, the number of<br />
humpbacks per group varied between one and 25, but eighty-two<br />
percent of all groups sighted were comprised of three or fewer<br />
whales .<br />
7 . The CETAP data indicate, based on a low number of sightings<br />
44
over the outer continental shelf during spring and fall migratory<br />
seasons, that humpbacks,which commonly occur in the study area<br />
during late spring and summer,probably migrate offshore and outside<br />
of the study area .<br />
8 . A possible determining factor for the temporal and spatial<br />
distributions observed may be the seasonal occurrence of the American<br />
sand lance ( Ammodvtes americanus) a schooling fish thought to be an<br />
important prey item and one which is commonly reported during spring<br />
and summer from the same area as the humpback whale .<br />
45
45<br />
40<br />
34<br />
77 70 65'<br />
77 70<br />
Figure 11 . Plot of CETAP humpback whale, Megaptera novaeangliae ,<br />
sightings, 1 November 1978 to 9 January 1980, differentiated by<br />
data class ( the various data classes are detailed in Chapter II<br />
of the CETAP Annual Report for 1979) . The 2000 m depth contour<br />
is shown .<br />
46<br />
65<br />
45<br />
40<br />
3 4
~ 120<br />
~<br />
~ 105<br />
z<br />
-<br />
= 90<br />
V5<br />
W 75<br />
J<br />
Q<br />
2 .,<br />
?~ 5^<br />
Y<br />
V<br />
Q 45<br />
m a.<br />
~ ~ 30<br />
2<br />
LL<br />
0 15<br />
0<br />
z<br />
0<br />
J r M A M .J J K J U IV U<br />
MONTH<br />
Figure 12 . Frequency distribution of 1979 CETAP humpback whale<br />
sightings by month with and without sightings from M/V Dolphin III<br />
(a commercial whale-watch vessel operating out of Provincetown, MA) .<br />
47<br />
N<br />
a
70 6 8 6 6<br />
~<br />
l/ \<br />
.<br />
--- ~% ,<br />
44 - _ - / `'~ - - -- 44<br />
~ ` . ...1.<br />
.<br />
f \ lEFfRE r`3 lE0<br />
/><br />
i «I<br />
, S1EllwAGEN MN<br />
.+ ..o. •<br />
4 2 • a2<br />
11<br />
d1' a .. . .. . .leo<br />
' .RovtNCEroWN slo.[<br />
- ,<br />
• •<br />
70 68 66<br />
Figure 13 . Plot of all CETAP humpback whale sightings in the<br />
Gulf of Maine, including Gulf of Maine Whale Sighting Network<br />
(a cooperating program at the College of the Atlantic, Bar<br />
Harbor, ME) and various historical sightings . The three major<br />
concentration areas are designated . Depth contours shown are<br />
50 and 100 fathom lines .<br />
48<br />
,
RIGHT WHALE SIGHTINGS AND THE RIGHT WHALE MINIMUM COUNT<br />
Howard E . Winn, Donna R . Goodale, Martin A .M . Hyman,<br />
Robert D . Kenney, Carol A . Price, Gerald P . Scott<br />
1 . The right whale, Eubalaena glacialis , is considered by many<br />
to be the most endangered cetacean occurring in the study area .<br />
2 . In addition to the CETAP field sampling previously described,<br />
a number of special spring right whale shipboard and aerial surveys<br />
were conducted in 1979 and 1980 . These specialized surveys gave<br />
additional coverage to most portions of the Gulf of Maine, Georges<br />
Bank, and the continental shelf region south of New England and Long<br />
Island .<br />
3 . The resulting whole-year plot of the 119 sightings of right<br />
whales is shown in Figure 14 . The sightings generally consisted of<br />
1-3 individuals in relatively isolated groups . In 1979, the aggre-<br />
gations were statistically clustered (possibly due to patchy prey<br />
occurrence), with pod sizes of 1-4 individuals tied loosely with<br />
larger groups . Some data suggest a general dispersion at daylight<br />
and a reconcentration at dusk . A substantial number of sightings<br />
were made on the western edge of Georges Bank rather than in the<br />
expected nearshore areas . In general, most right whale sightings<br />
occurred between depths of 0-200 m .<br />
4 . These special surveys were employed to improve upon estimates<br />
of the number of right whales in the study area as determined from<br />
the dedicated aerial survey data . Thus, on 12 May 1979, an aerial<br />
survey designed with abundance estimation as its goal was carried<br />
out in a 9218 km2 trapezoidally shaped area known from previous days<br />
to contain a concentration of right whales . This area was centered<br />
east of Cape Cod, MA, at latitude 42°N and longitude 69°W . Resultant<br />
data were used to compute a point estimate of 66 right whales with a<br />
95 % confidence interval of 5 to 173 . Considering this estimate of 66<br />
right whales, the minimum count of 19 right whales (19 individuals not<br />
reduntantly counted during a single flight), and the estimate of 29±44<br />
49
(see page 40 ) based on the dedicated aerial survey, we estimate the<br />
population of right whales within the study area to be approximately<br />
100 but not less than 19 nor more than 173 . This estimate applies<br />
only to the period of highest abundance, lesser numbers occur at other<br />
times .<br />
5 . An annual cycle of distribution for the right whale is<br />
hypothesized, with an early spring northward migration along the<br />
200 m depth contour line or beyond, passage through the Great South<br />
Channel, then migration northward to northern Maine and Nova Scotia,<br />
and finally culminating with a southwestward return migration during<br />
late summer and fall . Three potential migratory routes appear to<br />
exist in the Gulf of Maine area .<br />
50
45<br />
40<br />
~4<br />
77 70 65<br />
7? 70 65<br />
Figure 14 . All right whale, Eubalaena glacialis , sightings from<br />
1 October 1978 to 9 January 1980 . Sightings are sorted by data<br />
class, as described in Chapter II and VI of the CETAP Annual Report<br />
for 1979 . 2000 m depth contour shown .<br />
51<br />
45<br />
4C<br />
Q~ ~
CORRELATIONS BETWEEN CETACEAN SIGHTINGS<br />
AND SELECTED ENVIRONMENTAL VARIABLES<br />
Richard K . Edel, Michael Cagan, James H .W . Hain, Peter W . Sorensen<br />
1 . Nineteen species or species' groups were commonly sighted<br />
during CETAP's 1979 field data collection effort . These species or<br />
groups are :<br />
a . Balaenoptera physalus<br />
b . Balaenoptera borealis<br />
c . Balaenoptera acutorostrata<br />
d . Balaenoptera species<br />
e . Megaptera novaeangliae<br />
f . Eubalaena glacialis<br />
g . Unidentified whale<br />
h . Physeter catodon<br />
i . Globicephala spp .<br />
j . Gram us riseus<br />
k . Phocoena phocoena<br />
1 . Lagenorhynchus acutus<br />
m . Tursiops truncatus<br />
n . Stenella spp . (spotted)<br />
o . Stenella coeruleoalba<br />
p . Delphinus del his<br />
q . Unidentified dolphin/porpoise<br />
r . Unidentified beaked dolphin<br />
s . Unidentified Stenella spp .<br />
2 . Sightings which occurred within the study area were investiga-<br />
ted for spatial patterns of occurrence using two techniques :<br />
univariate histograms and bivariate correlations . Two time bases<br />
were analyzed : the first used all sightings pooled over the calendar<br />
year ; the second used survey periods or semiseasons . In this way<br />
both whole year spatial distributions and semi-seasonal spatial dis-<br />
tributions were available for study .<br />
The histograms are particularly useful for interpretations in<br />
that they show the frequency with which a particular species or<br />
species' group was sighted at the various latitudes, longitudes,<br />
sea temperatures, and depths which characterize the study area .<br />
Thus,the histograms demonstrate visually any correlations between<br />
the occurrence of cetaceans and the four environmental variables<br />
mentioned . For this summary, the whole-year distributions are<br />
presented in Figure 15 . The figure should be interpreted as follows :<br />
a . For each of the nineteen species or species' groups<br />
52
listed in item 1 above, four histograms and corresponding statistics<br />
are given .<br />
b . Each histogram relates the frequency of sightings to one<br />
of the four environmental variables, i .e ., latitude, longitude, sea<br />
temperature, and depth of water under the sighting position .<br />
c . Each environmental variable has a range which is partitioned<br />
into intervals .<br />
d . Each sighting is put into the appropriate interval until<br />
all sightings for the species or species' group are accounted for .<br />
The numbers printed along the y-axis correspond to the mid-points<br />
of these intervals . The number of sightings per interval is indi-<br />
cated by a corresponding number of asterisks up to the number when<br />
the row of asterisks would run over into the next species field .<br />
When this occurs, the total number of sightings for the interval is<br />
printed out . A letter "m" or "n" indicates the mean or average<br />
interval of all sightings . The table below each histogram gives the<br />
standard summary statistics ( mean, standard deviation, standard<br />
error of the mean, maximum value, minimum value, and sample size)<br />
for each variable and species considered .<br />
When inspecting the histograms, one looks for similarities or<br />
differences between intervals within the histogram for the species<br />
and between intervals across the histograms for the different species .<br />
In this way variation of cetacean occurrence with respect to the study<br />
area's environmental variables is determinable not only for each species<br />
but also between species . This information allows one to make infer-<br />
ences concerning the effects of search effort as well as of preferred<br />
habitats or zones of occurrence .<br />
Bivariate correlations were investiqated to determine whether or<br />
not the site occurrences of a particular species are associated with<br />
geophysical factors in a particular way .<br />
3 . The results show that there are relationships not only<br />
between a species or species' group and its spatial and temporal<br />
distributions but also between two or more species or species'<br />
groups with regard to their spatial and temporal distributions .<br />
53
a . All of the baleen whales (B . physalus , B . acutorostrata ,<br />
Balaenoptera spp ., M . novaeangliae , E . glacialis , and Unidentified<br />
whale), except for the sei (B . borealis ), occupied the OCS between<br />
nearshore and the 200 m isobath sometime during the year . Included<br />
is the OCS within the Gulf of Maine especially the area just north<br />
of the Great South Channel .<br />
M . novaeangliae and E . glacialis either did not, or only temporarily<br />
occupied the OCS in the mid-Atlantic region during the<br />
cooler months . These species occupied the north-Atlantic region of<br />
the OCS during the warmer months but did not or only rarely occupied<br />
this region during the cooler months . B . borealis occurred during<br />
summer months only over the OCS slope southeast of Georges Bank .<br />
The sea temperatures measured at baleen whale sightings encom-<br />
passed a large range . Hence, sea temperature, by itself, does not<br />
appear to be a limiting factor, i .e ., within a given survey period<br />
temperatures would be changing to a limited extent, but baleen<br />
whales were found in both the cooler and warmer portions of the<br />
study area .<br />
b . The medium-sized toothed whales, P . catodon , Globicephala<br />
spp . and G . griseus, frequented a narrow zone consisting of the<br />
offshore portions of both the mid- and north-Atlantic regions of the<br />
OCS and the OCS slope . These areas correspond to depths between 50<br />
and 2000 m . P . catodon and G . riseus rarely entered the Gulf of<br />
Maine . Globicephala spp . entered the Gulf of Maine through both the<br />
Great South Channel and the Northeast Channel . P . catodon occurred<br />
over near-shore portions of the North-Atlantic OCS only during<br />
late summer and early fall .<br />
_--fhe mid-Atlantic region was occupied more often during the year<br />
than the north-Atlantic or Gulf of Maine region . Surmised migration<br />
takes place in a narrow band along the mid- and north-Atlantic OCS<br />
edge : movement is northward during the warming months and southward<br />
during the cooling months .<br />
Sea temperatures measured at sightings corresponded to the off-<br />
54
shore areas of occurrence ; the temperatures were wide ranging but<br />
nonetheless warmer than those measured at sightings of baleen whales .<br />
c . The small whales ( .dolphins and porpoises) are the remainder<br />
of the species or species' groups (k through s in section 1, above) .<br />
All nine species or species' groups occupied the OCS and/or its outer<br />
portions (the OCS edge and slope) between Cape Hatteras and Georges<br />
Bank sometime during the year . In the Gulf of Maine the primary<br />
small whale occupants are P . hop coena , L . acutus , and D . delphis .<br />
South of Georges Bank, T . truncatus , Stenella spp . (spotted), S .<br />
coeruleoalba , and D . del his made up the bulk of the sightings . T .<br />
truncatus occurred both nearshore between Cape Hatteras and New<br />
Jersey and offshore from Cape Hatteras to eastern Georges Bank . The<br />
spotted Stenella 's occurred more frequently in the southern part of<br />
the study area than the other small whale species except for T .<br />
truncatus .<br />
Broad ranges of sighting sea temperatures indicate that sea<br />
temperature is not a limiting factor . All species of the genus<br />
Stenella , however, occurred in water which was warmer than where the<br />
other species occurred .<br />
Semi-seasonal changes in occurrence patterns are probably<br />
caused by migration northward and southward along the OCS . It is<br />
surmised that many of these species occur just beyond the study area's<br />
seaward boundary and may migrate east-west into and out of the study<br />
area . In spite of large numbers of sightings, it is difficult to<br />
draw conclusions from the two species' groups, unidentified dolphin/<br />
porpoise and unidentified beaked dolphins due to the uncertainty of<br />
identification and accuracy and variation between species .<br />
55
N/OIOINIS<br />
. . MIrS4 0. IMOE4 E. KuIO Etl . Srr N. N01LE E. GltC1 uN10 . w1<br />
. . . . . . . . . . . . . . . . . . . . . . . . . . . . . . . . . . . . . . . . . . . . . . . . . . . . . . . . . . . . . . . . . . . . . . . . . . . . . . . . . . . . . . . . . . . . . . . . . . . . . . . . .<br />
.5 .0001 •<br />
tt .0001••. • .. .• •• .<br />
t) .0001 . . .. . . .• • .. . . .• • . .. . . ••.•.• . . . . .• . . .. .. • . . ... .•• .<br />
tj .0001 . . . . .. . . .. .12t • • . . . . .• .. .. .1~ • .. .. .• . .. . .t~ N . . .• .• .•• .• /1 N. . . . ... . . . .,S • . . . . ... . . . .2~<br />
W .1 .J00/N .• .. . . . .• .•t .<br />
t0 .0001 .•. . . . . . .. . .1 e •• • . .. .• • .. . . . . . .. . • . • N . . .. . . . . . .ry3<br />
F- 79 .OOJ1 . .. . . . .. . . . . • . ..• .• . .• • . . . . .. . . .<br />
• . . • . .• ••H. . . . .•<br />
J )T .ooo/• • . . . • . .•• -<br />
)4.000/•• • . . .. . .<br />
)+ .000+ . „<br />
GNYU . Nl A NS f.e oENI1rl0 e1 N•S 1 f nltr CnINCTOf rITN . - S . N•S nlNfNVi SE<br />
NE.N ti .lT . .0 .TO . t1 .tYO to.Itt a . . n ti .u) .a .Ta<br />
S10.OfY. l .) .! 0. . .! 1 .It4 I . .Sj ' 0. ./1 O .N2 2 .217<br />
S . E . N. 0.091 0 .21I 0 .1 .0 O .t17 0.0.) O.lj7 0.2]2<br />
Nt.INUN t) .112 .1 .SSS t7 .IlT t7.0 .2 .l .9 .2<br />
NININIM ) 5.92! .O .)OT ) 0 .000 ) S .tl/ ). . .31 ) I. .S0 7t .9ST<br />
W /'tE !1!E 2)0 3 3. .I llT t9 91<br />
E . rl/rf4 . . u1Nt• .. tCY1o .41. SiM N . NOY.E E. GLKI wflY. rN<br />
. . . . . . . . . . . . . . . . . . . . . . . . . . . .• . . . . . . . . . .. .. . . . . . . . . . .. . . . . . . . . . . . . . . . . . . . . . . . . . . . . . . . . . . .• . . . . . . . . . . . . . .•<br />
N1BW01NIS•<br />
I4 .OOJ1• •<br />
TS .00J1 .•.• . . . . . .. • . . ... .. . .<br />
Tt .00a1• . .••• .•• .• .1, • . ..... . . . . ... .<br />
0 /l .00J1 .• . .•••••• . .• . . . ••...• . . . . . .... . . . . . . .<br />
~ rj .000/• .• .••• .• ..• • • .. . . . . . • . . .<br />
~<br />
IO .JJYIN . . . . . .. ..• .9t . M . . .. . . .... .2! MH .• . . ..M.j• N .• . . . . . . .N17 •. . . . .•.N• . . . . . . . . . . ..22<br />
..f 4N .ITJ0/•• . . . . . •• . . . . . . . . . .• . .• .. •• .•.• .•<br />
b7 .00111 . . . . . . . . . .. N . .• ' • .. . . . . . •. . . . . .. •• .. . .<br />
••• • . •<br />
~S .J00/<br />
GN/NfP "E1NS M1 DEN01E0 nr 4 .1 1o 7NI;I COINC10l Y1 .N • ' S• N•S 01111N1/1SE<br />
NEtN 10 .t .! f~. .r00 •Y . .10 70 . .9! •0 .701 •9 .257 10 .410<br />
STU.Olv . 1 .~9! o.3a l ..n 2 . 2" 0 .990 l.!!0 2 .) .3<br />
S . E . N . 0 .l2'/ 0 .2 .1 0 .1lI 0 .2)• 0 .092 O.190 0 .250<br />
NtlINW1 TS .U f 4T .tfS Tt .T!! 7l .51T Tt .7 .0 19.250 7l .t1S<br />
NINIMY71 4l .E21 43 .10t 64 .t21 .5 .341 44 .043 4S .3.T •S .T00<br />
ItrMIE S121 270 S S . .r 111 419 9l<br />
Figure 15 . Histograms of the frequency of whale sightings at the<br />
various latitudes, longitudes, sea temperatures, and depths at the<br />
sighting position . The species or species' group names are fully<br />
written out in item 1 of the text . Explanations of the histograms<br />
and the univariate statistics located below each are given in text<br />
item 2 .<br />
r,A
' M . rMrS4 4 . nlN1EA 0 . ACWn n41 . Srr M . NOVEE E . :UCI UNIO . W/<br />
. . . . . . . . . . . . . . . . . . . . . . . . . . . . . . . . . . . . . . . . . . . . . . . . . . . . . . . . . . . . . . . . . . . . . . . . . . . . . . . . . . . . . . . . . . . . . . . . . . . . . . . .<br />
N1u .U1NIS •<br />
16 .000/<br />
)9 .500/<br />
3) .0001<br />
)1 .5001<br />
10.0U0/<br />
2E .S001 . . . . .<br />
21 .000/<br />
• . . .<br />
25 . 5 001•••••<br />
W 2~ .00111 . . . . .• .<br />
? 22 .l001• . .••• . . .<br />
.<br />
•<br />
•<br />
. . . .<br />
• .<br />
• . .•<br />
. .<br />
F 2t .0001•• . . . .<br />
~ 19 .9001 .• .• 69 .••<br />
y A ts .no01 . . . . . . . . . . .<br />
d 16 .5001 .• . .•<br />
.<br />
. . .<br />
. .••• .<br />
. . . . . . .<br />
• . . . . .•<br />
. ..<br />
. . . .• .•<br />
. .<br />
. . . . . .<br />
. . . . . . .<br />
.. . . . . . . .<br />
• . . .•<br />
1- I1 .S001N . . . . . . . . . . .61<br />
a IZ .OOOI . . . ..u . . u .2Z<br />
N IO .S001 . . . . . . . . . . . .22<br />
q :",o 000<br />
: : : : : : : : : :<br />
1 .500/ . . .• . . . . . . . .1/<br />
. .ooOl . . . . . . . . . . . .<br />
• .500/ . . . . . . . .<br />
M•<br />
.<br />
. . .•<br />
• . . . . . . ..• .<br />
N . . .• M . .<br />
• . . . . . .• . . . .t6 • . . . . . .1 . . . .•<br />
. . . . . . . . . . .<br />
. . . . . . .<br />
. .. . . . . .• . . . .• .<br />
. . . . . . . .<br />
••.• . . .•••<br />
. .. . . . . . . . . .2!<br />
~ .. . . . . . . . . .IS<br />
• . . . . . . . . . . . .•<br />
. . . . . . . . . .<br />
. . . . . . . .<br />
. . . . . . . . . ..<br />
. . . .<br />
• •••<br />
•• N . . .. . . . .•<br />
. . .<br />
• .• . . . .• • . . . .<br />
M . . . . . . . . . . . . . . . . .. .<br />
. . . . . . . . . . . . .• . . . . .<br />
. . . .• . . . . . . .<br />
. . .. . . . .. . . .<br />
1 .0001•<br />
I . SOOI .<br />
0 .0 1<br />
.<br />
. .<br />
. . e<br />
. . . .<br />
o<br />
GIIOIIP ME4NS 4ME nENOlEO NV M•S IF INEY COINCtO! YIT/1 • . S . N . S OfNE11MISE<br />
NE4N 13 .S1S 17 .~00 11 .911 11 .945 11 .T21 9.213 1) .)S)<br />
StIl .OEV . . S .S~) L/ 19 ) .96E 6 .~E1 ) .161 ) .E6E 6 .611<br />
S . E . N . 0 .)66 1 .220 O .SfO 0 .695 0 .]SI O.S)2 0 .69)<br />
MAi1MW1 29 .200 16 .300 2l .000 2E.900 2J .600 21 .800 21 .200<br />
NIN/NUN I .id0 9 .000 1 .100 1 .100 ] .500 3 .700 1 .I00<br />
SAMPIE SIZE 2)0 S 56 . 67 111 49 91<br />
0 . PNr S4<br />
0. O0EE4 6. ACU/0 041. SIP N. NOV6E 6 . I :L4CI UNIU. W/<br />
. . . . . . . . . . . . . . . . . . . . . . . . . . . . . . . . . . . . . . . . . . . . . . . . . . . . . . . . . . . . . . . . . . . . . . . . . . . . . . . . . . . . . . . . .• . . . . . . . . . . . . . . .<br />
N/uPG1N1S<br />
Jc00 .0U01<br />
31SO .0001<br />
)600 .OJ01<br />
)a)0 .0001<br />
3/00 .0001<br />
)15J .0UU1<br />
I0U0 .0001<br />
•<br />
2Ya0 .0001•<br />
2I00 .n001<br />
2)50 .0001<br />
• .<br />
. .<br />
.<br />
24 00 .0001•<br />
22SU .0-101<br />
. .<br />
,= 21U0 .0001 .<br />
~ I9S0 .U0o1 .•<br />
y~ IruO .UUo1•<br />
0 145U .OJ01<br />
. ..•<br />
ISOO .00U1••<br />
1.7S0 .UOU1<br />
12U0 .0U01•<br />
1050 .0u01•<br />
9UJ .OU01•<br />
. . .<br />
•<br />
. .<br />
150 .0001<br />
••<br />
600 .O00t<br />
4. Sn .0001•<br />
.<br />
N••<br />
.<br />
100 .000/<br />
N.•• •. . .•<br />
lSU .On0/M . . . . . . . . .• .E2<br />
U_0 1 . . . . . . . . . . .129<br />
N . . .. . .•• . . .16 • . .. . . . .. .• y2 N•• . . . . . . . . p•<br />
• . . .• . . . . . . .)i •• . . .• . . . ..a6 • . . .. . . . . . . .69<br />
M . .• ..• . . .•.) . • . . .• . . . . . . .Z6<br />
• . . . . . . . . . .. . . . . .• . . ..3)<br />
GMUUr NEANS 4ME UENU1E0 Yv N-S li INEV WINCIDE w1h/ ••S . N•S WNEMwISE<br />
ME4N 16Y .111 1t63 .0t10 116 .115 239 .INt t24 .291 150 .224 6)5 .021<br />
SfU.OEV . )/y .)S• b19.920 29V .1S• S61 .Y1/ 2SS .2Y2 13 .16E 'I12 .151<br />
S . l . M . 25 .J1 . 211 .216 )•/ .976 60 .Y16 2] .601 10.45) 101 .902<br />
N4YIMI/N 2E25 .U00 2lJ1 .000 1112 .000 211U .000 2045 .0U0 )1l.000 3460 .000<br />
NINIMtIN ll .llUV /)2 .OU0 1 .000 tY .UUII 5 .000 ).000 1E .00U<br />
SAMVtC SI IE 210 S $6 tl/ 111 .9 9l<br />
Figure 15 (continued) .<br />
57
3,<br />
• . . . . . . . . . . . . .. . . .M • . .. . . . . .• .. . . ..• . . ./00+•Ot<br />
. . . . . . . . . . .. . . .. . . . . . . . .• • . . .. . . . .• • . . . . ./OOP•it C<br />
• . . . . . . . . .• • .. . . . . .M •/OOt'6t p<br />
. . . . . . .• • . .. . . . . . • . .• . .1007•6( m<br />
. . . . .. . . .• . . .. .••• . • . . . .• . . .. . . . .•• .••• .••• .• • .• . . ./000•0+<br />
u . .• . . .. . .. . . . . . . . . . .• ' •N . .. . . . . . . . .-/00+•O+<br />
• • . . . . .• • .10011•0+<br />
. . . . . . . . . . . . . •/00?•t+<br />
• • . . . . . . . . . ..• /009•1+<br />
• . . . . . .• 1000•t<br />
• . . . .•<br />
/00+'71"<br />
/ OOP •>!+<br />
. /OOt•[+<br />
f Ot19•1+<br />
/Onn•++<br />
SINIUI01w<br />
. . . . . . . . . . . . . . . . . . . . . . . . . . . . . . . . . . . . . . . . . . . . . . . . . . . .. . . . . . . .~ . . . . . . . . . . . . . . . . . . . . . . . . . . . . .<br />
f1iSIN9 9 dS •0019 U0017,) d<br />
• . . . . . . . .. . . . . . • . . . . ..• . . . . .M1000•OI<br />
• . .. .• . .• • . . ..• ..u .1001•9f<br />
• . . . . . • . . . . .•/001•!t<br />
. ..•• . .. • . . . . . .1009•1[ r<br />
. ./0009t •<br />
•. . . . .• •• . .•IOOt •f(<br />
.• . . .•• .•• . . .. . . ./oOV•cc<br />
. . . . . . .•• . .• . . . . .• • .. . . . . . . .• . . .IO00•a<br />
)SI/IYiN10 S .N ~S .• /11111 DmNm Aiill dl S•w AN Oi/0N7U Ott Swt)w M111119<br />
S(1 101 041 iTIS 31IwtS<br />
COP•S( oS0'iC OP6•9t IMIw/N/M<br />
lif•1+ (11•(9 Z61•19 w0/1117w<br />
6t.0•0 fil•0 IP1•0<br />
Ofl'1 lit't 11P•1 •A 3 U•OtS<br />
f1L•~( ttt•i( !+6'!( w7)w<br />
S IN10dn1N<br />
• . . .• . .• . . .•• [t . .. . . . . .. . . . .. . . . . . . . . . . . . .1000'+f<br />
c+ . . . .. . . . .. . . . . . . . . . . . . . . . . . . .. . .• .••• . .• . ..looo•LI<br />
/000•71<br />
. . .. . . . . . . . . . . . . .loon•Il o<br />
. . 10t10-f0<br />
• . . ... . . . . . . . . . . . . . .. . . .. .• •1000•99<br />
• . . . . . . . . . . . . . . . . . . . . .IOIM•19<br />
. . . .. . . . . . . . . . .• • . .IO00•P9 r<br />
• . . . . . . . .. .• • . . ./000•69 0<br />
. . . . . . . . . . . . . . . . . . . . . . ./000-01 G`'f<br />
. . . . . . . . .N • .• .IOOO•it ~<br />
)SINY71/l11 S .N •S .• N(Inifll Iw/07 A11111 dl S .w A11 091tN/if1 i07 iNYIM dnOtl9<br />
ftl /Y1 001 1f71S ~1d1aS<br />
l09•97 lP+'S9 OOt•77 NIINININ<br />
LlP'+l ffl•SI i+P•S/ NnNIRtN<br />
s+l•O o+V0 l+r•O •Il •7 •S<br />
tPrl - tlla•t .0+•t •A ;0•ntS<br />
11 9•r1 ist'o1 ot+•rt M93w<br />
) 5T a.anbLJ<br />
11t1t1t9 9 dS 't/f11!1 011019 1 d<br />
. . . . . . . . . . . . . . . . . . . . . . . . . . . . . . . . . . . . . . . . . . . . . . . . . . . . . . . . . . . . . . . . . . . . . . . . . . . . . . . . . . . . . . . . . .<br />
•(panu L :Zuo :)-<br />
•<br />
. . . .. . .. . . . . . . . . . . . .<br />
89<br />
. .<br />
. . .••• .• .<br />
. . . . . .. .<br />
••• .. . . .. . . . .•• .<br />
ff .. . . .. . . . . . . . . . . . . .. . . . . . .M<br />
f( .• . . .. . . . . . . . .. . . . . . . . . . . .•<br />
. . . .<br />
• . . •
11<br />
1 0'0<br />
SIw10InIM<br />
11iS1Y90 d S 'OOl9 IX/Olt) d<br />
• . . . . . . . .. . . . . . . .• • . . .. .1000'6<br />
.. . . . .• 0t . . . . .. . . . . . . . . . . . . . . . . . . . . . .. . . . . . . . . .• .IOI•S•O1 LA m<br />
0 ..• . . . . . . . . . . . . . . .. . . . . . . . . . 0 . . . . . . . . ..looo•ii D<br />
•. . . . .• .•• . . . .. . . • . ..1005' ( 1 ~<br />
. . . . . . .. . . • . . . . . . ..1000•ft ~<br />
• . . . . .. . . . . . • . N . . .•• N •w • . . .•1005•9/ ~<br />
• . . . . . . . . . . . . . .• • . . . . . .• •• . . . . .w1000'il ~<br />
. . . . . . .M • . .. . . . . . . .. . . . •. . . . ./OOf•Ai D<br />
• . . . . . . . .. . . . .• . . .• • . . . . . .1000•Ir C<br />
. . . . .. . . . .• • . . . . . . . . . . . . . . ..IOM•tr ~<br />
. . . . . . . . . . .. . . . . . . . . . . . . . . . . . . . . . . . . . ./000•~z m<br />
. . . . . .. . . . . . . . . . . . . . . . . . . . . .1005•st<br />
. . .•• . . . . . . . .1000'tr<br />
. . . . . . . . . .. . . . . . . .• . . .lo0s• .z<br />
. . . . 1000•11f<br />
10of•1t<br />
1000•ft<br />
Io0S•tf<br />
S1w111 .OIM<br />
. . . . . . . . . . . . . . . . . . . . . . . . . . . . . . . . . . . . . . . . . . . . . . . . . . . . . . . . . . . . ~ . . . . . . . . . . . . . . . . . . . . . . . . . . . . .<br />
1000•t<br />
. 100f'1<br />
iS111Y11/10 S .w 'S .• 11119 i013tl102 A 1/11 !1 S .w AY 07111w)0 iwt CwtaW dnOY9<br />
Lft ft•1 001 371s ?Ild wti<br />
000•01 f/01•1 00f•i w/iw1w1w<br />
001•Lt OOt•Lt Oor•K wfwlrtw<br />
Oi1•0 >!1f•O iM•0<br />
•zz•f ~00•t I1 r '•<br />
•1f•61 •11• 91 If6'11 wtiw<br />
~<br />
. . . . . . . . . . . . . . . . . . . . . . . . . . . . . . . . . . . . . . . . . . . . . . . . . . . . . . . . . . . . . . . . . . . . . . . . . . . . . . . . . . . . . . . . .<br />
OiS1Y9 !1 ~S •0019 # OOOItj<br />
•,••• . . . . . 1o00•n00t<br />
• .. .1000•OOrf<br />
1o00•OOtit<br />
. .1000•OMt<br />
1000•00~f<br />
• .1000•1100•<br />
. . . . . .1000•OOVr<br />
•<br />
• . .1000•00Pr<br />
. . . . . . . .. . . .. . . . . . . . . . . .w . .. . . . . . . .l000•0001<br />
. . . ..w . . . . . .•• .1000•o0rl<br />
. . . . . . . . . . . . . . . . . . . . . . . . .1o00•OOSI<br />
.. . . . . . . . .. . .w1000'0011<br />
. ... . . . . . . . . ..• • . . . . . . . . . . . . . . . . . . . . . . . .1000•OON1<br />
. . . .. . . . . . . . . . . . . . . . . . . . . . . . . . . . . .t0on•o0nz m<br />
. . . ... . . . .. . . . . . . .. . . . . . . . ... . .. . . .looo•norr ~<br />
. ... . . . .• . . . ./on0•On~i =<br />
. . . .• . . . .. . . . . ..•• . . . . . .• . . . . . . . . . . . .• .. . . . . . . .t 0'0<br />
tt . . . .. . . . . . . . . . . . . . . . . . . . . . . os . . . . . . . . . . . . . . . . . . . . . . . . . . . . .lonn-oor<br />
. . . . .. . . . . . . . . . . . . . . ./n00•tlOt<br />
. . . .. . . . . . . . . .. . . . . . .1000•00 .<br />
iSf11YiN10 S .w •S . . 1111 M l0Ilw1U) 1>ftll !1 S .w AO O I /OMjn Owt fwt)w dtw109<br />
St1 101 001 lliS 3 l a wtS<br />
o00•lt OOn•f. o00•1S wnwlwiM<br />
000•66K o0n•Ontf 0n0'nS6t A1lwittw<br />
2 t0'1/ 06S•tv 0U!•6~ •w •3 •S<br />
IlL•A~~ OOS•l~• •A)n•01S<br />
~>!6'ZSiI 61S'~06 OS!'~f01 wt9w<br />
•(panuL4uoo) 91 aan6ij<br />
69
P rIMIC/lM I . 4CUIUS 1 IMtMICA SItNLLLt S CULNUL 0 UILPHI UNID. r0 UMIU . 00 UNIO. Sf<br />
. . . . . . . . . . . . . . . . . . . . . • . . . . . . . . . . . . . . . . . . . . . . . • . . . . . . . . . . . . . . . . . . . . . . . 6 . . . . . . . . .. . . . . . . . . . . . . . . . . . . . . . . . . . •<br />
N1UIO1f/1S •<br />
.<br />
'<br />
45 .0001• •<br />
4) .0001N••••••••Z7 •••••••••11 •••••0••• • .•<br />
N•• 004066119 0 0000* 0090 . 4. 00 42 H•MH •<br />
Q 0 . 6 . 0 .• 6. 0 ••.• .••••l) •• . .•••••2g •••• ••<br />
~ 4J .0001 . ••••••• • .. . . .. .•~V ••• •••••••••14 •••••••••li N••••••••31 ••••• •••• . .•• .14<br />
p". hi .11001 •• •• ••••••• N•••••• .•16 •••••••••2! N•• N••<br />
~ )11 .ouu/ . N .. . . . . . . .7 •••••• N••••••••Il •••••••••11 •••••••••)) ••• . . .<br />
¢ 11 .0Y/11 • • .•••24 N••••••••l) •••••• . .•12 •••• .••••12 ••••••• .•IS ••••• ••<br />
J 3 6 .IU0{J1 ••• .••.••l1 60006000412 • . .•• . . .. .• • . . . . .• • .• . . . . . .16 • . . • .•<br />
)5 .01)01 •••••••••11 ••• .• • • ••••••••••• ••<br />
••• ••••• ••<br />
GNOUr MEANS NIE UEN01t0 0 y !/•S If 1NEY COINCIOt M11// ••S . N•S O/NErwISE<br />
N[4N •2 .912 41 .615 f0 .0\l )6 .01L )0 .000 )9 .112 )9.511 11 .21) )9 .206<br />
SIO .0E9 . 1 .116 1 .021 1 ./S9 1 .601 1 .461 1 .591 2 .152 2 .650 1 .500<br />
1 . E . N . 0.110 0 .099 0 .115 0 .211 0 .192 0.153 0 .141 0 .4)l 0 .243<br />
M6MIMUN 44 .6)7 •1 .6')0 42 .122 40 .411 40 .441 42 .400 •4 .LSO 41 .26/ .1 .611<br />
N1N1N1/11 40 .651 )6 .96J 11.611 )1 .61/ )5 .140 )4 .900 34 .941 J4 .400 )6 .141<br />
SANrLE S11E 9) sls 434 . 46 $11 100 2l2 )I 2r<br />
r r11UC1/E L ACU1Uf I IMUNCt SiENELL6 S CUENUL 0 OELrlll UN10 . rU UN1U. 00 UNIO. S1<br />
. . . . . . . . . . . . . . . . . . . . . . . . . . . . . . . . .• . . . . . . . . . . . . . . . . . . . . . . . . . . . . . . . . . . . . . . . . . . . . . . . . . . . . . . . . . . . .. . . . . . . . •.<br />
. .<br />
NIOrtIN/i<br />
, 16 .000/ . . . . .. . . .1) . . . . .<br />
y 19 .0001 •••••••••11 ••• ••••• .••• , •••••••• .Iy ••••• ••<br />
IZ .0007 • 12 ••• .•<br />
••<br />
•••<br />
~ TO .000/•••••••<br />
J 61 .oQOl . . . .. . .. .ls<br />
. . . . .•, . .Z1 • .••••••• 1 .<br />
M . . . .. . ..a . . . .. . . . . .<br />
. .<br />
. . . . . . . .<br />
. . . . . .. . . . . . . . .. . . .ZO<br />
. . . . . .. . .IZ . . . . . . . . .)r<br />
. .. .<br />
. .. . . .<br />
N .<br />
. . .<br />
.o~o1N<br />
68<br />
. . . . . . . .)S . . . . .. . . .16 . . . . . . . . . . . . • •••• .•••• •••••• .••l7 ••• .• •••<br />
67 .ooai . . . . . . . . . .s . . . . .. . . . . . . . . . . ••• •••••••••• •••••••• .16 ••••••<br />
6S .o001 ,<br />
GfiOW NE6NS 6ME OENO/EU 09 M•S 1/• 1NE9 CUINCIDE M1111 ••S . M•S 0f1/ENM1)1<br />
NE4N 67 .021 69 .100 12 .402 11 .9)9 12 .021 70 .9I0 / 0.tl0/ T1 .69I 10.160<br />
Si0 .UE9 . 0 .944 1 .)l2 2 .591 2 .09i 2 .201 2 ./04 2 .772 2 .096 2 .909<br />
S . E . N . 0 .090 0 .120 0 .110 0.10) 0 .290 0.260 0 .1E2 0.469 0 .510<br />
A t1MUM 70 .46Y 14 .007 / 6 .150 76 .950 14 .192 17 .020 75 .760 /6 .51! 74 .643<br />
MINIMUM 4<br />
66 .4I1 66 .010 1 1 , 6S .61r 61.4)2 66 .54• 6S .01S 64 .71) 67 .16/ 67 .6f2<br />
SAMPLE SILL 'Il<br />
L14 44 1 4 100 2i2 li 20<br />
Figure 15 (continued) .<br />
60
O<br />
m<br />
V<br />
~<br />
S<br />
SINIOwOiw<br />
IOrr•R1 m~p<br />
IOOi'61 q<br />
IOrO'IZ C<br />
IOOS•22 70<br />
iJN1UID/M<br />
[S 'OIwO 00 •OIMfI fl/ •O1M(1 //117Y0 O 1IIYi0) S tl7iwilS 1)w11tl/ l frl/1)t 1 YN)fN1/ 4<br />
• . . . . . . . . . . .• . . . . . . . . . . .~ . . . . . . . . . . .~ . . . . . . . . . . .~ . . . . . . . . . . .~ . . . . . . . . . . ./ . . . . . . . . . . .~ . . . . . . . . . . . . . . . . . . . . . . .<br />
1000•lZ<br />
f00L'Yt<br />
•.• • . .• • .• . IOrO .Ot<br />
• trDS'It<br />
Ir00•tf<br />
/OOS•!f<br />
/ 0'tl<br />
IOOS'1<br />
/000•(<br />
•/OrS'!<br />
• . .• . .• . . ..• • . . ..• • . . . . .• . . . . .• .1000•9<br />
• . . . .IOOS't<br />
• • .• /t• . .• . . . .• O2• . . .• . . . . . . . .. • . . .•• • ... • . . ./000'A /n<br />
01 m<br />
• . .• • .. . . . 22 . .•• . . . .• . . . .N .• • . . . . .• 21 . .. . . . .•• It .• . . . . . .N/r00'Z1 b<br />
)SINYiN10 S .N •S .• 6411% i01)N10) 41H1 !1 $ .w t;0 OR1/N110 iN! SN97N AfINR9<br />
iZ ft ZIZ ROI •S 9+ !iZ SII tL it/i ?IldN9C<br />
OrS'A 000•F re0•1 000'Z OOl•9 OOf•01 1101•1 OOF•1 Or0•~ w11NININ<br />
OOZ•ZZ OOR•/Z OOF'RZ 00/•(R 000'Of 000'OF 001'II OOe'Ot DOR•91 MlwlttiN<br />
C16•0 1!1'1 Zt+•O 9l!•0 IRR•0 16f'0 1Af•0 IZ+•O f2Z•0 •N •i •S<br />
67Y•! [R1•! tLt'9 OS6'! 60l'0 S0+•S (Rf•S tiG•+ ZSI'2 •670'OIS<br />
L(1•el 002•(1 616'[1 K1•21 06l'11 (!2•I; Z•02 62+•[1 !K •I1 Nll iN<br />
!S '01N0 DO •0/110 O/ •OINtI IINI)0 0 111Ylf/) S IlliNllS Y)Nt1Yl 1 S/11/1)t 1 i0)I1N/ /<br />
~ . . . . . . . . . .~ . . . . . . . . .. .~ . . . . . . . . . . .~ . . . . . . . . . . .~ . . . . . . . . . . .~ . . . . . . . . . . .~ . . . . . . . . . . .~ . . . . . . . . . . .~ . . . . . . . . . . .<br />
. . . . . . /ooo•rc+I<br />
. . 1000•009t<br />
.. IDeO•os/t<br />
. . . . 10or•DD6I<br />
/f10r•0L0!<br />
1000•00l2<br />
• • • . . ..• • • •. .• . IOrr'DiSZ<br />
1000•0012<br />
• . . • . 1000'OSet<br />
•..• • . . . . .• •• • IrrO .OOOt<br />
.. • . . . . /000'OSIt<br />
..• • . . . . . . . • .• . ... •X • • . . . .. . .• .• /rr0'Of11Z<br />
• . .• • .• . .• . . .• ••• .. . . .• • . l1 . . . . . . . .• 21 . . . . . . . .• . .. .1000'00t<br />
1000'04+<br />
/OOr'009<br />
• N •.• •.• • . . . . .w •• 10f10•0S1<br />
•• • • . . .• . .N .•• •• •• • . .. . . . .• (000OD6<br />
IODr'•OL01<br />
1000'00Z1<br />
IDOO•0SC1<br />
IDDO'DOiI<br />
1000•0i91<br />
if/NYi/110 S .N •S .• NIIR it117N10) 47N1 !1 S .N AO 0l1f/N)O YYt SN .iN /fNNf9<br />
• . . .•• LE . . . . . . . .• tl . . .• . . ..• •• 11 . . .. .• . .• lS . . . . . . .•• ZZ. .• . .• . .• 92 . . . .• . .. .1 0•0<br />
RZ ft Zfi e01 eS 9! !I2 S11 (e . R2tS Bl/wtf<br />
000•69 000•91 D00•SI 000'Z• Or0'6! 000'12 000•1 000'11 00r•e1 wfININtN<br />
000'ZZ9t 000'S60Z 000•l! !( o00•Zt6( DDO'Zt6E 000'i[61 OtlO'16Z[ 000•961 : Or0•9S2 Ntlwlltcw<br />
!S9•Ofi IS1•[!1 9!O•!9 1160•901 +10'O[1 [92•14i !9!•CS 199•92 Otf•9 'N<br />
!i(•lA9 lif•O/e OlL'Ll6 •16•Olll •ii'066 6R6•CO[t v!e'!IY 406•Si7 f!0•19 •Ai0•OIS<br />
lli•ZN1 l67•01/ O62•R[e •N•N01 •[S•6itl JRS'!6[1 •17•[!! O([•6R1 Cl!•t21 NtlN<br />
•jpanuLZuoO) 91 aan6LJ<br />
19
FEEDING BEHAVIOR OF THE HUMPBACK WHALE<br />
James H,W . Hain, Gary R . Carter, Scott D . Kraus,<br />
Charles A . Mayo, Howard E . Winn<br />
. 1 . Feeding behavior of the humpback whale, Megaptera novaeangliae ,<br />
was observed on well over 100 occasions from April 1977 to May 1980 .<br />
Observations were made in the area of West Quoddy Head, ME ; Mt . Desert<br />
Rock ; Steliwagen Bank, north of Cape Cod, MA ; the waters east and<br />
southeast of Cape Cod ; and southeast of Block Island, RI (refer to<br />
Figure 16) . Feeding, or apparent feeding, was reported for individuals<br />
and for groups of up to 20 whales .<br />
2 . These observations indicate that the humpback whale possesses<br />
a diverse repertoire of multifaceted feeding behaviors . The result-<br />
ing catalog of behaviors includes two principal categories : (1)<br />
swimming/lunging behaviors, and (2) bubbling behaviors . A behavior<br />
from a given category may be used independently or in association with<br />
others, and by individual or groups of humpbacks .<br />
3 . The swimming/lunging behavior category includes (a) lunge<br />
feeding, and (b) circular swimming/thrashing behavior . The lunge<br />
feeding is an upward rush at the sea surface with the longitudinal<br />
axis of the body intersecting the plane of the surface at an angle of<br />
30-900 . As the whale breaks the surface, the mouth is agape, and<br />
quite often an enormously distended throat region is seen . Up'to<br />
one third of the body length clears the surface before the whale<br />
falls or settles back into the water . Lunge feeding was recorded<br />
in 21% of all feeding observations . The speed of the lunge varies<br />
from a vigorous and rapid lunge to an almost slow-motion rise . Both<br />
single animals and groups employ th .is behavior . In several instances,<br />
humpbacks were observed lunge feeding in formation . Five or six<br />
humpbacks arranged side by side and slightly staggered of one another<br />
performed the movements described above in unison . Because of the<br />
appearance of the whales' spatial arrangement, this coordinated<br />
feeding mode has been termed "echeloned" lunge feeding .<br />
In the circular/thrashing behavior, the humpback swims in a<br />
broad circle on a horizontal plane at or near the surface, roiling<br />
62
the surface with flippers and flukes as it swims . This was followed<br />
in many, but not all, cases by a feeding rush through the circle,<br />
4 . In the second major category, underwater exhalations are<br />
employed in a heterogeneous assembly of feeding behaviors, all using<br />
underwater "bubbling" in some way . This bubbling behavior was<br />
relatively common, and occurred in 52 % of all feeding observations .<br />
In spite of the apparent diversity, some classification is possible .<br />
The structures formed by the underwater exhalations are of two<br />
types : (1) bubble column--a smaller (1-1 .5 m diameter) structure<br />
composed of larger, randomly sized bubbles, used in series or multi-<br />
ples ; (2) bubble cloud--a single, relatively large (4-7 m diameter),<br />
dome-shaped cloud formed of small, uniformly sized bubbles . Both<br />
of these basic structures are employed in a variety of ways, as<br />
shown in Figure 17 .<br />
Bubble columns are formed by the underwater exhalations of a<br />
whale swimming from 3-5 m (estimated) below the surface . As the<br />
bubble bursts are released, they rise vertically to the surface in<br />
the form of a somewhat ragged column . These bubble columns are<br />
used in sequences of from 4-15 in number to form rows, semi-circles,<br />
and the complete circles which have been termed bubble nets .<br />
Bubble clouds show marked differences to the bubble columns<br />
described above . In this case a single large underwater exhalation<br />
forms a dome-shaped "cloud" . The cloud is quite narrow initially,<br />
but expands as it rises toward the surface . The activity of the<br />
whale following creation of the cloud shows a good degree of varia-<br />
tion, as illustrated in Figure 18 . Although most often bubble<br />
clouds are used singly, they were also observed used in series or<br />
multiples . These clouds possess the same characteristics as those<br />
already described, but are used in groups, often in threes, by one<br />
or more humpbacks .<br />
5 . The most common prey species observed in association with<br />
these behaviors (50-75 % of total feeding observations) was the<br />
American sand lance, Ammodytes americanus , However, at least one<br />
other species is a target for humpback feeding behaviors, Humpbacks<br />
63
in the West Quoddy Head, ME, area took herring, Clupea harengus ,<br />
from inshore waters or within coves using the bubble cloud and<br />
lunge feeding techniques on a number of occasions . While the prey<br />
are often observed in or around the various structures created by<br />
the whale, the exact effect of the whale's feeding behavior on the<br />
prey species, and the advantage conferred to the whale, remains<br />
poorly understood at this time . For example, one hypothesis has<br />
it that prey are concentrated by the bubble net structures, while<br />
our present view is rather that the bubble net, as well as similar<br />
structures, serves only to maintain or corral naturally occurring<br />
patches or schools of prey . It is also presently unknown whether<br />
environmental factors, some characteristic of the prey species,<br />
or perhaps prey density, influences the choice of feeding method .<br />
6 . While the bubbling behavior appears to be common in associa-<br />
tion with feeding, underwater bubbling, even in the presence of<br />
feeding activity, may not always be directly related to feeding .<br />
Also, a number of examples are known where underwater exhalations<br />
occur in distinctly non-feeding situations ( .e .g ., the apparent use<br />
of bubble screens as camouflage to protect a calf or mother-calf pair .<br />
64
700<br />
450<br />
450 650<br />
:' s ? NO VA<br />
~ W EST-*•!•. • SCOTIA '"<br />
QUOODY'<br />
HEAO .<br />
\ , v~-~ .^ t` r ..a l t 1 ~<br />
1 ~- . ..~<br />
: .~ X ~ ~ DESERT 2<br />
C ROC~C r<br />
-<br />
` GEORGES<br />
C~<br />
;;tt<br />
~ 11L i J ~~r~<br />
BANK <<br />
_J/<br />
~; . STELLWAGEN BAN K<br />
CAPE C00<br />
0 50 100 km<br />
.<br />
0 50<br />
nautical mi .<br />
. :., ~<br />
BLOCK I .<br />
rr~ ~<br />
. ~ .. ~<br />
. ,<br />
~j ;s<br />
I<br />
400 70°<br />
Figure 16 . Study area where observations of feeding behaviors<br />
were made . Place names on chart are those referred to in text .<br />
65<br />
t<br />
650<br />
400
~<br />
A<br />
,-<br />
,<br />
,<br />
' i B<br />
. ,<br />
~<br />
a ~ ~ F<br />
v 4<br />
. ~<br />
O~<br />
D<br />
C<br />
Figure 17 . A diagrammatic representation of the seven types of bubbling behaviors associated<br />
with feeding in humpbacks . A through D are structures using bubble columns , which are 1-1 3, m<br />
in diameter and composed of non-uniform sized bubbles (estimated at > 2 cm) . E through G are<br />
bubble cloud structures, 4-7 m in diameter and composed of uniformly sized bubbles (estimated<br />
at < 2 cm) . A . Bubble row . B . Bubble row with "crook", whale feeding location shown .<br />
C . V or semicircle shaped bubble curtain . Whale feeds in and through open side of the semicircle.<br />
0 . Complete circular formation, or bubble net . E . Single bubble cloud . In this<br />
example, one of several variations, whale lunge feeds through center . F . Triangular formation<br />
of multiple bubble clouds . G . Linear formation of multiple bubble clouds .<br />
66
A<br />
r<br />
~<br />
Figure 18 . Diagrams illustrating the five feeding variations observed associated with bubble<br />
clouds. A . Whale lunge feeds vertically through middle of cloud . B . Whale apparently feeds<br />
underwater and upon completion is seen to rise slowly in midst of spent bubble cloud . C .<br />
Whale lunge feeds to one side of cloud . 0 . Whale surfaces alongside cloud, emits a weak blow,<br />
dives down, and reappears lunge feeding through the center . E . Whale is seen to rise up along-<br />
side of still rising cloud, and feed, mouth open, between the cloud and the water's surface .<br />
F7<br />
D<br />
9<br />
E
SEA TURTLES IN THE REGION BETWEEN<br />
CAPE HATTERAS AND NOVA SCOTIA IN 1979<br />
C . Robert Shoop, Thomas L . Doty, Nancy E . Bray<br />
1 . Four species of sea turtles were reported in the study area .<br />
The loggerhead sea turtle ( .Caretta caretta ) holds threatened status ;<br />
Kemp's ridley turtle ( Lepidochelys kempil , leatherback turtle ( .Dermochelys<br />
coriacea ), and the Florida sub-population of the green sea turtle<br />
( Chelonia mydas ) are classified as endangered . Prior to this study,<br />
occurrences of these animals in the area were known primarily from<br />
reports of dead animals found on shore and from incidental reports by<br />
individuals encountering the animals offshore . Nesting loggerheads<br />
have long been known from Virginia southward .<br />
2 . Our primary source of data acquisition was by aerial surveys<br />
conducted from a Beechcraft AT-11 flown at an altitude of 750 feet .<br />
This platform provided information on relative densities and distributions<br />
of sea turtles throughout the year . Additional observations<br />
from U .S . Coast Guard HU-16E (Grumman Albatross) aircraft flown at<br />
an altitude of 500 feet supplemented the primary data . Observations<br />
from a single engine aircraft provided data on near-shore occurrences<br />
and nesting areas . Sightings by observers on ships,of opportunity<br />
and U .S . Coast Guard vessels were also used for distributional<br />
analysis . Governmental agencies provided information on sea turtle<br />
nesting in several areas .<br />
3 . The information presented is based on aerial observations of<br />
842 loggerhead sea turtles (Figure 19), and 56 leatherback turtles<br />
(Figure 20),in addition to stranding and individual reports, Sea<br />
turtles were observed from April through November in the study area .<br />
Although both leatherbacks and loggerheads were found in lease<br />
sale areas (Lease Sale Areas 40, 42, 49, 52, and 59), loggerheads<br />
were most common in areas 40, 49, and 59 off the mid-Atlantic coast .<br />
Leatherbacks were most likely to be seen in the Gulf of Maine and<br />
Lease Sale Areas 42 and 52 near New England .<br />
4 . The occurrences and relative abundances of sea turtles in<br />
the study area changed throughout the year in relation to sea surface
temperature . Surface sea water temperatures were closely correlated<br />
with the spatial .distribution of all turtle species . Ninety-seven<br />
percent of all turtles sighted from the AT-11 were in water from<br />
163to greater than 26°C . Leatherback turtles were observed more<br />
frequently in colder waters at higher latitudes during the summer<br />
than the other species . Most turtles observed were in water less<br />
than 60 m in depth . Loggerhead sea turtles were by far the commonest<br />
sea turtles . Minimum abundance during late summer is estimated at the low<br />
thousands of animals . These occurred over the Outer Continental<br />
Shelf mainly south of Cape Cod, MA . Leatherbacks were observed<br />
throughout the study area . Peak estimates of relative abundances<br />
during summer were in the hundreds . Kemp's ridley turtles were not<br />
observed but were reported as the strandings of juveniles on the<br />
shdre of Cape Cod, MA . A single stranding of a green sea turtle on<br />
the Outer Banks of North Carolina was also reported . Insufficient<br />
data exist at this time for a better assessment of Kemp's ridley<br />
and green sea turtle status in the study area .<br />
5 . Sun glare greatly affected the observers' ability to make<br />
turtle sightings from the survey aircraft . However, no correlation<br />
between observed Beaufort sea state and number of turtles sighted<br />
was demonstrated . An important variable wh .ich may have affected<br />
the observations is the time of day that the observations were made .<br />
Definitive studies related to the activity of sea turtles at the sea<br />
surface are lacking .<br />
6 . In the study area loggerhead sea turtles regularly nest on<br />
Virginia and North Carolina beaches although the number of nests is<br />
very small compared to the major nesting areas father south in North<br />
Carolina through Florida . One nest was reported from New Jersey .<br />
7 . Although few sea turtles nest in the study area based on the<br />
large number of turtles present there, it is probably an area for<br />
feeding, or migration to and from feeding areas . The stranding on Cape<br />
Cod of 22 Kemp's ridley turtles over several years indicates that the<br />
Cape Cod area may be near a feeding ground for juveniles of this most<br />
endangered of sea turtle species .<br />
69
45<br />
40<br />
34<br />
77 70 65<br />
77 70 65<br />
Figure 19 . Plot of all sightings of loggerhead sea turtles, Caretta<br />
caretta from 1 October 1978 to 9 January 1980, sorted by data class<br />
(data classes and their symbols are explained in Chapter IX of the<br />
CETAP Annual Report for 1979) . The 2000 m depth contour is shown to<br />
delineate the approximate boundary of the OCS .<br />
45<br />
40<br />
34
77 70 65<br />
45 45<br />
40<br />
.~ y..<br />
A<br />
f + A + '<br />
~\ l At + +<br />
C<br />
~<br />
,. A<br />
1 f' I<br />
~<br />
A<br />
•<br />
+<br />
+ +f<br />
«} , 40<br />
N ;.~4- + ~r<br />
# ~ -<br />
i f : d J,<br />
--r<br />
+ T~<br />
~~ Y.<br />
SYMBOL OATA CLASS<br />
1 + R, 0 . G . T<br />
.,~ ° 0 P . 0<br />
A F 1 . F 2<br />
X R . W<br />
~ O F3 . F4<br />
34 34<br />
77 70 65<br />
Figure 20 . Plot of all sightings of leatherback sea turtles, Dermochelys<br />
. coriacea , from 1 October 1978 to 9 January 1980, sorted by data class (data<br />
classes and their symbols are explained in Chapter IX of the CETAP Annual<br />
Report for 1979) . The 2000 m depth contour is shown to delineate the<br />
approximate boundary of the OCS .<br />
71
PHOTOGRAMMETRIC INVESTIGATION OF CETACEAN MORPHOMETRY<br />
Gerald P . Scott, Mary Ratnaswamy, Howard E . Winn<br />
1 . When CETAP conducts its rigorous aerial surveys, vertical<br />
photographs of large-whale species are taken whenever possible .<br />
Vertical photographs, taken with a calibrated system, enable an<br />
investigator to measure various animal lengths (direct measures of<br />
total length and measures of the lengths of certain body parts) .<br />
When only body part lengths are obtainable, methods exist to extrapo-<br />
late total whale length as well . All measured and extrapolated<br />
lengths can be used to characterize the relative age distribution<br />
of a species, and to estimate vital population parameters such<br />
as recruitment .<br />
. 2 . CETAP's chartered survey aircraft carry dual Hasselblad<br />
MK-70, 70 mm electrically driven cameras mounted through the belly<br />
of the aircraft . A third Hasselblad, aimed at an instrument panel,<br />
simultaneously photographs the flight data necessary for photo-<br />
grammetric calculations, and the time, which is needed to discriminate<br />
the data and photographs for an individual whale .<br />
3 . This CETAP photogrammetry system was calibrated by aerially<br />
photographing a stranded, dead humpback whale which was concurrently<br />
measured by a ground truthing crew . The photo scale found to be<br />
optimal in terms of minimum photogrammetric error is between 1 :2500<br />
and 1 :5000 . These scales correspond to flight altitudes of 500 to<br />
1000 feet . Photogrammetric error at these altitudes and scales lies<br />
between 3 .0 and 15 .0 percent, i .e ., ± 0 .3 to ± 1 .5 m for a 10 m<br />
actual length . This precision should be sufficient to permit the<br />
assignment of photogrammetrically measured cetaceans into generalized<br />
age classes such as calf, subadult, and adult .<br />
4 . Preliminary results on the right whale ( Eubalaena glacialis )<br />
indicate that calculations of total length from six measured snout-<br />
to-blowhole lengths appear consistent with lengths found in the<br />
literature .<br />
72
CETACEAN RESPONSES IN ASSOCIATION WITH THE REGAL SWORD OIL SPILL<br />
Donna R . Goodale, Martin A .M . Hyman, Howard E . Winn<br />
1 . On 18 June 1979 the Liberian freighter REGAL SWORD collided<br />
" with the tanker EXXON CHESTER southeast of Cape Cod . As a result<br />
of the collision, the REGAL SWORD sank and began to leak fuel oil<br />
from its tanks . The vessel was reported to have 307 .2 kiloliters<br />
of bunker C and 24 kiloliters of number 2 fuel oil on board .<br />
2 . On 20 June,the U .S . Coast Guard informed the Cetacean and<br />
Turtle Assessment Program ( .CETAP) that 22 to 25 cetaceans were<br />
observed within 5 nautical miles of the oil source . CETAP proceeded<br />
to develop and initiate a systematic aerial survey of the wreck<br />
area (Figure 21) at this time .<br />
3 . The oil leakage occurred at a location determined by CETAP<br />
to be part of a major cetacean feeding area . CETAP was thus afforded<br />
a unique opportunity to observe cetaceans in and near an oil "spill" .<br />
4 . The spill area was aerially surveyed multiple times by<br />
CETAP and BLM scientists on 20 and 21 June . A later flight was<br />
made by a CETAP observer on board a USCG plane on 26 June .<br />
5 . All survey flights of the spill area resulted in the sighting<br />
of cetaceans (Fig . 22) . Also sighted in the area were a sea turtle (only<br />
tentatively identified) and several sharks . Three of six cetacean<br />
species sighted were large baleen whales considered to be endangered<br />
species . These were the finback whale ( Balaenoptera h salus), the<br />
humpback whale ( Megaptera novaeangliae ), and the northern right<br />
whale (Eubalaena glacialis ) . The remaining three species sighted<br />
were the pi.lot whale ( Globicephala spp .), the harbor porpoise<br />
(Phocoena phocoena ), and the white-sided dolphin ( Lagenorhynchus<br />
acutus ) . Other cetaceans which were sighted could not be identified<br />
with certainty .<br />
6 . Calves were seen accompanying adults of three species :<br />
' Globicephala spp ., B . h salus, and M . novaeangliae , observed in<br />
the spill area .<br />
7 . Behavior inferred to be feeding was observed in B . pnysalus ,<br />
73
M . novaeangliae , and L . acutus both within and outside of the oil<br />
spill .<br />
8 . No attraction or repulsion effect was observed between<br />
cetaceans and the oil spill . Furthermore, no effect of the oil on<br />
the cetaceans which were feeding was apparent during the short time<br />
period the cetaceans were observed .<br />
74
42'<br />
72•<br />
BOSTON<br />
70• 68•<br />
~ \ ~_ - 2ppfm t)<br />
.. ~00<br />
\6 \ \ (~ ~~i<br />
. ~ i<br />
~ 12 ~i<br />
~ 4 , ~00<br />
t<br />
Figure 21 . The study area involved with the sinking of the Regal<br />
Sword . The small, inner rectangle is the USCG-defined oil spill<br />
area . The cross indicates the wreck position . Numbered lines<br />
are CETAP-designated flight tracks used in the CETAP surveys .<br />
7z- 70• 68•<br />
41 • b<br />
80STON t<br />
,20ofm? j<br />
~<br />
N ~<br />