

Site suitability evaluation for ecotourism using MCDM methods and GIS: Case study- Lorestan province, Iran
Abstract On based environment, ecotourism led to preserve the environment and on based economic, ecotourism led to dynamical economic in local association by creating a labor and an income. On this base, recognize the sufficiency and procedures of development the nature in different geographic regions were important. This study compared the two methods of GIS-based Analytic Hierarchy Process (AHP) and Fuzzy Analytic Hierarchy Process (FAHP) in evaluation of the ecotourism potential in Khorram-Abad country. First, in this process the criteria and sub-criteria were determined and by using the Delphi technique and expert's knowledge the weights of criteria were appointed. Then, required maps were produced and integrated with corresponding weights and ecotourism potential map of study area was produced in both methods of AHP and FAHP. The result of study showed that study area have high potential for ecotourism and in each produced map from two methods of AHP and FAHP, more than 45 percentage of study area had excellent and good classes potential.
Abstract
On based environment, ecotourism led to preserve the environment and on based economic, ecotourism led to dynamical economic in local association by creating a labor and an income. On this base, recognize the sufficiency and procedures of development the nature in different geographic regions were important. This study compared the two methods of GIS-based Analytic Hierarchy Process (AHP) and Fuzzy Analytic Hierarchy Process (FAHP) in evaluation of the ecotourism potential in Khorram-Abad country. First, in this process the criteria and sub-criteria were determined and by using the Delphi technique and expert's knowledge the weights of criteria were appointed. Then, required maps were produced and integrated with corresponding weights and ecotourism potential map of study area was produced in both methods of AHP and FAHP. The result of study showed that study area have high potential for ecotourism and in each produced map from two methods of AHP and FAHP, more than 45 percentage of study area had excellent and good classes potential.

You also want an ePaper? Increase the reach of your titles
YUMPU automatically turns print PDFs into web optimized ePapers that Google loves.
J. Bio. & Env. Sci. 2014<br />
(5)<br />
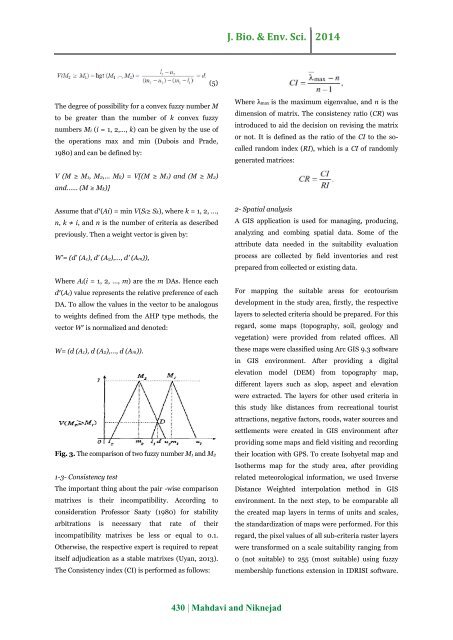
The degree of possibility <strong>for</strong> a convex fuzzy number M<br />
to be greater than the number of k convex fuzzy<br />
numbers Mi (i = 1, 2,…, k) can be given by the use of<br />
the operations max <strong>and</strong> min (Dubois <strong>and</strong> Prade,<br />
1980) <strong>and</strong> can be defined by:<br />
Where λmax is the maximum eigenvalue, <strong>and</strong> n is the<br />
dimension of matrix. The consistency ratio (CR) was<br />
introduced to aid the decision on revising the matrix<br />
or not. It is defined as the ratio of the CI to the socalled<br />
r<strong>and</strong>om index (RI), which is a CI of r<strong>and</strong>omly<br />
generated matrices:<br />
V (M ≥ M1, M2,… Mk) = V[(M ≥ M1) <strong>and</strong> (M ≥ M2)<br />
<strong>and</strong>…… (M ≥ Mk)]<br />
Assume that d′(Ai) = min V(Si≥ Sk), where k = 1, 2, …,<br />
n, k ≠ i, <strong>and</strong> n is the number of criteria as described<br />
previously. Then a weight vector is given by:<br />
W'= (d' (A1), d' (A2),…, d' (Am)),<br />
Where Ai(i = 1, 2, …, m) are the m DAs. Hence each<br />
d′(Ai) value represents the relative preference of each<br />
DA. To allow the values in the vector to be analogous<br />
to weights defined from the AHP type <strong>methods</strong>, the<br />
vector W′ is normalized <strong>and</strong> denoted:<br />
W= (d (A1), d (A2),…, d (Am)).<br />
Fig. 3. The comparison of two fuzzy number M1 <strong>and</strong> M2<br />
1-3- Consistency test<br />
The important thing about the pair -wise comparison<br />
matrixes is their incompatibility. According to<br />
consideration Professor Saaty (1980) <strong>for</strong> stability<br />
arbitrations is necessary that rate of their<br />
incompatibility matrixes be less or equal to 0.1.<br />
Otherwise, the respective expert is required to repeat<br />
itself adjudication as a stable matrixes (Uyan, 2013).<br />
The Consistency index (CI) is per<strong>for</strong>med as follows:<br />
2- Spatial analysis<br />
A <strong>GIS</strong> application is used <strong>for</strong> managing, producing,<br />
analyzing <strong>and</strong> combing spatial data. Some of the<br />
attribute data needed in the <strong>suitability</strong> <strong>evaluation</strong><br />
process are collected by field inventories <strong>and</strong> rest<br />
prepared from collected or existing data.<br />
For mapping the suitable areas <strong>for</strong> <strong>ecotourism</strong><br />
development in the <strong>study</strong> area, firstly, the respective<br />
layers to selected criteria should be prepared. For this<br />
regard, some maps (topography, soil, geology <strong>and</strong><br />
vegetation) were provided from related offices. All<br />
these maps were classified <strong>using</strong> Arc <strong>GIS</strong> 9.3 software<br />
in <strong>GIS</strong> environment. After providing a digital<br />
elevation model (DEM) from topography map,<br />
different layers such as slop, aspect <strong>and</strong> elevation<br />
were extracted. The layers <strong>for</strong> other used criteria in<br />
this <strong>study</strong> like distances from recreational tourist<br />
attractions, negative factors, roods, water sources <strong>and</strong><br />
settlements were created in <strong>GIS</strong> environment after<br />
providing some maps <strong>and</strong> field visiting <strong>and</strong> recording<br />
their location with GPS. To create Isohyetal map <strong>and</strong><br />
Isotherms map <strong>for</strong> the <strong>study</strong> area, after providing<br />
related meteorological in<strong>for</strong>mation, we used Inverse<br />
Distance Weighted interpolation method in <strong>GIS</strong><br />
environment. In the next step, to be comparable all<br />
the created map layers in terms of units <strong>and</strong> scales,<br />
the st<strong>and</strong>ardization of maps were per<strong>for</strong>med. For this<br />
regard, the pixel values of all sub-criteria raster layers<br />
were trans<strong>for</strong>med on a scale <strong>suitability</strong> ranging from<br />
0 (not suitable) to 255 (most suitable) <strong>using</strong> fuzzy<br />
membership functions extension in IDRISI software.<br />
430 | Mahdavi <strong>and</strong> Niknejad

![Review on: impact of seed rates and method of sowing on yield and yield related traits of Teff [Eragrostis teff (Zucc.) Trotter] | IJAAR @yumpu](https://documents.yumpu.com/000/066/025/853/c0a2f1eefa2ed71422e741fbc2b37a5fd6200cb1/6b7767675149533469736965546e4c6a4e57325054773d3d/4f6e6531383245617a537a49397878747846574858513d3d.jpg?AWSAccessKeyId=AKIAICNEWSPSEKTJ5M3Q&Expires=1716768000&Signature=dQ%2BEhx8obxfNTQdyNJi0Sj6udis%3D)


