

Property Sector Charter 2017
2015/2016 State of Transformation Report for the South African Property Sector
2015/2016 State of Transformation Report for the South African Property Sector

You also want an ePaper? Increase the reach of your titles
YUMPU automatically turns print PDFs into web optimized ePapers that Google loves.
GoG <br />
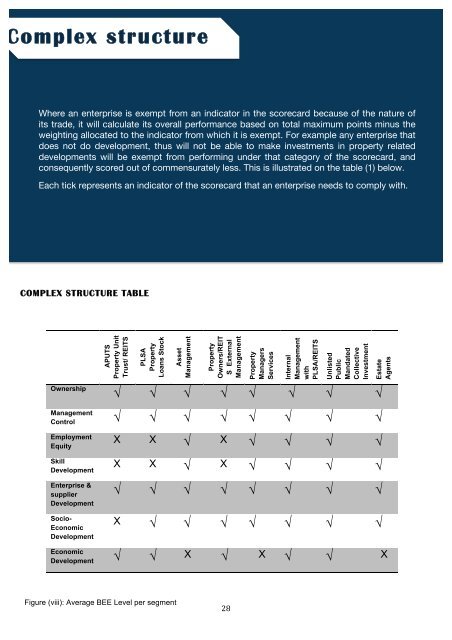
Complex structure<br />
<br />
Where an enterprise is exempt from an indicator in the scorecard because of the nature of<br />
its trade, it will calculate its overall performance based on total maximum points minus the<br />
weighting allocated to the indicator from which it is exempt. For example any enterprise that<br />
does not do development, thus will not be able to make investments in property related<br />
developments will be exempt from performing under that category of the scorecard, and<br />
consequently scored out of commensurately less. This is illustrated on the table (1) below.<br />
Each tick represents an indicator of the scorecard that an enterprise needs to comply with.<br />
COMPLEX STRUCTURE TABLE<br />
Ownership<br />
APUTS<br />
<strong>Property</strong> Unit<br />
Trust/ REITS<br />
(external PLSA<br />
managent) <strong>Property</strong><br />
Loans Stock<br />
(external Asset<br />
management)<br />
Management<br />
<strong>Property</strong><br />
Owners/REIT<br />
S External<br />
Management<br />
<strong>Property</strong><br />
Managers<br />
Services<br />
Internal<br />
Management<br />
with<br />
PLSA/REITS<br />
Unlisted<br />
Public<br />
Mandated<br />
Collective<br />
Investment<br />
Scheme<br />
Estate<br />
Agents<br />
√ √ √ √ √ √ √ √<br />
Management<br />
Control √ √ √ √ √ √ √ √<br />
Employment<br />
Equity<br />
Skill<br />
Development<br />
Enterprise &<br />
supplier<br />
Development<br />
Socio-<br />
Economic<br />
Development<br />
X X √ X √ √ √ √<br />
X X √ X √ √ √ √<br />
√ √ √ √ √ √ √ √<br />
X √ √ √ √ √ √ √<br />
Economic<br />
Development<br />
√ √ X √ X √ √ X<br />
Figure (viii): Average BEE Level per segment <br />
28