J11

You also want an ePaper? Increase the reach of your titles
YUMPU automatically turns print PDFs into web optimized ePapers that Google loves.
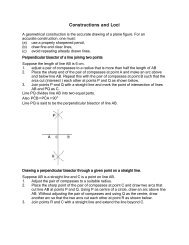
Gradients and rates of change<br />
The gradient of a straight line<br />
Every straight line has a slope with respect to the horizontal axis. The measure of the<br />
slope is called the gradient. In the Cartesian plane, the gradient of a line is the measure<br />
of its slope or inclination to the x-axis. The gradient of a line is defined as the ratio of the<br />
change in y-coordinate (vertical) to the change in the<br />
x-coordinate (horizontal).<br />
change in y - coordinate<br />
Thus, gradient =<br />
changein<br />
x coordinate<br />
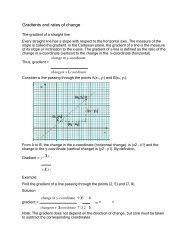
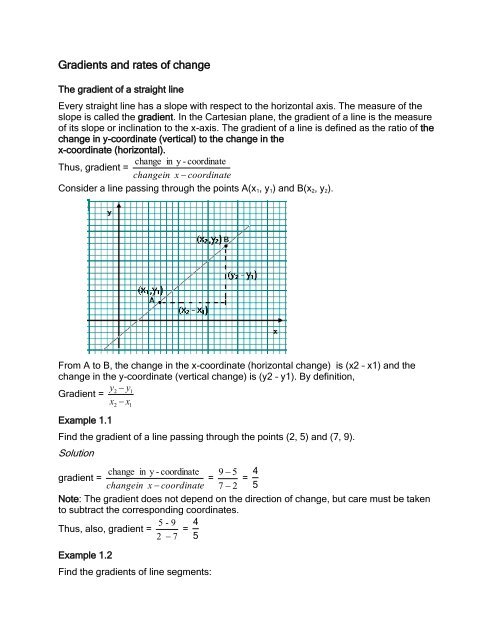
Consider a line passing through the points A(x 1 , y 1 ) and B(x 2 , y 2 ).<br />
From A to B, the change in the x-coordinate (horizontal change) is (x2 – x1) and the<br />
change in the y-coordinate (vertical change) is (y2 – y1). By definition,<br />
y2<br />
y1<br />
Gradient =<br />
x x<br />
Example 1.1<br />
2<br />
1<br />
Find the gradient of a line passing through the points (2, 5) and (7, 9).<br />
Solution<br />
change in y - coordinate 9 5 4<br />
gradient =<br />
= =<br />
changein<br />
x coordinate 7 2 5<br />
Note: The gradient does not depend on the direction of change, but care must be taken<br />
to subtract the corresponding coordinates.<br />
5 - 9 4<br />
Thus, also, gradient = =<br />
2 7 5<br />
Example 1.2<br />
Find the gradients of line segments:
(a) AB (b) CD, given that line AB passes through<br />
the points (-3, -4) and (-1, -1); while line CD passes through the points (-3, 5) and (8, 1).<br />
Solution<br />
(a) Gradient of AB is given by:<br />
(b) Gradient of CD is given by:<br />
4(<br />
1)<br />
3 3<br />
<br />
3(<br />
1)<br />
2 2<br />
15<br />
8(<br />
3)<br />
4<br />
= 11<br />
Note:<br />
(i) All horizontal line have zero gradients.<br />
(ii) Gradients of vertical lines cannot be defined.<br />
The equation of a straight line<br />
The equation of a straight line gives the relationship between the x- and y-coordinates of<br />
the points that lie on it.<br />
Consider a line passing through the points A(2, 3), B(5, 9) and C(0, -1). The gradient of<br />
line AB is given by:<br />
change in y - coordinate<br />
gradient =<br />
changein<br />
x coordinate<br />
9 3 6<br />
= = 2<br />
5 2 3<br />
3 ( 1)<br />
4<br />
The gradient of line AC = = 2<br />
2 0 2
The gradients of lines AB and AC are the same. Since A, B and C lie on a straight line,<br />
then a straight line has a constant gradient.<br />
Consider a point P, whose coordinates are (x, y) on line AB. The gradient of AP is the<br />
same as the gradient of AB. This is because a straight line has a constant gradient.<br />
y 3<br />
Thus, = 2.<br />
x 2<br />
Therefore, y – 3 = 2(x – 2) = 2x – 4<br />
y = 2x – 1.<br />
This is the equation of the line passing through A, B, C and P.<br />
In this case, coordinates of only two points are required to determine the gradient. The<br />
general point (x, y) enables us to find the equation of the line.<br />
The equation of a line can be determined if:<br />
(a) two points on the line are known,<br />
(b) its gradient and a point on it are known.<br />
Example 1.3<br />
Find the equation of the line passing through the points (4, 5) and (8, 7).<br />
Solution<br />
7 5<br />
2 1<br />
Gradient = .<br />
8 4 4 2<br />
Let (x, y) be a point on the same line. Using one of the points, say (4, 5), gradient =<br />
y 5<br />
.<br />
x 4<br />
y 5 1<br />
Therefore, . =<br />
x 4 2<br />
Example 1.4<br />
y – 5 = 2<br />
1 (x – 4)<br />
y – 5 = 2<br />
1 x – 2<br />
y = 2<br />
1 x + 3<br />
Find the equation of a line whose gradient is 3 and passes through (-1, 4).<br />
Solution<br />
In this case the gradient is known. Let (x, y) be a point on the line.<br />
y 4<br />
Then, 3<br />
x ( 1)<br />
y – 4 = 3(x + 1)<br />
y = 3x + 7
Exercise 1.1<br />
1. Find the equations of the lines passing through the following pairs of points:<br />
(a) (1, 3); (4, 8) (b) (0, -2); (2, 5)<br />
(c) (8, 5); (-1, -6) (d) (7, -5); (-3, 1)<br />
(e) (-2, 3); (0, -3) (f) (15, 9); (-10, -4)<br />
(g) (6, -2); (3, -2) (h) (0, 3); (0.5, 9)<br />
2. In each of the following, find the equation of a line whose gradient and a point<br />
through which it passes are:<br />
1<br />
(a) ; (-1, 2)<br />
2<br />
(b) 2; (0, 4)<br />
(c) -3; (0, 0) (d)<br />
2 1 1 ; ,<br />
3 2 3<br />
(e) 5; (3, 4) (f)<br />
5 ; (4, 0)<br />
2<br />
(g) 0; (4, 3) (h) 1; (-3, -2)<br />
1<br />
3. The gradients of two lines l 1 and l 2 are and 3 respectively. Find their<br />
2<br />
equations if they meet at the point (2, 3).<br />
4. Line l 1 has a gradient of -1 and passes through the point (3, 0). Line l 2 has a<br />
gradient of 2<br />
3 and passes through the point (4, 4).Draw the two line on the same<br />
pair of axes and state their point of intersection.<br />
5. Line l 1 passes through the point (-1, 3) and has a gradient of 3. Line l 2 passes<br />
through the point (2, 3) and meets line l2 at the point (0, 6).<br />
(a) Find the equations of the two lines.<br />
(b) Draw the lines l 1 and l 2 on the same pair of axes.<br />
The general equation of a straight line<br />
Consider a line whose equation is y = 2x + 3.<br />
We can obtain three points on this line by taking any values of x and<br />
substituting them in the equation to get y. Such as:<br />
x -1 1 2<br />
y 1 5 7<br />
Plotting points (-1, 1), (1, 5) and (2, 7) on a Cartesian plane gives the graph of<br />
the line y = 2x + 3.
The line cuts the y-axis at (0, 3). This point is called the y-intercept of the line. It is<br />
important to note that the y-intercept occurs when x = 0, which is the equation of the y-<br />
axis.<br />
The gradient of the line y = 2x + 3 can be obtained by using any two points on the line.<br />
5 1<br />
4<br />
Thus, using (1, 5) and (-1, 1), the gradient = = = 2<br />
1<br />
( 1)<br />
2<br />
For the line with equation y = 2x + 3 the gradient is 2 and the y-intercept is 3.<br />
Consider a line whose equation is y = 2<br />
1 x – 2.<br />
Three points on this line are:<br />
x 0 2 4<br />
y -2 -1 0<br />
Plotting these points on the Cartesian plane gives the graph of the line<br />
y = 2<br />
1 x – 2.
10<br />
1<br />
1<br />
Using the points (2, -1) and (4, 0), gradient is <br />
24<br />
2 2<br />
The graph cuts the y-axis at (0, -2). Therefore, the line y = 2<br />
1 x – 2 has a gradient of 2<br />
1<br />
and the y-intercept is -2.<br />
In general, a line whose equation is given by y = mx + c, has a gradient m and y-<br />
intercept c.<br />
All equations of straight lines can be written in the form y = mx + c, where m and c are<br />
known<br />
Example 1.5<br />
Write down the gradient and the coordinates of the y-intercept of the following lines:<br />
(a) y = 5x + 4 (b) y = 2 – x<br />
(c) 2y = 6x – 3 (d) 3y + 2x – 5 = 0<br />
Solution<br />
We need to express each equation in the form y = mx + c.<br />
(a) y = 5x + 4 is in the form y = mx + c.<br />
Therefore, gradient m = 5 and y-intercept is at (0, 4).<br />
(b) y = 2 – x can also be written as y = -x + 2.<br />
So, gradient m = -1 and y-intercept is at (0, 2)<br />
(c) 2y = 6x - 3<br />
In order to write it in the form y = mx + c, we divide both sides by 2.
Thus, y = 3x - 2<br />
3<br />
Therefore, gradient = 3 and y-intercept is at (0,<br />
(d) 3y + 2x – 5 = 0<br />
Writing in the form y = mx + c gives,<br />
3y = -2x + 5<br />
2 5<br />
y = x +<br />
3 3<br />
3 )<br />
2<br />
Therefore, gradient =<br />
Example 1.6<br />
2 5 and y-intercept is at (0, )<br />
3<br />
3<br />
Find the equation of a line whose gradient is 2 and passes through (4, 3).<br />
Solution<br />
The equation should be in the form y = mx + c, where m = 2 and y = 2x + c.<br />
We need to find the value of c.<br />
The line passes through (4, 3). Thus, when x = 4, y = 3, substituting 4 for x and 3 for y in<br />
the equation y = 2x + c gives 3 = 2 × 4 + c. which means, 3 = 8 + c.<br />
So, c = -5<br />
y = 2x – 5 is the required equation.<br />
Exercise 1.2<br />
1. Determine the gradients and the y-intercepts of the straight lines:<br />
(a) y = 8x + 1 (b) y = x<br />
(c) y = 3 – 2x (d) y + x = 0<br />
(e) 3y + x = 9 (f) 2x + 5y + 10 = 0<br />
(g)<br />
1 1<br />
2 1<br />
y + x = 2<br />
(h) y + x + 5 = 0<br />
2 3<br />
5 2<br />
2. Show that the point (-1, -4) lies on the line y = 3x – 1<br />
3. Show that the equation of the straight line passing through (0, k) and<br />
(k, 0) is y + x = k.<br />
4. Given that the line y = 3x + a passes through (1, 4), find the value of a.<br />
The x-intercept of a line<br />
It is important to remember that the equation of the y-axis is x = 0, and the equation of<br />
the x-axis is y = 0. We have already seen that the y-intercept occurs when x = 0.<br />
Similarly, the x-intercept occurs when y = 0. Therefore, given the equation of a line, its x-<br />
intercept can be obtained.<br />
Example 1.7
Find the x and y intercepts of the line with equation y = 5x + 6.<br />
Solution<br />
The y-intercept occurs when x = 0. Therefore, y = 5 × 0 + 6.<br />
i.e. y = 6.<br />
The y-intercept is 6.<br />
The x-intercept occurs when y = 0. Therefore,<br />
0 = 5x + 6<br />
-6 = 5x<br />
6 = x<br />
5<br />
The x-intercept is<br />
6 .<br />
5<br />
Exercise 1.3<br />
Find the x and y intercepts of the lines given by each of the following equations:<br />
1. y = x + 3 2. y = 3x – 7<br />
3.<br />
1 4<br />
y = x +<br />
2 5<br />
4. x + y + 3 = 0<br />
5. 2y = 3x + 2 6. 4x + 4y = 9<br />
7. 3x – 4y = 12 8. 2x + 3y + 7 = 0<br />
9.<br />
1<br />
x + y = 6<br />
2<br />
10 x = 7<br />
11. y = -3 12. y = x<br />
The graph of a straight line<br />
In order to draw the graph of a given equation, we need to obtain two or more points that<br />
lie on the line. Any value of x can be chosen and substituted in the equation to find the<br />
value of y.<br />
Care must be taken to avoid values that give fractions.<br />
Example 1.8<br />
1<br />
Draw the graph of the line with an equation y = - x + 2<br />
3<br />
Solution<br />
Some points on the line are:<br />
x -3 0 3<br />
y 3 2 1
Alternatively, the x- and y-intercepts can also be used to plot the points on the graph<br />
although you should avoid cases which give awkward fractions such as<br />
1 1<br />
, and so on.<br />
3 7<br />
1<br />
Thus, in y = - x + 2 , when x = 0, y = 2 and when y = 0, x = 6.<br />
3<br />
The intercepts are at (0, 2) and (6, 0).<br />
Exercise 1.4<br />
Draw the graphs of the lines whose equations are given below:<br />
1. y = x + 3 2. y = x – 4<br />
1<br />
3. -2x + 1 4. y = x<br />
2<br />
2<br />
5. y = x + 4<br />
3<br />
6. y = -3x<br />
3<br />
7. y = x - 1 8. y = 1<br />
4<br />
9. x = -2 10. 2y = x + 1<br />
The gradients of parallel lines<br />
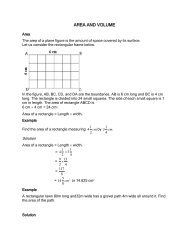
Consider two lines l 1 and l 2 whose equations are y = 2x + 4 and y = 2x + 1 respectively.<br />
When they are drawn, their graphs are as shown in the following figure.<br />
- 3
The lines are parallel. Note that both lines have the same gradient, 2. Therefore, parallel<br />
lines have the same gradient. Conversely, lines that have the same gradient are<br />
parallel.<br />
Example 1.9<br />
Find the equation of a line which passes through the point (3,5) and is parallel to y = -3x<br />
+ 1.<br />
Solution<br />
The equation of the required line is in the form y = mx + c. The gradient of the line y = -<br />
3x + 1 is -3.<br />
Since the two lines are parallel, m = -3. Thus, y = -3x + c.<br />
Therefore, 5 = -3 × 3 + c<br />
5 = -9 + c<br />
c = 14<br />
The required equation is y = -3x + 14 or y + 3x = 14.<br />
Exercise 1.5<br />
1 Determine the gradients of the following pairs of equations and state whether their<br />
lines are parallel:<br />
(a) y = 2x - 7 (b) y = 4<br />
3y = 6x + 2 y = -3<br />
(c) y = 2x + 3 (d) 5y + 3x + 1 = 0<br />
y = 4x + 6 10y + 6x – 1 = 0
(e)<br />
1<br />
y + x = 2<br />
2<br />
(f) 2x + y = 3<br />
3y + 2x = 0 3x + y = 1<br />
(g) x + 2y = 4 (h) y = 2x + 3<br />
x + 3y = 6 2y = 4x – 7<br />
(i) 3y = 5x + 7 (j) 5y = x + 2<br />
6y = 10x – 3 4y = x + 3<br />
2. A line through the points (-2, 4) and (3, 5) is parallel to the line passing through the<br />
points (a, 6) and (-4, 1). Find a.<br />
3. Line l is parallel to a line whose equation is y = 4x – 7 and passes through the point<br />
(1, -2). Find the equation of line l.<br />
4. Find the equation of the line that is parallel to another line whose equation is 4y +<br />
5x = 6 and passes through the point (8, 5).<br />
5. Find the equation of the line that is parallel to another line whose equation is x +<br />
2y + 8 = 0 and passes through the point (-2, -3).<br />
The gradients of perpendicular lines<br />
If a line has a gradient m, then a line perpendicular to it has a gradient - m<br />
1<br />
That the product of the gradients is<br />
so<br />
1<br />
m×<br />
- = -1. m<br />
Example 1.10<br />
Find the equation of a line perpendicular to another line whose equation is<br />
2y + 3x = 1 and passes through the point (-3, 1).<br />
Solution<br />
2y + 3x = 1 can be written as 2y = -3x + 1.<br />
3 1<br />
3<br />
Which means, y = - x + , and its gradient is - .<br />
2 2<br />
2<br />
The gradient of its perpendicular is the negative reciprocal of - 2<br />
3 , which is 3<br />
2 .<br />
The equation of the perpendicular line is in the form y = mx + c, where m = 3<br />
2 .<br />
That is, y = 3<br />
2 x + c
But the point (-3, 1) lies on the line. Therefore, 1 = 3<br />
2 (-3) + c.<br />
Which means, 1 = -2 + c<br />
c = 3<br />
The required equation is y = 3<br />
2 x + 3 or 3y = 2x + 9.<br />
Exercise 1.6<br />
1. The following are gradients of lines. In each case, state the gradient of the<br />
perpendicular line:<br />
(a) 5 (b) 8<br />
(c) -4 (d) -1<br />
(e)<br />
1<br />
- 3<br />
(f)<br />
2<br />
- 3<br />
(g) -4 3<br />
1<br />
(h) 1 5<br />
2<br />
(k) -0.7 (l) 0.5<br />
2. State whether the following pairs of equations represent perpendicular lines<br />
(a) 2y + 3x = 2 (b) y + x = 3<br />
12y – 8x = 24 y = x + 4<br />
(c) 3y + 5x = 6 (d) y = 5 – 6x<br />
5y + 3x = 4<br />
1 1<br />
x = x + 1<br />
2 12<br />
3. Write down the equation of the line perpendicular to:<br />
(a) 3x + 4y – 1 = 0 and passes through (1, 2),<br />
(b)<br />
1 1<br />
y = x + and passes through the origin,<br />
2 3<br />
(c) 3x – 2y + 7 = 0 and passes through (-1, 0),<br />
(d) 5y + x + 4 = 0 and passes through (3, 5).<br />
4. Find the equation of a line whose gradient is - 2<br />
1 and passes through the point (5, -<br />
2)<br />
1<br />
5. State which of the points (0, 3), (4, 6) and ( , -2) lie on the line y = 2x – 3.<br />
2<br />
6. Determine whether each of the following points lie above or below the line y = 4 –<br />
x.<br />
(a) (-2, 3) (b) (3, 3)<br />
(c) (5, 0)<br />
7. Find the equation of a line passing through the points (-1, -2) and (4, 6).
8. Determine the gradient and the y-intercept of the lines with equations:<br />
1<br />
(a) 3x + 2y + 5 = 0 (b) y + 6 = x<br />
2<br />
9. Find the equation of the line that passes through the point (2, -5) and is parallel to<br />
the line y = 3 – 3x.<br />
10. Find the equation of the line perpendicular to 2x + 3y = 4 that passes through the<br />
point (0, 3).<br />
11. Determine the gradients and the coordinates of the x-intercept of the following<br />
equations:<br />
(a) 3y = 2x + 9<br />
(b) 2y + 3x = 1<br />
(c) y = 3 – 5x<br />
(d) y + 3x = 14<br />
Rates of change<br />
If a variable, y, is related to a variable, x, then as x changes, y also changes<br />
according to the rule relating them. We relate the change in y to the corresponding<br />
change in x by defining the average rate of change as: the change in y divided by the<br />
corresponding change in x.<br />
Thus, if x 1 and x 2 are two values of x, and the corresponding values of y are y 1<br />
and y 2 , then the average rate of change of y as x changes from x 1 to x 2 is<br />
y2<br />
y1<br />
.<br />
x2<br />
x1<br />
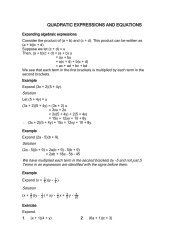
Consider the graph of y = x 2 (see the following figure)<br />
The average rate of change between P and Q is the gradient of chord PQ. This
y<br />
is given by<br />
x<br />
2<br />
2<br />
x 2<br />
2<br />
1<br />
2<br />
2<br />
y1<br />
x<br />
But y = and y<br />
x<br />
x<br />
2<br />
2<br />
2<br />
<br />
<br />
x<br />
x<br />
1<br />
1<br />
=<br />
2<br />
1<br />
x 1<br />
= x <br />
2<br />
x1<br />
x2<br />
x1<br />
x x<br />
2<br />
1<br />
. Therefore, the average rate of change is<br />
=<br />
2<br />
+ x1<br />
x .<br />
The value of the result ( x<br />
2<br />
+ x1<br />
) is different for different intervals of x. Thus the average<br />
rate of change from M to N has a different value of x<br />
2<br />
+ x1<br />
from the one for P to Q.<br />
The average rate of change occurs over a given interval. Suppose we want to find the<br />
rate of change at a particular point or, in the case of motion, at a particular time. This is<br />
said to be the rate of change at some instant and is called the instantaneous rate of<br />
change.<br />
The following figure shows a sketch of the curve of<br />
change at point T is the gradient of tangent PQ.<br />
y = x . The instantaneous rate of<br />
The tangent to a curve is a straight line drawn such that it touches the curve<br />
only at one point, called the point of contact.<br />
Example 1.11<br />
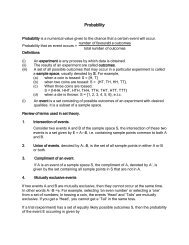
The distance – time graph below shows the motion of a ball thrown upwards<br />
from the ground.
Use the graph to find:<br />
(a)<br />
the average velocity of the ball from:<br />
(i) t = 1 to t = 2 (ii) t = 2.5 to t = 4.<br />
(b) the velocity of the ball when t = 1.<br />
(c) the velocity of the ball when t = 2.5.<br />
Solutions<br />
(a) (i) when t = 1, s = 20 and when t = 2, s = 30. The average velocity is the<br />
gradient of the chord joining points (1, 20) and (2, 30). Therefore, the average<br />
velocity is<br />
30 20<br />
= 10 m/s<br />
2 1<br />
(ii)<br />
when t = 2.5, s = 31 and when t = 4, s = 20. The average velocity is the<br />
gradient of the chord joining points (2.5, 31) and (4, 20). Therefore, the<br />
average velocity is<br />
20 31<br />
4 2.5<br />
= -<br />
1.5<br />
11 = -7 3 1 m/s<br />
(b)<br />
The velocity of the ball when t = 1 is the gradient of the tangent to the<br />
Curve at t = 1.<br />
From the graph, two points on the tangent are ((1, 20) and (2, 35).<br />
35 20<br />
Therefore, the velocity is = 15 m/s.<br />
2 1<br />
(c) The velocity of the ball when t = 2.5 is the gradient of the tangent to the curve at t =<br />
2.5. This tangent is horizontal, thus, its gradient is zero. The velocity of the ball at t
= 2.5 is zero. The height of the ball at this time is 31 m, which is the greatest height<br />
of the ball from the ground.<br />
Example 1.12<br />
A beaker is filled with liquid and heated slowly. The temperature is taken at<br />
intervals of one minute, the results being:<br />
Time (t min) 0 1 2 3 4 5 6 7 8 9 10<br />
Temp. ( 0 C) 10 11 14 22 35 46 52 55 57 58 58<br />
Draw the graph of these readings on a scale 1 cm to 1 min horizontally and 1<br />
cm = 5 0 C vertically.<br />
(a) Calculate the average rate of heating, in deg/min., during the first 5 min of the<br />
experiment and in the whole 10 minutes.<br />
(b) Find the rate of increase of the temperature at the instant when t = 6 minutes.<br />
(c) At what time is the rate of heating the greatest?<br />
Solution<br />
(a) The average rate of heating during the first 5 minutes is given by the gradient of<br />
chord AB, i.e. 46 10<br />
36<br />
7.2<br />
0 / min .<br />
5 0 5<br />
C<br />
(b) The rate of increase at the instant when t = 6 min. is given by the gradient of the<br />
tangent at point C, i.e. 60 44<br />
4.211<br />
0 / min .<br />
7.8 4<br />
C<br />
(c) The rate of heating is greatest when t = 3 min. i.e. the point on the curve with<br />
greatest slope.
Distance - Time graphs<br />
In a distance-time graph the distance is represented on the vertical axis and the time on<br />
the horizontal axis. However, before plotting any point, we must choose suitable scales<br />
for both axes. A suitable scale is the scale that will enable you to fit in all your points<br />
adequately. Also make sure that the intervals are uniform on each axis.<br />
Example 1.13<br />
The table below shows the distance, in metres, walked along a road and the time taken,<br />
in seconds<br />
.<br />
(a)<br />
(b)<br />
Solution<br />
Distance (m) Time (s)<br />
0 0<br />
7.5 5<br />
15.0 10<br />
22.5 15<br />
30.0 20<br />
37.5 25<br />
45.0 30<br />
52.5 35<br />
60.0 40<br />
Draw a distance-time graph to represent this information.<br />
Determine the gradient of the graph.
(b)<br />
Choose two suitable points on the line. For example, A and B. Draw a line from<br />
point B parallel to the vertical axis and another line from point A parallel to the<br />
horizontal axis both to meet at point C. Label length BC and AC as p and q<br />
respectively.<br />
Gradient = q<br />
p<br />
45 15<br />
30<br />
= =<br />
30 10<br />
20 = 1.5 m/s. (The gradient represents speed).<br />
No matter which two points we take, the gradient is the same. This<br />
means that the speed is constant (uniform). Also if the vertical axis<br />
represents displacement, then the gradient would represent velocity.<br />
Example 1.14<br />
In a bicycle race, a cyclist covered 70 km as follows: 30 km in 30 minutes, 10 km in<br />
hours and 30 km in 30 minutes.<br />
(a) Draw a distance-time graph for the journey.<br />
(b) From the graph, determine the average speed for the whole journey.<br />
Solution<br />
(a)<br />
In each stage of the journey, we need two points. That is the start and the end of<br />
each stage.<br />
1<br />
Stage I: (0, 0), 2<br />
,30<br />
1<br />
Stage II: ,30, (2, 40)<br />
2<br />
1 1<br />
2
Stage III: (2, 40) , (2 21<br />
, 70)<br />
Choose a suitable scale for each axis. In this case, in the vertical scale, 1 cm<br />
represents 20 km and in the horizontal scale, 1 cm represents 30 minutes. Draw<br />
the axes and plot the points.<br />
Join the points in each stage with a straight line as shown in the figure below.<br />
(b) The average speed is found by joining the first point of stage I to the last point<br />
of stage III. Then find the gradient of this line by choosing suitable points such as<br />
(0, 0) and ( 11<br />
, 35 ).<br />
4<br />
Gradient = (35 – 0) ( 11<br />
0 ) = 28 km/h.<br />
4<br />
Checking by calculation,<br />
Average speed =<br />
Example 1.15<br />
total distance<br />
total time<br />
= 70 2<br />
5 = 28 km/h.<br />
Two towns, X and Y, are 110 km apart. A cyclist, C 1 , leaves Y at 9.00 a.m. and travels<br />
towards X at an average speed of 44 km/h. At the same time, another cyclist, C 2 , leaves<br />
X and travels towards Y at an average speed of 25 km/h.<br />
(a)<br />
(b)<br />
Solution<br />
On the same axes draw, distance-time graphs for each cyclist.<br />
From the graph determine:<br />
(i) when the two cyclists met,<br />
(ii) the distance cyclist C 1 had traveled before meeting cyclist C 2 .
(a)<br />
Using suitable scales, mark on the vertical axis points X and Y at the correct<br />
distance. On the horizontal axis, mark the time starting from<br />
9.00 a.m. then 10.00 a.m. etc. Since the speed for each motion is constant the<br />
graphs are straight lines. C 1 takes 2 hours and 30 minutes and arrives at X at 11.30<br />
a.m. C 2 takes 4 hours and 12 minutes. She arrives at Y at 1.12 p.m.<br />
(b) (i) They meet at 10.36 a.m.<br />
(ii) C 1 had covered 70 km from Y which is the intersection of graphs C 1 and C 2 .<br />
Speed-time graphs<br />
In speed-time graphs, speed is represented on the vertical axis and time on the<br />
horizontal axis. If the motion is in a specific direction then velocity should be represented<br />
on the vertical axis.<br />
Example 1.16<br />
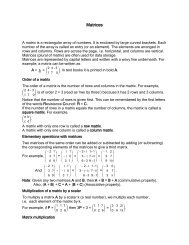
A man walking at a steady speed covers a distance of 10 km in 2 hours. We therefore<br />
say that his speed is 5 km/h.<br />
Note: steady speed means that the speed stayed the same or constant.
The graph shows that speed remained constant. The graph is called a speed - Time<br />
graph.<br />
Since the speed is constant, the distance traveled = speed time<br />
= 5 2 = 10 km.<br />
If we shade the graph as in the figure above, we notice that the shaded area is equal to<br />
the distance traveled by the man in 2 hours.<br />
Area of a rectangle = length width<br />
=2 h 5 km/h<br />
= 10 km/h.<br />
In general, in speed-time graphs, the distance traveled is obtained by finding the area<br />
enclosed by the graph and the axes.<br />
Exercise 1.7<br />
1. An athlete sets off in a long distance race at a steady speed of 4 m/s. Draw a graph<br />
to show the distance d meters he has covered after t seconds, taking values of t<br />
from 0 to 25. Use scales of 2 cm to 5 seconds and 2 cm to 20 meters. From your<br />
graph find:<br />
(a) the distance covered after: (i) 5 sec. (ii) 22 sec. (iii) 10.5 sec.<br />
(b) the time taken to run: (i) 40 m (ii) 70 m (iii) 36 m<br />
(c) Give an equation connecting d and t.<br />
2. Dauda left school at 4.00 pm and walked home at 6 km/h.<br />
(a) How far from the school was he after
(b)<br />
(c)<br />
(i)<br />
(ii)<br />
(i) 30 minutes (ii) 20 minutes (iii) 10 minutes?<br />
Draw a distance – time graph extending from 4.00 pm to 5.00 pm. Take 2 cm<br />
to 10 minutes and 2 cm to 1 km.<br />
Use the graph to find:<br />
the distance Dauda had walked by 4.40 pm.<br />
the time he reached home if he lived 4.5 km from the school.<br />
3. From Kampala to Jinja is 80 km. At 08:15 hours a lorry leaves Kampala for Jinja at<br />
60 km/h. Draw a graph showing the distance traveled with respect to time. Use<br />
scales of 1 cm to 5 minutes and 1 cm to 10 km. From your graph find:<br />
(a) how far from Kampala the lorry is when the time is:<br />
(i) 08:20 hours (ii) 08:50 hours (iii) 09:15 hours.<br />
(b) the time when the lorry reaches Jinja.<br />
4. In a 100-m race, an athlete took 9.8 seconds.<br />
(a) Draw a distance-time graph to represent this information.<br />
(b) From the graph determine:<br />
(i) the average velocity correct to 1 decimal place,<br />
(ii) the distance traveled in three seconds,<br />
(ii) the time taken to cover 80 m.<br />
5. A safari rally car travels at an average speed of 180 km/h for 5 hours between two<br />
towns.<br />
(a) Draw a distance-time graph to illustrate its motion.<br />
(b) From the graph determine:<br />
(i) the distance traveled in 36 minutes,<br />
(ii) the time it took to cover 290 km.<br />
6. From the distance-time graph drawn below, calculate<br />
(a) the velocity, in km/h, of A and B respectively,<br />
(b) how<br />
(i) long they took before meeting<br />
(ii) far they had traveled before meeting.
7. Rashidah left her house at 8.00 am for Kampala city. After traveling at a constant<br />
speed for 1 hour, she arrived at Mukono town, 15 km from her home. She rested<br />
for 15 minutes and then proceeded at a constant speed towards Kampala 30 km<br />
from Mukono, she arrived in Kampala at 12.15 p.m.<br />
(a) Using a scale of 2 cm represents 1 hour and 1 cm represents 5 km draw a<br />
distance-time graph for the whole journey.<br />
(b) From the graph, determine Rashidah’s average speed from:<br />
(i) her house to Mukono town,<br />
(ii) Mukono town to Kampala city.<br />
(c) Calculate her average speed for the whole journey.<br />
8. Three towns, R, P and Q are such that Q is between P and R. From P to Q is 105<br />
km and from Q to R is 15 km. A car leaves Q at 9.00 a.m. and travels towards P at<br />
an average speed of 60 km/h. At the same instant, a cyclist leaves P and travels<br />
towards Q at an average speed of 24 km/h. An ambulance leaves R at 9.30 a.m.<br />
and travels towards P via Q at an average speed of 160 km/h.<br />
(a)<br />
(b)<br />
On the same axes, draw a distance-time graph for each vehicle.<br />
From the graph determine:<br />
(i) when the ambulance caught up with the car,<br />
(ii) when the ambulance and the cyclist met,<br />
(iii)when the car and the cyclist met,<br />
(iii)<br />
the distance the car had travelled before the ambulance caught up with<br />
it.<br />
9. The distance from Masaka to Mbarara is 140 km. At 08 00 hours a motorist leaves<br />
Masaka for Mbarara at 80 km/h. At 08 40 hours another motorist leaves Mbarara
for Masaka at 70 km/h. On the same pair of axes draw the two graphs for the<br />
motorists.<br />
Take 3 cm to 1 hour on the horizontal axis and 1 cm to 10 km on the vertical axis.<br />
From your graphs find:<br />
(i) the distance from Masaka to the place where the two motorist met;<br />
(ii) the distance between the two motorists at 09 00 hours;<br />
(iii) the tme when they met.<br />
Exercise 1.8<br />
1. The speed v m/s of a car after t s is given by the following table:<br />
t 0 2 4 6 8 10 12 14 16 18<br />
v 0 15 26 35 39 40 36 28 16 0<br />
Represent this information on a graph using 1 cm to represent 2 s horizontally and<br />
1 cm to 5 m/s vertically.<br />
Estimate the rate at which the speed is changing when t = 14 and find the average<br />
rate of change in the speed between 2 and 7 s.<br />
2. The temperature of water in an electric kettle is T 0 C after the heating element has<br />
been switched off for t min. The following table shows the relationship between<br />
T 0 C and t min.<br />
t (min) 0 1 2 3 4 5 6 7 8 9 10<br />
T 0 C 100 76 60 48 38 32 28 24 22 21 20<br />
(a) Calculate, in deg./min, the average rate of cooling during the first ten<br />
minutes.<br />
(b) Estimate the rate of cooling, in degrees per min, when t = 2.<br />
3. The stopping distance d metres of a car traveling at s km/h is given by the<br />
s 2<br />
formula d = 40<br />
Copy and complete the following table:<br />
s 10 20 30 40 50 60<br />
d 2.5 -- 22.5 -- -- --<br />
Draw a graph to show the relationship between d and s. Use your graph to find s<br />
when the stopping distance is 25 m. Find also the gradient of the graph at the point<br />
when s is 20.<br />
4. A stone is thrown vertically upwards into the air and its height h metres above the<br />
ground is given by h = 16(5t – t2) where t is the time in seconds for which the stone<br />
has been in flight. Calculate the values of h for t = 0, 1, 2, 3, 4, 5.<br />
Draw a graph to show the relationship between h and t. Use your graph to find:<br />
(a) the greatest height of the stone,<br />
(b) the times at which the stone is 50 m above the ground,
(c)<br />
(d)<br />
the length of time for which the stone is more than 70 m above the ground<br />
and<br />
the speed of the stone at 4 seconds.<br />
5. A train traveled between two stations A and B, 7 km apart, and the following table<br />
shows the time (in min) since leaving A and the distance (km) from A.<br />
Time (min) 0 2 4 6 8 10 12<br />
Distance (km) 0 0.25 1.15 2.83 5.40 6.65 7<br />
Draw the graph of these readings using a scale of 1 cm to represent 1 min. on the<br />
horizontal axis and 2 cm to 1 km on the vertical axis.<br />
From your graph, estimate (by drawing a tangent) the speed of the train in km/min<br />
when the train has traveled 6 km.<br />
Two minutes after this train left A, another train passed through B and traveled<br />
towards A at a steady speed of 60 km/h. Using the same axes and scale, draw the<br />
graph to represent its journey between B and A and use it to find the distance from<br />
A when the trains pass each other.<br />
6. The table below shows the distance, s metres, of a particle from point P after t<br />
seconds.<br />
t 0 1 2 3 4 5<br />
s 0 2 8 18 32 50<br />
(a) Draw the distance-time graph using 1 cm to represent 0.5 seconds and 1<br />
cm to represent 5 m.<br />
(b) From your graph find:<br />
(i)<br />
the average speed of the particle during the third second.<br />
(ii) the average speed of the particle between the first and the<br />
fifth seconds<br />
(c) Using a suitable tangent, determine the rate of change when t = 3 seconds.<br />
7. Draw a graph to represent the following:<br />
A man starts at 7 a.m. from point P and walks at a speed of 6 km/h for 4 hours. He<br />
then rests for 1 hour before proceeding at 5 km/h untilhe reaches his destination,<br />
Q, at 1 p.m. His return journey is made at a constant speed of 4 km/h without<br />
stops. From the graph find<br />
(a) his distance from the starting point at<br />
(i) 10 a.m. (ii) 12 noon<br />
(b) the time taken to travel<br />
(i) the first 14 km,<br />
(ii) from P to Q<br />
(iii)…the whole trip.<br />
8. Man A begins at point P and travels a distance of 360 km to point Q at a speed of<br />
60 km/h. Man B, beginning at the same time travels at a constant speed from P to<br />
Q in 2 hours more. Draw graphs t represent this information.<br />
From the graphs find:
(i) when A and B are 50 km apart,<br />
(ii) when and where B overtakes A,<br />
(iii) the distance apart of A and B when they have been traveling<br />
3.5 hours