The Technology Factor: Nine Keys to Student Achievement and Cost ...
The Technology Factor: Nine Keys to Student Achievement and Cost ...
The Technology Factor: Nine Keys to Student Achievement and Cost ...

Create successful ePaper yourself
Turn your PDF publications into a flip-book with our unique Google optimized e-Paper software.
30<br />
Chapter 4: School Leadership <strong>The</strong> <strong>Technology</strong> <strong>Fac<strong>to</strong>r</strong>: <strong>Nine</strong> <strong>Keys</strong> <strong>to</strong> <strong>Student</strong> <strong>Achievement</strong> <strong>and</strong> <strong>Cost</strong>-Effectiveness<br />
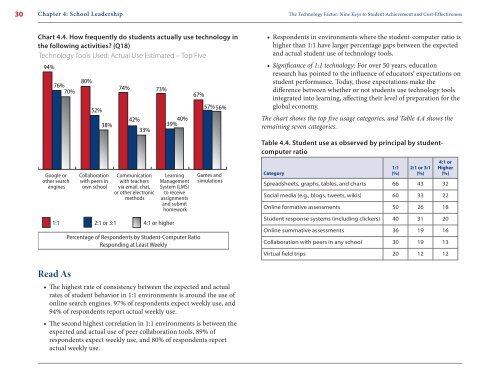
Chart 4.4. How frequently do students actually use technology in<br />
the following activities? (Q18)<br />
<strong>Technology</strong> Tools Used: Actual Use Estimated – Top Five<br />
94%<br />
76%<br />
70%<br />
Google or<br />
other search<br />
engines<br />
Read As<br />
80%<br />
52%<br />
38%<br />
Collaboration<br />
with peers in<br />
own school<br />
74%<br />
42%<br />
33%<br />
Communication<br />
with teachers<br />
via email, chat,<br />
or other electronic<br />
methods<br />
73%<br />
1:1 2:1 or 3:1 4:1 or higher<br />
40%<br />
39%<br />
Learning<br />
Management<br />
System (LMS)<br />
<strong>to</strong> receive<br />
assignments<br />
<strong>and</strong> submit<br />
homework<br />
67%<br />
Percentage of Respondents by <strong>Student</strong>-Computer Ratio<br />
Responding at Least Weekly<br />
57% 56%<br />
Games <strong>and</strong><br />
simulations<br />
• �e highest rate of consistency between the expected <strong>and</strong> actual<br />
rates of student behavior in 1:1 environments is around the use of<br />
online search engines. 97% of respondents expect weekly use, <strong>and</strong><br />
94% of respondents report actual weekly use.<br />
• �e second highest correlation in 1:1 environments is between the<br />
expected <strong>and</strong> actual use of peer collaboration <strong>to</strong>ols. 89% of<br />
respondents expect weekly use, <strong>and</strong> 80% of respondents report<br />
actual weekly use.<br />
• Respondents in environments where the student-computer ratio is<br />
higher than 1:1 have larger percentage gaps between the expected<br />
<strong>and</strong> actual student use of technology <strong>to</strong>ols.<br />
• Significance of 1:1 technology: For over 50 years, education<br />
research has pointed <strong>to</strong> the influence of educa<strong>to</strong>rs’ expectations on<br />
student performance. Today, those expectations make the<br />
difference between whether or not students use technology <strong>to</strong>ols<br />
integrated in<strong>to</strong> learning, affecting their level of preparation for the<br />
global economy.<br />
�e chart shows the <strong>to</strong>p five usage categories, <strong>and</strong> Table 4.4 shows the<br />
remaining seven categories.<br />
Table 4.4. <strong>Student</strong> use as observed by principal by studentcomputer<br />
ratio<br />
Category<br />
1:1<br />
(%)<br />
2:1 or 3:1<br />
(%)<br />
4:1 or<br />
Higher<br />
(%)<br />
Spreadsheets, graphs, tables, <strong>and</strong> charts 66 43 32<br />
Social media (e.g., blogs, tweets, wikis) 60 33 22<br />
Online formative assessments 50 26 18<br />
<strong>Student</strong> response systems (including clickers) 40 31 20<br />
Online summative assessments 36 19 16<br />
Collaboration with peers in any school 30 19 13<br />
Virtual field trips 20 12 12