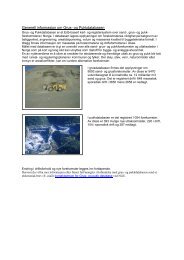
Download pdf - NGU
Download pdf - NGU
Download pdf - NGU

You also want an ePaper? Increase the reach of your titles
YUMPU automatically turns print PDFs into web optimized ePapers that Google loves.
[Blank]
[Blank]<br />
4
CONTENTS<br />
1. INTRODUCTION .............................................................................................................. 6<br />
METHODS. ................................................................................................................................ 9<br />
1.1 Planning Stage and Field work .................................................................................... 9<br />
1.2 Sample preparation .................................................................................................... 10<br />
1.3 Analytical method ...................................................................................................... 10<br />
1.4 Quality control ........................................................................................................... 10<br />
1.5 Data analysis .............................................................................................................. 11<br />
2. RESULTS AND COMMENTS ........................................................................................ 11<br />
2.1 Data tables ................................................................................................................. 11<br />
2.2 Cumulative Probability (CP-) Plot ............................................................................ 12<br />
2.3 Mapping ..................................................................................................................... 12<br />
3. CONCLUSIONS ............................................................................................................... 13<br />
4. ACKNOWLEDGEMENTS .............................................................................................. 14<br />
5. REFERENCES ................................................................................................................. 14<br />
FIGURES<br />
Figure 1. Index map showing location in Norway and available bedrock maps in scale<br />
1:50000 in green.<br />
Figure 2. Maps covering the survey area. Five digit numbers are map sheet numbers in<br />
the M711 series.<br />
Figure 3. Quternary deposits of the Nordkinn-Bekkarfjord area. 8<br />
Figure 4. Typical sample pit with sampling tool and sample. 9<br />
Figure 5. X-chart for Cu and Dy, depicting stability for project standard "MINN". 11<br />
Figure 6. Excerpt from legend of 1:250000 bedrock maps. 13<br />
TABLES<br />
Table 1. Project standard "Minn" - Min, Q50, Max and precision values. 16<br />
Table 2. Project standard "Nidelv" - Min, Q50, Max and precision values. Q50 values<br />
for Nordland+Troms dataset given in addition.<br />
17<br />
Table 3. Laboratory standard "DS8" - Min, Q50, Max and precision values. 18<br />
Table 4. Precision of analytical duplicates and field duplicates. 19<br />
Table 5. Statistical parameters of the mapped dataset. N=808. 20<br />
Table 6. Comparison of the Nordkinn and Nordland+Troms datasets. 21<br />
APPENDIX<br />
Appendix 1. Cumulative frequency diagrams. 9 pages.<br />
Appendix 2. Geochemical maps from the Nordkinn peninsula. 65 pages.<br />
5<br />
6<br />
7
1. INTRODUCTION<br />
The Nordkinn Peninsula consists of a series of Neoproterozoic fluvial, cross-bedded<br />
sandstones belonging to the Kalak Nappe complex which are derived from basement terraines<br />
of the Fennoscandian shield (Roberts, 2007). On first glance the area appears to hold little<br />
promise for mineral exploration. However, numerous low density geochemical surveys<br />
(Nordkalott project – Bølviken et al., 1986, Kola project – Reimann et al., 1996, re-analysis of<br />
old Nordkalott samples – Reimann et al., 2011) show distinct geochemical anomalies (REEs,<br />
U, Th but also Pb, Bi, Zn, Sb) on the Nordkinn and adjacent Varanger Peninsula. Because of<br />
these numerous unexplained anomalies it was decided to cover the Nordkinn Penisula (ca.<br />
2000 km 2 ) with a local scale geochemical survey at a sample density of 1 site per 2 km 2 . <strong>NGU</strong><br />
has not carried out such local scale geochemical surveys aimed at mineral exploration since<br />
almost 20 years. This survey was thus also aimed at providing the needed experience for<br />
planning further investigations.<br />
Figure 1. Index map showing location in Norway and available bedrock maps in scale 1:50000 in green.<br />
6
In addition to the 1:50000 scale bedrock maps that partially cover the target area, three<br />
bedrock maps in 1:250000 scale cover the whole area. In Figure 2, these are outlined in<br />
purple, namely Nordkapp, Honningsvåg and Vadsø (North to East).<br />
Nordkapp<br />
Honningsvåg Vadsø<br />
Figure 2. Maps covering the survey area. Five digit numbers are map sheet numbers in the<br />
M711 series.<br />
Quaternary deposits of the area are dominated by regolith and thin till layer. Figure 3 also<br />
displays small areas of marine deposits and glaciofluvial sediments that were avoided during<br />
sampling.<br />
7
Figure 3. Quternary deposits of the Nordkinn-Bekkarfjord area.<br />
8
METHODS.<br />
1.1 Planning Stage and Field work<br />
During the planning stage the Nordkinn Peninsula was covered by a grid of ca. 30 traverses in<br />
east-west direction at 2 km distance. Along the traverses the sample spacing was 1 km. It was<br />
estimated that with the resources available for field work, it would be possible to cover the<br />
whole area as far south as to the base of Bekkarfjord with some 1100samples<br />
In the field sample pits were dug by paint free steel spade down to well into the mineral soil<br />
layer. Glaciofluvial deposits were consciously avoided during sampling. Samples were<br />
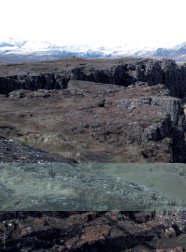
collected into RILSAN® plastic bags using a small steel trowel. Figure 4 shows a typical<br />
sample pit, the equipment used and a typical sample. Sample weight was on average 1,2 kg.<br />
The field crew was not allowed to wear any jewelry while handling samples. Most sample<br />
sites were accessed on foot from the closest road along the traverses. Some areas were<br />
accessed from the sea-side by the 37’ “Polarjo” of SNO and for 4 days helicopter transport<br />
was used to drop off samplers in the field in the morning and collect them again in the<br />
evening.<br />
Figure 4. Typical sample pit with sampling tool and sample.<br />
9
Because the landing permits for the helicopter from Tana commune were not received for the<br />
desired time span, parts of the Digermul peninsula remained uncovered. Early on it also<br />
transpired that it was impossible to collect samples from the whole Nordkinn Peninsula within<br />
the given budget and it was decided to drop sampling of the rather difficult to access<br />
Koifjord-/Sandfjellet area. Supporting this decision was the fact that this was a low priority<br />
area based on earlier results. In total 808 localities were sampled. The samplers worked<br />
individually, and on the average, 1 sampler was able to collect 7,2 samples per day. Field<br />
work was carried out in the period 08.08 – 05.09.2011, with the crew fluctuating between 2<br />
and 7 people.<br />
Field duplicate samples were collected at a rate of one in every twenty five samples. At one<br />
site a large (35 kg) sample was collected for the preparation of a project standard.<br />
1.2 Sample preparation<br />
Upon arrival at the <strong>NGU</strong> laboratories, samples were dried at temperatures below 40 °C.<br />
Subsequently all samples were dry sieved to 2mm fraction.<br />
Nylon sieves were used, and no jewelry was allowed during preparation work. Cross<br />
contamination via sample dust during sieving was controlled by sieving samples one at a time<br />
in a vented box, and cleaning all tools in water in between every sample. Following the<br />
preparation all samples were randomized and a split of the project standard MINN was<br />
inserted at a rate of one in twenty samples (36 in total). In addition 8 splits of the project<br />
standard NIDELV were also inserted at random positions. The laboratory inserted further 33<br />
splits of its own QC sample DS8. The laboratory also prepared analytical duplicates of 51<br />
samples.<br />
1.3 Analytical method<br />
Alliquots of 30+ g of all samples were shipped to ACME laboratories in Vancouver, Canada.<br />
For the GEMAS project this laboratory had won the international tender for analysis in aqua<br />
regia extraction (Reimann et al., 2009). A 15 g sample weight was used for the extraction.<br />
The samples were digested in 90 ml aqua regia and leached for one hour in a hot (95 °C)<br />
water bath. After cooling, the solution was made up to a final volume of 300 ml with 5% HCl.<br />
The sample weight to solution volume ratio is 1g per 20 ml. The solutions were analyzed<br />
using a Spectro Ciros Vision emission spectrometer (ICP-AES) and a Perkin Elmer Elan<br />
6000/9000 inductively coupled plasma emission mass spectrometer (ICP-MS). Analytical<br />
results were returned within 1 month after receiving the samples.<br />
1.4 Quality control<br />
Table 1, 2 and 3 show the analytical results for the standards MINN, NIDELV and DS8.<br />
Table 4 shows the estimate of precision based on the analytical duplicates. All in all most<br />
results were satisfactory, Tables 1-3 clearly identify the “problematic” elements, where maps<br />
should be viewed with care: Ge, Ta, W, In, Pd, Pt, Re, Te. In most cases the observed<br />
problems were due to very low concentrations of these elements in our standards MINN and<br />
NIDELV, i.e. analytical results at or below the limit of detection. Standard NIDELV was used<br />
as project standard when submitting the stored samples from Nordland/Troms (Reimann et<br />
al., 2011) and median results for Nidelv analysed this time compared to the ones received<br />
10
earlier are also provided in Table 2. In laboratory standard DS8 only Ge and Ta have so low<br />
concentrations that they remain problematic (Table 3). X-charts (for an example see Figure 5)<br />
indicate that there exist no problems with time trends or breaks in analytical results. To be<br />
able to estimate analytical precision based on analytical duplicates and to calculate the<br />
practical detection limits, it was agreed with the laboratory that all instrument readings were<br />
reported, independent of detection limit. Duplicate results (Table 4) reveal the following<br />
elements as plagued by poor reproducibility: Re, Pd, Pt, Te, Au, and Ta. In some cases it was<br />
decided to show the instrument readings below the official detection limit in a map, these<br />
maps are clearly marked as such. For a few elements (e.g. S) it was decided to use the much<br />
lower practical detection limit rather than the “official” laboratory detection limit (see Table<br />
5).<br />
Figure 5. X-chart for Cu and Dy, depicting stability for project standard "MINN".<br />
1.5 Data analysis<br />
Geochemical data are compositional data (Aitchison, 1986; Filzmoser et al., 2009) and thus<br />
require special care during data analysis. Compositional data do not plot into the standard<br />
Euclidian room but rather on the Aitchison simplex. All statistical methods that are based on<br />
Euclidian distances (like calculating the mean and the standard deviation or calculating a<br />
correlation matrix) will thus return faulty results (Filzmoser et al., 2009, 2010). Thus here<br />
EDA (exploratory data analysis) techniques and simple order statistics as suggested by<br />
Reimann et al., (2008) are used.<br />
2. RESULTS AND COMMENTS<br />
2.1 Data tables<br />
A statistical overview for the datset is provided in Table 5. The table is built around<br />
minimum, maximum and median value and provides the values for a number of additional<br />
quantiles (percentiles) of the distribution. When using (for the data at hand unsuited) classical<br />
statistical methods and calculating mean and standard deviation to derive at “thresholds” for<br />
anomalies in the case of a normal distribution 2.6% of all data will be identified as anomalies<br />
at both ends of the distribution – thus Q2 and Q98 (or Q5 and Q95) can be taken as lower and<br />
upper threshold for the data. However, quite often CP-Plots (see below) provide a better<br />
means of identifying anomalies in the data.<br />
The “MAD” is the median absolute deviation (Reimann et al., 2008). For compositional data<br />
it should replace the standard deviation and is as such a measure of variation of the data.<br />
However, it is not allowed to calculate this measure for untransformed, “raw” data, they have<br />
to be either log-transformed MAD.log) or, better, “ilr” (isometric logratio, Egozcue et al.,<br />
11
2003) transformed (MAD.ilr) prior to the calculation. Unfortunately they cannot be backtransformed<br />
to the original data space because the log transformation changes the distances of<br />
the observations from the center asymmetrically. The MAD.log (MAD.ilr) can thus not really<br />
replace the standard deviation. It rather informs about the stability of the part x on the<br />
remainder 1-x and small values indicate a high stability. As an additional measure of variation<br />
the “powers” are thus provided, they provide a direct impression of the orders of magnitude<br />
variation for each variable.<br />
To get a better “feeling” for the data, Table 6 shows median, 98 th percentile value and<br />
maximum concentration for the Nordkinn and the directly comparable Nordland/Troms<br />
dataset (Reimann et al., 2011). They are comparable in terms of grain size, laboratory<br />
procedures, and number of samples, but of course the Nordland/Troms dataset covers a much<br />
larger area and represents a different geological setting. For all three percentiles the highest<br />
value is marked in bold print. The table shows that the analytical results for the Nordkinn<br />
samples returned unusually high values for Au, Fe, all REEs, Hg, Mn, Nb, Sb, Ti, Tl, U, Y<br />
and Zr. It is obvious that especially the REEs returned very unusual results on the Nordkinn<br />
Peninsula (see for example the maximum value of Dysprosium (Dy) with 49 mg/kg).<br />
2.2 Cumulative Probability (CP-) Plot<br />
Plots of the cumulative distribution function are one of the most informative displays of<br />
geochemical distributions (Reimann et al., 2008). In the plots the concentration is plotted<br />
along the X-axis and the cumulative probability is plotted along the Y-axis, and it allows the<br />
direct visual recognition of breaks in the curve which may be indicative of different<br />
geochemical processes. Breaks in the uppermost few percentiles of the distribution are often<br />
used as threshold for anomaly identification.<br />
2.3 Mapping<br />
There exist many different methods for producing geochemical maps (see discussion in<br />
Reimann, 2005 or in Chapter 5 of Reimann et al., 2008). In mineral exploration so called<br />
“growing dot maps” as introduced by Bjørklund and Gustavsson (1987) are probably most<br />
often used. However, they focus the attention almost exclusively on the high values, the<br />
“anomalies” and are less well suited to study the data in more detail, e.g., in relation to<br />
geology or to detect more local anomalies that may not be characterized by especially high<br />
values in relation to the whole dataset but rather display barely high values for their<br />
surroundings.<br />
To detect such more subtle features in the dataset it has proved helpful to use classes and to<br />
base these classes on percentiles of the distribution. EDA has developed an own symbolset,<br />
which is based on 5 classes, and was developed to provide an even optical weight of the<br />
symbols associated with these classes in a map. Here the EDA symbolset with accentuated<br />
outliers was used (Reimann et al., 2008) and the symbols were directly plotted on geological<br />
maps. The percentiles for a change in the symbols are 2 – 25 – 75 – 98%. The lowest values<br />
(0-2 %) are marked by large open circles, the values from 2 – 25 % of the data by small open<br />
circles, the inner 50% of the dataset are marked by a dot, the values from 75 to 98% by a<br />
cross and all values above the 98th percentile by a black square that grows in addition in<br />
direct relation to the analytical result (in order to be able to detect the highest value in the<br />
12
maps). As all the maps are prepared on a backdrop of a generalized bedrock map based on the<br />
available maps in scale 1:50000 and 1:250000 hosted by http://geo.ngu.no/kart/berggrunn/<br />
(Roberts, 1973, 1981, 1998, 2006a, 2006b, Roberts & Siedlecka 2011, Siedlecka 2009 and<br />
Siedlecka et al), the reader will note that for many elements the chosen classes are able to<br />
depict geology more or less 1:1. An excerpt of the legend for the 1:250000 scale map series is<br />
showed in Figure 6.<br />
Figure 6. Excerpt from legend of 1:250000 bedrock maps.<br />
Because the dataset is provided with this report it is possible and up to the reader to use<br />
different mapping techniques. Note, however, that in the provided data files all values below<br />
detection are marked as “
unit more local anomalies of a variety of elements occur, e.g. Cu, Ba and K (see (8)) in the<br />
central parts or Ti (see (9) in the southwestern parts. Furthermore, based on the analytical<br />
results of some other elements (e.g., Cs, Sb), it is possible to subdivide this large unit into a<br />
number of geochemically distinct subunits all running in a northeastern-southwestern<br />
direction.<br />
(6) Lead (Pb) shows a number of high values in the northernmost part of the survey are. These<br />
values are not bound to any of the mapped geological units.<br />
(7) A number of enhanced Zn concentrations were observed in the central sandstone unit (see<br />
5). Especially the easternmost subdivision of the unit appears to be enriched in Zn, P, Ni, Nb,<br />
Mg, and Cs (depleted in Sb).<br />
(8) A Cu-Bi-Ba-K anomaly is observed in the central parts of the survey area within the<br />
central sandstone unit (see (5). The maximum Cu concentration is over 600 mg/kg.<br />
(9) A Ti-Nb-Sn-V-(Ta)-(W) anomaly is observed in the southwestern corner of the survey<br />
area, again within the central sandstone unit (see (5)).<br />
In summary the maps show the power of a detailed geochemical soil survey in aiding<br />
geological mapping in an area that is difficult to subdivide based on geological field<br />
observations alone. The high values of the REEs are very unusual even in a European<br />
perspective.<br />
4. ACKNOWLEDGEMENTS<br />
The field crew did a formidable job: John F Alston, Malin Andersson, Simen Berger, Ola<br />
Anfin Eggen, Tor Erik Finne, Henning K B Jensen, Øystein Jæger, Agnes M Raaness, and<br />
Gaute Storrø. Gamvik Municipality provided landing permits for helicopter on<br />
Digermulhalvøya and the area NW of Langfjorden, utilized during 4 days by LN-OFC from<br />
Helitrans. Statens Naturoppsyn Lakselv’s Petter Kaald and Bernt Thomassen provided<br />
excellent service transporting crew by sea from Kjøllefjord to and from various locations on<br />
the west coast. John Alston also conducted all sieving and subsequent handling of samples at<br />
the <strong>NGU</strong> facilities.<br />
5. REFERENCES<br />
Aitchison, J., 1986. The statistical analysis of compositional data. Chapman and Hall,<br />
London.<br />
Bølviken, B., Bergström, B., Björklund, A., Konti, M., Lehmuspelto, P., Lindholm, T.,<br />
Magnusson, J., Ottesen, R.T., Steenfelt, A.,Volden, T. 1986. Geochemical Atlas of Northern<br />
Fennoscandia, Scale 1:4 000 000. Geological Survey of Norway.<br />
Bjørklund, A., Gustavsson, N., 1987. Visualization of geochemical data on maps: New<br />
options. Journal of Geochemical Exploration 29, 89-103.<br />
Egozcue, J.J., Pawlowsky-Glahn, V., Mateu-Figueras, G., Barcelo-Vidal, C., 2003.Isometric<br />
logratio transformations for compositional data analysis. Mathematical Geology, 35 (3), 279-<br />
300.<br />
Filzmoser, P. Hron, K., Reimann, C., 2009. Univariate statistical analysis of environmental<br />
(compositional) data – Problems and possibilities. Science of the Total Environment 407,<br />
6100-6108.<br />
14
Filzmoser, P., Hron, K., Reimann, C., 2010. The bivariate statistical analysis of environmental<br />
(compositional) data. Science of the Total Environment 408, 4230-4238.<br />
Olsen, Lars; Reite, Arne; Riiber, Knut; Sørensen, Erling. 1996. Kvartærgeologisk kart<br />
Finnmark fylke; M=1:500 000; trykt i farger. Norges geologiske undersøkelse.<br />
Reimann, C., Äyräs, M., Chekushin, V., Bogatyrev, I., Boyd, R., Caritat, P. De, Dutter, R.,<br />
Finne, T.E., Halleraker, J.H., Jæger, Ø., Kashulina, G., Lehto, O., Niskavaara, H., Pavlov, V.,<br />
Räisänen, M.L., Strand, T., Volden, T., 1998. Environmental Geochemical Atlas of the<br />
Central Barents Region. ISBN 82-7385-176-1. <strong>NGU</strong>-GTK-CKE Special Publication,<br />
Geological Survey of Norway, Trondheim, Norway.<br />
Reimann, C., Demetriades, A., Eggen, O.A., Filzmoser, P. and the EuroGeoSurveys<br />
Geochemistry Expert Group, 2009. The EuroGeoSurveys geochemical mapping of<br />
agricultural and grazing land soils project (GEMAS) – Evaluation of quality control results of<br />
aqua regia extraction analysis. <strong>NGU</strong> report 2009.049.<br />
Reimann, C., Filzmoser, P., Garrett, R.G., Dutter, R., 2008. Statistical data analysis explained.<br />
Applied environmental statistics with R. Wiley, Chichester, U.K.<br />
Reimann, C., Finne, T.E., Filzmoser, P., 2011. New geochemical data from a collection of till<br />
samples from Nordland, Troms and Finnmark. <strong>NGU</strong> report 2011.45.<br />
Roberts, D. 1973. Berggrunnskart Hammerfest, M=1:250 000; trykt i farger; <strong>NGU</strong> Skrifter<br />
nr.10. Norges geologiske undersøkelse.<br />
Roberts, D. 1981. Berggrunnskart Nordkapp, M=1:250 000; trykt i farger. <strong>NGU</strong> Skrifter<br />
nr.61. Norges geologiske undersøkelse.<br />
Roberts, D. 1998. Berggrunnskart Honningsvåg, M=1:250 000; trykt i farger Norges<br />
geologiske undersøkelse.<br />
Roberts, D. 2006. Berggrunnskart SKJØTNINGBERG 2237 III, M:1:50000, Norges<br />
geologiske undersøkelse<br />
Roberts, D. 2006. Berggrunnskart MEHAMN 2237 II, M:1:50000. Norges geologiske<br />
undersøkelse.<br />
Roberts, D. & Siedlecka, A. 2011. Berggrunnskart FINNKONGKEILA 2336-4, 1:50000,<br />
revidert foreløpig utgave. Norges geologiske undersøkelse.<br />
Roberts, D., 2007. Palaeocurrent data from the Kalak Nappe Complex, northern Norway: a<br />
key element in models of terrane affiliation. Norwegian Journal of Geology 87: 319-328.<br />
Siedlecka, A., 2009. Berggrunnsgeologisk kart TROLLFJORDEN 2336 3, M 1:50000,<br />
foreløpig utgave 2, revidert. Norges geologiske undersøkelse-<br />
Siedlecka, A., Reading, H.G., Williams, G.D. & Roberts, D. 2006. Berggrunnsgeologisk kart<br />
LANGFJORDEN 2236 2, M:1:50000 foreløpig utgave Norges geologiske undersøkelse<br />
15
Table 1. Project standard "Minn" - Min, Q50, Max and precision values.<br />
MINN n=36 Alphabetical Sorted by precision<br />
Element Precision Element Precision Element Element<br />
Min Q50 Max Min Q50 Max Precision Precision<br />
Ag 1,62 1,75 2 4,4 Mo 12 13,2 15,2 4,9 Ge n.d U 6,1<br />
Al 8705 9574 10985 5,4 Na 844 1014 1307 12,1 Ta n.d Er 5,9<br />
As 22,1 24,9 28,2 5,4 Nb 1,14 1,38 1,61 8,7 B 18,5 K 5,5<br />
Au 0,0969 0,112 0,159 7,7 Nd 8,62 11,2 13,9 12,2 Tm 18,0 Al 5,4<br />
B 1,73 2,61 5,17 18,5 Ni 34,7 37,7 40,7 3,8 Hf 16,2 As 5,4<br />
Ba 230 276 309 4,1 P 704 796 952 5,4 Lu 14,1 P 5,4<br />
Be 4,47 5,13 6,6 9,4 Pb 116 124 135 4,3 Re 13,6 Cr 5,3<br />
Bi 5,75 6,5 7,62 4,5 Pd 0,089 0,115 0,135 7,9 Pr 13,3 In 5,2<br />
Ca 6589 7223 8091 6,3 Pr 2,54 3,2 3,88 13,3 Eu 13,0 Ga 5,2<br />
Cd 2,14 2,3 2,67 6,1 Pt 0,316 0,343 0,378 4,5 Tb 12,5 Sb 5,1<br />
Ce 22,1 28,7 33,7 11,7 Rb 35,5 37,8 42,2 3,4 Nd 12,2 Mn 5,0<br />
Co 6,94 7,43 8,84 4,9 Re 0,0433 0,056 0,067 13,6 Na 12,1 Co 4,9<br />
Cr 106 120 135 5,3 S 1472 1605 1748 4,1 Sc 11,9 Mo 4,9<br />
Cs 2,28 2,39 2,78 3,6 Sb 4,82 5,59 6,29 5,1 Ce 11,7 Ti 4,8<br />
Cu 101 111 120 3,1 Sc 1,95 2,27 3,1 11,9 Yb 10,5 V 4,8<br />
Dy 0,827 1,15 1,39 7,3 Se 4,32 5,02 5,96 4,8 La 10,4 Se 4,8<br />
Er 0,483 0,612 0,765 5,9 Sm 1,53 1,89 2,28 9,4 Y 9,7 Sn 4,6<br />
Eu 0,31 0,409 0,544 13,0 Sn 6 6,41 7,41 4,6 Zr 9,6 Pt 4,5<br />
Fe 23114 24630 26759 3,0 Sr 55,1 66,3 76,7 7,6 Be 9,4 Bi 4,5<br />
Ga 4,32 4,67 5,44 5,2 Ta 0,025 0,025 0,025 0,0 Sm 9,4 Ag 4,4<br />
Gd 1,15 1,45 1,77 8,9 Tb 0,162 0,206 0,257 12,5 Gd 8,9 Pb 4,3<br />
Ge 0,05 0,05 0,178 0,0 Te 4,45 4,96 5,54 6,3 Ho 8,7 Tl 4,2<br />
Hf 0,0624 0,0879 0,116 16,2 Th 6,13 6,93 8,08 8,2 Nb 8,7 S 4,1<br />
Hg 0,168 0,193 0,238 4,1 Ti 990 1179 1342 4,8 Th 8,2 Ba 4,1<br />
Ho 0,171 0,237 0,29 8,7 Tl 5,04 5,33 5,86 4,2 Pd 7,9 Hg 4,1<br />
In 2,01 2,16 2,52 5,2 Tm 0,0705 0,0939 0,115 18,0 Li 7,8 W 4,0<br />
K 3857 4286 4737 5,5 U 2,41 2,78 3,13 6,1 Au 7,7 Ni 3,8<br />
La 12,2 15,8 19,2 10,4 V 37,1 40,9 45,3 4,8 Sr 7,6 Cs 3,6<br />
Li 24,1 26,9 31,9 7,8 W 2,61 2,93 3,52 4,0 Dy 7,3 Rb 3,4<br />
Lu 0,0758 0,096 0,143 14,1 Y 4,88 6,19 7,39 9,7 Ca 6,3 Mg 3,3<br />
Mg 5703 6153 6717 3,3 Yb 0,463 0,615 0,726 10,5 Te 6,3 Cu 3,1<br />
Mn 562 607 690 5,0 Zn 288 306 344 2,5 Cd 6,1 Fe 3,0<br />
Zr 1,56 1,94 2,48 9,6 Zn 2,5<br />
16
Table 2. Project standard "Nidelv" - Min, Q50, Max and precision values. Q50 values for<br />
Nordland+Troms dataset given in addition.<br />
NIDELV n=8 Alphabetical Sorted by precision<br />
Element Nordland Precision Element<br />
Nordland<br />
+Troms<br />
Precision Element Element<br />
+Troms<br />
Q50<br />
Min Q50 Q50 (N=53) Max Min Q50 (N=53) Max Precision Precision<br />
Ag 0,0253 0,0378 0,0405 0,0463 16,8 Mo 0,248 0,282 0,287 0,335 6,4 Ge nd Eu 8,9<br />
Al 7491 8422 7883 9507 6,0 Na 106 138 105 175 18,2 In nd Ho 8,9<br />
As 2 2,5 2,27 3,12 23,7 Nb 0,426 0,536 0,37 0,608 11,6 Pd nd Yb 8,8<br />
Au<br />
B<br />
0,0005<br />
0,5 41<br />
0,00101<br />
1,21<br />
0,000704<br />
0,982<br />
0,00387<br />
2,37<br />
55,0 Nd<br />
87,0 Ni<br />
10,1<br />
25,6<br />
11,3<br />
27,5<br />
10,3<br />
27,9<br />
12,7<br />
30,2<br />
6,1<br />
4,2<br />
Pt<br />
Re<br />
nd<br />
nd<br />
Cu<br />
Lu<br />
8,6<br />
8,6<br />
Ba 28,5 30,1 29,6 33,2 4,7 P 403 443 434 471 5,4 S nd Th 8,6<br />
Be 0,124 0,163 0,158 0,211 32,4 Pb 6,26 7,1 6,99 7,66 10,1 Ta nd Zr 8,4<br />
Bi 0,01 0,0669 0,0609 0,128 55,6 Pd 0,005 0,005 -0,0002028 0,005 0,0 Te nd Sn 7,9<br />
Ca 1970 2220 2072 2591 3,8 Pr 2,84 3,08 2,68 3,83 3,7 B 87 Tb 7,7<br />
Cd 0,0552 0,0826 0,0829 0,102 29,1 Pt 0,001 0,001 0,000059 0,001 0,0 Se 81 Sr 7,6<br />
Ce 23,9 25,3 25 29 6,0 Rb 10,3 11,6 11,6 12,3 6,5 Bi 56 Tl 7,2<br />
Co 7,2 8,03 8,07 8,89 5,4 Re 0,0005 0,0005 0,0000895 0,00144 0,0 Au 55 K 6,9<br />
Cr 37 39 37,2 45,7 3,9 S 100 100 56,6 100 0,0 Hg 33 Rb 6,5<br />
Cs 0,738 0,802 0,818 0,859 3,1 Sb 0,0713 0,0867 0,0841 0,104 11,9 Be 32 Mo 6,4<br />
Cu 18,7 21,1 21,5 22,5 8,6 Sc 1,48 1,69 1,76 2,01 9,4 Cd 29 La 6,2<br />
Dy 1,1 1,29 1,14 1,37 9,1 Se 0,05 0,11 0,186 0,227 81,0 As 24 Zn 6,2<br />
Er 0,577 0,659 0,588 0,752 14,5 Sm 1,84 1,99 1,75 2,49 5,8 Na 18 Nd 6,1<br />
Eu 0,367 0,403 0,323 0,451 8,9 Sn 0,463 0,52 0,575 0,734 7,9 Ag 17 Ce 6,0<br />
Fe 12912 14238 13125 15990 3,3 Sr 8,9 10,4 8,79 12,2 7,6 W 16 Al 6,0<br />
Ga 2,31 2,48 2,37 2,73 9,0 Ta 0,025 0,025 0,000179 0,025 0,0 Er 15 Sm 5,8<br />
Gd 1,31 1,61 1,38 1,82 9,3 Tb 0,216 0,245 0,202 0,282 7,7 Tm 13 Co 5,4<br />
Ge 0,05 0,05 0,0414 0,05 0,0 Te 0,01 0,01 0,0135 0,0263 0,0 Ti 12 P 5,4<br />
Hf 0,0224 0,0407 0,049 0,0512 10,6 Th 2,61 2,95 3,05 3,25 8,6 Sb 12 Y 5,0<br />
Hg 0,0241 0,0548 0,0499 0,0937 33,2 Ti 495 570 520 665 12,0 Nb 12 V 4,8<br />
Ho 0,219 0,261 0,222 0,321 8,9 Tl 0,0884 0,102 0,0904 0,112 7,2 Li 11 Ba 4,7<br />
In 0,01 0,01 0,00777 0,0296 0,0 Tm 0,0819 0,099 0,0762 0,116 13,0 Hf 11 Ni 4,2<br />
K 1276 1360 1325 1544 6,9 U 0,537 0,588 0,549 0,658 9,6 Pb 10 Mn 4,1<br />
La 11,3 12,3 12,1 13,9 6,2 V 21 23,4 21,3 26,8 4,8 U 9,6 Cr 3,9<br />
Li 8,8 10,1 9,06 11,6 11,2 W 0,133 0,179 0,138 0,202 15,8 Sc 9,4 Ca 3,8<br />
Lu 0,0674 0,086 0,078 0,131 8,6 Y 5,63 6,18 5,88 7,03 5,0 Gd 9,3 Pr 3,7<br />
Mg 5636 6137 5722 6895 3,6 Yb 0,458 0,569 0,523 0,657 8,8 Dy 9,1 Mg 3,6<br />
Mn 239 258 252 300 4,1 Zn 36,1 39,6 38,2 42,4 6,2 Ga 9,0 Fe 3,3<br />
Zr 1,69 2,45 3,21 2,68 8,4 Cs 3,1<br />
17
Table 3. Laboratory standard "DS8" - Min, Q50, Max and precision values.<br />
DS8 (laboratory standard) n=33 Alphabetical Sorted by precision<br />
Element Precision Element Precision Element Element<br />
Min Q50 Max Min Q50 Max Precision Precision<br />
Ag 1,62 1,75 2 4,4 Mo 12 13,2 15,2 4,9 Ge nd U 6,1<br />
Al 8705 9574 10985 5,4 Na 844 1014 1307 12,1 Ta nd Er 5,9<br />
As 22,1 24,9 28,2 5,4 Nb 1,14 1,38 1,61 8,7 B 18,5 K 5,5<br />
Au 0,0969 0,112 0,159 7,7 Nd 8,62 11,2 13,9 12,2 Tm 18,0 Al 5,4<br />
B 1,73 2,61 5,17 18,5 Ni 34,7 37,7 40,7 3,8 Hf 16,2 As 5,4<br />
Ba 230 276 309 4,1 P 704 796 952 5,4 Lu 14,1 P 5,4<br />
Be 4,47 5,13 6,6 9,4 Pb 116 124 135 4,3 Re 13,6 Cr 5,3<br />
Bi 5,75 6,5 7,62 4,5 Pd 0,089 0,115 0,135 7,9 Pr 13,3 In 5,2<br />
Ca 6589 7223 8091 6,3 Pr 2,54 3,2 3,88 13,3 Eu 13,0 Ga 5,2<br />
Cd 2,14 2,3 2,67 6,1 Pt 0,316 0,343 0,378 4,5 Tb 12,5 Sb 5,1<br />
Ce 22,1 28,7 33,7 11,7 Rb 35,5 37,8 42,2 3,4 Nd 12,2 Mn 5,0<br />
Co 6,94 7,43 8,84 4,9 Re 0,0433 0,056 0,067 13,6 Na 12,1 Co 4,9<br />
Cr 106 120 135 5,3 S 1472 1605 1748 4,1 Sc 11,9 Mo 4,9<br />
Cs 2,28 2,39 2,78 3,6 Sb 4,82 5,59 6,29 5,1 Ce 11,7 Ti 4,8<br />
Cu 101 111 120 3,1 Sc 1,95 2,27 3,1 11,9 Yb 10,5 V 4,8<br />
Dy 0,827 1,15 1,39 7,3 Se 4,32 5,02 5,96 4,8 La 10,4 Se 4,8<br />
Er 0,483 0,612 0,765 5,9 Sm 1,53 1,89 2,28 9,4 Y 9,7 Sn 4,6<br />
Eu 0,31 0,409 0,544 13,0 Sn 6 6,41 7,41 4,6 Zr 9,6 Pt 4,5<br />
Fe 23114 24630 26759 3,0 Sr 55,1 66,3 76,7 7,6 Be 9,4 Bi 4,5<br />
Ga 4,32 4,67 5,44 5,2 Ta 0,025 0,025 0,025 0,0 Sm 9,4 Ag 4,4<br />
Gd 1,15 1,45 1,77 8,9 Tb 0,162 0,206 0,257 12,5 Gd 8,9 Pb 4,3<br />
Ge 0,05 0,05 0,178 0,0 Te 4,45 4,96 5,54 6,3 Ho 8,7 Tl 4,2<br />
Hf 0,0624 0,0879 0,116 16,2 Th 6,13 6,93 8,08 8,2 Nb 8,7 S 4,1<br />
Hg 0,168 0,193 0,238 4,1 Ti 990 1179 1342 4,8 Th 8,2 Ba 4,1<br />
Ho 0,171 0,237 0,29 8,7 Tl 5,04 5,33 5,86 4,2 Pd 7,9 Hg 4,1<br />
In 2,01 2,16 2,52 5,2 Tm 0,0705 0,0939 0,115 18,0 Li 7,8 W 4,0<br />
K 3857 4286 4737 5,5 U 2,41 2,78 3,13 6,1 Au 7,7 Ni 3,8<br />
La 12,2 15,8 19,2 10,4 V 37,1 40,9 45,3 4,8 Sr 7,6 Cs 3,6<br />
Li 24,1 26,9 31,9 7,8 W 2,61 2,93 3,52 4,0 Dy 7,3 Rb 3,4<br />
Lu 0,0758 0,096 0,143 14,1 Y 4,88 6,19 7,39 9,7 Ca 6,3 Mg 3,3<br />
Mg 5703 6153 6717 3,3 Yb 0,463 0,615 0,726 10,5 Te 6,3 Cu 3,1<br />
Mn 562 607 690 5,0 Zn 288 306 344 2,5 Cd 6,1 Fe 3,0<br />
Zr 1,56 1,94 2,48 9,6 Zn 2,5<br />
18
Table 4. Precision of analytical duplicates and field duplicates.<br />
Analytical (weighing) duplicates N=86 pairs Field duplicates N=30 pairs<br />
Alphabethical Sorted Alphabethical Sorted<br />
Element Precision Element Precision Element Precision Element Precision<br />
Ag 22,9 Re 1741 Ag 42 Re 389<br />
Al 2,6 Pd 262 Al 12 Pt 299<br />
As 8,5 Pt 151 As 40 Pd 251<br />
Au 72,1 Te 99 Au 82 Te 99<br />
B 33,6 Au 72 B 54 Au 82<br />
Ba 4,3 Ta 61 Ba 19 Ta 69<br />
Be 17,2 B 34 Be 32 Cd 58<br />
Bi 14,4 Ge 32 Bi 21 Ge 55<br />
Ca 5,7 Hg 30 Ca 34 B 54<br />
Cd 20,5 In 30 Cd 58 Hg 48<br />
Ce 5,2 W 28 Ce 29 S 46<br />
Co 3,2 Ag 23 Co 16 Ag 42<br />
Cr 4,1 Cd 21 Cr 15 As 40<br />
Cs 3,6 Be 17 Cs 9 In 36<br />
Cu 3,2 S 16 Cu 22 Mo 35<br />
Dy 5,5 Se 16 Dy 28 Gd 35<br />
Er 5,7 Bi 14 Er 29 Ca 34<br />
Eu 5,8 Hf 11 Eu 32 La 34<br />
Fe 3,2 Sb 8,6 Fe 10 Nd 34<br />
Ga 3,6 As 8,5 Ga 11 Pr 34<br />
Gd 7,2 Lu 8,4 Gd 35 Be 32<br />
Ge 32,2 Tm 7,7 Ge 55 Eu 32<br />
Hf 10,7 Mo 7,6 Hf 27 Sm 32<br />
Hg 30,3 Gd 7,2 Hg 48 Se 32<br />
Ho 4,6 Sn 6,3 Ho 27 Tb 31<br />
In 30,3 Sr 6,2 In 36 Y 29<br />
K 2,9 Nb 6 K 15 Er 29<br />
La 4,5 Eu 5,8 La 34 W 29<br />
Li 4,7 Yb 5,8 Li 15 Ce 29<br />
Lu 8,4 Ca 5,7 Lu 25 Dy 28<br />
Mg 2,5 Er 5,7 Mg 16 Ho 27<br />
Mn 3,4 Tb 5,6 Mn 22 Tm 27<br />
Mo 7,6 Dy 5,5 Mo 35 Hf 27<br />
Na 4,5 Ce 5,2 Na 14 Lu 25<br />
Nb 6 Nd 4,9 Nb 23 P 24<br />
Nd 4,9 P 4,8 Nd 34 Yb 24<br />
Ni 2,9 Li 4,7 Ni 13 Nb 23<br />
P 4,8 Zr 4,7 P 24 Cu 22<br />
Pb 3,7 Ho 4,6 Pb 11 Mn 22<br />
Pd 262,4 Sm 4,6 Pd 251 Th 21<br />
Pr 4,3 La 4,5 Pr 34 Bi 21<br />
Pt 151,2 Na 4,5 Pt 299 Zr 20<br />
Rb 4,1 U 4,4 Rb 14 Ba 19<br />
Re 1741,1 Ba 4,3 Re 389 Sr 19<br />
S 16,3 Pr 4,3 S 46 Sb 18<br />
Sb 8,6 Cr 4,1 Sb 18 U 18<br />
Sc 3,8 Rb 4,1 Sc 11 Co 16<br />
Se 15,7 Tl 4 Se 32 Mg 16<br />
Sm 4,6 V 4 Sm 32 Tl 15<br />
Sn 6,3 Ti 3,9 Sn 13 Li 15<br />
Sr 6,2 Y 3,9 Sr 19 Cr 15<br />
Ta 61,3 Sc 3,8 Ta 69 K 15<br />
Tb 5,6 Th 3,8 Tb 31 Rb 14<br />
Te 98,8 Pb 3,7 Te 99 Na 14<br />
Th 3,8 Zn 3,7 Th 21 Ni 13<br />
Ti 3,9 Cs 3,6 Ti 11 Sn 13<br />
Tl 4 Ga 3,6 Tl 15 Al 12<br />
Tm 7,7 Mn 3,4 Tm 27 Zn 12<br />
U 4,4 Co 3,2 U 18 Ti 11<br />
V 4 Cu 3,2 V 10 Ga 11<br />
W 28,3 Fe 3,2 W 29 Sc 11<br />
Y 3,9 K 2,9 Y 29 Pb 11<br />
Yb 5,8 Ni 2,9 Yb 24 V 10<br />
Zn 3,7 Al 2,6 Zn 12 Fe 10<br />
Zr 4,7 Mg 2,5 Zr 20 Cs 9<br />
19
Table 5. Statistical parameters of the mapped dataset. N=808.<br />
Ele- official Practiment<br />
DL cal DL Min Q2 Q5 Q10 Q25 Q50 Q75 Q90 Q95 Q98 Max MAD.log MAD.ilr Powers<br />
Ag 0,002 0,002 0,001 0,001 0,001 0,001 0,0056 0,011 0,018 0,029 0,042 0,077 0,22 0,354 0,577 2,3<br />
Al 100 100 546 2149 3671 5780 10262 15105 18261 21186 22994 25453 32809 0,157 0,261 1,8<br />
As 0,1 0,1
Table 6. Comparison of the Nordkinn and Nordland+Troms datasets.<br />
Nordkinn N=808 Nordland + Troms N=982<br />
ELEMENT DL MEDIAN Q98 MAX MEDIAN Q98 MAX<br />
Ag 0,002 0,011 0,077 0,22 0,0151 0,12 0,45<br />
Al 100 15105 25453 32809 9864 27054 44069<br />
As 0,1 2,3 18 67 1,9 17,7 376<br />
Au 0,0002 0,001 0,005 0,034 0,001 0,004 0,026<br />
B 1
<strong>NGU</strong> Rapport 2012.015 | <strong>NGU</strong> Report 2012.016 Appendix 1<br />
Kumulative frekvensfordelingsdiagram | Cumulative frequency diagrams<br />
22
<strong>NGU</strong> Rapport 2012.015 | <strong>NGU</strong> Report 2012.016 Appendix 1<br />
Kumulative frekvensfordelingsdiagram | Cumulative frequency diagrams<br />
23
<strong>NGU</strong> Rapport 2012.015 | <strong>NGU</strong> Report 2012.016 Appendix 1<br />
Kumulative frekvensfordelingsdiagram | Cumulative frequency diagrams<br />
24
<strong>NGU</strong> Rapport 2012.015 | <strong>NGU</strong> Report 2012.016 Appendix 1<br />
Kumulative frekvensfordelingsdiagram | Cumulative frequency diagrams<br />
25
<strong>NGU</strong> Rapport 2012.015 | <strong>NGU</strong> Report 2012.016 Appendix 1<br />
Kumulative frekvensfordelingsdiagram | Cumulative frequency diagrams<br />
26
<strong>NGU</strong> Rapport 2012.015 | <strong>NGU</strong> Report 2012.016 Appendix 1<br />
Kumulative frekvensfordelingsdiagram | Cumulative frequency diagrams<br />
27
<strong>NGU</strong> Rapport 2012.015 | <strong>NGU</strong> Report 2012.016 Appendix 1<br />
Kumulative frekvensfordelingsdiagram | Cumulative frequency diagrams<br />
28
<strong>NGU</strong> Rapport 2012.015 | <strong>NGU</strong> Report 2012.016 Appendix 1<br />
Kumulative frekvensfordelingsdiagram | Cumulative frequency diagrams<br />
29
<strong>NGU</strong> Rapport 2012.015 | <strong>NGU</strong> Report 2012.016 Appendix 1<br />
Kumulative frekvensfordelingsdiagram | Cumulative frequency diagrams<br />
30
<strong>NGU</strong> Rapport 2012.015 | <strong>NGU</strong> Report 2012.016 Appendix2<br />
Geokjemikart fra Nordkinnhalvøya<br />
Geochemical maps from the Nordkinn Peninsula<br />
31
<strong>NGU</strong> Rapport 2012.015 | <strong>NGU</strong> Report 2012.016 Appendix2<br />
Geokjemikart fra Nordkinnhalvøya<br />
Geochemical maps from the Nordkinn Peninsula<br />
32
<strong>NGU</strong> Rapport 2012.015 | <strong>NGU</strong> Report 2012.016 Appendix2<br />
Geokjemikart fra Nordkinnhalvøya<br />
Geochemical maps from the Nordkinn Peninsula<br />
33
<strong>NGU</strong> Rapport 2012.015 | <strong>NGU</strong> Report 2012.016 Appendix2<br />
Geokjemikart fra Nordkinnhalvøya<br />
Geochemical maps from the Nordkinn Peninsula<br />
34
<strong>NGU</strong> Rapport 2012.015 | <strong>NGU</strong> Report 2012.016 Appendix2<br />
Geokjemikart fra Nordkinnhalvøya<br />
Geochemical maps from the Nordkinn Peninsula<br />
35
<strong>NGU</strong> Rapport 2012.015 | <strong>NGU</strong> Report 2012.016 Appendix2<br />
Geokjemikart fra Nordkinnhalvøya<br />
Geochemical maps from the Nordkinn Peninsula<br />
36
<strong>NGU</strong> Rapport 2012.015 | <strong>NGU</strong> Report 2012.016 Appendix2<br />
Geokjemikart fra Nordkinnhalvøya<br />
Geochemical maps from the Nordkinn Peninsula<br />
37
<strong>NGU</strong> Rapport 2012.015 | <strong>NGU</strong> Report 2012.016 Appendix2<br />
Geokjemikart fra Nordkinnhalvøya<br />
Geochemical maps from the Nordkinn Peninsula<br />
38
<strong>NGU</strong> Rapport 2012.015 | <strong>NGU</strong> Report 2012.016 Appendix2<br />
Geokjemikart fra Nordkinnhalvøya<br />
Geochemical maps from the Nordkinn Peninsula<br />
39
<strong>NGU</strong> Rapport 2012.015 | <strong>NGU</strong> Report 2012.016 Appendix2<br />
Geokjemikart fra Nordkinnhalvøya<br />
Geochemical maps from the Nordkinn Peninsula<br />
40
<strong>NGU</strong> Rapport 2012.015 | <strong>NGU</strong> Report 2012.016 Appendix2<br />
Geokjemikart fra Nordkinnhalvøya<br />
Geochemical maps from the Nordkinn Peninsula<br />
41
<strong>NGU</strong> Rapport 2012.015 | <strong>NGU</strong> Report 2012.016 Appendix2<br />
Geokjemikart fra Nordkinnhalvøya<br />
Geochemical maps from the Nordkinn Peninsula<br />
42
<strong>NGU</strong> Rapport 2012.015 | <strong>NGU</strong> Report 2012.016 Appendix2<br />
Geokjemikart fra Nordkinnhalvøya<br />
Geochemical maps from the Nordkinn Peninsula<br />
43
<strong>NGU</strong> Rapport 2012.015 | <strong>NGU</strong> Report 2012.016 Appendix2<br />
Geokjemikart fra Nordkinnhalvøya<br />
Geochemical maps from the Nordkinn Peninsula<br />
44
<strong>NGU</strong> Rapport 2012.015 | <strong>NGU</strong> Report 2012.016 Appendix2<br />
Geokjemikart fra Nordkinnhalvøya<br />
Geochemical maps from the Nordkinn Peninsula<br />
45
<strong>NGU</strong> Rapport 2012.015 | <strong>NGU</strong> Report 2012.016 Appendix2<br />
Geokjemikart fra Nordkinnhalvøya<br />
Geochemical maps from the Nordkinn Peninsula<br />
46
<strong>NGU</strong> Rapport 2012.015 | <strong>NGU</strong> Report 2012.016 Appendix2<br />
Geokjemikart fra Nordkinnhalvøya<br />
Geochemical maps from the Nordkinn Peninsula<br />
47
<strong>NGU</strong> Rapport 2012.015 | <strong>NGU</strong> Report 2012.016 Appendix2<br />
Geokjemikart fra Nordkinnhalvøya<br />
Geochemical maps from the Nordkinn Peninsula<br />
48
<strong>NGU</strong> Rapport 2012.015 | <strong>NGU</strong> Report 2012.016 Appendix2<br />
Geokjemikart fra Nordkinnhalvøya<br />
Geochemical maps from the Nordkinn Peninsula<br />
49
<strong>NGU</strong> Rapport 2012.015 | <strong>NGU</strong> Report 2012.016 Appendix2<br />
Geokjemikart fra Nordkinnhalvøya<br />
Geochemical maps from the Nordkinn Peninsula<br />
50
<strong>NGU</strong> Rapport 2012.015 | <strong>NGU</strong> Report 2012.016 Appendix2<br />
Geokjemikart fra Nordkinnhalvøya<br />
Geochemical maps from the Nordkinn Peninsula<br />
51
<strong>NGU</strong> Rapport 2012.015 | <strong>NGU</strong> Report 2012.016 Appendix2<br />
Geokjemikart fra Nordkinnhalvøya<br />
Geochemical maps from the Nordkinn Peninsula<br />
52
<strong>NGU</strong> Rapport 2012.015 | <strong>NGU</strong> Report 2012.016 Appendix2<br />
Geokjemikart fra Nordkinnhalvøya<br />
Geochemical maps from the Nordkinn Peninsula<br />
53
<strong>NGU</strong> Rapport 2012.015 | <strong>NGU</strong> Report 2012.016 Appendix2<br />
Geokjemikart fra Nordkinnhalvøya<br />
Geochemical maps from the Nordkinn Peninsula<br />
54
<strong>NGU</strong> Rapport 2012.015 | <strong>NGU</strong> Report 2012.016 Appendix2<br />
Geokjemikart fra Nordkinnhalvøya<br />
Geochemical maps from the Nordkinn Peninsula<br />
55
<strong>NGU</strong> Rapport 2012.015 | <strong>NGU</strong> Report 2012.016 Appendix2<br />
Geokjemikart fra Nordkinnhalvøya<br />
Geochemical maps from the Nordkinn Peninsula<br />
56
<strong>NGU</strong> Rapport 2012.015 | <strong>NGU</strong> Report 2012.016 Appendix2<br />
Geokjemikart fra Nordkinnhalvøya<br />
Geochemical maps from the Nordkinn Peninsula<br />
57
<strong>NGU</strong> Rapport 2012.015 | <strong>NGU</strong> Report 2012.016 Appendix2<br />
Geokjemikart fra Nordkinnhalvøya<br />
Geochemical maps from the Nordkinn Peninsula<br />
58
<strong>NGU</strong> Rapport 2012.015 | <strong>NGU</strong> Report 2012.016 Appendix2<br />
Geokjemikart fra Nordkinnhalvøya<br />
Geochemical maps from the Nordkinn Peninsula<br />
59
<strong>NGU</strong> Rapport 2012.015 | <strong>NGU</strong> Report 2012.016 Appendix2<br />
Geokjemikart fra Nordkinnhalvøya<br />
Geochemical maps from the Nordkinn Peninsula<br />
60
<strong>NGU</strong> Rapport 2012.015 | <strong>NGU</strong> Report 2012.016 Appendix2<br />
Geokjemikart fra Nordkinnhalvøya<br />
Geochemical maps from the Nordkinn Peninsula<br />
61
<strong>NGU</strong> Rapport 2012.015 | <strong>NGU</strong> Report 2012.016 Appendix2<br />
Geokjemikart fra Nordkinnhalvøya<br />
Geochemical maps from the Nordkinn Peninsula<br />
62
<strong>NGU</strong> Rapport 2012.015 | <strong>NGU</strong> Report 2012.016 Appendix2<br />
Geokjemikart fra Nordkinnhalvøya<br />
Geochemical maps from the Nordkinn Peninsula<br />
63
<strong>NGU</strong> Rapport 2012.015 | <strong>NGU</strong> Report 2012.016 Appendix2<br />
Geokjemikart fra Nordkinnhalvøya<br />
Geochemical maps from the Nordkinn Peninsula<br />
64
<strong>NGU</strong> Rapport 2012.015 | <strong>NGU</strong> Report 2012.016 Appendix2<br />
Geokjemikart fra Nordkinnhalvøya<br />
Geochemical maps from the Nordkinn Peninsula<br />
65
<strong>NGU</strong> Rapport 2012.015 | <strong>NGU</strong> Report 2012.016 Appendix2<br />
Geokjemikart fra Nordkinnhalvøya<br />
Geochemical maps from the Nordkinn Peninsula<br />
66
<strong>NGU</strong> Rapport 2012.015 | <strong>NGU</strong> Report 2012.016 Appendix2<br />
Geokjemikart fra Nordkinnhalvøya<br />
Geochemical maps from the Nordkinn Peninsula<br />
67
<strong>NGU</strong> Rapport 2012.015 | <strong>NGU</strong> Report 2012.016 Appendix2<br />
Geokjemikart fra Nordkinnhalvøya<br />
Geochemical maps from the Nordkinn Peninsula<br />
68
<strong>NGU</strong> Rapport 2012.015 | <strong>NGU</strong> Report 2012.016 Appendix2<br />
Geokjemikart fra Nordkinnhalvøya<br />
Geochemical maps from the Nordkinn Peninsula<br />
69
<strong>NGU</strong> Rapport 2012.015 | <strong>NGU</strong> Report 2012.016 Appendix2<br />
Geokjemikart fra Nordkinnhalvøya<br />
Geochemical maps from the Nordkinn Peninsula<br />
70
<strong>NGU</strong> Rapport 2012.015 | <strong>NGU</strong> Report 2012.016 Appendix2<br />
Geokjemikart fra Nordkinnhalvøya<br />
Geochemical maps from the Nordkinn Peninsula<br />
71
<strong>NGU</strong> Rapport 2012.015 | <strong>NGU</strong> Report 2012.016 Appendix2<br />
Geokjemikart fra Nordkinnhalvøya<br />
Geochemical maps from the Nordkinn Peninsula<br />
72
<strong>NGU</strong> Rapport 2012.015 | <strong>NGU</strong> Report 2012.016 Appendix2<br />
Geokjemikart fra Nordkinnhalvøya<br />
Geochemical maps from the Nordkinn Peninsula<br />
73
<strong>NGU</strong> Rapport 2012.015 | <strong>NGU</strong> Report 2012.016 Appendix2<br />
Geokjemikart fra Nordkinnhalvøya<br />
Geochemical maps from the Nordkinn Peninsula<br />
74
<strong>NGU</strong> Rapport 2012.015 | <strong>NGU</strong> Report 2012.016 Appendix2<br />
Geokjemikart fra Nordkinnhalvøya<br />
Geochemical maps from the Nordkinn Peninsula<br />
75
<strong>NGU</strong> Rapport 2012.015 | <strong>NGU</strong> Report 2012.016 Appendix2<br />
Geokjemikart fra Nordkinnhalvøya<br />
Geochemical maps from the Nordkinn Peninsula<br />
76
<strong>NGU</strong> Rapport 2012.015 | <strong>NGU</strong> Report 2012.016 Appendix2<br />
Geokjemikart fra Nordkinnhalvøya<br />
Geochemical maps from the Nordkinn Peninsula<br />
77
<strong>NGU</strong> Rapport 2012.015 | <strong>NGU</strong> Report 2012.016 Appendix2<br />
Geokjemikart fra Nordkinnhalvøya<br />
Geochemical maps from the Nordkinn Peninsula<br />
78
<strong>NGU</strong> Rapport 2012.015 | <strong>NGU</strong> Report 2012.016 Appendix2<br />
Geokjemikart fra Nordkinnhalvøya<br />
Geochemical maps from the Nordkinn Peninsula<br />
79
<strong>NGU</strong> Rapport 2012.015 | <strong>NGU</strong> Report 2012.016 Appendix2<br />
Geokjemikart fra Nordkinnhalvøya<br />
Geochemical maps from the Nordkinn Peninsula<br />
80
<strong>NGU</strong> Rapport 2012.015 | <strong>NGU</strong> Report 2012.016 Appendix2<br />
Geokjemikart fra Nordkinnhalvøya<br />
Geochemical maps from the Nordkinn Peninsula<br />
81
<strong>NGU</strong> Rapport 2012.015 | <strong>NGU</strong> Report 2012.016 Appendix2<br />
Geokjemikart fra Nordkinnhalvøya<br />
Geochemical maps from the Nordkinn Peninsula<br />
82
<strong>NGU</strong> Rapport 2012.015 | <strong>NGU</strong> Report 2012.016 Appendix2<br />
Geokjemikart fra Nordkinnhalvøya<br />
Geochemical maps from the Nordkinn Peninsula<br />
83
<strong>NGU</strong> Rapport 2012.015 | <strong>NGU</strong> Report 2012.016 Appendix2<br />
Geokjemikart fra Nordkinnhalvøya<br />
Geochemical maps from the Nordkinn Peninsula<br />
84
<strong>NGU</strong> Rapport 2012.015 | <strong>NGU</strong> Report 2012.016 Appendix2<br />
Geokjemikart fra Nordkinnhalvøya<br />
Geochemical maps from the Nordkinn Peninsula<br />
85
<strong>NGU</strong> Rapport 2012.015 | <strong>NGU</strong> Report 2012.016 Appendix2<br />
Geokjemikart fra Nordkinnhalvøya<br />
Geochemical maps from the Nordkinn Peninsula<br />
86
<strong>NGU</strong> Rapport 2012.015 | <strong>NGU</strong> Report 2012.016 Appendix2<br />
Geokjemikart fra Nordkinnhalvøya<br />
Geochemical maps from the Nordkinn Peninsula<br />
87
<strong>NGU</strong> Rapport 2012.015 | <strong>NGU</strong> Report 2012.016 Appendix2<br />
Geokjemikart fra Nordkinnhalvøya<br />
Geochemical maps from the Nordkinn Peninsula<br />
88
<strong>NGU</strong> Rapport 2012.015 | <strong>NGU</strong> Report 2012.016 Appendix2<br />
Geokjemikart fra Nordkinnhalvøya<br />
Geochemical maps from the Nordkinn Peninsula<br />
89
<strong>NGU</strong> Rapport 2012.015 | <strong>NGU</strong> Report 2012.016 Appendix2<br />
Geokjemikart fra Nordkinnhalvøya<br />
Geochemical maps from the Nordkinn Peninsula<br />
90
<strong>NGU</strong> Rapport 2012.015 | <strong>NGU</strong> Report 2012.016 Appendix2<br />
Geokjemikart fra Nordkinnhalvøya<br />
Geochemical maps from the Nordkinn Peninsula<br />
91
<strong>NGU</strong> Rapport 2012.015 | <strong>NGU</strong> Report 2012.016 Appendix2<br />
Geokjemikart fra Nordkinnhalvøya<br />
Geochemical maps from the Nordkinn Peninsula<br />
92
<strong>NGU</strong> Rapport 2012.015 | <strong>NGU</strong> Report 2012.016 Appendix2<br />
Geokjemikart fra Nordkinnhalvøya<br />
Geochemical maps from the Nordkinn Peninsula<br />
93
<strong>NGU</strong> Rapport 2012.015 | <strong>NGU</strong> Report 2012.016 Appendix2<br />
Geokjemikart fra Nordkinnhalvøya<br />
Geochemical maps from the Nordkinn Peninsula<br />
94
<strong>NGU</strong> Rapport 2012.015 | <strong>NGU</strong> Report 2012.016 Appendix2<br />
Geokjemikart fra Nordkinnhalvøya<br />
Geochemical maps from the Nordkinn Peninsula<br />
95