The State of African Americans in Kentucky

Create successful ePaper yourself
Turn your PDF publications into a flip-book with our unique Google optimized e-Paper software.
<strong>Kentucky</strong> Commission on Human Rights<br />
<strong>The</strong> <strong>State</strong> <strong>of</strong><br />
<strong>African</strong><br />
<strong>Americans</strong><br />
In <strong>Kentucky</strong><br />
February 2009
2 | P age
<strong>The</strong> Board <strong>of</strong> Commissioners<br />
• Chair George W. St<strong>in</strong>son<br />
4th Supreme Court District,<br />
Louisville<br />
• Robert Asseo<br />
6th Supreme Court District,<br />
Cov<strong>in</strong>gton<br />
• Duane Bonifer<br />
3rd Supreme Court District,<br />
Greensburg<br />
• Virg<strong>in</strong>ia Burton<br />
<strong>State</strong>-at-Large, Lex<strong>in</strong>gton<br />
• Samuel R. Coleman<br />
<strong>State</strong>-at-Large, Middlesboro<br />
• Henry Curtis<br />
5th Supreme Court District,<br />
Frankfort<br />
• V. Ann Newman<br />
7th Supreme Court District,<br />
Ashland<br />
• Robert Peters<br />
<strong>State</strong>-at-Large, Lex<strong>in</strong>gton<br />
• Alma Randolph<br />
2nd Supreme Court District,<br />
Owensboro<br />
• George McDade Staples<br />
<strong>State</strong>-at-Large, P<strong>in</strong>eville<br />
• Timothy W. Thomas<br />
1st Supreme Court District,<br />
Madisonville<br />
John J. Johnson<br />
Executive Director<br />
<strong>Kentucky</strong> Commission on Human Rights<br />
332 W. Broadway, Suite 700, Louisville, <strong>Kentucky</strong> 40202<br />
Phone: 502-595-4024 Toll-Free: 800-292-5566<br />
TDD: 502-595-4084 Fax: 502-595-4801<br />
Email: kchr.mail@ky.gov<br />
Website: www.kchr.ky.gov<br />
3 | P age
Table <strong>of</strong> Contents<br />
Introduction ............................................................................................................................................................... 5<br />
<strong>African</strong> American Demographics <strong>in</strong> <strong>Kentucky</strong> ........................................................................................................... 6<br />
Population, Sex and Age ........................................................................................................................................ 6<br />
Nativity and Geographic Mobility .......................................................................................................................... 7<br />
Education ................................................................................................................................................................... 7<br />
Number <strong>of</strong> Students .............................................................................................................................................. 7<br />
Student’s Level <strong>of</strong> Education ................................................................................................................................. 7<br />
Student’s Educational Atta<strong>in</strong>ment ........................................................................................................................ 8<br />
Dropout Rate ......................................................................................................................................................... 8<br />
ACT Preparedness .................................................................................................................................................. 9<br />
<strong>African</strong> American Teachers .................................................................................................................................... 9<br />
Geographical Concentration <strong>of</strong> <strong>African</strong> American Students ............................................................................... 10<br />
<strong>African</strong> <strong>Americans</strong> and Educational Representation ........................................................................................... 11<br />
Case Study <strong>of</strong> Jefferson County District .............................................................................................................. 11<br />
Achievement Gap ................................................................................................................................................ 11<br />
<strong>The</strong> Civil Rights Project Research ........................................................................................................................ 12<br />
<strong>African</strong> American Socio‐economic Status ................................................................................................................ 13<br />
Per Capita Income ............................................................................................................................................... 13<br />
Poverty Level ....................................................................................................................................................... 14<br />
Hous<strong>in</strong>g ................................................................................................................................................................ 15<br />
Children’s Welfare ............................................................................................................................................... 16<br />
<strong>African</strong> American‐Owned Bus<strong>in</strong>esses .................................................................................................................. 16<br />
Hate Incidents .......................................................................................................................................................... 19<br />
<strong>African</strong> <strong>Americans</strong> and the Crim<strong>in</strong>al Justice System ................................................................................................ 20<br />
<strong>African</strong> American and Elected Positions .................................................................................................................. 21<br />
Conclusion ............................................................................................................................................................... 23<br />
4 | P age
Introduction<br />
It has been said that <strong>African</strong> American Heritage Month is not only a time for celebration, but also a time for<br />
reflection and change. It is a period to recall the stony road <strong>African</strong> <strong>Americans</strong> have trod; it is a period to assess the<br />
state <strong>of</strong> current affairs and to plot a course to make positive changes.<br />
Black History Month began <strong>in</strong> 1926 as Negro History Week by Dr. Carter G. Woodson, as a way to br<strong>in</strong>g attention<br />
to the positive contributions <strong>of</strong> black people <strong>in</strong> American history. Woodson's achievements alone are <strong>of</strong> great<br />
historical value. <strong>The</strong> son <strong>of</strong> former slaves, Woodson worked <strong>in</strong> the <strong>Kentucky</strong> coal m<strong>in</strong>es to put himself through<br />
high school. He graduated from Berea College <strong>in</strong> <strong>Kentucky</strong> <strong>in</strong> 1903 and then went on to Harvard for his Ph.D. In<br />
1926, Woodson began promot<strong>in</strong>g the second week <strong>of</strong> February as Negro History Week. In 1976, it became the<br />
United <strong>State</strong>s Black History Month. Woodson selected February because it co<strong>in</strong>cided with the birthdays <strong>of</strong><br />
Abraham L<strong>in</strong>coln and Frederick Douglas.<br />
A century later, the struggle for fairness and equality still exists at all levels <strong>of</strong> our society despite the great progress<br />
and achievements our state and nation have made.<br />
While <strong>African</strong> <strong>Americans</strong> rema<strong>in</strong> the largest m<strong>in</strong>ority <strong>in</strong> <strong>Kentucky</strong>, they also rema<strong>in</strong> the people with some <strong>of</strong> the<br />
greatest disadvantages <strong>in</strong> the socio-economic structure. <strong>The</strong>y still l<strong>in</strong>ger <strong>in</strong> educational atta<strong>in</strong>ments; have<br />
<strong>in</strong>ord<strong>in</strong>ate and high poverty levels; face racial disparity <strong>in</strong> the crim<strong>in</strong>al justice system; and are underrepresented <strong>in</strong><br />
many elected and appo<strong>in</strong>ted positions. Our state and national communities need improvements <strong>in</strong> policies and<br />
practices <strong>in</strong> ways that will result <strong>in</strong> a more equal society <strong>in</strong> the areas <strong>of</strong> bus<strong>in</strong>ess and employment, education,<br />
hous<strong>in</strong>g, f<strong>in</strong>ancial transactions, healthcare and help-related fund<strong>in</strong>g.<br />
<strong>The</strong> effects <strong>of</strong> long <strong>in</strong>stitutional racism may seem almost as great as the achievement <strong>of</strong> the Civil Rights<br />
Movement, but we can cont<strong>in</strong>ue to help wipe out rema<strong>in</strong><strong>in</strong>g vestiges <strong>of</strong> the past practices <strong>of</strong> segregation and the<br />
double standards <strong>of</strong> discrim<strong>in</strong>ation.<br />
<strong>Kentucky</strong> strives to be a state where equality and equal opportunity are not just ideas, but are way <strong>of</strong> life. We agree<br />
with Governor Steve Beshear’s statement, ‘‘It is time that racism <strong>in</strong> <strong>Kentucky</strong> be relegated to where it belongs; as a<br />
sad footnote <strong>in</strong> <strong>Kentucky</strong> history.’’<br />
5 | P age
<strong>African</strong> American Demographics <strong>in</strong> <strong>Kentucky</strong><br />
Population, Sex and Age<br />
Accord<strong>in</strong>g to 2005-2007 American Community Survey (Census Bureau), the population <strong>of</strong> <strong>Kentucky</strong> is<br />
4,206,074. 1<br />
M<strong>in</strong>orities consist <strong>of</strong> 11.7% <strong>of</strong> <strong>Kentucky</strong>’s total population<br />
<strong>African</strong> American 7.5%<br />
American Indians/Alaskans 0.2%<br />
Asian 1%<br />
Two races 1%<br />
Hispanic 2%<br />
<strong>African</strong> <strong>Americans</strong> are the largest m<strong>in</strong>ority <strong>in</strong> <strong>Kentucky</strong>.<br />
<strong>The</strong>re are 317,653 <strong>African</strong> <strong>Americans</strong> <strong>in</strong> <strong>Kentucky</strong>:<br />
Female: 163,033 or 51.3%<br />
Male: 154,620 or 48.7%<br />
Female between 18 and 34 years: 40,515 or 24.8%<br />
Female between 35 and 64 years: 60,595 or 37.1%<br />
Male between 18 and 34 years: 40,992 or 26.5%<br />
Male between 35 and 64 years: 55,676 or 36%<br />
Nearly 60% <strong>of</strong> <strong>African</strong> <strong>Americans</strong> are concentrated <strong>in</strong> Jefferson and Fayette Counties:<br />
Jefferson County: 145,179 or 46.1%<br />
Fayette County: 40,140 or 12.8%<br />
Christian County: 18,426 or 5.89%<br />
Hard<strong>in</strong> County: 11,860 or 3.79%<br />
Warren County: 9,405 or 3.01%<br />
Kenton County: 8,133 or 2.6%<br />
McCracken County: 7,511 or 2.4%<br />
Frankl<strong>in</strong> County: 5,356 or 1.71%<br />
Daviess County: 4,985 or 1.59%<br />
1 2005-2007 American Community Survey 3-Year Estimates. Hhttp://quickfacts.census.gov/qfd/states/21000.htmlH<br />
6 | P age
Nativity and Geographic Mobility<br />
73.8% <strong>of</strong> <strong>African</strong> <strong>Americans</strong> are born <strong>in</strong> the state <strong>of</strong> <strong>Kentucky</strong><br />
23.2% <strong>of</strong> <strong>African</strong> <strong>Americans</strong> are born <strong>in</strong> a state other than <strong>Kentucky</strong><br />
2.16% <strong>of</strong> <strong>African</strong> <strong>Americans</strong> are foreign born<br />
76.2% <strong>of</strong> <strong>African</strong> <strong>Americans</strong> lived <strong>in</strong> the same house 1 year ago<br />
15.25% <strong>of</strong> <strong>African</strong> <strong>Americans</strong> moved with<strong>in</strong> the same county<br />
3.72% <strong>of</strong> <strong>African</strong> <strong>Americans</strong> moved from different county with<strong>in</strong> the same state<br />
4.32% <strong>of</strong> <strong>African</strong> <strong>Americans</strong> moved from a different state<br />
Education<br />
Number <strong>of</strong> Students<br />
Dur<strong>in</strong>g the 2006-07-school year, there were 668,337 students <strong>in</strong> all <strong>Kentucky</strong>’s public schools, accord<strong>in</strong>g to the<br />
<strong>Kentucky</strong> Department <strong>of</strong> Education.<br />
White -- 84.2%<br />
<strong>African</strong> American -- 10.6%<br />
Hispanic -- 2%<br />
Asian -- less than 1%<br />
Native American -- less than 1%<br />
Other -- 1.7%<br />
Student’s Level <strong>of</strong> Education<br />
For the same school year, there were 100,752 <strong>African</strong> <strong>Americans</strong> enrolled <strong>in</strong> all education <strong>in</strong>stitutions <strong>in</strong><br />
<strong>Kentucky</strong>, accord<strong>in</strong>g to the Census Bureau data.<br />
Enrolled <strong>in</strong> nursery and k<strong>in</strong>dergarten: 11,864 or 11.7%<br />
Enrolled <strong>in</strong> grade 1 to grade 8: 41,186 or 40.8%<br />
Enrolled <strong>in</strong> grade 9 to grade 12: 23,619 or 23.4%<br />
Enrolled <strong>in</strong> college or graduate school: 24,083 or 24%<br />
7 | P age
Student’s Educational Atta<strong>in</strong>ment<br />
Out <strong>of</strong> the 186,256 <strong>African</strong> <strong>Americans</strong> who were 25 years <strong>of</strong> age and over (2007 Census data):<br />
Educational atta<strong>in</strong>ment less than 9 th grade: 5% (46.4% male, 53.6% female)<br />
9 th to 12 th grade with no diploma: 16% (48.3% male, 51.7% female)<br />
High school graduate (<strong>in</strong>clud<strong>in</strong>g equivalency): 36% (48.4% male, 51.6% female)<br />
Some college and no degree: 23.6% (44% male, 56% female)<br />
Associate’s degree: 7% (42% male, 58% female)<br />
Bachelor’s degree: 8.5% (47% male, 53% female); the percentage for the White population is 12%<br />
Graduate degree: 4% (42% male, 58% female); the percentage for the White population is 8%<br />
Dropout Rate<br />
<strong>The</strong> state dropout rate for academic year 2006-2007 is 3.17%.<br />
<strong>The</strong> <strong>African</strong> American dropout rate cont<strong>in</strong>ues to be greater than that <strong>of</strong> the White dropout rate.<br />
<strong>The</strong> White dropout rate slightly decreased from 3.22% <strong>in</strong> 2004 to 3.21% <strong>in</strong> 2005.<br />
<strong>The</strong> <strong>African</strong> American dropout rate <strong>in</strong>creased from 4.56% <strong>in</strong> 2004 to 5.92% <strong>in</strong> 2005.<br />
<strong>Kentucky</strong> Dropout Rate By Race<br />
1999-2005 - Grades 7-12<br />
Year <strong>African</strong> American White<br />
1999 7.00% 4.81%<br />
2000 7.81% 4.84%<br />
2001 6.95% 4.53%<br />
2002 5.61% 3.81%<br />
2003 4.45% 3.23%<br />
2004 4.56% 3.22%<br />
2005 5.92% 3.21%<br />
8 | P age
ACT Preparedness<br />
Accord<strong>in</strong>g to the ACT <strong>State</strong> Test Pr<strong>of</strong>ile Report 2 prepared by the <strong>Kentucky</strong> Department <strong>of</strong> Education, which<br />
provides <strong>in</strong>formation about the performance <strong>of</strong> public high school students who took the ACT as juniors <strong>in</strong> Spr<strong>in</strong>g<br />
2008, only 10% met all four ACT College Read<strong>in</strong>ess Benchmark Scores (English, Read<strong>in</strong>g, Math, and Science).<br />
However, break<strong>in</strong>g this percentage along the racial/ethnic l<strong>in</strong>e, <strong>African</strong> <strong>Americans</strong> ranked the lowest, with only 2%<br />
who met the ACT College Read<strong>in</strong>ess Benchmark Scores.<br />
100<br />
90<br />
80<br />
70<br />
60<br />
50<br />
40<br />
30<br />
20<br />
10<br />
0<br />
Percent <strong>of</strong> Students Meet<strong>in</strong>g ACT College Read<strong>in</strong>ess<br />
Benchmark Scores by Race/Ethnicity 2008: All Four<br />
(English, Math, Science, & Read<strong>in</strong>g)<br />
98 98<br />
90<br />
95<br />
88<br />
78<br />
10<br />
2 2<br />
12<br />
5<br />
22<br />
% Ready<br />
% Not Rready<br />
<strong>African</strong> American Teachers<br />
<strong>The</strong>re is a severe shortage <strong>of</strong> m<strong>in</strong>ority teachers <strong>in</strong><br />
<strong>Kentucky</strong>’s public schools. <strong>Kentucky</strong> has only 4.5% <strong>of</strong><br />
m<strong>in</strong>ority teachers <strong>in</strong> proportion to 13% <strong>of</strong> m<strong>in</strong>ority<br />
students. Furthermore, <strong>in</strong> the 1953-54-school year,<br />
6.8% <strong>of</strong> the teachers were <strong>African</strong> American, and <strong>in</strong> the<br />
2007-08 school year, that percentage dropped to 3.7%. 3<br />
In other words, there were more <strong>African</strong> American<br />
teachers <strong>in</strong> the 1950s than <strong>in</strong> 2007 <strong>in</strong> proportion to<br />
White teachers.<br />
100%<br />
80%<br />
60%<br />
40%<br />
20%<br />
0%<br />
Educators <strong>in</strong> <strong>Kentucky</strong>'s Public Schools for<br />
2007‐08<br />
White<br />
95.81%<br />
M<strong>in</strong>ority<br />
4.50%<br />
Educators<br />
2 Hhttp://www.kde.state.ky.us/KDE/Adm<strong>in</strong>istrative+Resources/Test<strong>in</strong>g+and+Report<strong>in</strong>g+/Reports/H<br />
3 M<strong>in</strong>ority Educators <strong>in</strong> <strong>Kentucky</strong>’s Public Schools, KCHR Publication. Report can be found at: http://kchr.ky.gov/reports/reports.htm<br />
9 | P age
<strong>The</strong> 4.5% <strong>of</strong> m<strong>in</strong>ority educators is<br />
composed <strong>of</strong>:<br />
• 3.7% <strong>African</strong> American<br />
• 0.4% Asian<br />
• 0.2% American Indian<br />
• 0.03% Hispanic<br />
• 0.1% Other<br />
45,000<br />
40,000<br />
35,000<br />
30,000<br />
25,000<br />
20,000<br />
15,000<br />
10,000<br />
5,000<br />
0<br />
Number <strong>of</strong> Black and White Teachers Employed by<br />
<strong>Kentucky</strong> Public Schools 1953‐54 Through 2007‐08<br />
41,734<br />
96.32%<br />
34,166<br />
95.87%<br />
17,534<br />
93.19%<br />
1,281<br />
6.8%<br />
1,471<br />
4.1%<br />
1953‐54 1987‐88 2007‐08<br />
1,595<br />
3.7%<br />
White<br />
Black<br />
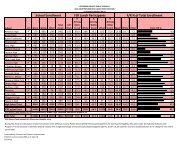
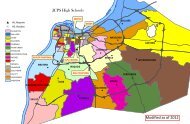
Geographical Concentration <strong>of</strong> <strong>African</strong> American Students<br />
Nearly 80% <strong>of</strong> all <strong>African</strong> American students enrolled <strong>in</strong> <strong>Kentucky</strong>’s public schools are concentrated <strong>in</strong> just 12 <strong>of</strong><br />
the state’s 174 school districts. <strong>The</strong> twelve school districts with the largest number <strong>of</strong> <strong>African</strong> American students<br />
were, <strong>in</strong> order <strong>of</strong> total enrollment: Jefferson, Fayette, Christian, Hard<strong>in</strong>, Paducah, Warren, Cov<strong>in</strong>gton, Bowl<strong>in</strong>g<br />
Green, Hopk<strong>in</strong>s, Henderson, Owensboro, and Shelby.<br />
Percentage <strong>of</strong> <strong>African</strong> American Students by Total Enrollment<br />
2006‐2007‐School Year<br />
50% 48.5%<br />
40%<br />
30%<br />
20% 11.8%<br />
10%<br />
4.6% 3.4% 2.1% 1.6% 1.6% 1.1% 1.1% 1.0% 0.9% 0.9%<br />
0%<br />
10 | P age
<strong>African</strong> <strong>Americans</strong> and Educational Representation<br />
<strong>The</strong>re are 174 school districts <strong>in</strong> <strong>Kentucky</strong> run by 33 female super<strong>in</strong>tendents and 141 male super<strong>in</strong>tendents; there<br />
is only one m<strong>in</strong>ority super<strong>in</strong>tendent.<br />
<strong>The</strong> <strong>Kentucky</strong> School Boards Association (KSBA) is a nonpr<strong>of</strong>it corporation <strong>of</strong> school boards from each public<br />
school district <strong>in</strong> <strong>Kentucky</strong>. It is governed by a 27-member board <strong>of</strong> directors made up <strong>of</strong> representatives elected as<br />
regional chairpersons or as directors-at-large. 4 <strong>The</strong>re are three <strong>African</strong> <strong>Americans</strong> serv<strong>in</strong>g <strong>in</strong> the board <strong>of</strong> directors.<br />
With nearly 900 members, KSBA is the largest organization <strong>of</strong> elected <strong>of</strong>ficials <strong>in</strong> <strong>Kentucky</strong>. <strong>The</strong>re are 810 White<br />
(93%), 35 m<strong>in</strong>orities (4%) and 28 not reported (3%). 5<br />
Case Study <strong>of</strong> Jefferson County District<br />
In a 2008 study conducted by Richard G. Innes, ‘‘How Whites and <strong>African</strong> <strong>Americans</strong> Perform In Jefferson County<br />
Public Schools,’’ 6 he concludes that dur<strong>in</strong>g the 18 years s<strong>in</strong>ce KERA’s (<strong>Kentucky</strong> Education Reform Act)<br />
enactment, serious questions have arisen regard<strong>in</strong>g the performance <strong>of</strong> <strong>Kentucky</strong>’s public schools <strong>in</strong> meet<strong>in</strong>g that<br />
goal for all children, especially <strong>African</strong> American students. <strong>The</strong> Jefferson County district holds the state’s largest<br />
number <strong>of</strong> <strong>African</strong> American students, that is, 48.5%.<br />
<strong>The</strong> study shows:<br />
• <strong>African</strong> <strong>Americans</strong> rema<strong>in</strong> well beh<strong>in</strong>d academically <strong>in</strong> the key subjects <strong>of</strong> read<strong>in</strong>g and mathematics. In a<br />
significant number <strong>of</strong> Jefferson County schools -- 47 out <strong>of</strong> the 120 schools with usable data on read<strong>in</strong>g<br />
and 44 out <strong>of</strong> 120 for math -- the gap between White and <strong>African</strong> American students is widen<strong>in</strong>g.<br />
• Graduation rates rema<strong>in</strong> extremely low for significant numbers <strong>of</strong> <strong>African</strong> <strong>Americans</strong> -- especially <strong>African</strong><br />
American males -- <strong>in</strong> the majority <strong>of</strong> Louisville’s public high schools. <strong>African</strong> American males <strong>in</strong> only three<br />
<strong>of</strong> the 19 high schools <strong>in</strong> the study had graduation rates equal to or greater than the statewide graduation<br />
rate for all students. <strong>The</strong> graduation rate also is low for <strong>African</strong> American females and even for White<br />
students <strong>in</strong> these 19 schools. Two <strong>of</strong> these schools reported abysmal graduation rates <strong>of</strong> less than 60%.<br />
Efforts to improve education, especially for <strong>African</strong> American students, have failed to produce anyth<strong>in</strong>g close to<br />
acceptable results <strong>in</strong> Jefferson County. <strong>The</strong> cont<strong>in</strong>ued poor performance discussed <strong>in</strong> the report shows the need<br />
for aggressive action. 7<br />
Achievement Gap<br />
In 2006, the <strong>Kentucky</strong> Advisory Committee to the U.S. Commission on Civil Rights <strong>in</strong> its report, ‘‘Equal<br />
Education Opportunity: An Analysis <strong>of</strong> the Racial Achievement Gap <strong>in</strong> <strong>Kentucky</strong> Urban Schools,’’ <strong>in</strong>dicated that<br />
‘‘a large and persistent achievement gap between <strong>African</strong> American students and their peers is a national<br />
phenomenon, and such a phenomenon is also present <strong>in</strong> the Commonwealth <strong>of</strong> <strong>Kentucky</strong>. This situation has been<br />
part <strong>of</strong> the education landscape for decades, and no real headway has been made to close this gap despite<br />
legislation at both state and federal levels. Though most likely the <strong>in</strong>terplay <strong>of</strong> a number <strong>of</strong> factors, the <strong>Kentucky</strong><br />
4 Hhttp://www.ksba.org/bodH<br />
5 Hhttp://www.kde.sta ageRepository/News+Room/<strong>Kentucky</strong>+Education+Facts.htm<br />
6 Hhttp://bipps.org/pubs/2008/policypo<strong>in</strong>t102008.pdfH<br />
7 ibi<br />
11 | P age
Advisory Committee f<strong>in</strong>ds that regardless <strong>of</strong> other factors such as teacher quality, family structure, class size, or<br />
racial isolation, poverty matters and acts to impede academic achievement. This is not to say that ‘‘poor’’ children<br />
cannot learn, but rather that they are not learn<strong>in</strong>g at a satisfactory level <strong>in</strong> schools with high numbers <strong>of</strong> low<strong>in</strong>come<br />
children’’. 8<br />
<strong>The</strong> Civil Rights Project Research<br />
At the request <strong>of</strong> the <strong>Kentucky</strong> Council on Postsecondary Education, the Civil Rights Project, a lead<strong>in</strong>g<br />
organization devoted to civil rights research, conducted a research to assess what has been accomplished <strong>in</strong><br />
successfully diversify<strong>in</strong>g and desegregat<strong>in</strong>g historically segregated and unequal higher educational <strong>in</strong>stitutions<br />
across <strong>Kentucky</strong>. In September 2008, the research delivered the f<strong>in</strong>d<strong>in</strong>gs and asserted that ‘‘at the postsecondary<br />
level, affirmative admissions policy is a very important issue but there are many other dimensions that are <strong>in</strong>volved<br />
<strong>in</strong> truly open<strong>in</strong>g up a higher education system to all. <strong>The</strong>re is strong research show<strong>in</strong>g that students and families<br />
across the country from all racial and ethnic groups share high aspirations for college education, but that the<br />
pipel<strong>in</strong>es carry<strong>in</strong>g students from one level <strong>of</strong> education to another are dangerously leaky, especially for <strong>African</strong><br />
American and Lat<strong>in</strong>o students, and for students liv<strong>in</strong>g <strong>in</strong> long-term poverty. <strong>The</strong> <strong>Kentucky</strong> data show a massive<br />
loss <strong>of</strong> students before high school graduation, a relatively low enrollment <strong>in</strong> four-year colleges, a poor transfer rate<br />
from the community and technical colleges to the four-year campuses, and very serious loss <strong>of</strong> students who come<br />
to college but fail to graduate. In other words, the opportunity pipel<strong>in</strong>e has gigantic holes and <strong>Kentucky</strong> is loos<strong>in</strong>g<br />
much <strong>of</strong> its talent at a number <strong>of</strong> key transition po<strong>in</strong>ts. <strong>The</strong> leaks tend to be more serious for <strong>African</strong> American<br />
students, which compounds the <strong>in</strong>equalities. It is essential to understand where students are lost as they pass<br />
through the system and to consider strategies to repair the severe leakage.’’ 9<br />
8 ‘‘Equal Education Opportunity: An Analysis <strong>of</strong> the Racial Achievement Gap In <strong>Kentucky</strong> Urban Schools,’’ <strong>The</strong> <strong>Kentucky</strong> Advisory Committee To the<br />
U.S. Commission on Civil Rights. 2006. Hhttp://www.law.umaryland.edu/marshall/usccr/documents/cr1200613.pdfH<br />
9 ‘‘Build<strong>in</strong>g on Success: Educational Diversity and Equity <strong>in</strong> <strong>Kentucky</strong> Higher Education,’’ <strong>The</strong> Civil Rights Project. September 2008.<br />
Hhttp://www.civilrightsproject.ucla.edu/research/diversity/build<strong>in</strong>g_on_success_kt.pdfH<br />
12 | P age
<strong>African</strong> American Socioeconomic Status<br />
Per Capita Income<br />
In the past 12 months (<strong>in</strong> 2007 <strong>in</strong>flation-adjusted dollars), <strong>Kentucky</strong>’s per capita <strong>in</strong>come 10 (PCI) was $21,618;<br />
White PCI was $22,323 while the <strong>African</strong> American PCI was 46% less ($15,287), American Indian PCI was 27%<br />
less (17,599), and the Hispanic PCI was 57% less ($14,238).<br />
<strong>The</strong> follow<strong>in</strong>g counties represent more than 80% <strong>of</strong> the <strong>African</strong> American population <strong>in</strong> <strong>Kentucky</strong>.<br />
Jefferson County: $15,703 for <strong>African</strong> American and $28,654 for White<br />
Fayette County: $16,088 for <strong>African</strong> American and $30,377 for White<br />
Christian County: $12,815 for <strong>African</strong> American and $19,371 for White<br />
Hard<strong>in</strong> County: $20,083 for <strong>African</strong> American and $23,007 for White<br />
Warren County: $14,086 for <strong>African</strong> American and $24,629 for White<br />
Kenton County: $16,644 for <strong>African</strong> American and $26,924 for White<br />
McCracken County: $13,392 for <strong>African</strong> American and $24,828 for White<br />
Frankl<strong>in</strong> County: $15,796 for <strong>African</strong> American and $27,489 for White<br />
Daviess County: $12,559 for <strong>African</strong> American and $22,665 for White<br />
Per Capita Income <strong>in</strong> the Past 12 Months<br />
(<strong>in</strong> 2007 <strong>in</strong>flation‐adjusted dollars)<br />
<strong>State</strong> White <strong>African</strong> American<br />
Indiana $24,855 $16,131<br />
Ohio $25,746 $15,862<br />
Tennessee $24,904 $15,240<br />
West Virg<strong>in</strong>ia $20,321 $14,335<br />
10 Per capita <strong>in</strong>come means how much each <strong>in</strong>dividual receives, <strong>in</strong> monetary terms, <strong>of</strong> the yearly <strong>in</strong>come generated <strong>in</strong> the country. This is what each<br />
citizen is to receive if the yearly national <strong>in</strong>come is divided equally among everyone.<br />
13 | P age
Poverty Level<br />
<strong>The</strong> percentage <strong>of</strong> the population with <strong>in</strong>come below the poverty level <strong>in</strong> the past 12 months <strong>of</strong> 2007 <strong>in</strong> <strong>Kentucky</strong><br />
was 17%. This percentage is almost twice among m<strong>in</strong>orities. <strong>The</strong> number <strong>of</strong> <strong>African</strong> <strong>Americans</strong> with <strong>in</strong>come below<br />
the poverty level is 30% while the number <strong>of</strong> Whites with <strong>in</strong>come below the poverty level is 15%.<br />
2005‐2007 American Community Survey (Census Bureau)<br />
County White Income White Income<br />
<strong>African</strong> American<br />
Income<br />
<strong>African</strong> American<br />
Income<br />
Below Poverty Level Above Poverty Level Below Poverty Level Above Poverty Level<br />
Christian County 13.9% 86.1% 26.0% 74.0%<br />
Fayette County 12.7% 87.3% 30.4% 69.6%<br />
Frankl<strong>in</strong> County 12.9% 87.1% N/A N/A<br />
Hard<strong>in</strong> County 11.0% 89.0% N/A N/A<br />
Jefferson County 9.7% 90.3% 30.5% 69.5%<br />
Kenton County 9.3% 90.7% 37.0% 63.0%<br />
McCracken County 13.3% 86.7% 38.1% 61.9%<br />
Warren County 14.8% 85.2% 36.3% 63.7%<br />
Daviess 13.5% 86.5% N/A N/A<br />
In 2005, Laura Ungar <strong>in</strong> her article, ‘‘Poverty fuels medical crisis,’’ noticed that ‘‘poverty is the s<strong>in</strong>gle biggest reason<br />
<strong>Kentucky</strong> is one <strong>of</strong> America's sickest states. Although cities fare better overall than poor rural areas, poverty takes<br />
its toll there too, and m<strong>in</strong>ority residents bear the brunt. In Jefferson County and throughout the state, a far greater<br />
percentage <strong>of</strong> <strong>African</strong> American residents than White residents live <strong>in</strong> poverty ----- almost 30%. <strong>The</strong> figures for<br />
Whites are 15% <strong>in</strong> the state and 8% <strong>in</strong> Jefferson County. <strong>African</strong> <strong>Americans</strong> <strong>in</strong> Louisville also die 66% more <strong>of</strong>ten<br />
than Whites from stroke, 29% more <strong>of</strong>ten from heart disease and 25% more <strong>of</strong>ten from cancer. <strong>The</strong>se numbers<br />
reflect a national trend. Throughout the country, <strong>African</strong> <strong>Americans</strong> suffer from a greater burden <strong>of</strong> disease, from<br />
cardiovascular disease to cancer to diabetes to <strong>in</strong>fant mortality, said Stephen Thomas, director <strong>of</strong> the Center for<br />
M<strong>in</strong>ority Health at the University <strong>of</strong> Pittsburgh.’’ 11<br />
Furthermore, unequal economic opportunities among races become evident <strong>in</strong> poverty rates by racial group. In<br />
2005, child poverty rates <strong>in</strong> <strong>Kentucky</strong> were higher among groups that have experienced systemic lack <strong>of</strong> access to<br />
opportunities, at 30% for Hispanic/Lat<strong>in</strong>o children and 32% for <strong>African</strong> American children, compared to 21% for<br />
non-Hispanic White children. 12<br />
11 ‘‘Poverty fuels medical crisis’’ by Laura Ungar, Courier-Journal, September 25, 2005<br />
12 Data obta<strong>in</strong>ed from <strong>Kentucky</strong> Cab<strong>in</strong>et for Families and Children, July 2008, processed by <strong>Kentucky</strong> Population Research at the University <strong>of</strong><br />
Louisville Urban Studies Institute.<br />
14 | P age
Hous<strong>in</strong>g<br />
<strong>The</strong> average percentage <strong>of</strong> householders who own a home <strong>in</strong> <strong>Kentucky</strong> is 70.83%. This percentage drops sharply<br />
among m<strong>in</strong>orities; only 43.16% <strong>of</strong> <strong>African</strong> <strong>Americans</strong> own a home, 38% <strong>of</strong> Hispanics, and 58% <strong>of</strong> American<br />
Indians, compared to 73.67% <strong>of</strong> Whites who own homes.<br />
<strong>The</strong> Metropolitan Hous<strong>in</strong>g Coalition <strong>in</strong> Jefferson County <strong>in</strong> its 2008 Metropolitan Hous<strong>in</strong>g Report <strong>in</strong>dicated that<br />
the White population, which is 80% <strong>of</strong> Jefferson County, represents 86.8 % <strong>of</strong> all owner-occupied households.<br />
<strong>African</strong> <strong>Americans</strong> who represent 17% <strong>of</strong> the county’s total population account for only 11% <strong>of</strong> all owner-occupied<br />
hous<strong>in</strong>g units.<br />
When consider<strong>in</strong>g homeownership <strong>in</strong> terms <strong>of</strong> race, m<strong>in</strong>orities are at a much higher risk <strong>of</strong> receiv<strong>in</strong>g a poorly<br />
underwritten high-cost home loan. In addition, racial differences <strong>in</strong> lend<strong>in</strong>g <strong>in</strong>crease as <strong>in</strong>come levels <strong>in</strong>crease. In<br />
the Louisville Metropolitan Statistical Area (MSA), low and moderate-<strong>in</strong>come (LMI) <strong>African</strong> <strong>Americans</strong> are<br />
almost twice as likely to have sub-prime mortgages (51.4%) as LMI Whites (27.1%). Shock<strong>in</strong>gly, when<br />
consider<strong>in</strong>g middle and upper-<strong>in</strong>come (MUI) <strong>African</strong> <strong>Americans</strong> compared to Whites, the discrepancy is even<br />
more pronounced. For MUI <strong>African</strong> <strong>Americans</strong> <strong>in</strong> the Louisville MSA, 41.6 percent <strong>of</strong> mortgages are sub-prime<br />
compared to 17.5 percent for MUI Whites (National Community Re<strong>in</strong>vestment Coalition, 2008). High-cost loans<br />
are <strong>in</strong>tended to compensate for additional risk to lenders when the borrower has credit imperfections. This results<br />
<strong>in</strong> a loss <strong>of</strong> home equity because <strong>of</strong> higher payments made to lenders, as well as exposure to imprudent types <strong>of</strong><br />
loans that are more likely to result <strong>in</strong> default and foreclosure. 13<br />
2005‐2007 American Community Survey (Census Bureau)<br />
County<br />
White<br />
Owner<br />
White<br />
Renter<br />
<strong>African</strong><br />
American<br />
Owner<br />
<strong>African</strong><br />
American<br />
Renter<br />
Christian County 66.7% 33.3% 35.1% 64.9%<br />
Fayette County 63.5% 36.5% 41.9% 58.1%<br />
Frankl<strong>in</strong> County 69.8% 30.2% 43.4% 56.6%<br />
Hard<strong>in</strong> County 70.5% 29.5% 49.0% 51.0%<br />
Jefferson County 74.0% 26.0% 40.0% 60.0%<br />
Kenton County 72.5% 27.5% 28.2% 71.8%<br />
McCracken County 73.4% 26.6% 37.9% 62.1%<br />
Warren County 66.7% 33.3% 38.1% 61.9%<br />
Daviess County 72.1% 27.9% 35.7% 64.3%<br />
13 Metropolitan Hous<strong>in</strong>g Coalition, ‘‘<strong>State</strong> <strong>of</strong> Metropolitan Hous<strong>in</strong>g Report 2008’’. Hhttp://www.metropolitanhous<strong>in</strong>g.orgH<br />
15 | P age
Children’s Welfare<br />
Nationally, <strong>African</strong> American children are overrepresented <strong>in</strong> child protective services from referral to placement<br />
<strong>in</strong> foster care. <strong>African</strong> American children and families are also treated differently; reports <strong>of</strong> abuse are more <strong>of</strong>ten<br />
substantiated and children spend longer times <strong>in</strong> foster care, for example.<br />
<strong>Kentucky</strong> collaborated with the Annie E. Casey Foundation <strong>in</strong> August 2005 to understand and address this<br />
overrepresentation and disparate treatment. Accord<strong>in</strong>g to the <strong>Kentucky</strong> Cab<strong>in</strong>et for Health and Family Services,<br />
Department for Community Based Services 14 :<br />
• <strong>African</strong> American children and families are referred by the community for child abuse and neglect at twice the<br />
rates that would be expected based on census data.<br />
• Abuse is substantiated at higher rates (28%) for <strong>African</strong> American families compared to 24% for White<br />
families.<br />
• <strong>African</strong> American children are <strong>in</strong> foster care at 2.5 times the rates expected based on census data.<br />
• <strong>African</strong> American children spend more time <strong>in</strong> foster care, have more moves <strong>in</strong> foster care and are 20% less<br />
likely to be reunified with their parents.<br />
Furthermore, when look<strong>in</strong>g at figures from the Child Welfare System, <strong>African</strong> American children make up 43% <strong>of</strong><br />
the total amount <strong>of</strong> children <strong>in</strong> out-<strong>of</strong>-home-care (datasource: TWS 058 - January, 2007). <strong>African</strong> American<br />
children <strong>in</strong> Jefferson County are over-represented <strong>in</strong> out-<strong>of</strong>-home care at a rate 2.8 times what is expected based<br />
on their representation <strong>in</strong> the census population.<br />
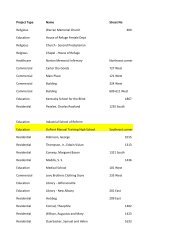
<strong>African</strong> AmericanOwned Bus<strong>in</strong>esses<br />
Accord<strong>in</strong>g to the <strong>Kentucky</strong> Cab<strong>in</strong>et for Economic<br />
Development 2006 <strong>Kentucky</strong> M<strong>in</strong>ority-Owned<br />
Bus<strong>in</strong>esses report: Of the m<strong>in</strong>ority groups, there were<br />
more firms owned by <strong>African</strong> <strong>Americans</strong> than any other<br />
m<strong>in</strong>ority group. <strong>The</strong>re were 5,629 firms owned by<br />
<strong>African</strong> <strong>Americans</strong>. <strong>The</strong>se firms employed over 7,700<br />
people, and they had over $650 million <strong>in</strong> sales and<br />
receipts. A majority <strong>of</strong> the firms owned by <strong>African</strong><br />
<strong>Americans</strong> were <strong>in</strong> the Services <strong>in</strong>dustry. Even though<br />
Asian & Pacific Islander-owned firms accounted for<br />
only 20% <strong>of</strong> the m<strong>in</strong>ority-owned firms <strong>in</strong> <strong>Kentucky</strong>,<br />
sales receipts from Asian and Pacific Islander-owned<br />
firms accounted for over half <strong>of</strong> all the sales and receipts<br />
from m<strong>in</strong>ority-owned bus<strong>in</strong>esses. Sales and receipts<br />
from these firms totaled $1.29 billion, and they<br />
employed 11,843 people. Most <strong>of</strong> the firms owned by<br />
Asian and Pacific Islanders were <strong>in</strong> the Services<br />
<strong>in</strong>dustry.<br />
45%<br />
40%<br />
35%<br />
30%<br />
25%<br />
20%<br />
15%<br />
10%<br />
5%<br />
0%<br />
Distribution <strong>of</strong> M<strong>in</strong>ority‐Owned Firms by<br />
the Number <strong>of</strong> Firms<br />
44%<br />
<strong>African</strong><br />
American<br />
////<br />
12%<br />
24%<br />
Hispanic American<br />
Indian<br />
/<br />
20%<br />
Asian<br />
14 Hhttp://chfs.ky.gov/dcbs/raceandcommunity.htmH<br />
16 | P age
At the national level, the U.S. Small<br />
Bus<strong>in</strong>ess Adm<strong>in</strong>istration number <strong>of</strong> loans<br />
given to m<strong>in</strong>orities from 1980 to 2007<br />
followed a similar patter <strong>of</strong> growth, except<br />
for the Native American number, which<br />
rema<strong>in</strong>ed flat.<br />
<strong>The</strong> same pattern held <strong>in</strong> <strong>Kentucky</strong> for<br />
2008; Native Indians received only 4<br />
loans.<br />
Distribution <strong>of</strong> M<strong>in</strong>ority‐Owned Firms by Sales and<br />
Receipts<br />
60%<br />
52%<br />
50%<br />
40% 27%<br />
30%<br />
20%<br />
11% 10%<br />
10%<br />
0%<br />
<strong>African</strong> American Hispanic American Indian Asian<br />
18,000<br />
US Small Bus<strong>in</strong>ess Adm<strong>in</strong>istration Number <strong>of</strong> Loans to M<strong>in</strong>ority‐Owned Small Bus<strong>in</strong>esses<br />
1980‐2007<br />
Number <strong>of</strong> loans by US Adm<strong>in</strong>. Small Bus. Loans<br />
16,000<br />
14,000<br />
12,000<br />
10,000<br />
8,000<br />
6,000<br />
4,000<br />
2,000<br />
<strong>African</strong> American<br />
Asian American<br />
Hispanic American<br />
Native American<br />
0<br />
80 81 82 83 84 85 86 87 88 89 90 91 92 93 94 95 96 97 98 99 00 01 02 03 04 05 06 07<br />
US Small Bus<strong>in</strong>ess Adm<strong>in</strong>istration Number <strong>of</strong> Loans to<br />
M<strong>in</strong>ority‐Owned Small Bus<strong>in</strong>esses <strong>in</strong> <strong>Kentucky</strong><br />
2008<br />
500<br />
400<br />
300<br />
200<br />
100<br />
0<br />
4<br />
37 27 19<br />
51<br />
469<br />
17 | P age
However, the amounts <strong>of</strong> loans given to m<strong>in</strong>orities by the U.S. Small Bus<strong>in</strong>ess Adm<strong>in</strong>istration were not at the same<br />
rate. For the last decade, from 1997 to 2007, <strong>African</strong> <strong>Americans</strong> received an average <strong>of</strong> 53.6% less than Asians did,<br />
and 11.5% less than Hispanics. For 2008 <strong>in</strong> <strong>Kentucky</strong>, <strong>African</strong> <strong>Americans</strong> received 12% less than Asians did.<br />
American Indians received the lowest amount total<strong>in</strong>g to 2 million-dollars.<br />
Millions <strong>of</strong> Dollars given by US Adm<strong>in</strong> for Small Bus.<br />
5,000<br />
4,500<br />
4,000<br />
3,500<br />
3,000<br />
2,500<br />
2,000<br />
1,500<br />
1,000<br />
500<br />
0<br />
Small Bus<strong>in</strong>ess Adm<strong>in</strong>istration Amount <strong>of</strong> Loans to M<strong>in</strong>ority‐Owned Small Bus<strong>in</strong>esses Nationally<br />
1980 ‐ 2007<br />
80 81 82 83 84 85 86 87 88 89 90 91 92 93 94 95 96 97 98 99 00 01 02 03 04 05 06 07<br />
Year<br />
<strong>African</strong> American<br />
Asian American<br />
Hispanic American<br />
Native American<br />
US Small Bus<strong>in</strong>ess Adm<strong>in</strong>istration Amount <strong>of</strong> Loans to M<strong>in</strong>ority‐<br />
Owned Small Bus<strong>in</strong>esses <strong>in</strong> <strong>Kentucky</strong><br />
2008<br />
$80,000,000<br />
$70,000,000<br />
$60,000,000<br />
$50,000,000<br />
$40,000,000<br />
$30,000,000<br />
$20,000,000<br />
$10,000,000<br />
$0<br />
$2M<br />
$15M<br />
$2.8M $2.6M $3.2M<br />
$75M<br />
18 | P age
Hate Incidents<br />
In November 2006, for Joshua Watk<strong>in</strong>s, and Ronald Harrison, racism on the University <strong>of</strong> <strong>Kentucky</strong> campus<br />
extended beyond isolated <strong>in</strong>cidents ----- it is an ongo<strong>in</strong>g problem at the school, they said. Watk<strong>in</strong>s returned to<br />
his UK residence hall room last year and found ‘‘Die’’ and a racial epithet scrawled across his door. Dur<strong>in</strong>g the<br />
2007-08-school year, Harrison noticed a racial slur written on the wall <strong>of</strong> the bathroom <strong>in</strong> his residence hall. In<br />
the same month, an effigy <strong>of</strong> President-Elect Barack Obama hung by a noose from a tree on UK’s campus.<br />
<strong>The</strong> Ku Klux Klan, composed <strong>of</strong> 34 named groups with 164 chapters, was down by 15 chapters <strong>in</strong> 2006<br />
accord<strong>in</strong>g to the Southern Poverty Law Center. However, that dip came after years <strong>of</strong> growth, from 110<br />
chapters <strong>in</strong> 2000 to 179 <strong>in</strong> 2005. Still, <strong>of</strong> that steep five-year rise, some 63%, apparently came more <strong>in</strong> the<br />
number <strong>of</strong> chapters than <strong>in</strong> actual Klansmen. <strong>The</strong>re are likely between 6,000 and 8,000 Klansmen <strong>in</strong> all 34<br />
Klan groups comb<strong>in</strong>ed. <strong>The</strong> Dawson Spr<strong>in</strong>gs <strong>Kentucky</strong>-based Imperial Klans <strong>of</strong> America (IKA), the largest<br />
Klan group <strong>in</strong> 2005, dropped by almost half to 23 chapters to become the second largest KKK membership. It<br />
fell beh<strong>in</strong>d the Ill<strong>in</strong>ois-based Brotherhood <strong>of</strong> Klans (BOK), which had 30 chapters <strong>in</strong> 2006. Imperial Wizard<br />
Dale Fox died <strong>in</strong> November, but was quickly replaced by Jeremy Parker. 15<br />
Boone County's top prosecutor called for a tougher hate-crimes law <strong>in</strong> <strong>Kentucky</strong> after a cross was burned <strong>in</strong> an<br />
<strong>African</strong> American family’s yard <strong>in</strong> 2004. ‘‘<strong>The</strong>re is no meat to <strong>Kentucky</strong>’s hate-crimes law,’’ said Boone County<br />
Commonwealth Attorney L<strong>in</strong>da Tally Smith. ‘<strong>The</strong> cross-burn<strong>in</strong>g just illustrates that hole <strong>in</strong> our statutes.’’<br />
Smith is not alone <strong>in</strong> her view. <strong>The</strong> Anti-Defamation League says <strong>Kentucky</strong> is one <strong>of</strong> only five states that<br />
doesn’t <strong>in</strong>crease the penalty if a crime is committed out <strong>of</strong> bias-based hate. Ohio <strong>in</strong>cluded harsher<br />
punishments for such crimes. ‘‘It is unfortunate the cross-burn<strong>in</strong>g had to occur to br<strong>in</strong>g to attention that<br />
<strong>Kentucky</strong>’s hate-crimes law is weak,’’ said Bettysue Feuer, a regional director for the Anti-Defamation League.<br />
‘‘<strong>The</strong> <strong>in</strong>cident should be used as an opportunity to put some teeth <strong>in</strong> the hate-crimes law.’’ 16 <strong>The</strong> Kenton<br />
Circuit Court Fourth Division <strong>of</strong> <strong>Kentucky</strong> ruled <strong>in</strong> favor Friday, Feb. 1, 2008, <strong>of</strong> pla<strong>in</strong>tiffs <strong>in</strong> a civil case the<br />
<strong>Kentucky</strong> Commission on Human Rights filed aga<strong>in</strong>st convicted felons <strong>of</strong> the cross-burn<strong>in</strong>g and vandalism<br />
that took place <strong>in</strong> Northern <strong>Kentucky</strong> <strong>in</strong> 2004. Judge Summe said: “<strong>The</strong> actions <strong>of</strong> the defendants were<br />
motivated by racial animus, and were <strong>in</strong>tended to and did, coerce, <strong>in</strong>timidate, threaten or <strong>in</strong>terfere with the<br />
Mahone family (<strong>African</strong> American) with regard to their enjoyment <strong>of</strong> their home. <strong>The</strong> actions <strong>of</strong> the<br />
defendants caused the Mahone family to suffer severe emotional distress, embarrassment, and humiliation, as<br />
well as caused the family to move out <strong>of</strong> their home.” 17<br />
<strong>The</strong> Southern Poverty Law Center <strong>in</strong> 2009 lists the follow<strong>in</strong>g as hate groups <strong>in</strong><br />
<strong>Kentucky</strong>:<br />
Name Type City<br />
American National Socialist Workers' Party Neo‐Nazi Baxter<br />
Imperial Klans <strong>of</strong> America Ku Klux Klan Brandenburg<br />
15 Beirich, Bramblett, Freeman, Griggs, Smith and Wood, “<strong>The</strong> Year <strong>in</strong> Hate, Intelligence Report. Spr<strong>in</strong>g 2007.<br />
16 Jim Hannah, C<strong>in</strong>c<strong>in</strong>nati Enquirer, July 2004.<br />
17 KCHR 2008 Annual Report.<br />
19 | Page
American National Socialist Workers' Party Neo‐Nazi Brooks<br />
Fellowship <strong>of</strong> God's Covenant People Christian Identity Burl<strong>in</strong>gton<br />
Appalachian Knights <strong>of</strong> the Ku Klux Klan Ku Klux Klan Caneyville<br />
Master Klans <strong>of</strong> America Ku Klux Klan Corb<strong>in</strong><br />
Imperial Klans <strong>of</strong> America Ku Klux Klan Dawson Spr<strong>in</strong>gs<br />
League <strong>of</strong> the South Neo‐Confederate Lex<strong>in</strong>gton<br />
National Knights <strong>of</strong> the Ku Klux Klan Ku Klux Klan Lex<strong>in</strong>gton<br />
<strong>African</strong> American<br />
Nation <strong>of</strong> Islam<br />
Separatist<br />
Louisville<br />
United Northern and Southern Knights <strong>of</strong> the Ku Klux Klan Ku Klux Klan Newport<br />
Appalachian Knights <strong>of</strong> the Ku Klux Klan Ku Klux Klan Pikeville<br />
North American White Knights <strong>of</strong> the Ku Klux Klan Ku Klux Klan Tollesboro<br />
<strong>African</strong> <strong>Americans</strong> and the Crim<strong>in</strong>al Justice System<br />
Few crim<strong>in</strong>al justice issues are more troubl<strong>in</strong>g than the prevalence <strong>of</strong> racial disparity with<strong>in</strong> the crim<strong>in</strong>al justice<br />
system. At all stages <strong>of</strong> the system -- beg<strong>in</strong>n<strong>in</strong>g with arrest and proceed<strong>in</strong>g through imprisonment and parole --<br />
substantial racial and ethnic disparities are found <strong>in</strong> virtually all jurisdictions <strong>in</strong> the United <strong>State</strong>s. While these<br />
disparities have persisted for years, <strong>in</strong> many respects they have been exacerbated <strong>in</strong> recent years despite<br />
considerable social and economic progress <strong>in</strong> many areas <strong>of</strong> American life. 18<br />
Racist statutes with<strong>in</strong> the legal code have been <strong>in</strong> existence <strong>in</strong> this country s<strong>in</strong>ce its earliest foundation. For<br />
many <strong>African</strong> <strong>Americans</strong> who enter the crim<strong>in</strong>al justice system, discrim<strong>in</strong>atory sentenc<strong>in</strong>g patterns are <strong>of</strong>ten<br />
an unavoidable reality. Although <strong>African</strong> <strong>Americans</strong> account for only 12% <strong>of</strong> the U.S. population, they<br />
comprise about 50% <strong>of</strong> the total adult prison population (U.S. Census Bureau, 2000; US Bureau <strong>of</strong> Justice,<br />
2000). <strong>African</strong> <strong>Americans</strong> convicted <strong>of</strong> kill<strong>in</strong>g Whites are more likely than any other racial or ethnic group to<br />
receive a death sentence, while Whites have rarely been sentenced to death for kill<strong>in</strong>g <strong>African</strong> <strong>Americans</strong>, a<br />
trend seen <strong>in</strong> both <strong>Kentucky</strong> and across the nation. 19<br />
<strong>African</strong> American youth are formally charged and <strong>in</strong>carcerated at rates notably higher than for White youth. 20<br />
<strong>Kentucky</strong> data reflect these disparities, with <strong>African</strong> American youth less likely to be diverted and more likely<br />
to be petitioned and deta<strong>in</strong>ed than White youth. When compar<strong>in</strong>g rates <strong>of</strong> detention between <strong>African</strong><br />
American youth and White youth, <strong>Kentucky</strong> shows greater racial disparity than the nation as a whole. 21<br />
18 Racial Disparities <strong>in</strong> Crim<strong>in</strong>al justice System. http://www.sentenc<strong>in</strong>g.nj.gov/downloads/pdf/articles/racial1.pdf<br />
19 Janet E. Powell, ‘‘<strong>The</strong> <strong>Kentucky</strong> Racial Justice Act: A Policy Analysis’’. 2001.<br />
20 National Council on Crime and Del<strong>in</strong>quency (2007). And Justice for Some: Differential Treatment <strong>of</strong> Youth <strong>of</strong> Color <strong>in</strong> the Justice System. Available<br />
at http://www.nccd.crc.org. Accessed October 2008.<br />
21 Data obta<strong>in</strong>ed from <strong>Kentucky</strong> Adm<strong>in</strong>istrative Office <strong>of</strong> the Courts, September 2008, and <strong>Kentucky</strong> Department <strong>of</strong> Juvenile Justice,<br />
November 2008.<br />
20 | P age
<strong>Kentucky</strong> is one <strong>of</strong> just two permanent disenfranchisement states (along with Virg<strong>in</strong>ia) that bar all persons<br />
with felony convictions, with no exception, from vot<strong>in</strong>g even after they have completed their full sentences.<br />
<strong>Kentucky</strong> has the highest <strong>African</strong> American disenfranchisement rate <strong>in</strong> the country with nearly one <strong>of</strong> every 4<br />
<strong>African</strong> <strong>Americans</strong> <strong>in</strong>eligible to vote. This rate is nearly triple the national <strong>African</strong> American<br />
disenfranchisement rate 22 . In addition to hav<strong>in</strong>g one <strong>of</strong> the highest overall disenfranchisement rates <strong>in</strong> the<br />
nation, <strong>Kentucky</strong> possesses the highest <strong>African</strong> American disenfranchisement rate <strong>in</strong> the country. While<br />
Whites comprise 88.3% <strong>of</strong> the state’s population and <strong>African</strong> <strong>Americans</strong> make up 7.5%, about 31% <strong>of</strong> the total<br />
<strong>Kentucky</strong> prison population is <strong>African</strong> American. Furthermore, <strong>Kentucky</strong>’s comb<strong>in</strong>ed prison and jail<br />
<strong>in</strong>carceration rate for <strong>African</strong> <strong>Americans</strong> is 2,793 per 100,000 residents -- a rate that is nearly five times the<br />
<strong>in</strong>carceration rate for Whites (561 per 100,000 residents).<br />
<strong>Kentucky</strong>’s high rate <strong>of</strong> <strong>in</strong>carceration <strong>of</strong> <strong>African</strong> <strong>Americans</strong>, <strong>in</strong> turn, results <strong>in</strong> its high rate <strong>of</strong><br />
disenfranchisement. Consequently, one <strong>of</strong> every 4 <strong>African</strong> American adults <strong>in</strong> <strong>Kentucky</strong> cannot vote. This rate<br />
(23.7%) is nearly triple the national <strong>African</strong> American disenfranchisement rate <strong>of</strong> 8.25% -- or one <strong>of</strong> every 12<br />
<strong>African</strong> <strong>Americans</strong>.<br />
At the time <strong>of</strong> the writ<strong>in</strong>g <strong>of</strong> this report, a bill to restore vot<strong>in</strong>g rights to felons is mov<strong>in</strong>g through the state<br />
legislature with yet undeterm<strong>in</strong>ed results.<br />
<strong>African</strong> American and Elected Positions<br />
<strong>The</strong> 2008 update <strong>of</strong> the report released by Secretary <strong>of</strong> <strong>State</strong> Trey Grayson, United We Stand: Encourag<strong>in</strong>g<br />
Diversity <strong>in</strong> <strong>Kentucky</strong>’s Leaders looked at racial diversity <strong>in</strong> <strong>Kentucky</strong>’s political leadership. It stated that <strong>Kentucky</strong><br />
has lost ground s<strong>in</strong>ce 2006 <strong>in</strong> the number <strong>of</strong> racially diverse elected and appo<strong>in</strong>ted <strong>of</strong>ficials <strong>in</strong> the Commonwealth.<br />
‘‘<strong>The</strong>se statistics are a sober<strong>in</strong>g rem<strong>in</strong>der that our leadership <strong>in</strong> this state does not represent the diversity <strong>of</strong> our<br />
population,’’ said Secretary Grayson.<br />
• <strong>Kentucky</strong> saw a slight decrease <strong>in</strong> diversity at the Supreme Court, Circuit Court, and Mayoral levels by one<br />
elected <strong>of</strong>ficial. <strong>The</strong>re was an unfortunate drop <strong>of</strong> 18 racially diverse members <strong>of</strong> <strong>Kentucky</strong> school boards<br />
after the 2006 elections, where most <strong>of</strong> <strong>Kentucky</strong>’s racial diversity was lost. <strong>The</strong>re was no change <strong>in</strong> the<br />
number <strong>of</strong> <strong>State</strong> Senators, District Court Judges, and County Magistrates and Commissioners.<br />
• <strong>The</strong> report did <strong>in</strong>clude some encourag<strong>in</strong>g statistics. Non-whites <strong>in</strong>creased their representation on the<br />
Court <strong>of</strong> Appeals and House <strong>of</strong> Representatives by one member each. <strong>The</strong>re was also a six member ga<strong>in</strong> at<br />
the City Councilmember and Commissioner level.<br />
• Unfortunately, there is still a large dearth <strong>of</strong> diverse elected <strong>of</strong>ficials even at the local level. Overall,<br />
<strong>Kentucky</strong> saw a decrease from 139 racially diverse leaders <strong>in</strong> 2006 to 126 <strong>in</strong> 2007. At the federal level,<br />
<strong>Kentucky</strong> is represented by diverse leaders <strong>in</strong> Secretary <strong>of</strong> Labor Ela<strong>in</strong>e Chao.<br />
• Accord<strong>in</strong>g to the U.S. Census Bureau, non-Whites make up nearly 10% <strong>of</strong> <strong>Kentucky</strong>’s population, but they<br />
are not similarly represented <strong>in</strong> elected <strong>of</strong>fices. <strong>African</strong> <strong>Americans</strong> make up a large portion <strong>of</strong> the diversity<br />
<strong>of</strong> <strong>Kentucky</strong> leadership. Only a few other m<strong>in</strong>ority racial categorizations are represented <strong>in</strong> <strong>Kentucky</strong><br />
leadership.<br />
22 http://www.lwvky.org/Felony_Dis_Report.pdf<br />
21 | P age
<strong>The</strong>re was no change <strong>in</strong> the number <strong>of</strong> <strong>State</strong> Senators, District Court Judges, and County Magistrates and<br />
Commissioners. ‘‘<strong>The</strong>re are a number <strong>of</strong> potential great leaders <strong>in</strong> <strong>Kentucky</strong> who would diversify the leadership <strong>of</strong><br />
our state <strong>in</strong> both elected and appo<strong>in</strong>ted positions.’’ Trey Grayson cont<strong>in</strong>ued.<br />
As <strong>of</strong> January 1 st , 2009, the <strong>Kentucky</strong> <strong>State</strong> Senate has 37 members (21 Republicans, 15 Democrats, and 1<br />
Independent); there is only one <strong>African</strong> American, Senator Gerald A. Neal (D) represent<strong>in</strong>g senate district 33<br />
(Jefferson County).<br />
<strong>The</strong>re are 100 <strong>State</strong> House members (65 Democrats and 25 Republicans); there are 6 <strong>African</strong> <strong>Americans</strong><br />
members:<br />
• Representative Arnold Simpson (D), House District 65; Kenton County (part)<br />
• Representative Darryl T. Owens (D), House District 43; Jefferson County (part)<br />
• Representative Reg<strong>in</strong>ald Meeks (D), House District 42; Jefferson County (part)<br />
• Representative Derrick Graham (D), House District 57; Frankl<strong>in</strong> County (part)<br />
• Representative Jim Glenn (D), House District 13; Daviess County (part)<br />
• Representative Jesse Crenshaw (D), House District 77; Fayette County (part)<br />
<strong>The</strong>re are currently no <strong>African</strong> <strong>Americans</strong> from <strong>Kentucky</strong> <strong>in</strong> the US House <strong>of</strong> Representatives or Senate.<br />
22 | P age
Conclusion<br />
<strong>The</strong> <strong>Kentucky</strong> Commission on Human Rights has collected the data <strong>in</strong> this report from a variety <strong>of</strong> census<br />
statistics, research data and articles <strong>in</strong> order to sh<strong>in</strong>e a light on areas where our state desperately needs change.<br />
Some <strong>of</strong> the statistics we found are shock<strong>in</strong>g and may strike the reader as facts represent<strong>in</strong>g some yesteryear, but<br />
this report provides snapshots <strong>of</strong> the state <strong>of</strong> <strong>Kentucky</strong> <strong>African</strong> <strong>Americans</strong>, today.<br />
In <strong>Kentucky</strong>, the struggle cont<strong>in</strong>ues for better and equal access to education for <strong>African</strong> <strong>Americans</strong>, for<br />
fight<strong>in</strong>g l<strong>in</strong>ger<strong>in</strong>g poverty and creat<strong>in</strong>g opportunities for success, for combat<strong>in</strong>g predatory lend<strong>in</strong>g and<br />
unfair practices <strong>in</strong> hous<strong>in</strong>g, for ensur<strong>in</strong>g fair access to the healthcare system, for guarantee<strong>in</strong>g fair<br />
treatment <strong>in</strong> the justice system, and for practic<strong>in</strong>g a genu<strong>in</strong>e equality that helps dim<strong>in</strong>ish racial<br />
discrim<strong>in</strong>ation. Armed with facts such as the ones conta<strong>in</strong>ed <strong>in</strong> this report, citizens can determ<strong>in</strong>e to build a<br />
rational spr<strong>in</strong>gboard to success.<br />
<strong>The</strong> <strong>Kentucky</strong> Commission on Human Rights cont<strong>in</strong>ues to fight discrim<strong>in</strong>ation. We will cont<strong>in</strong>ue to lead<br />
and support all efforts that <strong>in</strong>crease fairness and equality to <strong>African</strong> <strong>Americans</strong> and all m<strong>in</strong>orities and<br />
citizens <strong>of</strong> <strong>Kentucky</strong>.<br />
<strong>The</strong> <strong>Kentucky</strong> Commission on Human Rights is the state government agency that enforces the <strong>Kentucky</strong><br />
Civil Rights Act and the policies <strong>of</strong> federal civil rights laws, all <strong>of</strong> which make discrim<strong>in</strong>ation illegal.<br />
23 | P age
<strong>Kentucky</strong> Commission on Human Rights<br />
332 W. Broadway, Suite 700, Louisville, <strong>Kentucky</strong> 40202<br />
Phone: 502-595-4024 Toll-Free: 800-292-5566<br />
TDD: 502-595-4084 Fax: 502-595-4801<br />
Email: kchr.mail@ky.gov<br />
Website: www.kchr.ky.gov<br />
24 | P age