The State of African Americans in Kentucky

Create successful ePaper yourself
Turn your PDF publications into a flip-book with our unique Google optimized e-Paper software.
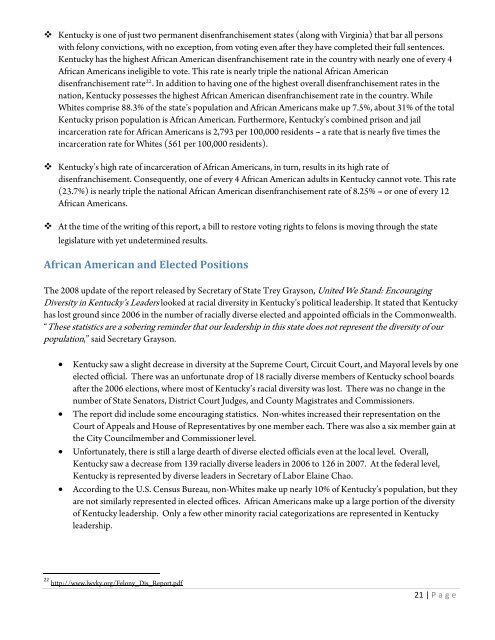
<strong>Kentucky</strong> is one <strong>of</strong> just two permanent disenfranchisement states (along with Virg<strong>in</strong>ia) that bar all persons<br />
with felony convictions, with no exception, from vot<strong>in</strong>g even after they have completed their full sentences.<br />
<strong>Kentucky</strong> has the highest <strong>African</strong> American disenfranchisement rate <strong>in</strong> the country with nearly one <strong>of</strong> every 4<br />
<strong>African</strong> <strong>Americans</strong> <strong>in</strong>eligible to vote. This rate is nearly triple the national <strong>African</strong> American<br />
disenfranchisement rate 22 . In addition to hav<strong>in</strong>g one <strong>of</strong> the highest overall disenfranchisement rates <strong>in</strong> the<br />
nation, <strong>Kentucky</strong> possesses the highest <strong>African</strong> American disenfranchisement rate <strong>in</strong> the country. While<br />
Whites comprise 88.3% <strong>of</strong> the state’s population and <strong>African</strong> <strong>Americans</strong> make up 7.5%, about 31% <strong>of</strong> the total<br />
<strong>Kentucky</strong> prison population is <strong>African</strong> American. Furthermore, <strong>Kentucky</strong>’s comb<strong>in</strong>ed prison and jail<br />
<strong>in</strong>carceration rate for <strong>African</strong> <strong>Americans</strong> is 2,793 per 100,000 residents -- a rate that is nearly five times the<br />
<strong>in</strong>carceration rate for Whites (561 per 100,000 residents).<br />
<strong>Kentucky</strong>’s high rate <strong>of</strong> <strong>in</strong>carceration <strong>of</strong> <strong>African</strong> <strong>Americans</strong>, <strong>in</strong> turn, results <strong>in</strong> its high rate <strong>of</strong><br />
disenfranchisement. Consequently, one <strong>of</strong> every 4 <strong>African</strong> American adults <strong>in</strong> <strong>Kentucky</strong> cannot vote. This rate<br />
(23.7%) is nearly triple the national <strong>African</strong> American disenfranchisement rate <strong>of</strong> 8.25% -- or one <strong>of</strong> every 12<br />
<strong>African</strong> <strong>Americans</strong>.<br />
At the time <strong>of</strong> the writ<strong>in</strong>g <strong>of</strong> this report, a bill to restore vot<strong>in</strong>g rights to felons is mov<strong>in</strong>g through the state<br />
legislature with yet undeterm<strong>in</strong>ed results.<br />
<strong>African</strong> American and Elected Positions<br />
<strong>The</strong> 2008 update <strong>of</strong> the report released by Secretary <strong>of</strong> <strong>State</strong> Trey Grayson, United We Stand: Encourag<strong>in</strong>g<br />
Diversity <strong>in</strong> <strong>Kentucky</strong>’s Leaders looked at racial diversity <strong>in</strong> <strong>Kentucky</strong>’s political leadership. It stated that <strong>Kentucky</strong><br />
has lost ground s<strong>in</strong>ce 2006 <strong>in</strong> the number <strong>of</strong> racially diverse elected and appo<strong>in</strong>ted <strong>of</strong>ficials <strong>in</strong> the Commonwealth.<br />
‘‘<strong>The</strong>se statistics are a sober<strong>in</strong>g rem<strong>in</strong>der that our leadership <strong>in</strong> this state does not represent the diversity <strong>of</strong> our<br />
population,’’ said Secretary Grayson.<br />
• <strong>Kentucky</strong> saw a slight decrease <strong>in</strong> diversity at the Supreme Court, Circuit Court, and Mayoral levels by one<br />
elected <strong>of</strong>ficial. <strong>The</strong>re was an unfortunate drop <strong>of</strong> 18 racially diverse members <strong>of</strong> <strong>Kentucky</strong> school boards<br />
after the 2006 elections, where most <strong>of</strong> <strong>Kentucky</strong>’s racial diversity was lost. <strong>The</strong>re was no change <strong>in</strong> the<br />
number <strong>of</strong> <strong>State</strong> Senators, District Court Judges, and County Magistrates and Commissioners.<br />
• <strong>The</strong> report did <strong>in</strong>clude some encourag<strong>in</strong>g statistics. Non-whites <strong>in</strong>creased their representation on the<br />
Court <strong>of</strong> Appeals and House <strong>of</strong> Representatives by one member each. <strong>The</strong>re was also a six member ga<strong>in</strong> at<br />
the City Councilmember and Commissioner level.<br />
• Unfortunately, there is still a large dearth <strong>of</strong> diverse elected <strong>of</strong>ficials even at the local level. Overall,<br />
<strong>Kentucky</strong> saw a decrease from 139 racially diverse leaders <strong>in</strong> 2006 to 126 <strong>in</strong> 2007. At the federal level,<br />
<strong>Kentucky</strong> is represented by diverse leaders <strong>in</strong> Secretary <strong>of</strong> Labor Ela<strong>in</strong>e Chao.<br />
• Accord<strong>in</strong>g to the U.S. Census Bureau, non-Whites make up nearly 10% <strong>of</strong> <strong>Kentucky</strong>’s population, but they<br />
are not similarly represented <strong>in</strong> elected <strong>of</strong>fices. <strong>African</strong> <strong>Americans</strong> make up a large portion <strong>of</strong> the diversity<br />
<strong>of</strong> <strong>Kentucky</strong> leadership. Only a few other m<strong>in</strong>ority racial categorizations are represented <strong>in</strong> <strong>Kentucky</strong><br />
leadership.<br />
22 http://www.lwvky.org/Felony_Dis_Report.pdf<br />
21 | P age