25 Western Tuna and Billfish Fishery - Australian Natural Resources ...
25 Western Tuna and Billfish Fishery - Australian Natural Resources ...
25 Western Tuna and Billfish Fishery - Australian Natural Resources ...

Create successful ePaper yourself
Turn your PDF publications into a flip-book with our unique Google optimized e-Paper software.
chapter <strong>25</strong><br />
<strong>25</strong> <strong>Western</strong> <strong>Tuna</strong> <strong>and</strong> <strong>Billfish</strong> <strong>Fishery</strong><br />
d Wilson, P Sahlqvist, h Patterson <strong>and</strong> S vieira<br />
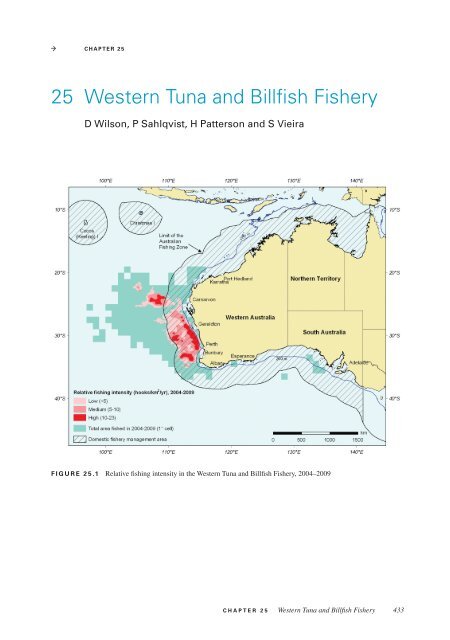
Figure <strong>25</strong>.1 Relative fishing intensity in the <strong>Western</strong> <strong>Tuna</strong> <strong>and</strong> <strong>Billfish</strong> <strong>Fishery</strong>, 2004–2009<br />
chapter <strong>25</strong> <strong>Western</strong> <strong>Tuna</strong> <strong>and</strong> <strong>Billfish</strong> <strong>Fishery</strong> 433
taBle <strong>25</strong>.1 Status of the <strong>Western</strong> <strong>Tuna</strong> <strong>and</strong> <strong>Billfish</strong> <strong>Fishery</strong><br />
<strong>Fishery</strong> status 2008 2009 Comments a<br />
Biological status Overfishing Overfished Overfishing Overfished<br />
Marlin, striped<br />
(Tetrapturus audax)<br />
Swordfish<br />
(Xiphius gladius)<br />
<strong>Tuna</strong>, albacore<br />
(Thunnus alalunga)<br />
<strong>Tuna</strong>, bigeye<br />
(Thunnus obesus)<br />
<strong>Tuna</strong>, longtail<br />
(Thunnus tonggol)<br />
<strong>Tuna</strong>, yellowfin<br />
(Thunnus albacares)<br />
Economic status<br />
<strong>Fishery</strong> level<br />
434 <strong>Fishery</strong> status reports 2 009<br />
Estimates of net economic returns not available but<br />
likely to be low<br />
No current assessment. CPUE trends<br />
declining. Aspects of biology,<br />
productivity <strong>and</strong> fisheries, combined<br />
with the lack of data, are a cause for<br />
concern.<br />
Localised depletion evident in the<br />
south-west <strong>and</strong> north-west Indian<br />
Ocean, overrides ocean-wide<br />
assessments.<br />
Catches have continued to decline<br />
since 2000 due to a reduction in<br />
targeted effort.<br />
Current fishing patterns are<br />
considered sustainable.<br />
No current assessment. Agreed as a<br />
priority for assessment by the IOTC.<br />
Current levels of overfishing <strong>and</strong><br />
historical average levels of<br />
recruitment have moved the stock<br />
close to an overfished state.<br />
Economic status uncertain. Latent<br />
effort remained high in 2009,<br />
suggesting low total net economic<br />
returns.<br />
not overfiShed / not Subject to overfiShing overfiShed / overfiShing uncertain not aSSeSSed<br />
CPUE = catch per unit effort; IOTC = Indian Ocean <strong>Tuna</strong> Commission<br />
a Domestic assessments are unreliable because interactions with broader regional stocks are uncertain. Ocean-wide assessments of species<br />
through the Indian Ocean <strong>Tuna</strong> Commission were used as the basis for stock status determination.<br />
taBle <strong>25</strong>.2 Main features <strong>and</strong> statistics of the <strong>Western</strong> <strong>Tuna</strong> <strong>and</strong> <strong>Billfish</strong> <strong>Fishery</strong><br />
Feature Description<br />
Key target <strong>and</strong> byproduct<br />
species<br />
Marlin, striped (Tetrapturus audax)<br />
Swordfish (Xiphius gladius)<br />
<strong>Tuna</strong>, albacore (Thunnus alalunga)<br />
<strong>Tuna</strong>, bigeye (Thunnus obesus)<br />
<strong>Tuna</strong>, longtail (Thunnus tonggol)<br />
<strong>Tuna</strong>, yellowfin (Thunnus albacares)<br />
Other byproduct species Blue shark (Prionace glauca)<br />
Mahi mahi (Coryphaena hippurus)<br />
Rudderfish (Lepidocybium flavobrunneum)<br />
<strong>Tuna</strong>, skipjack (Katsuwonus pelamis)<br />
<strong>Tuna</strong>, southern bluefin (Thunnus maccoyii)<br />
A complete list of minor byproduct species is provided in Table <strong>25</strong>.4.<br />
Fishing methods Pelagic longline (monofilament mainline)<br />
Minor line (h<strong>and</strong>line, rod <strong>and</strong> reel, troll <strong>and</strong> poling)<br />
Primary l<strong>and</strong>ing ports Fremantle, Geraldton<br />
Table <strong>25</strong>.2 continues over the page
taBle <strong>25</strong>.2 Main features <strong>and</strong> statistics of the <strong>Western</strong> <strong>Tuna</strong> <strong>and</strong> <strong>Billfish</strong> <strong>Fishery</strong> CONTINUED<br />
Feature Description<br />
Management methods Input controls: limited entry, gear <strong>and</strong> area restrictions<br />
Output controls: bycatch restrictions<br />
Individual transferable quotas to be implemented under the management plan once SFRs are<br />
finalised in 2010.<br />
Management plan <strong>Western</strong> <strong>Tuna</strong> <strong>and</strong> <strong>Billfish</strong> Management Plan 2005 (DAFF 2005) (amended 2006)<br />
SFRs to be issued in 2010<br />
Harvest strategy Development <strong>and</strong> preliminary testing of the harvest strategy framework for the <strong>Western</strong> <strong>Tuna</strong><br />
<strong>and</strong> <strong>Billfish</strong> <strong>Fishery</strong> (Davies et al. 2008)—not implemented<br />
Reference points <strong>and</strong> triggers: not defined<br />
Consultative forums WTBF Management Advisory Committee (WTBFMAC), WTBF Resource Assessment Group<br />
(WTBFRAG)—moved to the Tropical <strong>Tuna</strong> MAC (TTMAC) <strong>and</strong> Tropical <strong>Tuna</strong> Resource<br />
Assessment Group (TTRAG) in 2010<br />
Main markets International: Japan, United States—fresh, frozen<br />
Domestic: fresh, frozen<br />
EPBC Act assessments:<br />
—listed species (Part 13)<br />
—international movement of<br />
wildlife specimens (Part 13A)<br />
Current accreditation dated 2 February 2010<br />
Current accreditation (Exempt) expires 01 December 2014<br />
Ecological risk assessment Level 1: Scale Intensity Consequence Analysis (SICA) completed on 348 species (Webb et al.<br />
2007)<br />
Level 2: Productivity Susceptibility Analysis (PSA) completed on 348 species (Webb et al.<br />
2007)<br />
Level 3: Sustainability Assessment for Fishing Effects (SAFE) completed on 187 species<br />
(Zhou et al. 2007)<br />
Bycatch workplans <strong>Australian</strong> <strong>Tuna</strong> <strong>and</strong> <strong>Billfish</strong> Longline Fisheries Bycatch <strong>and</strong> Discarding Workplan,<br />
1 November 2008–31 October 2010 (AFMA 2008)<br />
<strong>Fishery</strong> statistics a 2008 fishing season 2009 fishing season<br />
Fishing season 1 January–31 December 1 January–31 December<br />
TAC <strong>and</strong> catch by species:<br />
—marlin, striped<br />
—swordfish<br />
—tuna, albacore<br />
—tuna, bigeye<br />
—tuna, longtail<br />
—tuna, yellowfin<br />
TAC (tonnes)<br />
None<br />
None<br />
None<br />
None<br />
35<br />
None<br />
Catch (tonnes)<br />
< 1<br />
142<br />
10<br />
26<br />
7<br />
< 1<br />
Effort Pelagic longline: 226 061 hooks set<br />
Minor lines: unknown number of hooks set<br />
TAC (tonnes)<br />
None<br />
None<br />
None<br />
None<br />
35<br />
None<br />
Catch (tonnes)<br />
< 1<br />
349<br />
20<br />
62<br />
11<br />
12<br />
Pelagic longline: 528 038 hooks set<br />
Minor lines: unknown number of hooks set<br />
Fishing permits 93, plus 3 carrier vessels 93, plus 3 carrier vessels<br />
Active vessels Pelagic longline: 1<br />
Minor line: 1<br />
Pelagic longline: 3<br />
Minor line: 1<br />
Observer coverage 28 750 hooks (12.72%) 44 790 hooks (8.5%)<br />
Real gross value of<br />
production (2008–09 dollars)<br />
Confidential (
<strong>25</strong>.1 Background<br />
Domestic management arrangements for the<br />
<strong>Western</strong> <strong>Tuna</strong> <strong>and</strong> <strong>Billfish</strong> <strong>Fishery</strong> (WTBF)<br />
(Fig. <strong>25</strong>.1) reflect Australia’s obligations to the<br />
Indian Ocean <strong>Tuna</strong> Commission (IOTC) (see<br />
Chapter 21). Although the management plan<br />
for the fishery commenced in 2005, the fishery<br />
continues to be managed under transitional<br />
provisions while the process of allocating<br />
statutory fishing rights (SFRs) is completed<br />
(Table <strong>25</strong>.2). The <strong>Australian</strong> Fisheries<br />
Management Authority (AFMA) is currently in<br />
the process of granting SFRs. Under the plan,<br />
total allowable catches (TACs) are proposed<br />
for five species (bigeye tuna, longtail tuna,<br />
yellowfin tuna, striped marlin <strong>and</strong> swordfish).<br />
The proposed TACs are considerably higher<br />
than historical catches, but under the plan they<br />
taBle <strong>25</strong>.3 History of the <strong>Western</strong> <strong>Tuna</strong> <strong>and</strong> <strong>Billfish</strong> <strong>Fishery</strong><br />
Year Description<br />
436 <strong>Fishery</strong> status reports 2 009<br />
apply to the high seas as well as the <strong>Australian</strong><br />
Fishing Zone (AFZ), <strong>and</strong> are intended to<br />
provide for an expansion of the fishery into<br />
the Indian Ocean. Other species, both target<br />
(albacore tuna) <strong>and</strong> non-target, may need to<br />
be considered for future quota management.<br />
A 12-month fishing season commenced under<br />
the management plan, starting 1 July 2010.<br />
<strong>Western</strong> Australia has an active recreational<br />
gamefish fishery, targeting sailfish (Istiophorus<br />
platypterus), black marlin (Makaira indica),<br />
blue marlin (M. nigricans), striped marlin<br />
<strong>and</strong> yellowfin tuna. Under the management<br />
plan for the fishery, AFMA will be able to<br />
direct fishers not to fish in certain areas. For<br />
example, summer <strong>and</strong> winter closures could<br />
be used to exclude commercial fishers from<br />
areas selected to benefit recreational fishers<br />
targeting sportfish species (such as marlins).<br />
1950s Japan began pelagic longlining off Australia, targeting bigeye tuna in the south-west <strong>and</strong> striped marlin in<br />
the north-west of the fishery.<br />
1979 From November, Japan operated in the AFZ under bilateral agreements.<br />
1980 to 1997 Australia progressively restricted areas of access for Japan’s longliners. Concerns over targeting of marlin<br />
by joint-venture vessels led to a 50 nm exclusion zone.<br />
1985 Freeze on the issue of new Commonwealth fishing vessel licences (July).<br />
1986 Domestic pelagic longliners first operated in the waters of the WTBF.<br />
1994 <strong>Western</strong> Australia legislated to prevent the l<strong>and</strong>ing for commercial sale of all billfish of the Istiophoridae<br />
family (not enforced until December 1999, over-ridden by Commonwealth legislation in 2005).<br />
1994 to 1996 OCS agreements place tuna <strong>and</strong> tuna-like species under the jurisdiction of the Commonwealth.<br />
1995 Longlining declared a key threatening process for seabirds.<br />
1996 The agreement for the establishment of the Indian Ocean <strong>Tuna</strong> Commission entered into force on 27 March.<br />
Australia became a member of the Commission on 13 November.<br />
1997 Japan’s longliners, operating under a joint venture with the Commonwealth <strong>and</strong> the <strong>Tuna</strong> Boat Owners<br />
Association, were excluded from the AFZ in November (due largely to consideration of recreational fishing<br />
interests).<br />
1997 to 1998 Domestic longline fishery began to develop. Interest in the WTBF increased substantially, with an increase<br />
in investment <strong>and</strong> prices paid for the transfer of fishing permits. Most activity over the continental slope<br />
(Perth–Shark Bay <strong>and</strong> Exmouth–Karratha areas).<br />
1998 Fisheries Management Act 1991 amended to require all commercial fishers to return black <strong>and</strong> blue marlin<br />
to sea irrespective of life status.<br />
Threat abatement plan released for the incidental catch of seabirds during longline fishing operations<br />
(superseded by AFMA 2008).<br />
1999 <strong>Western</strong> <strong>Australian</strong> Department of Fisheries announced it would enforce legislation prohibiting the l<strong>and</strong>ing<br />
of striped marlin, spearfish <strong>and</strong> sailfish (December).<br />
Table <strong>25</strong>.3 continues over the page
taBle <strong>25</strong>.3 History of the <strong>Western</strong> <strong>Tuna</strong> <strong>and</strong> <strong>Billfish</strong> <strong>Fishery</strong> CONTINUED<br />
Year Description<br />
2000 Vessel numbers peaked, <strong>and</strong> replacement of small (15–20 m) longliners by larger vessels began. The fleet’s<br />
capacity to operate on distant grounds increased, leading to considerable activity outside the AFZ.<br />
The <strong>Australian</strong> Government introduced a ban on shark finning in tuna fisheries, which prohibits the<br />
possession or l<strong>and</strong>ing of fins separated from carcasses. All shark byproduct in the WTBF must be l<strong>and</strong>ed<br />
with fins attached (either naturally or by other means) to the carcass.<br />
2001 Peak catches taken in the fishery (longline <strong>and</strong> minor line combined: ~3370 t).<br />
Use of wire traces banned (September).<br />
<strong>Australian</strong> <strong>Tuna</strong> <strong>and</strong> <strong>Billfish</strong> Fisheries Bycatch Action Plan launched (superseded by AFMA 2008).<br />
2002 Catch levels <strong>and</strong> fishing effort began to decline due to low prices <strong>and</strong> higher operating costs. Concerns over<br />
the possible localised depletion of swordfish off the <strong>Western</strong> <strong>Australian</strong> coast.<br />
2004 Second Bycatch Action Plan released (superseded by AFMA 2008).<br />
2005 Management plan commenced (21 October). <strong>Fishery</strong> continues to be managed under transitional provisions<br />
while the process of allocating SFRs is completed.<br />
IOTC adopted a resolution that the weight of fins held aboard a vessel should not exceed 5% of the weight<br />
of sharks on the vessel.<br />
2006 AFMA placed annual TAC of 35 t on the commercial catch of longtail tuna, plus a 10-fish trip limit in<br />
excess of 35 t—to commence in 2007.<br />
Securing our Fishing Future–initiated buyback of Commonwealth fishing concessions reduced the number<br />
of WTBF permits to 111.<br />
Second threat abatement plan released (AAD 2006).<br />
2007 Commencement of the process for granting SFRs under the WTBF management plan. Provisional grant of<br />
SFRs made in April. Review of provisional grant by the SFR Allocation Review Panel in December. Final<br />
grant of SFRs delayed due to legal challenges.<br />
2008 Harvest strategy framework for quota species adopted by AFMA.<br />
IOTC Scientific Committee recommended that the resolution on fin:body weight ratio be replaced with<br />
one that requires shark fins to be l<strong>and</strong>ed attached to the body, either naturally or by other means. Despite<br />
attempts by Australia, the French Territories <strong>and</strong> the European Union to have the IOTC adopt such a<br />
resolution, the measure was not agreed upon at the Commission level.<br />
2009 Insufficient effort in the WTBF to begin to implement the harvest strategy framework (expected to be<br />
implemented once effort increases to a point where sufficient data become available for use in the<br />
framework).<br />
AFMA = <strong>Australian</strong> Fisheries Management Authority; AFZ = <strong>Australian</strong> Fishing Zone; IOTC = Indian Ocean <strong>Tuna</strong> Commission; OCS =<br />
Offshore Constitutional Settlement; SFR = statutory fishing right; TAC = total allowable catch; WTBF = <strong>Western</strong> <strong>Tuna</strong> <strong>and</strong> <strong>Billfish</strong> <strong>Fishery</strong><br />
<strong>25</strong>.2 harvest strategy<br />
A harvest strategy (HS) has been developed<br />
for the WTBF (Davies et al. 2008) <strong>and</strong> is<br />
scheduled for implementation once effort<br />
increases in the fishery to a point where<br />
sufficient data become available for use in<br />
the strategy (the number of active vessels in<br />
2008 <strong>and</strong> 2009 was less than five, Table <strong>25</strong>.2).<br />
The framework includes a ‘decision tree’ that<br />
defines rules <strong>and</strong> subsequent adjustments<br />
to the recommended biological catch<br />
(or level of fishing mortality). Empirical<br />
indicators of stock status are used because<br />
robust, region-specific assessments are not<br />
available for stocks within the WTBF.<br />
For each target species, st<strong>and</strong>ardised<br />
catch rates for three size classes of fish<br />
(small, prime <strong>and</strong> large) will form the main<br />
performance indicators. The values of the<br />
indicators will be compared with target <strong>and</strong><br />
limit reference points. By considering size<br />
data, the HS should be more robust to potential<br />
biases associated with using only longline<br />
catch rates as indices of abundance. Research<br />
is in progress to examine the impact of<br />
uncertainty in the linkages between the WTBF<br />
<strong>and</strong> the wider Indian Ocean stocks on the<br />
implementation of the strategy. The outcomes<br />
of the management strategy evaluation<br />
process for the Eastern <strong>Tuna</strong> <strong>and</strong> <strong>Billfish</strong><br />
chapter <strong>25</strong> <strong>Western</strong> <strong>Tuna</strong> <strong>and</strong> <strong>Billfish</strong> <strong>Fishery</strong> 437
<strong>Fishery</strong> will shape any future development<br />
<strong>and</strong> implementation of a HS for the WTBF.<br />
The IOTC uses reference points based<br />
on maximum sustainable yield (MSY) for<br />
status determination; a biomass below B MSY<br />
is considered overfished. However, as there<br />
is no formal HS in place for IOTC stocks,<br />
the limit reference point proxies in the<br />
Commonwealth Fisheries Harvest Strategy<br />
Policy apply. Data usually show a lag of at<br />
least one full calendar year. Thus, in most<br />
cases, stock assessments run in 2009 use<br />
complete data up until the end of 2007,<br />
<strong>and</strong> preliminary data to the end of 2008.<br />
<strong>25</strong>.3 the 2009 <strong>Fishery</strong><br />
key target <strong>and</strong> byproduct species<br />
The total catch in 2009 was 462 t, compared<br />
with 197 t in 2008. Gross value of production<br />
(GVP) since 2005 is confidential as fewer<br />
than five vessels have fished each year (Figs.<br />
<strong>25</strong>.2, <strong>25</strong>.3). During 2004 to 2009, a total of<br />
4 476 492 hooks were set in the fishery, with<br />
a total reported catch of 2663 t (longline<br />
<strong>25</strong>89 t; minor line 74 t). Despite the peak<br />
catches of approximately 3370 t (longline <strong>and</strong><br />
minor line combined) in 2001 (Fig. <strong>25</strong>.4),<br />
the WTBF accounted for less than 0.5% of<br />
the total tuna <strong>and</strong> billfish catch in the Indian<br />
Ocean (Dowling et al. 2005). The value of the<br />
WTBF fell from $41.2 million in 2000–01 to<br />
$4.1 million in 2004–05 (2008–09 dollars)<br />
(Fig. <strong>25</strong>.5). The value of the fishery since<br />
2004–05 cannot be reported for confidentiality<br />
reasons, as fewer than five vessels have been<br />
active in the longline fishery during that time.<br />
438 <strong>Fishery</strong> status reports 2 009<br />
Effort (million hooks)<br />
7<br />
6<br />
5<br />
4<br />
3<br />
2<br />
1<br />
0<br />
Figure <strong>25</strong>.2 Effort: <strong>Australian</strong> longline, WTBF<br />
Effort<br />
Permits<br />
Active vessels<br />
1989 1993 1997 2001 2005 2009<br />
Figure <strong>25</strong>.2 Longline effort in the WTBF, 1986 to<br />
2009<br />
Catch (thous<strong>and</strong> tonnes)<br />
4<br />
3<br />
2<br />
1<br />
0<br />
Figure <strong>25</strong>.3 Catch & Effort: longline, WTBF<br />
Domestic catch<br />
Japanese catch<br />
Domestic effort<br />
Japanese effort<br />
1985 1989 1993 1997 2001 2005 2009<br />
Figure <strong>25</strong>.3 Longline catch <strong>and</strong> effort in the WTBF,<br />
1983 to 2009<br />
Catch (thous<strong>and</strong> tonnes)<br />
3.5<br />
3.0<br />
2.5<br />
2.0<br />
1.5<br />
1.0<br />
0.5<br />
0.0<br />
Figure <strong>25</strong>.4 Catch: <strong>Australian</strong> fishery, WTBF<br />
Swordfish<br />
Yellowfin tuna<br />
Bigeye tuna<br />
Other<br />
300<br />
<strong>25</strong>0<br />
200<br />
150<br />
100<br />
1989 1993 1997 2001 2005 2009<br />
Figure <strong>25</strong>.4 Total annual catch by species in the<br />
WTBF, 1986 to 2009<br />
50<br />
0<br />
6<br />
5<br />
4<br />
3<br />
2<br />
1<br />
0<br />
Permits/Vessels<br />
Effort (million hooks)
GVP (2008−09 A$ million)<br />
40<br />
30<br />
20<br />
10<br />
0<br />
Other<br />
Yellowfin tuna<br />
Striped marlin<br />
Figure <strong>25</strong>.5 GVP: all species, WTBF<br />
*<br />
Swordfish<br />
Bigeye tuna<br />
Confidential data<br />
* * * *<br />
1998−99 2000−01 2002−03 2004−05 2006−07 2008−09<br />
Figure <strong>25</strong>.5 Real GVP for the WTBF by financial<br />
year, 1998–99 to 2008–09<br />
NOTES: Estimates for 2005–06 to 2008–09 are confidential as<br />
less than five vessels operated. Albacore values are included in the<br />
‘other’ category.<br />
minor byproduct species<br />
Offshore Constitutional Settlement<br />
arrangements currently give the <strong>Western</strong><br />
<strong>Australian</strong> Government jurisdiction over<br />
sharks. WTBF operators are permitted to l<strong>and</strong><br />
a maximum of 20 sharks per vessel per fishing<br />
trip within the AFZ <strong>and</strong>, upon application, up<br />
to 100 pelagic sharks per trip during singlejurisdiction<br />
high-seas trips beyond the AFZ.<br />
These 100 sharks must comprise a maximum<br />
of 80 blue whaler sharks (Prionace glauca)<br />
<strong>and</strong> a maximum of 20 sharks or rays from<br />
of the following eight oceanic species:<br />
• crocodile shark ( Pseudocarcharias<br />
kamoharai)<br />
• silky shark ( Carcharhinus falciformis)<br />
• oceanic whitetip shark<br />
(Carcharhinus longimanus)<br />
• smooth hammerhead ( Sphyrna zygaena)<br />
• pelagic stingray ( Dasyatis violacea)<br />
• shortfin mako ( Isurus oxyrinchus)<br />
• porbeagle ( Lamna nasus)<br />
• thresher shark ( Alopias vulpinus).<br />
One permit carried this condition in 2009.<br />
Zero retention applies to all other shark <strong>and</strong><br />
ray species of subclass Elasmobranchii.<br />
On 29 January 2010, porbeagles, shortfin<br />
makos <strong>and</strong> longfin makos were listed as<br />
migratory species under the Environment<br />
Protection <strong>and</strong> Biodiversity Conservation Act<br />
1999 (EPBC Act). The listing of the species is<br />
a legislated requirement following their listing<br />
in Appendix II of the International Convention<br />
on Migratory Species. Under the EPBC Act,<br />
it is an offence to take, trade, keep or move<br />
a member of a listed migratory species.<br />
However, actions taken under accredited<br />
fisheries management plans or arrangements<br />
are exempt from these offence provisions. The<br />
WTBF is an accredited fishery. The <strong>Australian</strong><br />
Government Department of the Environment,<br />
Water, Heritage <strong>and</strong> the Arts (DEWHA) has<br />
advised that this exemption allows commercial<br />
fishers to retain <strong>and</strong> trade the three shark<br />
species if they are brought up already dead,<br />
but requires that live caught sharks must be<br />
returned to the sea unharmed. All catches of<br />
these sharks, whether retained or released,<br />
must be reported in the daily fishing logbooks.<br />
A breakdown of the minor byproduct<br />
species l<strong>and</strong>ed <strong>and</strong> discarded from 2004<br />
to 2009 is shown in Table <strong>25</strong>.4, with<br />
blue shark, skipjack tuna, rudderfish<br />
<strong>and</strong> oilfish dominating catches.<br />
Unloading swordfish PHOTO: JACQUI COOK, CSIRO<br />
chapter <strong>25</strong> <strong>Western</strong> <strong>Tuna</strong> <strong>and</strong> <strong>Billfish</strong> <strong>Fishery</strong> 439
taBle <strong>25</strong>.4 Minor byproduct species—TACs/triggers, catches/l<strong>and</strong>ings <strong>and</strong> discards from the longline sector of the<br />
WTBF from 2004 to 2009<br />
Species<br />
440 <strong>Fishery</strong> status reports 2 009<br />
TaC/<br />
trigger<br />
2004 to 2009<br />
catch (tonnes)<br />
2004 to 2009<br />
discards<br />
(individuals)<br />
Blacktip sharks (Carcharhinus spp.) Trip limit 0.3 0<br />
Blue shark (Prionace glauca) Trip limit 49 34 359<br />
Bronze whaler (Carcharhinus brachyurus) Trip limit 0.3 109<br />
Crocodile shark (Pseudocarcharias kamoharai) None 0.1 20 017<br />
Mahi mahi (Coryphaena hippurus) None 11 0<br />
Moonfish (Lampris guttatus, L. immaculatus) None 1.8 0<br />
Northern bluefin tuna (Thunnus thynnus) None 0.4 0<br />
Oceanic whitetip shark (Carcharhinus longimanus) Trip limit 1.5 635<br />
Oilfish (Ruvettus pretiosus) None 19.6 234<br />
Porbeagle (Lamna nasus) Trip limit 0.1 0<br />
Ray’s bream (Brama brama) None 0.5 0<br />
Rudderfish (Centrolophus niger) None 23 103<br />
Scalloped hammerhead (Sphyrna lewini) Trip limit 0.4 211<br />
Shortbilled spearfish (Tetrapturus angustirostris) None 0.6 0<br />
Shortfin mako (Isurus oxyrinchus) Trip limit 1.7 1 450<br />
Skipjack tuna (Katsuwonus pelamis) None 30 0<br />
Southern bluefin tuna (Thunnus maccoyii) a Quota 2.8 2<strong>25</strong><br />
Thresher shark (Alopias vulpinus) Trip limit
<strong>25</strong>.4 Biological status<br />
StriPed marlin<br />
(Tetrapturus audax)<br />
LINE DRAWING: FAO<br />
taBle <strong>25</strong>.5 Biology of striped marlin<br />
Parameter Description<br />
Range Species: Occurs in both the Indian<br />
<strong>and</strong> Pacific Oceans; rarely found in<br />
the Atlantic Ocean. Prefers temperate<br />
(cooler) waters <strong>and</strong> tends to be less<br />
migratory than other marlins. In the<br />
Indian Ocean, seasonal concentrations<br />
of striped marlin occur off the east<br />
African coast (0–10ºS), in the south<br />
<strong>and</strong> western Arabian Sea, in the Bay of<br />
Bengal <strong>and</strong> in north-western <strong>Australian</strong><br />
waters.<br />
Stock: Throughout the Indian Ocean<br />
<strong>Tuna</strong> Commission convention area (see<br />
Chapter 21).<br />
Depth Mainly inhabits the surface layer to<br />
depths of around 200 m<br />
Longevity ~10 years<br />
Maturity (50%) age: 2–3 years<br />
Size: not determined<br />
Spawning season November–December. Early Japanese<br />
surveys provided evidence for separate<br />
spawning grounds in the eastern <strong>and</strong><br />
western Indian Ocean, but stock<br />
structure is not known. Spawns once<br />
per season.<br />
Size Maximum: 300+ cm FL; 400+ kg<br />
whole weight. Males <strong>and</strong> females grow<br />
to a similar size.<br />
Recruitment into the fishery: varies<br />
by fishing method; not determined<br />
SOURCES: Bromhead et al. (2004); Froese & Pauly (2009); IOTC<br />
(2010).<br />
WTBF: Approximately 11 t of striped<br />
marlin was taken by <strong>Australian</strong> operators from<br />
2004 to 2009, at an average of less than 2 t per<br />
year. Peak catches of approximately 28 t <strong>and</strong><br />
23 t were taken in 1989 <strong>and</strong> 1999, respectively<br />
(Fig. <strong>25</strong>.6). Logbook records indicate that large<br />
numbers of striped marlin are not retained<br />
by commercial fishers, but rather released<br />
alive. Information on recreational catches<br />
has not yet been collated <strong>and</strong> analysed. The<br />
IOTC is actively seeking this information<br />
for ocean-wide assessment purposes.<br />
iOTC statistical area: Longliners account<br />
for most of the catch. Recorded catches of<br />
striped marlin averaged 5833 t from 1993 to<br />
1999 (peak of 7872 t in 1993) (Fig. <strong>25</strong>.7).<br />
Since then, catches have declined substantially,<br />
to an average of 3231 t from 2000 to 2008,<br />
with 2760 t <strong>and</strong> 2605 t taken in 2007 <strong>and</strong> 2008,<br />
respectively. Catches are relatively evenly<br />
divided between the eastern <strong>and</strong> western<br />
Indian Ocean, <strong>and</strong> vessels from Taiwan—<strong>and</strong><br />
to a lesser extent Indonesia—take most of the<br />
catch (IOTC 2010). Purse-seine fleets also take<br />
striped marlin as byproduct, although those<br />
catches are poorly recorded. The IOTC has<br />
limited data to determine whether current catch<br />
levels are too high; however, there is general<br />
agreement that historical levels of take have<br />
resulted in depletion of the stock (IOTC 2010).<br />
Catch (thous<strong>and</strong> tonnes)<br />
0.<strong>25</strong><br />
0.20<br />
0.15<br />
0.10<br />
0.05<br />
0.00<br />
Figure <strong>25</strong>.6 Catch: striped marlin, WTBF<br />
Australia (domestic <strong>and</strong> charter)<br />
Japan (bilateral <strong>and</strong> joint venture)<br />
1985 1989 1993 1997 2001 2005 2009<br />
Figure <strong>25</strong>.6 Striped marlin catch history (WTBF),<br />
1983 to 2009<br />
chapter <strong>25</strong> <strong>Western</strong> <strong>Tuna</strong> <strong>and</strong> <strong>Billfish</strong> <strong>Fishery</strong> 441
Catch (thous<strong>and</strong> tonnes)<br />
7<br />
6<br />
5<br />
4<br />
3<br />
2<br />
1<br />
0<br />
Figure <strong>25</strong>.7 Catch: striped marlin, IOTC Convention Area<br />
<strong>Western</strong> area catch<br />
Eastern area catch<br />
1972 1976 1980 1984 1988 1992 1996 2000 2004 2008<br />
Figure <strong>25</strong>.7 Striped marlin catch history (IOTC<br />
convention area), 1970 to 2008<br />
NOTE: 2009 data are currently unavailable from the IOTC.<br />
stock status determination<br />
442 <strong>Fishery</strong> status reports 2 009<br />
Japanese longline fleet fishing in these water<br />
temperatures shows a major decline, falling<br />
to 6% of its initial level (late 1950s) (IOTC-<br />
WPB 2009), again suggesting an overfished<br />
status. However, given the poor quality of the<br />
data available for this stock, the 2009 status<br />
remains uncertain for both the overfished <strong>and</strong><br />
overfishing categories (Table <strong>25</strong>.1).<br />
reliability of the assessment/s<br />
Considerable uncertainty surrounds the<br />
degree to which the stock indicators used<br />
in 2009 represent abundance, since factors<br />
such as changes in targeting <strong>and</strong> discarding<br />
practices, fishing grounds <strong>and</strong> management<br />
practices are likely to interact with the trends.<br />
Aspects of the species’ biology (single<br />
spawning period, two spawning sites),<br />
productivity (Table <strong>25</strong>.5) <strong>and</strong> fisheries (large<br />
increases in the catch of unidentified billfish<br />
by gillnet fleets operating mainly in the<br />
waters of Sri Lanka, India <strong>and</strong> Pakistan in<br />
recent years) (IOTC 2010), combined with<br />
the lack of data on which to base a more<br />
formal assessment, are causes for concern.<br />
No quantitative stock assessment is currently<br />
available for striped marlin, <strong>and</strong> there is limited<br />
reliable information on the catches throughout<br />
the IOTC convention area. In addition, there is<br />
no information on the structure of the stock or<br />
growth <strong>and</strong> mortality. Thus, due to the lack of<br />
fishery data for several gears, only preliminary previous stock assessment/s<br />
stock indicators were used to determine stock A preliminary estimation of stock<br />
status. The longline catch <strong>and</strong> effort datasets indicators was attempted by the IOTC in<br />
from Japan <strong>and</strong> the Fishing Entity of Taiwan, 2008, with similar conclusions as those<br />
which represent the best available information, outlined above for 2009 (IOTC 2009).<br />
were examined.<br />
The nominal catch per unit effort (CPUE) Future assessment needs<br />
exhibited dramatic declines since the beginning Additional stock indicators for this species<br />
of the fishery in two major fishing grounds are required; in the absence of a quantitative<br />
(west equatorial <strong>and</strong> north-west Australia), stock assessment, such indicators are the<br />
<strong>and</strong> the catches in the initial core areas also only means to monitor the status of the<br />
decreased substantially (IOTC 2010). The stock <strong>and</strong> assess the impacts of fishing.<br />
continual decline shown by this indicator over<br />
time signals that the stock is being depleted<br />
<strong>and</strong> may be both overfished <strong>and</strong> subject to<br />
overfishing.<br />
The IOTC Working Party on <strong>Billfish</strong><br />
determined that striped marlin is primarily<br />
taken by longliners at sea-surface temperatures<br />
above <strong>25</strong> °C (93.5% of the total catches from<br />
1952 to 2007), <strong>and</strong> that these catches are from<br />
equatorial areas of the Indian Ocean <strong>and</strong> along<br />
the east African coast (IOTC WPB 2009).<br />
The annual nominal CPUE calculated for the Marlin research PHOTO: JULIAN PEPPERELL
SWordfiSh<br />
(Xiphius gladius)<br />
LINE DRAWING: GAVIN RYAN<br />
taBle <strong>25</strong>.6 Biology of swordfish<br />
Parameter Description<br />
Range<br />
Depth<br />
Longevity<br />
Species: Northern coastal state waters to<br />
50°S. Likely substocks. Juvenile<br />
swordfish are commonly found in<br />
tropical <strong>and</strong> subtropical waters <strong>and</strong><br />
migrate to higher latitudes as they<br />
mature. Large, solitary adult swordfish<br />
are most abundant at 15–35°S. Males are<br />
more common in tropical <strong>and</strong><br />
subtropical waters.<br />
Stock: Throughout the Indian Ocean<br />
<strong>Tuna</strong> Commission convention area<br />
(see Chapter 21). One pan-ocean stock<br />
has been assumed. However, spatial<br />
heterogeneity in stock indicators (catch<br />
per unit effort trends) indicates the<br />
potential for localised depletion of<br />
swordfish in the Indian Ocean.<br />
Extensive diel vertical migrations, from<br />
surface waters during the night to depths<br />
of 1000 m during the day<br />
30+ years<br />
Maturity (50%) age: females 6–7 years; males 1–3 years<br />
Size: females ~170 cm lower-jaw FL;<br />
males ~120 cm lower-jaw FL<br />
Spawning season Highly fecund batch spawner. May<br />
spawn as frequently as once every<br />
3 days over a period of several months<br />
in spring. Spawning occurs from<br />
October to April in the vicinity of<br />
Reunion Isl<strong>and</strong>.<br />
Size<br />
Maximum: 455 cm lower-jaw FL;<br />
550+ kg total weight in the Indian<br />
Ocean. Sexual dimorphism in size,<br />
growth rates <strong>and</strong> size <strong>and</strong> age at<br />
maturity—females reach larger sizes,<br />
grow faster <strong>and</strong> mature later than males.<br />
Most swordfish larger than 200 kg are<br />
female.<br />
Recruitment into the fishery: varies by<br />
fishing method; ~60 cm lower-jaw FL<br />
for artisanal fleets <strong>and</strong> methods.<br />
Swordfish taken by WTBF longliners<br />
are 20–100 kg (average 50 kg total<br />
weight). By one year of age, a swordfish<br />
may reach 90 cm lower-jaw FL<br />
(~15 kg).<br />
SOURCES: Froese & Pauly (2009); Poisson & Fauvel (2009);<br />
IOTC (2010).<br />
WTBF: Swordfish is the primary target<br />
species in the WTBF, <strong>and</strong> approximately<br />
68% of the total reported l<strong>and</strong>ings from<br />
2000 to 2009 were swordfish (Fig. <strong>25</strong>.3).<br />
In 2009 76% of the total reported l<strong>and</strong>ings<br />
in the WTBF were swordfish (349 t). A<br />
total of 1754 t of swordfish was taken by<br />
<strong>Australian</strong> operators from 2004 to 2009, at<br />
an average of 292 t per year. Peak catches<br />
of 2136 t were taken in 2001 (Fig. <strong>25</strong>.8).<br />
iOTC statistical area: In the 1990s,<br />
exploitation of swordfish increased markedly,<br />
from 7215 t taken in 1990 to 35 480 t in<br />
1998 (Fig. <strong>25</strong>.9). Catches then stabilised<br />
around 32 000 t from 1999 to 2002, before<br />
increasing to 36 190 t in 2003 <strong>and</strong> 36 267 t<br />
in 2004. The highest catches are taken in<br />
the south-west Indian Ocean; however, in<br />
recent years, the fishery has been extending<br />
eastward. Since the peak catches of 2004,<br />
catches have steadily declined to 23 235 t in<br />
2008 (Fig. <strong>25</strong>.9). The IOTC has determined the<br />
MSY to be 33 000 t annually (IOTC 2010).<br />
Catch (thous<strong>and</strong> tonnes)<br />
2.0<br />
1.5<br />
1.0<br />
0.5<br />
0.0<br />
Figure <strong>25</strong>.8 Catch: swordfish, WTBF<br />
Australia (domestic <strong>and</strong> charter)<br />
Japan (bilateral <strong>and</strong> joint venture)<br />
1985 1989 1993 1997 2001 2005 2009<br />
Figure <strong>25</strong>.8 Swordfish catch history (WTBF), 1983<br />
to 2009<br />
Swordfish unloading<br />
PHOTO: JOHN KALISH, ABARE–BRS<br />
chapter <strong>25</strong> <strong>Western</strong> <strong>Tuna</strong> <strong>and</strong> <strong>Billfish</strong> <strong>Fishery</strong> 443
Catch (thous<strong>and</strong> tonnes)<br />
40<br />
30<br />
20<br />
10<br />
0<br />
Figure <strong>25</strong>.9 Catch: swordfish, IOTC Convention Area<br />
<strong>Western</strong> area catch<br />
Eastern area catch<br />
1972 1976 1980 1984 1988 1992 1996 2000 2004 2008<br />
Figure <strong>25</strong>.9 Swordfish catch history (IOTC<br />
convention area), 1970 to 2008<br />
NOTE: 2009 data are currently unavailable from the IOTC.<br />
stock status determination<br />
A range of ocean-wide stock assessment<br />
models were used in 2009 by the IOTC to<br />
determine the status of the Indian Ocean<br />
swordfish stock. The stock-status reference<br />
points from the range of models varied<br />
considerably, but a number of general<br />
consistencies were evident. Given the<br />
limitations identified for each model, <strong>and</strong><br />
the uncertainties associated with the data<br />
inputs, restricting the stock status advice to<br />
a single model would likely understate the<br />
uncertainty. Here we attempt a qualitative<br />
summary across the models <strong>and</strong> data-based<br />
indicators described in the reports of the IOTC<br />
Working Party on <strong>Billfish</strong> (IOTC 2009) <strong>and</strong><br />
the IOTC Scientific Committee (IOTC 2010).<br />
The IOTC Scientific Committeee<br />
(SC) agreed that, based on the oceanwide<br />
assessment models run in 2009,<br />
MSY could reasonably be assumed to be<br />
approximately 33 000 t (~32 000–34 000 t)<br />
(IOTC 2010). The ocean-wide estimates<br />
of depletion ranged from B /B = 0.19 to<br />
2007 0<br />
0.87 (median = 0.48), suggesting that the<br />
Indian Ocean–wide stock is not overfished.<br />
Comparison across models suggests<br />
that current catches are probably near the<br />
level of MSY (F /F = 0.79), but could<br />
2007 MSY<br />
be somewhat higher or lower depending on<br />
the model used, suggesting the ocean-wide<br />
444 <strong>Fishery</strong> status reports 2 009<br />
stock is not subject to overfishing. However,<br />
the fidelity of swordfish to particular areas<br />
is a matter for concern as this can lead to<br />
localised depletion that would undermine<br />
the findings of ocean-wide assessments<br />
(IOTC 2010). Localised depletion has<br />
occurred in other parts of the world where<br />
swordfish have been heavily targeted.<br />
In previous years, localised depletion was<br />
inferred on the basis of decreasing CPUE,<br />
following fine-scale analyses of the catch<br />
<strong>and</strong> effort data. In 2009 four sub-areas of the<br />
IOTC convention area were again examined.<br />
The CPUE of the Japanese fleet in the southwest<br />
Indian Ocean demonstrated the greatest<br />
decline of the four areas examined; the La<br />
Reunion (French territories) CPUE series<br />
also showed a declining trend in the same<br />
area over the past 11 years. Therefore, the<br />
possibility that localised depletion is still<br />
occurring in some areas cannot be ruled out.<br />
Given the general declining trend in all the<br />
CPUE series, the IOTC expects that abundance<br />
will likely decline further at current effort<br />
levels, especially considering that increases in<br />
efficiency have not been fully addressed in the<br />
current CPUE st<strong>and</strong>ardisation (IOTC 2010).<br />
The reported CPUE declines are a cause<br />
for concern, <strong>and</strong> we consider these to outweigh<br />
the non-spatially separated (ocean-wide)<br />
assessments carried out in 2009. In addition,<br />
in 2009 an exploratory assessment using<br />
Stock Synthesis 3 software was undertaken by<br />
Kolody et al. (2009). The model disaggregated<br />
the stock by age, sex <strong>and</strong> four subregions.<br />
Although preliminary, the results support<br />
the conclusion that localised depletion is<br />
occurring in the south-west, <strong>and</strong> to a lesser<br />
extent the north-west, of the Indian Ocean<br />
due to overfishing. It is therefore highly likely<br />
that the stock is subject to overfishing in the<br />
south-west Indian Ocean, <strong>and</strong> possibly other<br />
areas (e.g. north-west). At this point, there<br />
is insufficient information to determine if<br />
these sub-areas have been depleted to below<br />
the HSP biomass limit reference point of<br />
B 20 , <strong>and</strong> therefore the overfished status is<br />
assessed as uncertain (Table <strong>25</strong>.1) based on<br />
subregional depletion rather than the oceanwide<br />
assessment results discussed above.
eliability of the assessment/s<br />
The 2009 stock status estimates varied<br />
considerably between assessment models,<br />
indicating a high degree of uncertainty.<br />
MSY estimates of ~28 000–34 000 t are at<br />
the lower end of the range for some models<br />
<strong>and</strong> the upper end of the range for others.<br />
All approaches suggest that depletion could<br />
reliably be considered in the range of 0.4–0.5<br />
(B /B ), although this may also be an upper<br />
2007 0<br />
or lower end of the plausible range, depending<br />
on the model (IOTC 2010).<br />
The longline Japanese <strong>and</strong> Taiwanese<br />
CPUE series show conflicting trends: the<br />
Japanese (byproduct) fleet data suggest<br />
substantial decline in abundance before around<br />
2000, <strong>and</strong> the Taiwanese (targeted) fleet data<br />
suggest stable abundance over this period<br />
(IOTC 2010).<br />
Given the general recent declining trend<br />
in all the CPUE series, <strong>and</strong> the fully exploited<br />
status of the stock, abundance will decline<br />
further at current effort levels, especially<br />
considering that the issue of increases in<br />
efficiency has not been fully addressed in the<br />
current st<strong>and</strong>ardisation (IOTC 2010). With the<br />
uncertainty in the assessments, there is a high<br />
probability that limit reference points have<br />
been, or will be, exceeded in the near future;<br />
<strong>and</strong> this will become more likely if effort<br />
remains at current levels or increases further.<br />
Precautionary measures, such as capacity<br />
control or catch limits, will reduce the risk of<br />
creating an overcapacity problem or exceeding<br />
the biomass limit reference point (B20).<br />
previous assessment/s<br />
In 2004 the IOTC reviewed trends in<br />
st<strong>and</strong>ardised catch rates for the longline fleets<br />
of Japan <strong>and</strong> Taiwan. There was a constant<br />
pattern of decline in all areas exploited, with<br />
more pronounced declines for the Japanese<br />
longliners. Large uncertainties existed about<br />
stock structure <strong>and</strong> the effects of variations in<br />
targeting. The mean weights of swordfish taken<br />
by various fleets showed no clear trend during<br />
the 1990s. It was concluded that the rapid<br />
increase in swordfish catches throughout the<br />
Indian Ocean in the late 1990s was unlikely to<br />
be sustainable in the long term. An assessment<br />
in 2006 indicated that the stock was probably<br />
not overfished, but that levels of fishing<br />
were too high (F current > F MSY), particularly in<br />
localised areas in the south-west Indian Ocean.<br />
MSY estimates ranged between 23 540 t <strong>and</strong><br />
27 000 t, whereas the 2006 catch was 29 185 t.<br />
The results of the IOTC’s 2008 stock<br />
assessment (using 2006 data) were more<br />
optimistic than those from 2006, when<br />
overfishing was considered to have occurred.<br />
Based on the point estimates <strong>and</strong> confidence<br />
limits, the assessment model results indicated<br />
that overfishing of the swordfish stock in the<br />
Indian Ocean was not occurring, <strong>and</strong> the<br />
stock appeared not to be in an overfished<br />
state. However, more recent catch levels<br />
(averaging 32 658 t per year between 2002<br />
<strong>and</strong> 2006) were slightly above the estimate<br />
of MSY (31 500 t; 80% confidence limits<br />
24 500 t to 34 400 t) (IOTC 2008). In addition,<br />
the CPUE of the Japanese fleet in the southwest<br />
Indian Ocean exhibited the strongest<br />
decline of the four main fishing grounds<br />
examined in 2008. Furthermore, the La<br />
Reunion CPUE series showed a declining<br />
trend in the area over the past 10 years. Based<br />
on the declining CPUE trends <strong>and</strong> likely<br />
localised depletion in 2008, it was considered<br />
highly likely that overfishing was occurring<br />
in the south-west Indian Ocean, although<br />
the biomass of the stock was uncertain.<br />
Future assessment needs<br />
The 2009 assessments do not yet show<br />
clear signals of declines in the size-based<br />
indices, but these indices should be carefully<br />
monitored. Since females mature at a larger<br />
size than males, a reduction in the biomass<br />
of large animals could potentially have a<br />
strong effect on the spawning biomass. The<br />
exploratory assessment carried out by Kolody<br />
et al. (2009) that disaggregated the stock<br />
by age, sex <strong>and</strong> four subregions should be<br />
further refined to take into account spatial<br />
heterogeneity in stock structure.<br />
chapter <strong>25</strong> <strong>Western</strong> <strong>Tuna</strong> <strong>and</strong> <strong>Billfish</strong> <strong>Fishery</strong> 445
albacore tuna<br />
(Thunnus alalunga)<br />
LINE DRAWING: FAO<br />
taBle <strong>25</strong>.7 Biology of albacore tuna<br />
Parameter Description<br />
Range Species: Temperate tuna species<br />
living mainly in mid-oceanic gyres<br />
of the Pacific, Indian <strong>and</strong> Atlantic<br />
oceans. Distributed from 5°N to<br />
40°S in the Indian Ocean; some<br />
mixing with the Atlantic Ocean<br />
likely. Highly migratory. Pre-adults<br />
(2–5 years old) appear to be more<br />
migratory than adults.<br />
Stock: Throughout the Indian Ocean<br />
<strong>Tuna</strong> Commission convention area<br />
(see Chapter 21). In the Indian<br />
Ocean, there is probably only one<br />
southern stock because there is no<br />
northern gyre.<br />
Depth 0–600 m<br />
Longevity ~8 years (Indian Ocean). However,<br />
this may be an underestimate as<br />
albacore have been reported to live<br />
to at least 10 years in the Pacific<br />
Ocean.<br />
Maturity (50%) age: 5–6 years<br />
Size: ~90 cm FL<br />
Spawning season Main spawning grounds appear to be<br />
east of Madagascar between 15°S<br />
<strong>and</strong> <strong>25</strong>°S. Spawn in warm waters<br />
(sea-surface temperature ><strong>25</strong> °C)<br />
during the 4th <strong>and</strong> 1st quarters of<br />
each year.<br />
Size Maximum: reported to 140 cm FL;<br />
~60 kg whole weight<br />
Recruitment into the fishery:<br />
45–50 cm FL; 2–2.5 kg whole<br />
weight<br />
SOURCES: Froese & Pauly (2009); IOTC (2010).<br />
446 <strong>Fishery</strong> status reports 2 009<br />
WTBF: A total of 85 t of albacore tuna<br />
was taken by <strong>Australian</strong> operators in the<br />
area of the WTBF from 2004 to 2009, at<br />
an average of 14 t per year. Peak catches of<br />
almost 94 t were taken in 2001 (Fig. <strong>25</strong>.10).<br />
iOTC statistical area: In the Indian<br />
Ocean, most (98%) of the albacore catch is<br />
taken by longliners from Taiwan <strong>and</strong> Japan<br />
operating between 20°S <strong>and</strong> 40°S, with<br />
remaining catches taken by purse seine <strong>and</strong><br />
other gear. Large catches of juvenile albacore<br />
were taken by drifting gillnets in the southern<br />
Indian Ocean (30–40°S) between 1985 <strong>and</strong><br />
1992, with peak gillnet catches in excess of<br />
<strong>25</strong> 000 t taken in 1990 (IOTC 2010). Annual<br />
catches declined following the cessation of<br />
drift gillnetting, <strong>and</strong> increased again from 1998<br />
to 2001 (ranging from 37 674 t to 43 7<strong>25</strong> t).<br />
In contrast, the average annual catch for<br />
2003 to 2006 was 24 805 t (Fig. <strong>25</strong>.11). In<br />
2007 <strong>and</strong> 2008, catches returned to pre-2003<br />
levels, with 33 228 t <strong>and</strong> 33 056 t l<strong>and</strong>ed,<br />
respectively (Fig. <strong>25</strong>.11). Since 2003 catches<br />
have been distributed almost equally between<br />
the western <strong>and</strong> eastern Indian Ocean (slightly<br />
more in the west). The IOTC has determined<br />
the MSY for this stock to be within the range<br />
28 260–34 415 t annually (IOTC 2010).<br />
Catch (thous<strong>and</strong> tonnes)<br />
0.12<br />
0.10<br />
0.08<br />
0.06<br />
0.04<br />
0.02<br />
0.00<br />
Figure <strong>25</strong>.10 Catch: albacore tuna, WTBF<br />
Australia (domestic <strong>and</strong> charter)<br />
Japan (bilateral <strong>and</strong> joint venture)<br />
1985 1988 1991 1994 1997 2000 2003 2006 2009<br />
Figure <strong>25</strong>.10 Albacore tuna catch history (WTBF),<br />
1983 to 2009
Catch (thous<strong>and</strong> tonnes)<br />
50<br />
40<br />
30<br />
20<br />
10<br />
0<br />
Figure <strong>25</strong>.11 Catch: albacore tuna, IOTC Convention Area<br />
<strong>Western</strong> area catch<br />
Eastern area catch<br />
1972 1976 1980 1984 1988 1992 1996 2000 2004 2008<br />
Figure <strong>25</strong>.11 Albacore tuna catch history (IOTC<br />
convention area), 1970 to 2008<br />
NOTE: 2009 data are currently unavailable from the IOTC.<br />
stock status determination<br />
Stock status was determined for 2009 using<br />
the most recent catch <strong>and</strong> effort data (2008),<br />
in conjunction with the IOTC’s 2008 stock<br />
assessment. In the absence of a specified<br />
biomass limit reference point, the HSP<br />
defaults (see DAFF 2007) were used to<br />
determine status. In 2008 the IOTC completed<br />
an assessment of the Indian Ocean fishery<br />
using an age-structured production model<br />
to examine the effect on stock status of the<br />
interaction between age at selection by the<br />
fishery <strong>and</strong> age at maturity (IOTC 2009). The<br />
analysis used total catch biomass (1950 to<br />
2007) <strong>and</strong> Taiwanese longline data on CPUE<br />
(1980 to 2006) to estimate model parameters.<br />
Other fishery-dependent indicators show<br />
considerable stability over long periods. The<br />
IOTC assessment found no indications that<br />
the stock is overfished (B2007/BMSY > 1; B2007/ B0 > 0.2), <strong>and</strong> overfishing is currently unlikely<br />
to be occurring (F2007/FMSY = 0.48–0.91)<br />
(IOTC 2010). Estimates of MSY from the<br />
assessment ranged from 28 260 t to 34 415 t,<br />
<strong>and</strong> the total catch in 2008 was 33 056 t.<br />
Despite catches returning to pre-2003<br />
levels in 2007 <strong>and</strong> 2008 (Fig. <strong>25</strong>.11), they<br />
are still considered to be within sustainable<br />
levels. Thus, based on the preliminary analyses<br />
undertaken in 2008 <strong>and</strong> the most recent<br />
catches, there are no indications that the<br />
albacore stock is overfished, <strong>and</strong> overfishing<br />
is not likely to be occurring for the scenarios<br />
envisaged. Thus, the Indian Ocean albacore<br />
tuna stock is assessed as not overfished <strong>and</strong><br />
not subject to overfishing (Table <strong>25</strong>.1).<br />
reliability of the assessment/s<br />
The nominal catch statistics for albacore tuna<br />
recorded in the IOTC databases are thought<br />
to be complete until the mid-1980s (IOTC<br />
2010). Catch <strong>and</strong> effort data are fully or almost<br />
fully available up to the early 1990s, but only<br />
partially available since then, due to the almost<br />
complete lack of catch <strong>and</strong> effort records<br />
from the Indonesian longline fleet. The effort<br />
statistics are thought to be of good quality for<br />
most of the fleets for which longline catches<br />
series are available, with the exception of the<br />
Republic of Korea <strong>and</strong> the Philippines (IOTC<br />
2010). Data for these countries are not used in<br />
the assessment.<br />
There were considerable differences<br />
in the estimates of some stock parameters<br />
(the current levels of exploitation, <strong>and</strong><br />
current levels relative to MSY levels) in the<br />
assessments by the IOTC in 2008. Accuracy<br />
of the assessment is considered acceptable,<br />
despite the 2008 stock assessment being<br />
carried out on preliminary catch data from<br />
2007 (interim figure of 31 226 t used). The<br />
final l<strong>and</strong>ing figure of 34 174 t is at the<br />
upper end of the MSY range (IOTC 2009).<br />
previous assessment/s<br />
An assessment of the status of albacore tuna<br />
in the Indian Ocean was attempted in 2004,<br />
but results were inconclusive (stock status<br />
uncertain). Indicators such as average fish size<br />
<strong>and</strong> catch rates showed no signs of decline.<br />
Future assessment needs<br />
The dynamics of Indian Ocean albacore tuna<br />
appear to have a well-defined spatial nature,<br />
with relatively few juvenile <strong>and</strong> immature fish<br />
available to the fishery. Additional information<br />
is needed on the spawning condition of fish by<br />
location, growth <strong>and</strong> maturity. Improvements<br />
to the current indices of abundance <strong>and</strong><br />
interpretation of catch data are also needed.<br />
chapter <strong>25</strong> <strong>Western</strong> <strong>Tuna</strong> <strong>and</strong> <strong>Billfish</strong> <strong>Fishery</strong> 447
igeye tuna<br />
(Thunnus obesus)<br />
LINE DRAWING: FAO<br />
taBle <strong>25</strong>.8 Biology of bigeye tuna<br />
Parameter Description<br />
Range Species: Inhabit the tropical <strong>and</strong><br />
subtropical waters of the Pacific,<br />
Atlantic <strong>and</strong> Indian Oceans.<br />
Stock: Throughout the Indian Ocean<br />
<strong>Tuna</strong> Commission convention area<br />
(see Chapter 21). Large movements<br />
of bigeye tuna identified through<br />
tagging research support the<br />
assumption of a single stock for the<br />
Indian Ocean.<br />
Depth Adult bigeye tuna are normally<br />
found below 150 m, to a maximum<br />
depth of 300 m during the day <strong>and</strong> in<br />
warmer surface waters at night.<br />
Juveniles frequently school at the<br />
surface underneath floating objects.<br />
Longevity 15+ years (Indian Ocean)<br />
Maturity (50%) age: ~3 years<br />
Size: ~100 cm FL<br />
Spawning season Spawn in equatorial waters<br />
throughout the year.<br />
Size Maximum: 200 cm FL (<strong>25</strong>0 cm<br />
TL); 210 kg whole weight (~180 kg<br />
when 8 years)<br />
Recruitment into the fishery:<br />
~30 cm FL (purse seine), ~60 cm FL<br />
(longline)<br />
SOURCES: Froese & Pauly (2009); IOTC (2010).<br />
WTBF: A total of 338 t of bigeye<br />
tuna was taken by <strong>Australian</strong> operators<br />
from 2004 to 2009, at an average of<br />
approximately 56 t per year. Peak catches<br />
of 436 t were taken in 2000 (Fig. <strong>25</strong>.12).<br />
iOTC statistical area: Total annual<br />
catches of bigeye tuna from the Indian Ocean<br />
have increased steadily since the start of<br />
448 <strong>Fishery</strong> status reports 2 009<br />
the fishery, reaching 100 000 t in 1993 <strong>and</strong><br />
peaking at 151 135 t in 1999 (Fig. <strong>25</strong>.13).<br />
Since 2000 catches have remained relatively<br />
stable, averaging 128 575 t for 2000–06,<br />
with 1<strong>25</strong> 029 t taken in 2007. In 2008 total<br />
catch decreased to 110 288 t. Approximately<br />
three-quarters of the catch is taken from<br />
the western Indian Ocean. The IOTC has<br />
determined the maximum sustainable<br />
yield for this stock to be approximately<br />
110 000 t annually (IOTC 2010).<br />
Catch (thous<strong>and</strong> tonnes)<br />
1.0<br />
0.8<br />
0.6<br />
0.4<br />
0.2<br />
0.0<br />
Figure <strong>25</strong>.12 Catch: bigeye tuna, WTBF<br />
Australia (domestic <strong>and</strong> charter)<br />
Japan (bilateral <strong>and</strong> joint venture)<br />
1985 1989 1993 1997 2001 2005 2009<br />
Figure <strong>25</strong>.12 Bigeye tuna catch history (WTBF),<br />
1983 to 2009<br />
Catch (thous<strong>and</strong> tonnes)<br />
150<br />
100<br />
50<br />
0<br />
Figure <strong>25</strong>.13 Catch: bigeye tuna, IOTC Convention Area<br />
<strong>Western</strong> area catch<br />
Eastern area catch<br />
1972 1976 1980 1984 1988 1992 1996 2000 2004 2008<br />
Figure <strong>25</strong>.13 Bigeye tuna catch history (IOTC<br />
convention area), 1970 to 2008<br />
NOTE: 2009 data are currently unavailable from the IOTC.
stock status determination<br />
In 2009 the IOTC applied four stock<br />
assessment models to the Indian Ocean bigeye<br />
tuna stock, with the age-structured production<br />
model (ASPM) model being selected as the<br />
most reliable (IOTC 2010). It was considered<br />
that the other assessment approaches needed<br />
further exploration <strong>and</strong> development.<br />
In the absence of a specified biomass limit<br />
reference point, the HSP defaults (see DAFF<br />
2007) are used to determine stock status. The<br />
2009 assessment indicated that the current<br />
(2008) spawning stock biomass is above the<br />
default biomass limit reference points (SB2008/ SB0 = 0.34; SB2008/SBMSY = 1.17). Therefore,<br />
the stock is assessed as not overfished (Table<br />
<strong>25</strong>.1). The total catch of bigeye tuna in 2008<br />
(110 288 t) is at the current estimate of<br />
MSY (110 000 t). The ASPM assessment,<br />
using partial 2008 catch data, estimated<br />
that the 2008 catch is close to the MSY<br />
(F2008/FMSY = 0.90). Thus, the Indian Ocean<br />
bigeye tuna stock is assessed as not subject<br />
to overfishing. However, biomass trajectories<br />
indicate that the spawning stock biomass<br />
has been declining since the late 1970s <strong>and</strong><br />
is now just below the HSP default biomass<br />
target. Combined with fishing mortality<br />
rates that have been increasing steadily since<br />
the 1980s (IOTC 2010), this indicates that<br />
the stock will move towards an overfished<br />
state in coming years unless measures<br />
are taken to reduce fishing mortality.<br />
reliability of the assessment/s<br />
Uncertainty in the assessment arises from<br />
unquantified improvements in fishing<br />
efficiency, inadequate size data from recent<br />
longline catches <strong>and</strong> poor estimates of bigeye<br />
tuna growth <strong>and</strong> mortality rates. In the western<br />
Indian Ocean, there has been a rapid increase<br />
in the number of juvenile bigeye tuna caught<br />
by purse-seine fishing around drifting fishaggregating<br />
devices. In addition, although<br />
the various models used by the IOTC in<br />
2009 to estimate MSY broadly agreed, they<br />
produced quite different estimates of absolute<br />
levels of virgin <strong>and</strong> current biomass (IOTC<br />
2010). This was probably due to how the<br />
variations in CPUE were interpreted by each<br />
model. The indices of abundance from two<br />
longline fleets (Japanese <strong>and</strong> Taiwanese) for<br />
this stock present divergent trends over the<br />
past few years, <strong>and</strong> the differences observed<br />
in targeting are not fully explained.<br />
previous assessment/s<br />
The origin of bigeye tuna recruits to the<br />
western AFZ is not known, <strong>and</strong> there is<br />
no specific bigeye tuna assessment for the<br />
WTBF. However, the IOTC’s Working<br />
Party on Tropical <strong>Tuna</strong>s used age-structured<br />
models in 2004 <strong>and</strong> 2006 to assess the<br />
status of bigeye tuna in the Indian Ocean.<br />
The models indicated that the bigeye tuna<br />
biomass was above the size needed to<br />
support MSY, suggesting that the stock was<br />
not overfished. Catches for several years<br />
before 2005 were above MSY, implying that<br />
overfishing was occurring. A more optimistic<br />
assessment in 2006 <strong>and</strong> reduced catches in<br />
2005 suggested that the reported catch was<br />
around MSY <strong>and</strong> that fishing mortality was<br />
below the level that produces MSY (FMSY). The assessment results were treated with<br />
caution because there was concern that the<br />
reduced catches of bigeye tuna were linked<br />
to high catches of yellowfin tuna, <strong>and</strong> that<br />
fishing effort was returning to the pattern that<br />
produced higher catches in previous years.<br />
In 2008 the IOTC applied a surplus<br />
production model to Japanese longline<br />
CPUE <strong>and</strong> total catch biomass data.<br />
This was considered to be a preliminary<br />
analysis; however, the results indicated<br />
that the probability (86%) of B2007 being<br />
greater than BMSY was high (IOTC 2009).<br />
Future assessment needs<br />
Uncertainties in the assessments need to be<br />
reduced by improving available indices of<br />
abundance, size information for the catches<br />
of longline fisheries, catch-at-size <strong>and</strong> catchat-age<br />
data, information on rates of natural<br />
mortality at various life stages (Table <strong>25</strong>.8)<br />
<strong>and</strong> information on changes in fishing power.<br />
chapter <strong>25</strong> <strong>Western</strong> <strong>Tuna</strong> <strong>and</strong> <strong>Billfish</strong> <strong>Fishery</strong> 449
longtail tuna<br />
(Thunnus tonggol)<br />
LINE DRAWING: FAO<br />
taBle <strong>25</strong>.9 Biology of longtail tuna<br />
Parameter Description<br />
Range Species: Tropical <strong>and</strong> subtropical<br />
neritic (coastal) waters globally,<br />
between 47ºN <strong>and</strong> 33ºS. Limited<br />
data available on stock structure<br />
throughout its worldwide<br />
distribution.<br />
Stock: Throughout the Indian Ocean<br />
<strong>Tuna</strong> Commission Convention Area<br />
(see Chapter 21). Very little is<br />
known of the movements of fish in<br />
the WTBF, or whether fish move<br />
from the AFZ into the waters of<br />
neighbouring countries such as<br />
Indonesia. In the absence of reliable<br />
evidence relating to stock structure,<br />
a precautionary approach was<br />
undertaken by assuming longtail<br />
tuna exist as a single stock in the<br />
wider IOTC area.<br />
Depth Juveniles mainly limited to surface<br />
waters, while larger fish are found in<br />
surface <strong>and</strong> subsurface waters (10 m<br />
to an unknown maximum).<br />
Longevity ~19 years<br />
Maturity (50%) age: 1 year<br />
Size: ~40–46 cm FL; 4–5 kg<br />
Spawning season The spawning season varies<br />
according to location. Off the west<br />
coast of Thail<strong>and</strong>, there are two<br />
distinct spawning seasons: January–<br />
April <strong>and</strong> August–September.<br />
Probably spawns more than once a<br />
year throughout its range, similar to<br />
other species of tuna.<br />
Size Maximum: ~145 cm FL; ~36 kg<br />
whole weight; most common size in<br />
the Indian Ocean is 40–70 cm<br />
Recruitment into the fishery: 2–3<br />
years in the WTBF<br />
SOURCES: Froese & Pauly (2009); Griffiths et al. (2010); IOTC (2010);<br />
Griffiths (in press).<br />
450 <strong>Fishery</strong> status reports 2 009<br />
WTBF: A total of 55 t of longtail tuna was<br />
taken by <strong>Australian</strong> commercial operators from<br />
2006 to 2009. Peak catches of 32 t were taken<br />
in 1998 by minor-line methods (Fig. <strong>25</strong>.14).<br />
The recreational take has not been determined.<br />
iOTC statistical area: Longtail tuna<br />
catches in 2008 (103 082 t) were higher<br />
than the average catch taken from 2003 to<br />
2007 (92 920 t) (Fig. <strong>25</strong>.15). Longtail tuna<br />
is caught mainly by gillnet <strong>and</strong> to a lesser<br />
extent by artisanal purse seiners. The majority<br />
of the catch is taken from the western Indian<br />
Ocean area (IOTC 2010). In recent years,<br />
the countries with the highest catches of<br />
longtail tuna are Indonesia, Iran, Oman,<br />
Yemen <strong>and</strong> Pakistan. The IOTC has limited<br />
data to determine whether current catch<br />
levels are too high <strong>and</strong> has made this stock<br />
a priority for assessment (IOTC 2010).<br />
Catch (thous<strong>and</strong> tonnes)<br />
0.04<br />
0.03<br />
0.02<br />
0.01<br />
0.00<br />
Fig. <strong>25</strong>.14 Catch: longtail tuna, WTBF<br />
1994 1997 2000 2003 2006 2009<br />
Figure <strong>25</strong>.14 Longtail tuna catch history (WTBF),<br />
1994 to 2009<br />
Longline hooks PHOTO: AFMA
Catch (thous<strong>and</strong> tonnes)<br />
120<br />
100<br />
80<br />
60<br />
40<br />
20<br />
0<br />
Figure <strong>25</strong>.15 Catch: longtail tuna, IOTC Convention Area<br />
<strong>Western</strong> area catch<br />
Eastern area catch<br />
1972 1976 1980 1984 1988 1992 1996 2000 2004 2008<br />
Figure <strong>25</strong>.15 Longtail tuna catch history (IOTC<br />
Convention Area), 1970 to 2008<br />
NOTE: 2009 data are currently unavailable from the IOTC.<br />
stock status determination<br />
Longtail tuna has been included in this year’s<br />
report for the first time. The criteria for<br />
stock inclusion in the <strong>Fishery</strong> status reports<br />
are outlined in Chapter 1. In the case of<br />
longtail tuna, they are currently considered<br />
an important byproduct stock in the WTBF,<br />
but more importantly, the IOTC consider<br />
this species to be of high ecological <strong>and</strong><br />
economical importance thoughout the IOTC<br />
Convention Area. The IOTC has identified this<br />
stock as a key target species for many coastal<br />
states <strong>and</strong> identified it as a high priority for<br />
formal stock assessment by the Working Party<br />
on Neritic <strong>Tuna</strong>s as early as possible (IOTC<br />
2010). In the WTBF, recent commercial catch<br />
levels have exceeded those of other quota<br />
species assessed for biological status (albacore<br />
tuna <strong>and</strong> yellowfin tuna). A catch limit of<br />
35 t applies to longtail tuna in the WTBF.<br />
No quantitative stock assessment or<br />
analysis of CPUE trends is currently available<br />
for longtail tuna throughout the IOTC<br />
Convention Area. However, an assessment<br />
recently completed by Griffiths et al.<br />
(2010) for longtail tuna off the east <strong>and</strong> the<br />
northern <strong>Australian</strong> coast, found that the<br />
stock is currently not subject to overfishing,<br />
noting that the assessed stock had limited<br />
overlap with the IOTC Convention Area.<br />
In the area of the WTBF, historical<br />
catches by commercial fishers are unlikely<br />
to have resulted in substantial localised<br />
depletion of the stock; however, recreational<br />
catches are unquantified. Given the<br />
restricted coastal distribution of lontail tuna<br />
<strong>and</strong> their slow growth rates, they may be<br />
particularly vulnerable to overexploitation<br />
by sport fishers in the AFZ <strong>and</strong> artisanal<br />
fishers within the IOTC convention area.<br />
It remains uncertain whether catch rates in<br />
<strong>and</strong> near the AFZ are affected by broader<br />
Indian Ocean catches, such as those from<br />
Indonesia. Due to these uncertainties,<br />
the overfished <strong>and</strong> overfishing status for<br />
longtail tuna is uncertain (Table <strong>25</strong>.1).<br />
reliability of the assessment/s<br />
Not applicable.<br />
previous assessment/s<br />
None.<br />
Future assessment needs<br />
The IOTC SC noted in 2009 that catches<br />
of longtail tuna are continuing to increase<br />
(IOTC 2010). Management decisions are<br />
complicated by uncertainties about the<br />
degree of stock mixing between the WTBF<br />
<strong>and</strong> broader regions, <strong>and</strong> research to<br />
determine the level of mixing is required.<br />
Quantification of the total recreational<br />
<strong>and</strong> artisanal take is urgently needed.<br />
Longliner crew about to haul line<br />
PHOTO: DAVE CRANSTON, AFMA<br />
chapter <strong>25</strong> <strong>Western</strong> <strong>Tuna</strong> <strong>and</strong> <strong>Billfish</strong> <strong>Fishery</strong> 451
yelloWfin tuna<br />
(Thunnus albacares)<br />
LINE DRAWING: FAO<br />
taBle <strong>25</strong>.10 Biology of yellowfin tuna<br />
Parameter Description<br />
Range Species: Tropical <strong>and</strong> subtropical<br />
waters globally.<br />
Stock: Throughout the Indian Ocean<br />
<strong>Tuna</strong> Commission convention area<br />
(see Chapter 21). Large movements<br />
of yellowfin tuna identified through<br />
tagging research, support the<br />
assumption of a single stock for the<br />
Indian Ocean.<br />
Depth Juveniles mainly limited to surface<br />
waters, while larger fish are found in<br />
surface <strong>and</strong> subsurface waters.<br />
Archival tagging has shown that<br />
they dive to depths of more than<br />
1000 m, probably to feed on<br />
mesopelagic prey.<br />
Longevity 9 years<br />
Maturity (50%) age: ~2 years (~<strong>25</strong> kg)<br />
Size: ~100 cm FL<br />
Spawning season Mainly December–March in the<br />
equatorial area (0–10°S), with the<br />
main spawning grounds west of<br />
75°E.<br />
Secondary spawning grounds exist<br />
off Sri Lanka <strong>and</strong> the Mozambique<br />
Channel <strong>and</strong> in the eastern Indian<br />
Ocean off Australia. Spawn where<br />
sea-surface temperatures are at least<br />
26 °C. May spawn every one or two<br />
days over several months.<br />
Size Maximum: ~180 cm FL (estimates<br />
from the Pacific are much larger);<br />
200 kg whole weight<br />
Recruitment into the fishery:<br />
~30 cm FL; varies by fishing method<br />
SOURCES: Froese & Pauly (2009); IOTC (2010).<br />
452 <strong>Fishery</strong> status reports 2 009<br />
WTBF: A total of 265 t of yellowfin tuna<br />
was taken by <strong>Australian</strong> longline operators<br />
from 2004 to 2009, at an average of 44 t per<br />
year. The minor-line fleet reported 2 t l<strong>and</strong>ed<br />
over the same period. Peak catches of 557 t<br />
<strong>and</strong> 10 t were taken in 2001 by the longline<br />
<strong>and</strong> minor-line fleets, respectively (Fig. <strong>25</strong>.16).<br />
iOTC statistical area: Yellowfin catches<br />
in 2008 (322 272 t) were slightly lower than<br />
the average catch taken from 1998 to 2002<br />
(331 771 t); in the 2003–06 period, the average<br />
annual catch was 461 <strong>25</strong>0 t (Fig. <strong>25</strong>.17). The<br />
artisanal fishery component in the Indian<br />
Ocean (mainly using pole <strong>and</strong> line, driftnet <strong>and</strong><br />
h<strong>and</strong>line) is substantial, taking an estimated<br />
35% of the total yellowfin tuna catches during<br />
2000–2008 (IOTC 2010). The majority of the<br />
catch is taken from the north-western Indian<br />
Ocean (north of 12°S) <strong>and</strong> in the Mozambique<br />
Channel (north of <strong>25</strong>°S). The IOTC has<br />
determined the annual MSY for this stock to be<br />
approximately 300 000 t (IOTC 2010).<br />
Catch (thous<strong>and</strong> tonnes)<br />
1.0<br />
0.8<br />
0.6<br />
0.4<br />
0.2<br />
0.0<br />
Figure <strong>25</strong>.16 Catch: yellowfin tuna, WTBF<br />
Australia (domestic <strong>and</strong> charter)<br />
Japan (bilateral <strong>and</strong> joint venture)<br />
1985 1989 1993 1997 2001 2005 2009<br />
Figure <strong>25</strong>.16 Yellowfin tuna catch history (WTBF),<br />
1983 to 2009<br />
stock status determination<br />
Multiple runs of the Multifan-CL assessment<br />
model were carried out in 2009 <strong>and</strong> included<br />
important information from the IOTC tagging<br />
program (i.e. growth, natural mortality,<br />
movement patterns). The 2009 assessment<br />
indicates that recent levels of fishing mortality<br />
are at historically high levels <strong>and</strong> that the stock<br />
experienced a period of overfishing from 2003<br />
to 2006.
Catch (thous<strong>and</strong> tonnes)<br />
500<br />
400<br />
300<br />
200<br />
100<br />
0<br />
Figure <strong>25</strong>.17 Catch: yellowfin tuna, IOTC Convention Area<br />
<strong>Western</strong> area catch<br />
Eastern area catch<br />
1972 1976 1980 1984 1988 1992 1996 2000 2004 2008<br />
Figure <strong>25</strong>.17 Yellowfin tuna catch history (IOTC<br />
convention area), 1970 to 2008<br />
NOTE: 2009 data are currently unavailable from the IOTC.<br />
Estimates of total <strong>and</strong> spawning stock<br />
biomass (SSB) continue to decline; this decline<br />
was probably accelerated by the high catches<br />
of 2003 to 2006 (IOTC 2010), despite recent<br />
catches returning to pre-2003 levels. Current<br />
catches (322 272 t in 2008) are higher than<br />
the estimated MSY of 300 000 t, <strong>and</strong> annual<br />
catches over 2003–2006 (averaging 461 <strong>25</strong>0 t)<br />
were substantially higher than all estimated<br />
values of MSY.<br />
The 2009 stock assessment indicated<br />
that the SSB for 2008 was close to the limit<br />
reference point of SSB 20, <strong>and</strong> fishing mortality<br />
levels were well in excess of MSY. This<br />
would indicate that the stock is close to an<br />
overfished state <strong>and</strong> subject to overfishing.<br />
However, given the preliminary nature of the<br />
catch, effort <strong>and</strong> size data for 2008, <strong>and</strong> the<br />
known difficulties of the model in estimating<br />
population levels for this stock in the final<br />
year of the series (which may lead to an<br />
exaggerated estimate of the decline of adult<br />
biomass <strong>and</strong> a pessimistic diagnosis of the<br />
status of the stock), the IOTC SC considered<br />
that management advice should be based on<br />
the status of the stock to 2007 (data until the<br />
end of 2007). The IOTC noted that the stock<br />
assessment model, run using data up to the end<br />
of 2008, indicates that the stock is likely to<br />
have moved into an overfished state.<br />
Using catch <strong>and</strong> effort data up to the end of<br />
2007, the assessment carried out in 2009 by the<br />
IOTC (IOTC 2010) indicates that the estimate<br />
of spawning biomass is above the default<br />
limit reference point (SB 2007 /SB 0 = 0.34),<br />
<strong>and</strong> therefore yellowfin tuna is assessed as<br />
not overfished (Table <strong>25</strong>.1). Current fishing<br />
mortality levels (F 2007 /F MSY = 1.16) indicate<br />
that the stock remains assessed as subject to<br />
overfishing. The SC agreed that the stock will<br />
move to an overfished state in the near future<br />
unless fishing mortality is reduced. The IOTC<br />
SC recommended that catches should not<br />
exceed 300 000 t in 2010.<br />
reliability of the assessment/s<br />
The reliability of estimates of the total catch<br />
has continued to improve over the past few<br />
years, <strong>and</strong> the IOTC has conducted several<br />
reviews of the nominal catch databases. This<br />
has led to marked increases in estimated<br />
catches of yellowfin tuna since the early 1970s.<br />
In 2009 new stock assessment areas were<br />
defined within the IOTC Convention Area, in<br />
order to obtain more homogeneously fished<br />
areas (IOTC 2010). New st<strong>and</strong>ardised CPUE<br />
series were calculated for both the Japanese<br />
(1960 to 2008) <strong>and</strong> Taiwanese longline (1989<br />
to 2008) fleets in each area. However, the two<br />
CPUE histories showed divergent trends; the<br />
Japanese CPUE series showed a marked steady<br />
decline, whereas the Taiwanese CPUE series<br />
has been stable over the past 30 years in most<br />
areas. Both CPUE series show a decline in<br />
most areas since 2006 (IOTC 2010).<br />
The apparent disagreement between the<br />
estimated value of MSY (around 300 000 t)<br />
<strong>and</strong> the long-term average yearly catches<br />
obtained from this stock from 1992 to 2002<br />
(337 398 t) might also indicate that further<br />
refinements are needed in the application<br />
of the model to this stock. However, as the<br />
model appears to indicate, it is also possible<br />
that current estimates of MSY are lower than<br />
expected due to recent high catches having<br />
affected the recruitment capacity of the stock<br />
(IOTC 2010).<br />
The current diagnosis of stock status<br />
is considered more realistic than previous<br />
assessments. However, uncertainties remain.<br />
For instance, detailed results (on recruitment,<br />
spatial distribution, movement patterns <strong>and</strong><br />
chapter <strong>25</strong> <strong>Western</strong> <strong>Tuna</strong> <strong>and</strong> <strong>Billfish</strong> <strong>Fishery</strong> 453
fishing mortalities) obtained for some of the<br />
individually modelled areas within the Indian<br />
Ocean do not realistically account for the<br />
known spatial dynamics of this stock (IOTC<br />
2010).<br />
previous assessment/s<br />
In 2003 the IOTC found that there had been<br />
a steady increase in fishing mortality on<br />
yellowfin tuna since 1980, accompanied by<br />
a substantial decline in biomass in the mid-<br />
1980s. Catchability in the purse-seine fishery<br />
had increased, possibly as a result of the use of<br />
drifting fish-aggregating devices. The updated<br />
assessment in 2005 concluded that catch levels<br />
between 1992 <strong>and</strong> 2002 had been near the<br />
level that would produce the MSY <strong>and</strong> that<br />
fishing mortality should not be allowed to<br />
increase. It was noted that continued purseseining<br />
on fish-aggregating devices would<br />
likely increase the mortality of juvenile<br />
yellowfin tuna <strong>and</strong> further reduce the stock<br />
biomass. Catches from 2003 to 2006 were well<br />
above those levels, <strong>and</strong> it was considered that<br />
such harvest rates would not be sustainable<br />
unless supported by very high recruitment.<br />
A further assessment was undertaken in<br />
2007, based on several modelling approaches<br />
(IOTC 2008). Despite differences in the<br />
modelling, it was concluded that fishing levels<br />
had continued to exceed MSY levels. Model<br />
estimates of MSY ranged from 271 000 t to<br />
360 000 t. High catches from 2003 to 2006<br />
(average 461 <strong>25</strong>0 t) constitute overfishing.<br />
In 2008 the IOTC assessment of the<br />
yellowfin tuna stock in the Indian Ocean<br />
indicated that estimates of total <strong>and</strong> spawning<br />
stock biomass were above or just below their<br />
respective MSY-based reference points;<br />
B2007/BMSY ranged from 1.13 to 0.93 <strong>and</strong><br />
SB2007/SBMSY ranged from 1.18 to 0.61,<br />
indicating that the stock was close to an<br />
overfished state. Fishing mortality estimates<br />
for 2007 were above their respective<br />
MSY-based reference points for all but<br />
one of the assessments examined; F2007/FMSY ratios ranged from 0.9 to 1.60, indicating<br />
that overfishing was occurring. The degree<br />
of overfishing was somewhat lower than that<br />
estimated to have occurred during 2003 to<br />
454 <strong>Fishery</strong> status reports 2 009<br />
2006; the F 2003–2006/F MSY ratio ranged from<br />
1.22 to 1.75 (IOTC 2008). The 2008 stock<br />
assessments indicated that recruitment has<br />
declined in recent years. Reliable estimates<br />
of MSY ranged between <strong>25</strong>0 000 t <strong>and</strong><br />
300 000 t. The IOTC suggested that the<br />
2007 catch of 319 434 t may have been<br />
above the MSY, <strong>and</strong> annual catches from<br />
2003 to 2006 were substantially higher.<br />
Future assessment needs<br />
It remains uncertain whether longline catch<br />
rates in <strong>and</strong> near the AFZ are affected by<br />
broader Indian Ocean longlining, by intensive<br />
western Indian Ocean purse-seining, or by<br />
artisanal fisheries operating throughout the<br />
Indian Ocean. Because management decisions<br />
are complicated by uncertainties in the<br />
degree of stock mixing between the WTBF<br />
<strong>and</strong> broader regions (Table <strong>25</strong>.10), research<br />
is required to determine the level of mixing.<br />
Unloading catch, Fremantle PHOTO: JACQUI COOK,<br />
CSIRO
The results from the IOTC assessment in<br />
2009 again demonstrated the value of tagging<br />
information for assessment purposes (IOTC<br />
2010). The value of this source of information<br />
is likely to increase over time as more tags are<br />
returned from a wider area <strong>and</strong> for older fish.<br />
<strong>25</strong>.5 economic status<br />
economic performance<br />
In 2003 the <strong>Australian</strong> Bureau of Agricultural<br />
<strong>and</strong> Resource Economics (ABARE) conducted<br />
an economic survey of the WTBF (Galeano<br />
et al. 2004). Estimates of financial <strong>and</strong><br />
economic performance were compiled for<br />
the 2001–02 financial year <strong>and</strong> can be used<br />
with other indicators to evaluate the likely<br />
economic performance of the fishery in<br />
2008–09. Estimates of latent effort in the<br />
fishery are also available for recent years.<br />
latency<br />
In 2009, 96 permits (93 fishing <strong>and</strong> 3 carrier<br />
vessel permits) were issued for the WTBF.<br />
In 2004, 13 longline vessels fished in the<br />
WTBF <strong>and</strong>, in every financial year since<br />
then, fewer than five vessels have operated<br />
(Fig. <strong>25</strong>.2). This substantial degree of latent<br />
effort indicates that net economic returns<br />
(NER) from fishing are low in absolute terms.<br />
net economic returns<br />
Real NER in 2001–02 were $1.9 million (in<br />
2008–09 dollars). This is very low, given that<br />
43 <strong>and</strong> 40 vessels operated in the fishery in<br />
2001 <strong>and</strong> 2002, respectively. Low NER were<br />
partly caused by a significant increase in<br />
fishing power as the fishery grew in the late<br />
1990s <strong>and</strong> many new, large vessels entered<br />
the fishery. Since latent effort in the fishery<br />
remained high <strong>and</strong> the previous estimates of<br />
the fishery’s NER for 2001–02 were low, it is<br />
expected that NER were also low in 2008–09.<br />
overall economic status<br />
Although ABARE estimates show that a small,<br />
positive NER was earned in 2000–01, declines<br />
in catches, fish prices <strong>and</strong>, consequently,<br />
fishing receipts between 2001–02 <strong>and</strong> 2004<br />
were likely to have had negative impacts on<br />
NER. The large declines in vessel participation<br />
since 2004 also indicate that the returns<br />
from the fishery have been low in recent<br />
years. In 2009, latent effort remained high,<br />
suggesting that NER were likely to have been<br />
substantially lower in 2009 than in 2001–02.<br />
future considerations<br />
The introduction of quota management<br />
is likely to make it easier for fishers to<br />
rationalise their fishing operations. Fishers<br />
will only be able to trade entire permits<br />
rather than smaller shares of the fishery’s<br />
catch. However, the degree to which SFR<br />
holders have an incentive to trade quota<br />
SFRs (permanently or temporarily) will be<br />
influenced by the individual species TACs set<br />
under the new management arrangements.<br />
The proposed TACs are substantially higher<br />
than historical catches <strong>and</strong> so will provide<br />
minimal incentive for trade. Additionally,<br />
if economic conditions in the fishery were<br />
to suddenly improve, a rapid increase in<br />
effort could eventuate, putting positive<br />
returns <strong>and</strong> stock sustainability at risk. The<br />
proposed TACs have been set at high levels<br />
to allow for a potential increase in fishing<br />
in the high seas; however, setting spatial<br />
TACs so that catches in the high seas can be<br />
managed separately from catches in domestic<br />
waters may be a more effective approach.<br />
2 5 . 6 e n v i r o n m e n ta l<br />
status<br />
<strong>Fishery</strong> management in the WTBF has<br />
historically been complicated by fishers<br />
operating in different biogeographical regions<br />
<strong>and</strong> catching a different suite of byproduct<br />
<strong>and</strong> bycatch species. Future assessment of<br />
environmental impacts of the fishery will<br />
chapter <strong>25</strong> <strong>Western</strong> <strong>Tuna</strong> <strong>and</strong> <strong>Billfish</strong> <strong>Fishery</strong> 455
equire detailed information from each<br />
biogeographical region. The overall impact<br />
of fishing on byproduct <strong>and</strong> bycatch species<br />
across the Indian Ocean is poorly known.<br />
As a result, both Australia <strong>and</strong> the IOTC<br />
consider that improving the underst<strong>and</strong>ing of<br />
the status of byproduct <strong>and</strong> bycatch species<br />
is a high priority. In response to bycatch<br />
concerns, AFMA formulated the <strong>Australian</strong><br />
<strong>Tuna</strong> <strong>and</strong> <strong>Billfish</strong> Longline Fisheries Bycatch<br />
<strong>and</strong> Discarding Workplan, which commenced<br />
in 2008 <strong>and</strong> covers from 1 November 2008<br />
to 31 October 2010 (AFMA 2008). The<br />
objective of the plan is to develop a longer<br />
term strategy for overall minimisation of<br />
bycatch. The workplan focuses on developing<br />
management responses to high ecological risks<br />
<strong>and</strong> measures to avoid fishery interactions<br />
with species listed under the EPBC Act.<br />
ecological risk assessment<br />
AFMA, in conjunction with the<br />
Commonwealth Scientific <strong>and</strong> Industrial<br />
Research Organisation (CSIRO) has<br />
undertaken three levels of ecological risk<br />
assessment (ERA) for the WTBF (Table <strong>25</strong>.2).<br />
By assessing the impacts of fishing on<br />
all parts of the marine environment, the<br />
ERAs take an ecosystem-based assessment<br />
approach. The aim of the ERA process is<br />
to help prioritise research, data collection,<br />
monitoring needs, <strong>and</strong> management actions<br />
for fisheries, <strong>and</strong> ensure that they are managed<br />
both sustainably <strong>and</strong> efficiently. In a report<br />
to DEWHA in relation to the export approval<br />
of the WTBF under the EPBC Act, AFMA<br />
(2009b) indicated that it had commissioned<br />
the CSIRO to conduct a comprehensive, rapid,<br />
quantitative assessment of the risk from fishing<br />
to the sustainability of all chondrichthyan<br />
<strong>and</strong> teleost species. The project extended<br />
the methodology of the previous Level 2<br />
Productivity Susceptibility Analysis (Webb<br />
et al. 2007) to provide quantitative estimates<br />
of risk for a large number of fish species.<br />
Classifications of risk were divided into low,<br />
medium, high <strong>and</strong> extreme high; each category<br />
had a corresponding precautionary criterion to<br />
take into account uncertainty.<br />
456 <strong>Fishery</strong> status reports 2 009<br />
The project examined 187 fish species<br />
in the WTBF (38 chondrichthyans <strong>and</strong> 149<br />
teleosts). No species were classified as at risk<br />
of potential overfishing (AFMA 2009b). The<br />
results of the Level 3 assessment (Zhou et al.<br />
2009) will be combined with the results of<br />
the residual risk assessment (AFMA 2009a)<br />
<strong>and</strong> addressed through environmental risk<br />
management strategies. These strategies<br />
include a chondrichthyan working group <strong>and</strong><br />
the <strong>Australian</strong> <strong>Tuna</strong> <strong>and</strong> <strong>Billfish</strong> Longline<br />
Fisheries Bycatch <strong>and</strong> Discarding Workplan.<br />
AFMA has indicated that these will be<br />
implemented <strong>and</strong> reviewed over the coming<br />
years. Given the connectivity of stocks beyond<br />
the AFZ, the final strategy will need to take<br />
into account broader Indian Ocean issues.<br />
habitats<br />
No habitats or communities were identified<br />
by the ERA process as being at high risk from<br />
the effects of pelagic longline fishing (AFMA<br />
2009).<br />
threatened, endangered <strong>and</strong><br />
protected species<br />
In 2009 a single humpback whale was reported<br />
as being entangled by longline gear (mainline).<br />
The mainline was removed from the tail <strong>and</strong><br />
the whale released in good condition.<br />
sharks<br />
In 2009 there were no interactions with<br />
threatened, endangered or protected<br />
sharks reported in logbooks.<br />
marine turtles<br />
Catches of turtles have been recorded in<br />
WTBF logbooks, although interaction<br />
rates are low. In 2009 a total of 10 marine<br />
turtle interactions (six leatherback turtles,<br />
two loggerhead turtles <strong>and</strong> two hawksbill<br />
turtles) were reported in logbooks in<br />
the WTBF. All were released alive.
seabirds<br />
The non-target group at highest risk from the<br />
fishery is seabirds. This risk is being addressed<br />
through a combination of the threat abatement<br />
plan (TAP) (AAD 2006), AFMA requirements<br />
<strong>and</strong>, when fishers operate in the IOTC area,<br />
Resolution 10/06 of the IOTC. The collective<br />
requirements are for all longline operators<br />
fishing south of <strong>25</strong>ºS to use an approved ‘tori’<br />
line, to set their longlines only at night, not<br />
to discharge offal during line setting <strong>and</strong><br />
hauling, <strong>and</strong> use of line weighting <strong>and</strong> thawed<br />
baits. There is a total ban on offal discharge<br />
throughout the fishery. A pilot observer<br />
program indicated that seabird bycatch rates<br />
in the WTBF were below the TAP target of<br />
0.05 birds per 1000 hooks. The WTBF has<br />
not exceeded the agreed seabird bycatch<br />
limit since 2006, when the revised TAP was<br />
implemented (AFMA 2008). In 2009 a single<br />
seabird interaction was reported in logbooks<br />
in the WTBF (yellownosed albatross–dead).<br />
2 5 . 7 h a r v e s t s t r at e g y<br />
perFormance<br />
The HS framework developed for the WTBF<br />
has not yet been implemented, due to the<br />
limited effort in the fishery in recent years.<br />
AFMA has indicated that the framework<br />
will be used to develop a complete HS, to<br />
be implemented once effort increases in<br />
the fishery. Before the HS is implemented,<br />
appropriate control rules <strong>and</strong> target <strong>and</strong> limit<br />
reference points will need to be determined.<br />
Although individual transferable quotas<br />
have been identified as the preferred method<br />
of control, the limited data available from<br />
the fishery <strong>and</strong> the regional extent of the key<br />
stocks present problems for the estimation of<br />
scientifically robust TACs. Management of<br />
the fishery should be adaptive, allowing for<br />
upward or downward adjustment of TACs<br />
when new information becomes available.<br />
For this reason, development of biological<br />
reference points <strong>and</strong> control rules must<br />
continue to be a major consideration in the<br />
development of the HS for the fishery.<br />
Yellow-nosed albatross PHOTO: MIKE GERNER, AFMA<br />
<strong>25</strong>.8 literature cited<br />
AAD (<strong>Australian</strong> Antarctic Division) 2006,<br />
Threat abatement plan, for the incidental<br />
catch (or bycatch) of seabirds during<br />
oceanic longline fishing operations, AAD,<br />
Kingston.<br />
AFMA (<strong>Australian</strong> Fisheries Management<br />
Authority) 2008, Australia’s <strong>Tuna</strong> <strong>and</strong><br />
<strong>Billfish</strong> Longline Fisheries, Bycatch <strong>and</strong><br />
Discarding Workplan, November 1, 2008 to<br />
October 31, 2010, AFMA, Canberra.<br />
——2009a Residual risk assessment of the<br />
level 2 ecological risk assessment species<br />
results report for the <strong>Western</strong> <strong>Tuna</strong> <strong>and</strong><br />
<strong>Billfish</strong> <strong>Fishery</strong>, November 2009, AFMA,<br />
Canberra.<br />
——2009b, <strong>Western</strong> <strong>Tuna</strong> <strong>and</strong> <strong>Billfish</strong> <strong>Fishery</strong>,<br />
August 2009, report to DEWHA & AFMA,<br />
Canberra, .<br />
Bromhead, D, Pepperell, J, Wise, B & Findlay,<br />
J 2004, Striped marlin: biology <strong>and</strong><br />
fisheries, BRS, Canberra.<br />
DAFF (Department of Agriculture, Fisheries<br />
<strong>and</strong> Forestry) 2005, <strong>Western</strong> <strong>Tuna</strong> <strong>and</strong><br />
<strong>Billfish</strong> Management Plan 2005, DAFF,<br />
Canberra, Federal Register of Legislative<br />
Instruments F2006C00722.<br />
chapter <strong>25</strong> <strong>Western</strong> <strong>Tuna</strong> <strong>and</strong> <strong>Billfish</strong> <strong>Fishery</strong> 457
——2007, Commonwealth Fisheries Harvest<br />
Strategy: policy <strong>and</strong> guidelines, DAFF,<br />
Canberra.<br />
Davies, C, Campbell, R, Prince, J, Dowling, N,<br />
Kolody, D, Basson, M, McLoughlin, K,<br />
Ward, P, Freeman, I & Bodsworth, A 2008,<br />
Development <strong>and</strong> preliminary testing of the<br />
harvest strategy framework for the <strong>Western</strong><br />
<strong>Tuna</strong> <strong>and</strong> <strong>Billfish</strong> <strong>Fishery</strong>, CSIRO, Hobart.<br />
Dowling, N, Peel, S & Basson, M 2005, Data<br />
summary for the Southern <strong>and</strong> <strong>Western</strong><br />
<strong>Tuna</strong> <strong>and</strong> <strong>Billfish</strong> <strong>Fishery</strong>, CSIRO Marine<br />
Research, Hobart.<br />
Froese, R, & Pauly, DE 2009. FishBase,<br />
version 02/2009, FishBase Consortium,<br />
.<br />
Galeano, D, Langenkamp, D, Shafron, W &<br />
Levantis, C 2004, <strong>Australian</strong> fisheries<br />
surveys report 2003, ABARE, Canberra.<br />
Griffiths, SP, in press, ‘Stock assessment <strong>and</strong><br />
efficacy of size limits on longtail tuna<br />
(Thunnus tonggol) caught in <strong>Australian</strong><br />
waters’, Fisheries Research,<br />
.<br />
——Fry, GC, Manson, FJ & Lou, D 2010,<br />
‘Age <strong>and</strong> growth of longtail tuna (Thunnus<br />
tonggol) in tropical <strong>and</strong> temperate water of<br />
the central Indo-Pacific’, ICES Journal of<br />
Marine Science, vol. 67, pp. 1<strong>25</strong>–34.<br />
IOTC (Indian Ocean <strong>Tuna</strong> Commission) 2008,<br />
Report of the tenth session of the scientific<br />
committee, Seychelles, 5–9 November<br />
2007, IOTC-2007-SC-R[E].<br />
——2009, Report of the eleventh session of the<br />
scientific committee, Seychelles,<br />
1–5 December 2008, IOTC-2008-SC-R[E].<br />
——2010, Report of the twelfth session of the<br />
scientific committee, Seychelles, 30<br />
November–4 December 2009, IOTC-2009-<br />
SC-R[E].<br />
——WPB 2009, Report of the seventh session<br />
of the IOTC working party on billfish,<br />
Seychelles, 6–10 July 2009, IOTC-2009-<br />
WPB-R[E].<br />
458 <strong>Fishery</strong> status reports 2 009<br />
Kolody D 2009, An exploratory “stock<br />
synthesis’ assessment of the Indian Ocean<br />
swordfish fishery 1950–2007, Seychelles,<br />
6–10 July 2009, IOTC-2009-WPB-10.<br />
Poisson, F & Fauvel, C 2009, ‘Reproductive<br />
dynamics of swordfish (Xiphias gladius) in<br />
the southwestern Indian Ocean (Reunion<br />
Isl<strong>and</strong>), part 1, Oocyte development, sexual<br />
maturity <strong>and</strong> spawning’, Aquatic Living<br />
<strong>Resources</strong>, vol. 22, pp. 45–58.<br />
Webb, H, Bulman, C, Sporcic, M, Dowdney, J,<br />
Fuller, M, Smith, T & Hobday, A 2007,<br />
Ecological risk assessment for the effects of<br />
fishing: report for the <strong>Western</strong> <strong>Tuna</strong> <strong>and</strong><br />
<strong>Billfish</strong> sub-<strong>Fishery</strong>, AFMA, Canberra.<br />
Zhou, S, Fuller, M & Smith, T 2009, Rapid<br />
quantitative assessment for fish species in<br />
seven Commonwealth fisheries, CSIRO<br />
Marine Research, Hobart.<br />
Live bait on hooks PHOTO: AFMA